Article

Livelihoods and Perceptions of Climate Change among Dairy Farmers in the Andes: Implications for Climate Education

1
Facultad de Ciencias Pecuarias y Biológicas, Universidad Técnica Estatal de Quevedo (UTEQ), Quevedo Av. Quito km, 1 1/2 Vía a Santo Domingo de los Tsáchilas, Quevedo 120550, Ecuador
2
Departamento de Métodos Cuantitativos y Sistemas de Información, Facultad de Agronomía, Universidad de Buenos Aires, Buenos Aires 1417, Argentina
3
Facultad de Ciencias Exactas, Universidad de las Fuerzas Armadas ESPE Sede Latacunga, Latacunga 050102, Ecuador
4
School of Agricultural and Environmental Sciences, Pontificia Universidad Católica del Ecuador—Ibarra (PUCESI), Imbabura 100112, Ecuador
5
Cátedra de Producción Lechera, Departamento de Producción Animal, Facultad de Agronomía, Universidad de Buenos Aires, Buenos Aires 1417, Argentina
6
Facultad de Ciencias Jurídicas, Sociales y de la Educación, Universidad Técnica de Babahoyo, Extensión Quevedo (UTB), Km 3 1/2 Vía a Valencia, Los Ríos 120550, Ecuador
7
Faculty of Earth Sciences, Amazon State University (UEA), Pastaza 160101, Ecuador
8
Department of Earth Sciences and Construction, University of the Armed Forces ESPE, Av. General Rumiñahui S/N, Sangolquí 171103, Ecuador
9
Facultad de Ciencias de la Vida, Universidad Estatal Amazónica (UEA), Puyo 160101, Ecuador
10
Departamento de Producción Animal, Facultad de Ciencias Veterinarias, Universidad de Córdoba, 14071 Córdoba, Spain
*
Author to whom correspondence should be addressed.
Sustainability 2023, 15(17), 13157; https://doi.org/10.3390/su151713157
Submission received: 19 May 2023 / Revised: 26 June 2023 / Accepted: 4 July 2023 / Published: 1 September 2023
(This article belongs to the Special Issue Climate Change Mitigation and Adaptation in Sustainable Agriculture)

Abstract

:
Climate change mainly affects the production and consumption systems associated with food, livelihoods, production (e.g., reduced milk production), water, and land use. The role of local knowledge is recognized as important for decision-making under changing circumstances. This study was conducted in the northern part of the Ecuadorian Andes using a sample of 170 dairy-cattle-farming households. The objectives were to: (i) characterize the rural livelihoods of dairy cattle farmers; (ii) evaluate access to climate information and perceptions of climate change; and (iii) determine the relationship between livelihoods and perceptions of climate change. Significant differences were identified between the groups evaluated in relation to the dairy farmers’ livelihoods. In addition, 85.29% of the respondents indicated that climate information is important, but 67.83% did not trust the sources of information. It was found that there is a significant relationship between the level of education and age with the variables of climate change perceptions. This combined knowledge will allow people to promote agri-environmental and educational policies to achieve climate literacy at a rural level.

1. Introduction

Livestock in developing countries are heterogeneous and dynamic and are undergoing dramatic changes [1]. So far, the interactions of these drivers and the magnitude of the impact on livestock production are not well understood [1,2]. Several authors demonstrated a knowledge gap regarding perceptions of climate change (CC) and its relationship with livelihoods in different production systems [2,3,4,5]. Livelihoods are defined as “the capabilities, assets (stores, resources, claims and access) and activities necessary to earn a living” [6]. Livelihoods have multiple complex, non-linear interactions, but four relationships illustrate the path of sustainable livelihoods [7]: the vulnerability between livelihoods (human, natural, financial, social and physical capital); assets; structures; and the transformative processes, policies and institutions that have an impact on livelihood strategies and the relationship ends with livelihood outcomes [7].
This article focuses on vulnerability, specifically on perceptions of CC and its potential relationship with the livelihoods of livestock producers. Poor smallholders tend to be the most vulnerable to CC due to their reliance on agriculture, their small holdings, and their lack of assets and savings [8]. Livestock are an important source of income and an asset [9]. Livestock have been shown to be more resilient to the effects of CC compared to agriculture [10]. Therefore, households are likely to engage in livestock production to maintain savings and insure against shocks, trends, and seasonality [11]. Extreme climate variability was proven to negatively impact rural production, decreasing costs and the resources available for investment in subsistence activities [12,13].
Smallholder farmers in the Andean region of South America are expected to be the most affected by CC [14], due to the significant loss in productivity and ecosystem degradation expected by 2050 [14]. Models from the Intergovernmental Panel on Climate Change (IPCC) indicate a significant impact on water management systems, food, and energy security [13,14] and show changes in the frequency, intensity, and duration of extreme weather [12,13]. From 1901 to 2012, temperatures increased by between 0.5 and 3 °C, with an average warming of almost 0.1 °C per decade [13,15]. Alterations are evident in tropical regions such as the Andes [13,15,16] and are potentially irreversible for natural and human systems [17]. These include increased evaporation, drier soils, less productive crops and pastures [18], and an increased proliferation and frequency of diseases in production systems [19,20].
In 1992, the United Nations Framework Convention on Climate Change (UNFCCC) declared that: “Education is an essential element in mounting an adequate global response to CC” [21]. Solutions to CC tend to focus on mitigation and adaptation measures, but successful implementation requires a well-informed and educated society. The interest in education and CC has increased in recent years [22], due to the efforts of the United Nations Educational, Scientific and Cultural Organization (UNESCO) that continue to advocate for educational programs to respond to CC [23]. Mainstreaming CC education into all formal or informal education systems can be one of the most important and effective means of building capacity to address the climate crisis. This is due to its multiplier effects, where families and communities benefit when people share what they have learned [24].
Within this context, the objectives were to: (a) characterize the rural livelihoods of dairy farmers using capital theory; (b) assess the acquisition of climate information and CC perceptions; and (c) determine the relationship between livelihoods and CC perceptions. Finally, the paper concludes with potential agri-environmental and educational policy implications to support the Nationally Determined Contributions (NDCs) and the Paris Agreement’s central goal of limiting global warming to less than 2 °C.

2. Materials and Methods

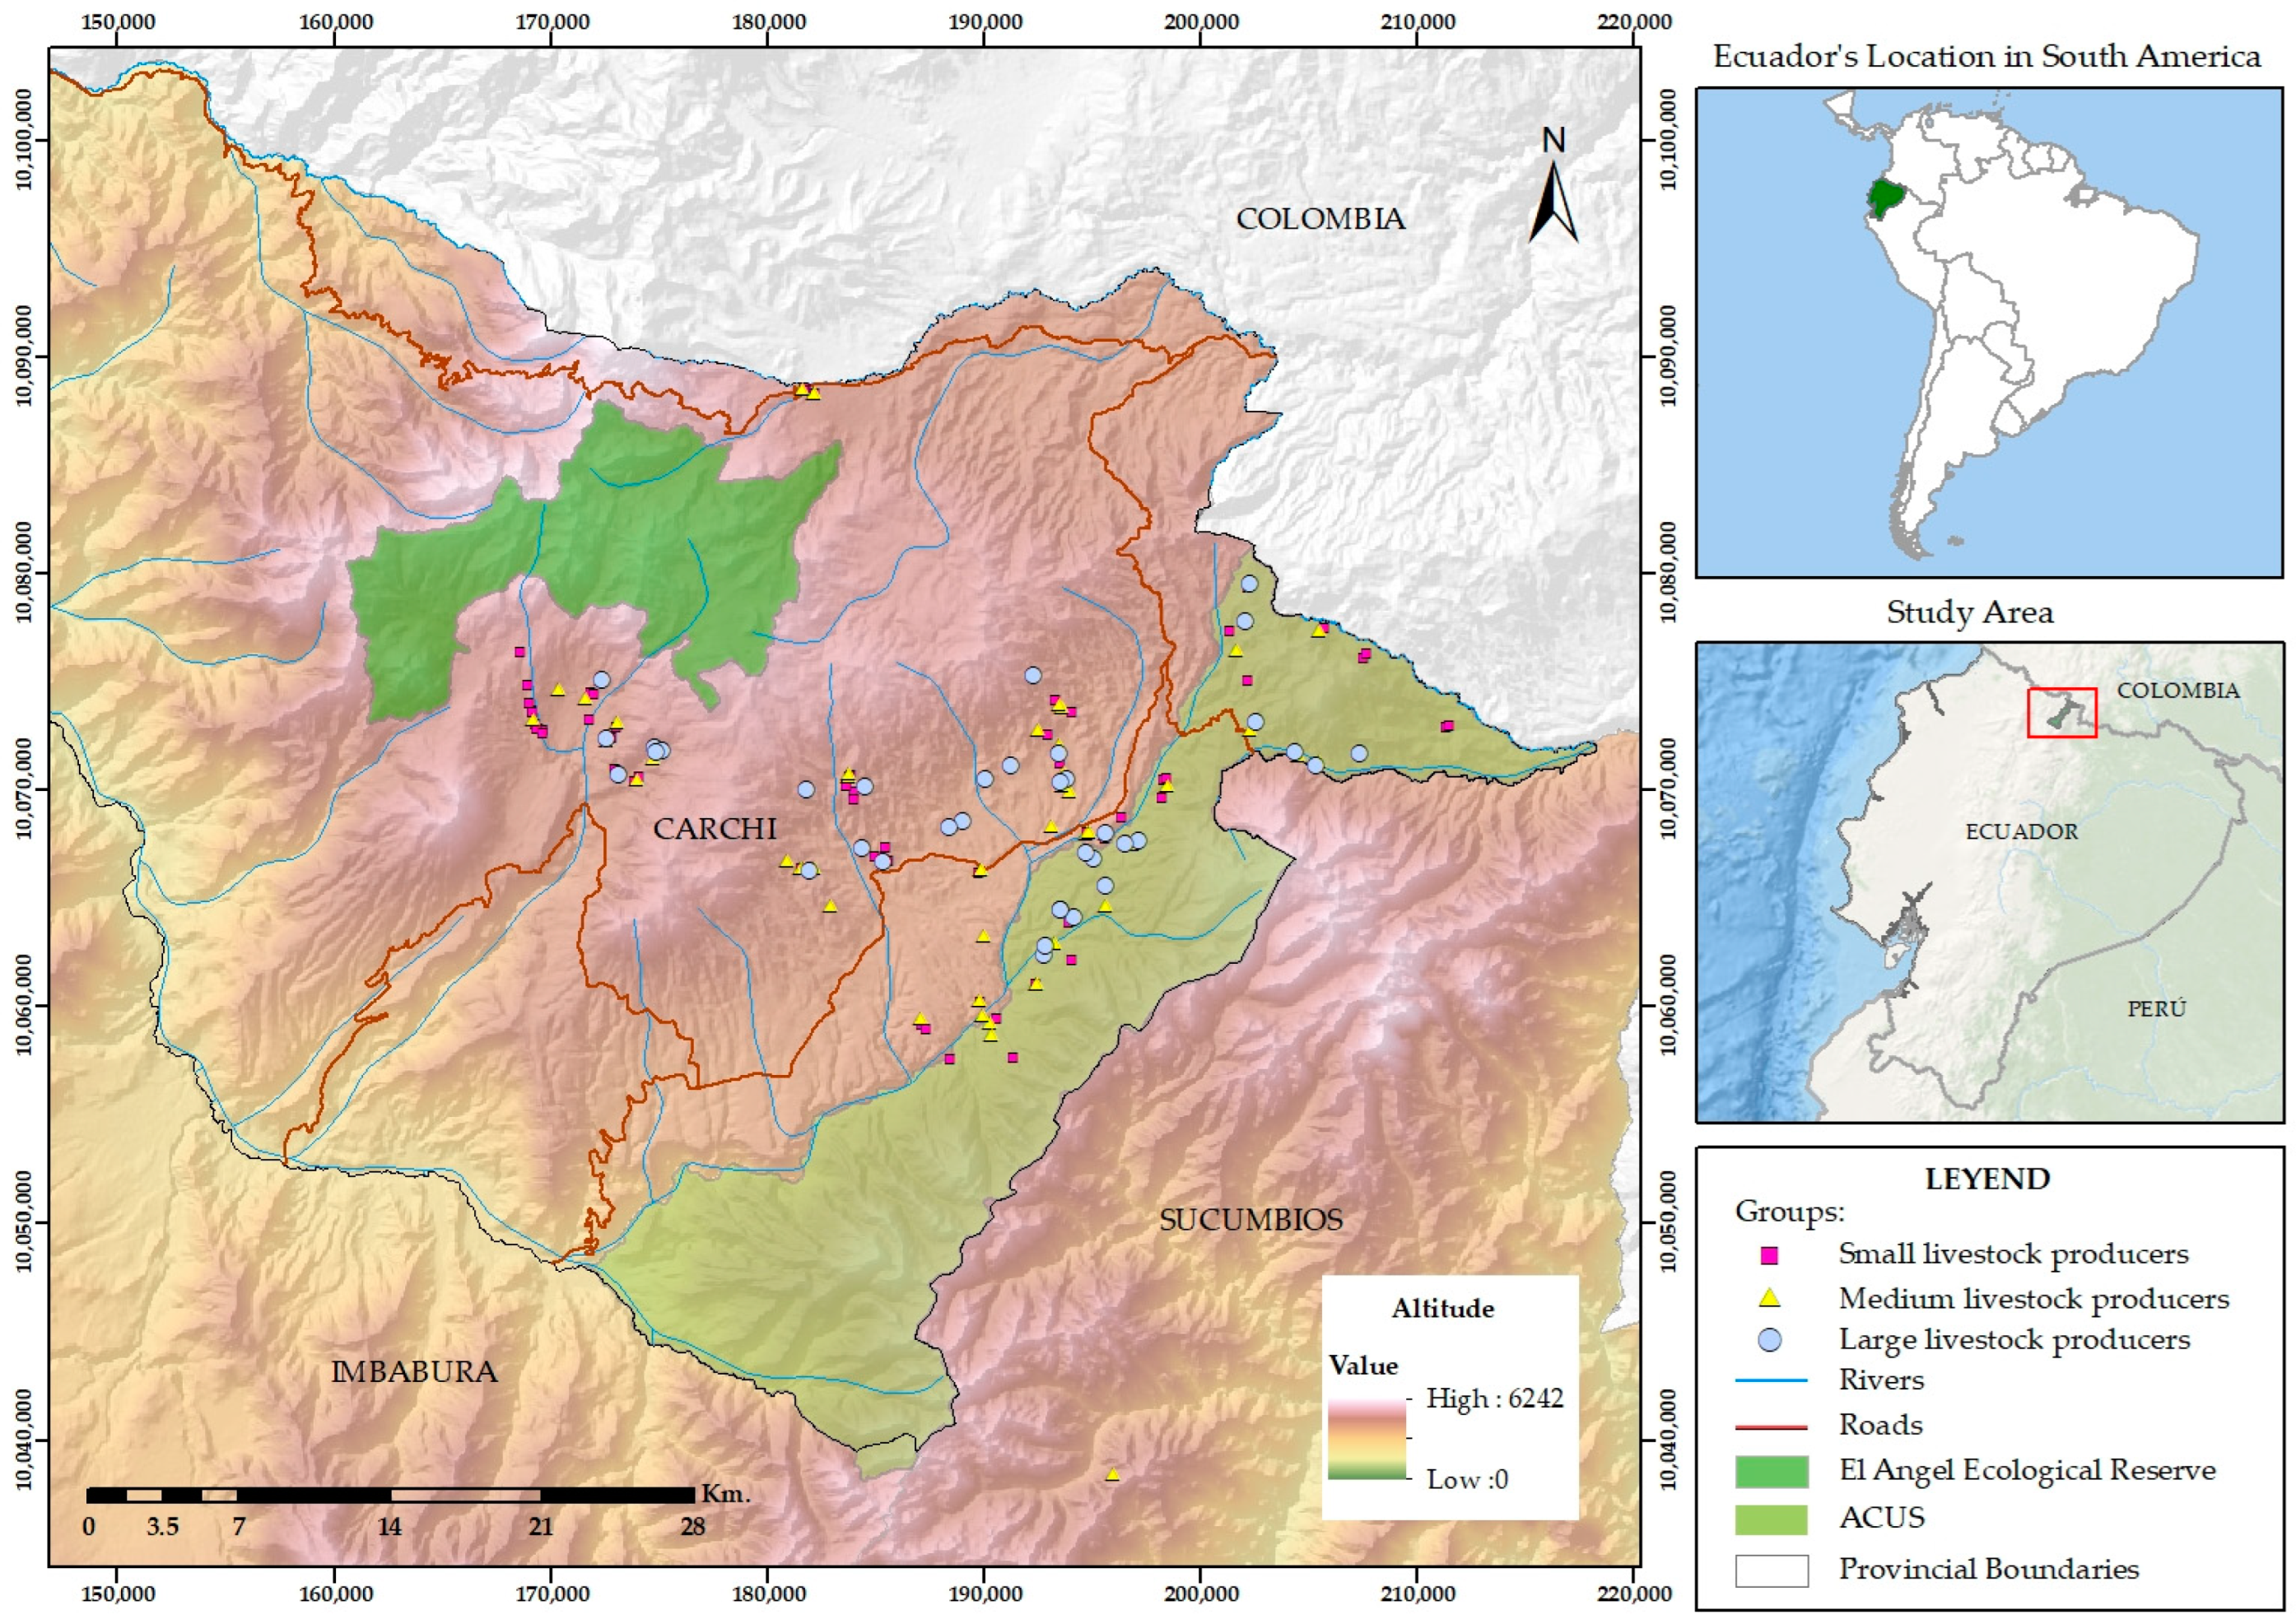
2.1. Geographic Location

The study area is found in the northern Andes of Ecuador, in a landscape that combines productive systems and conservation ecosystems. It is located between: (1) the Area of Conservation and Sustainable Use (ACUS for its Spanish acronym), created in 2016 to protect water sources, paramos, and forests, which has an area of 175.6 km2 and belongs to the Mira River watershed [25] and (2) the El Angel Ecological Reserve, which has an area of 164.51 km2 and was created in 1992, forming part of the Ecuadorian System of Protected Areas, whose objective is to conserve mainly the Hesperian paramos (Figure 1).
The existing ecosystems in the landscape are paramo grassland (Hesperian) (RsSn01), the high montane evergreen forest of the Western Andes Cordillera (BsAn03), the high montane evergreen forest of the northern part of the Western Andes Cordillera (BsAn01), and paramo grassland (HsSn02) [26]. The productive-conservationist landscape is located in the province of Carchi, an area of great importance for dairy milk production in the Andean region [27].

2.2. Sampling and Data Collection

The research project involved 170 dairy farmer households, divided into three groups of producers: 78 small (less than 6 ha), 55 medium (between 6 and 10 ha), and 37 large (greater than 11 ha). Data were collected through site visits and 65-min interviews with rural Mestizo farming heads of households that were held between January and February 2020.
The questionnaire had 38 questions adapted from the Poverty and Environment Network (PEN) template [28] and the questions were split into three sections: (1) Living conditions according to capital theory (human, social, natural, financial, and physical; 20 questions) (Table 1) [29,30,31]; (2) means of acquiring climate information (11 questions); and (3) perceptions of CC (7 questions) (Annex 1), with binomial response options (yes/no). Due to the difficulties in moving around in the productive-conservationist landscape, the sampling technique used was by non-probabilistic convenience with the following criteria: (i) dairy cattle producers with a farm extension of 1 to 40 ha; and that (ii) milk production must be carried out by Mestizos. Obtaining free and informed consent was achieved with the support of the Mestizo community leaders, through whom all households were approached. The surveys were conducted in accordance with the principles of ethical research [32], where the objectives, methodology, and schedule of the study were explained a priori to the heads of households of the dairy cattle groups.

2.3. Statistical Analysis Systems

The differences between the three groups of dairy farmers, in terms of the variables obtained from the survey, were analyzed with different tools according to the distributional characteristics of the response variables. In the case of the two-level categorical response variables (Yes or No), these were coded as 0 or 1, respectively, and a generalized linear model with binary distribution was fitted with producer groups as a fixed effect [33]. For the discrete quantitative response variables, the Kruskal–Wallis nonparametric test was used since they did not fit the Normal distribution. In the case of the Educational Level variable, the observed percentages were analyzed with the Chi-squared test to determine if there was homogeneity between the groups of producers. When significant differences were detected between groups, Fisher’s LSD test was used to determine those groups that differed significantly from each other. To measure the association between the different capital variables and the CC perception variables, Spearman’s correlation coefficients were calculated within each group of producers (small, medium, and large). Then, to visualize the associations graphically, a correspondence analysis [34] of the correlation matrix between the capital and perception variables was performed for each group. The resulting graph allowed us to detect positive and negative associations between the variables according to their closeness or remoteness in the ordering, respectively. An alpha significance level of 0.1 was used for all tests. The analyses were performed with the statistical program Infostat [35], and R software [36].

3. Results

3.1. Characterization of Dairy Farmers’ Livelihoods Using Capital Theory

3.1.1. Human and Social Capital

The average age of the head of the household was 48.22 years. In terms of gender, there was a trend (p ≤ 0.0847) between producer groups; on average, there were more men (60.66%) than women listed as heads of households (Table 2). In relation to the years of education of the heads of households, there were significant differences (p ≤ 0.0016) between groups of milk producers. The category of small-scale producers contained the highest number of heads of households who: (1) only received primary education; (2) attended a literacy program; and (3) had not received any level of education. Meanwhile, in the category of medium- and large-scale producers, there were heads of households with university educations (9.09% and 2.70%, respectively). As for years of experience in milk production across the categories of producers, there were no significant differences; but in the variable of off-farm or non-farm work, there were highly significant differences (p ≤ 0.0001). The relationship demonstrated that when the production area was larger, off-farm work was lower, which was contrary to the dynamics in small-scale producers, where the greatest work activity was off-farm among the categories studied. Regarding advice from community leaders, in the three categories of milk producers, 96.18% on average had not received any, while small-scale milk producers had received the most advice: 1.49% and 2.43% more than medium- and large-scale producers, respectively.

3.1.2. Natural Capital

There were significant differences (p ≤ 0.0001) in terms of natural capital among the evaluated variables and producer categories (Table 3). The total farm area of small-scale dairy farmers was 2.28 and 5.64 times smaller than medium- and large-scale farmers. In relation to pastures, the average area was 7.11, while the large-scale farmers had 6.45- and 2.71-times larger pasture areas than the small- and medium-scale farmers. With respect to crop area, the relationships were closer across the three categories of producers.

3.1.3. Physical Capital

It was evident that most of the farmers (an average of 96.91% (Table 4) in the three groups did not have motorized strimmers. Concerning the ownership of portable milking equipment, the large-scale farmers had 1.10 and 2.11 times more than the medium- and small-scale farmers. An average of 73.31% of the farmers owned manual spray pumps them; 23.08% of the small-scale farmers did not have manual spray pumps, at a ratio of 1.20 and 1.30 with respect to medium- and large-scale farmers. There were significant differences between the categories of farmers in relation to the following variables: the number of cows in production (p < 0.0001), number of bulls (p 0.0005), total herd (p < 0.0001), total milk production (liters per day) (p 0.0001), gross income from milk production (p < 0.0001), and average milk price (dollars per liter) (p < 0.0001). Large-scale farmers had between 2.33 and 4.50 times more cows in production than medium- and small-scale farmers, respectively. There were no significant differences between small- and medium-scale farmers in terms of the number of bulls and large-scale farmers had an average of 1.11; the average herd total was 10.05. With respect to total milk production (liters per day), small-scale farmers produced 6.55 and 3.00 times less than large- and medium-scale farmers, respectively. There were no significant differences between the average milk prices among small- and medium-scale farmers, while in the large-scale milk producers the cost was 0.40 dollars. Regarding the number of months that the cows were in production, there were no significant differences between the categories of farmers, and the average value was 7.13 months.

3.1.4. Financial Capital

In terms of financial capital (Table 4), there were no significant differences among the variables of those who received government welfare money and livestock insurance among the categories of farmers. The average number of dairy farmers who received welfare money was 6.90% and, in the three categories of farmers, it is evident that more than 90% did not receive livestock insurance.

3.2. Access to Climate Information

Of the 11 variables evaluated (Table 5), the variable “information on lunar phases is important” presented significant differences (p 0.0222) between the categories of producers—there was a similarity between small- and medium-scale producers as opposed to large-scale producers. With respect to receiving climate information, small-scale producers did not receive any, while 4.52% of medium- and large-scale producers did receive it. Eighty-five percent of the producers considered climate information to be important and there was an average difference of between 1% and 53.04% with respect to the producers who considered temperature and precipitation to be important or not important, respectively. As for obtaining information on the climate, 91% of the farmers did not employ ancestral knowledge, 56% of the farmers used almanacs or agricultural calendars, 29% used newspapers, radio, and television, and 98.45% did not consult media from government or non-governmental organizations. In global terms, 68% of the dairy farmers considered the sources of climate information to be reliable.

3.3. Perceptions of Climate Change

Regarding perceptions of CC (Table 6), of the seven variables evaluated, the variable “Does the farmer know that climate change means sudden weather changes?” presented significant differences (p 0.0283) between the categories of milk producers. It was identified that among medium- and large-scale producers, the results were similar to each other but different to small-scale milk producers. In general terms, only 73.69% of milk producers had heard about CC. In relation to the variables understood as being related to CC, 31.66% indicated an increase in temperature, while 60.17% and 73.74% considered that they were not related to extreme temperatures and a reduction in rainfall, respectively; 93.95% of the producers confirmed that CC is a serious problem for livestock, while 87.09% of the producers indicated that production activities are responsible for CC.

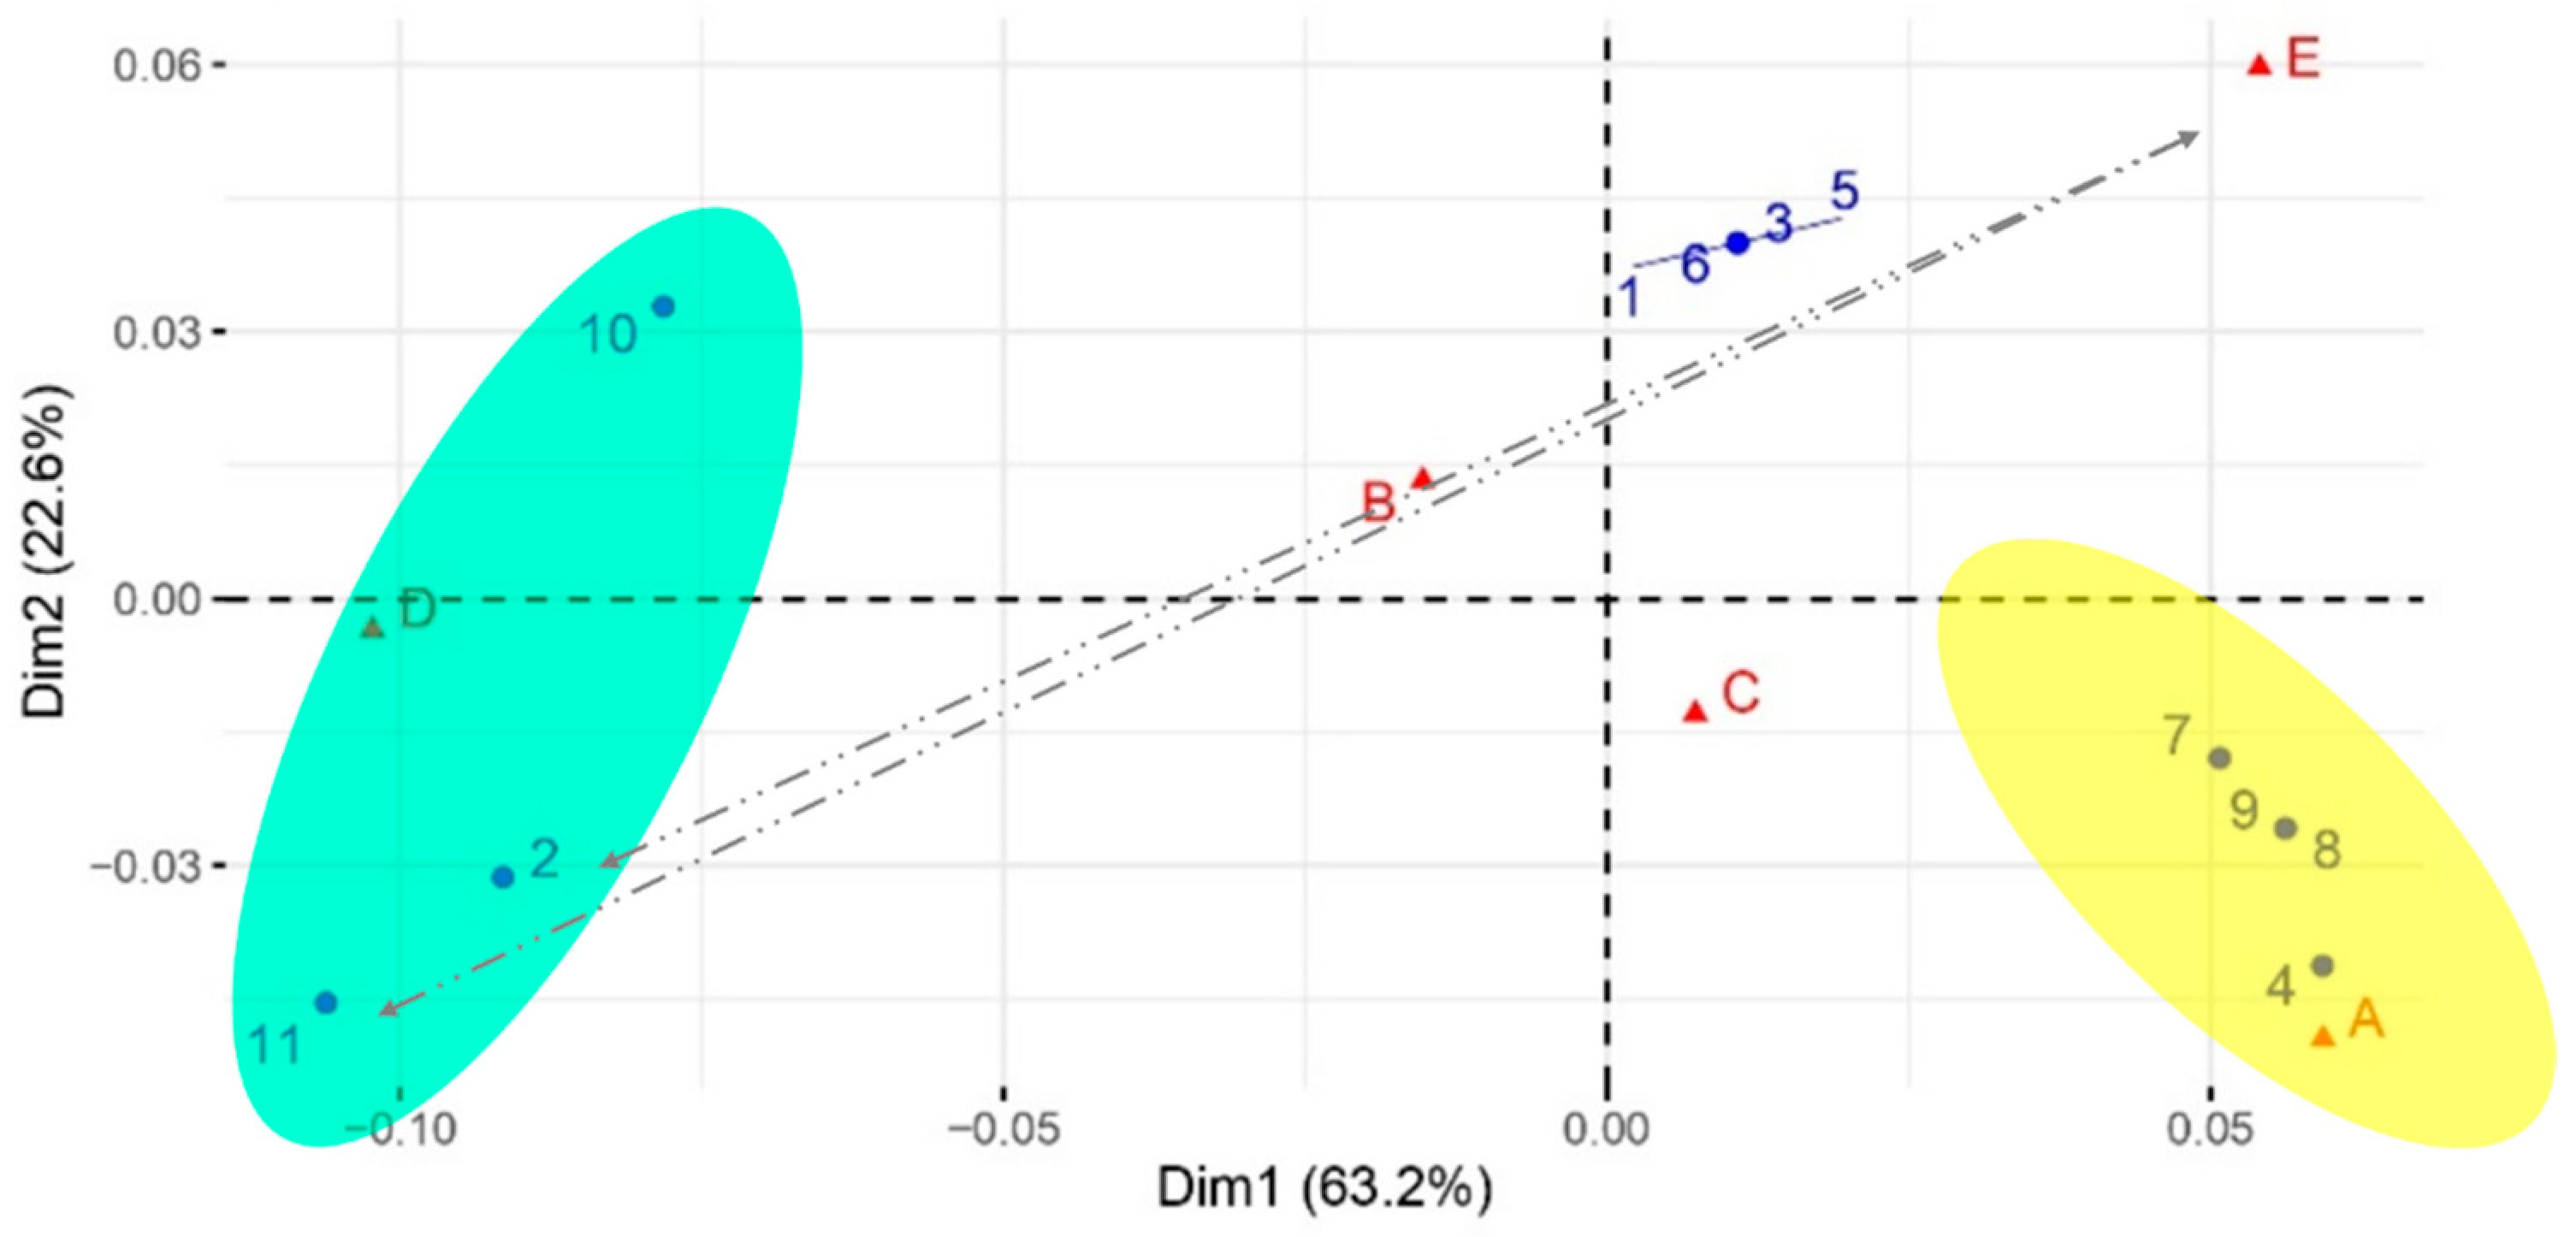
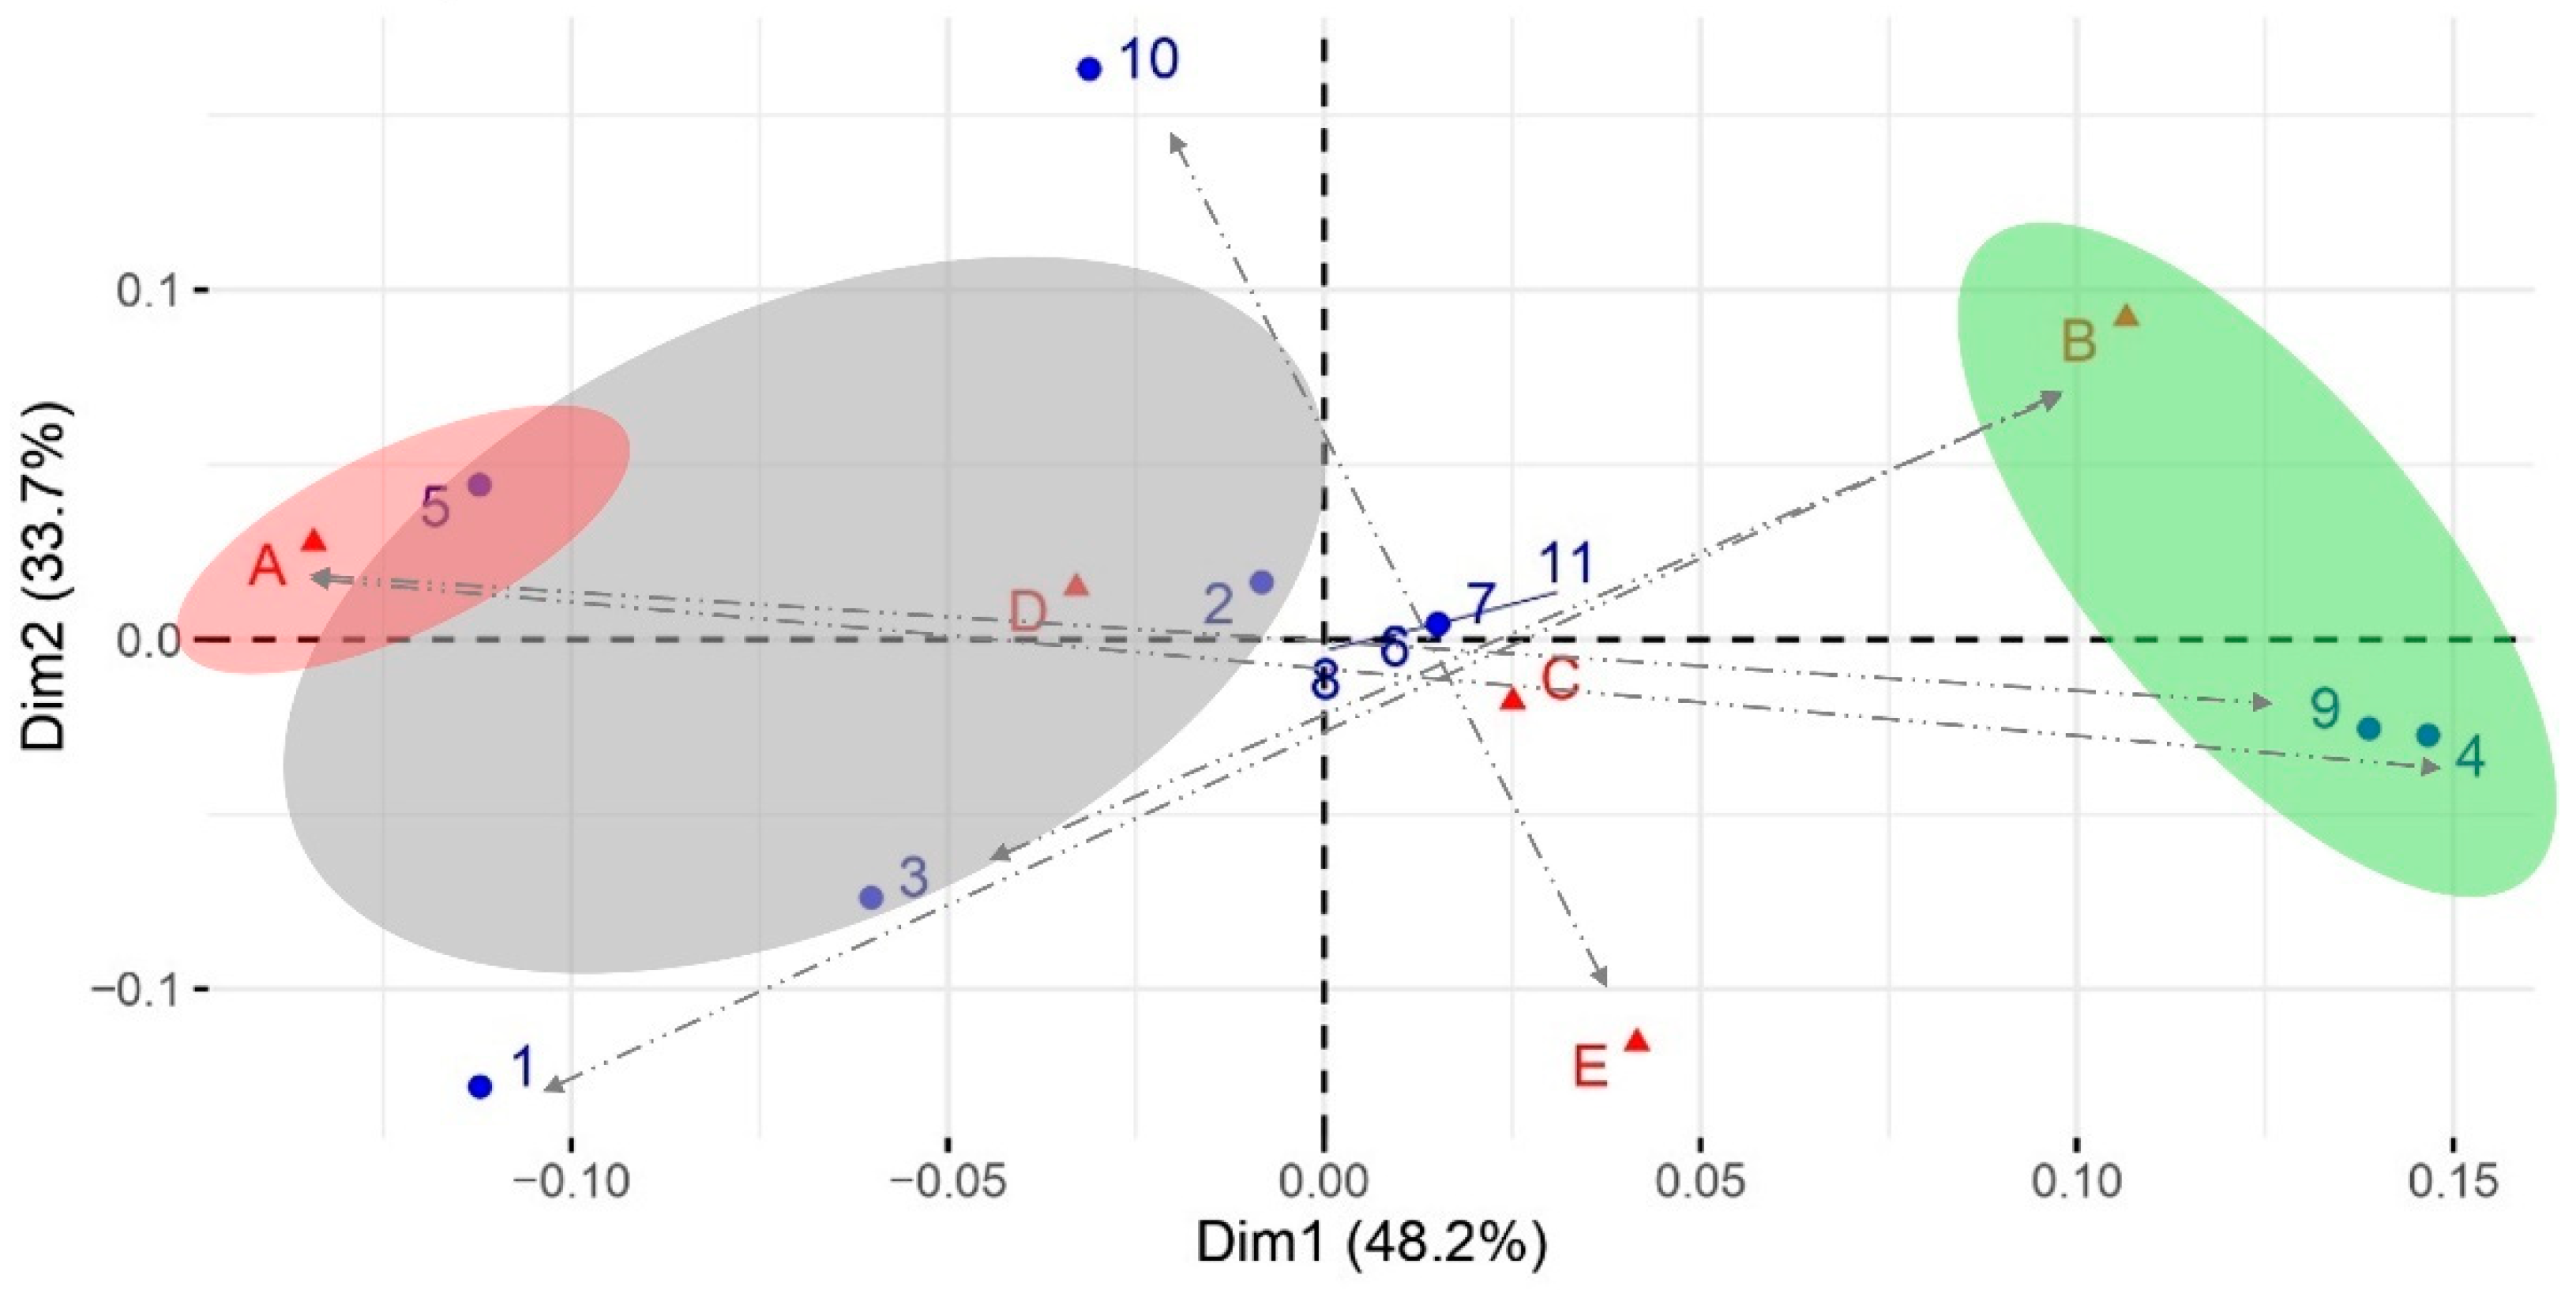
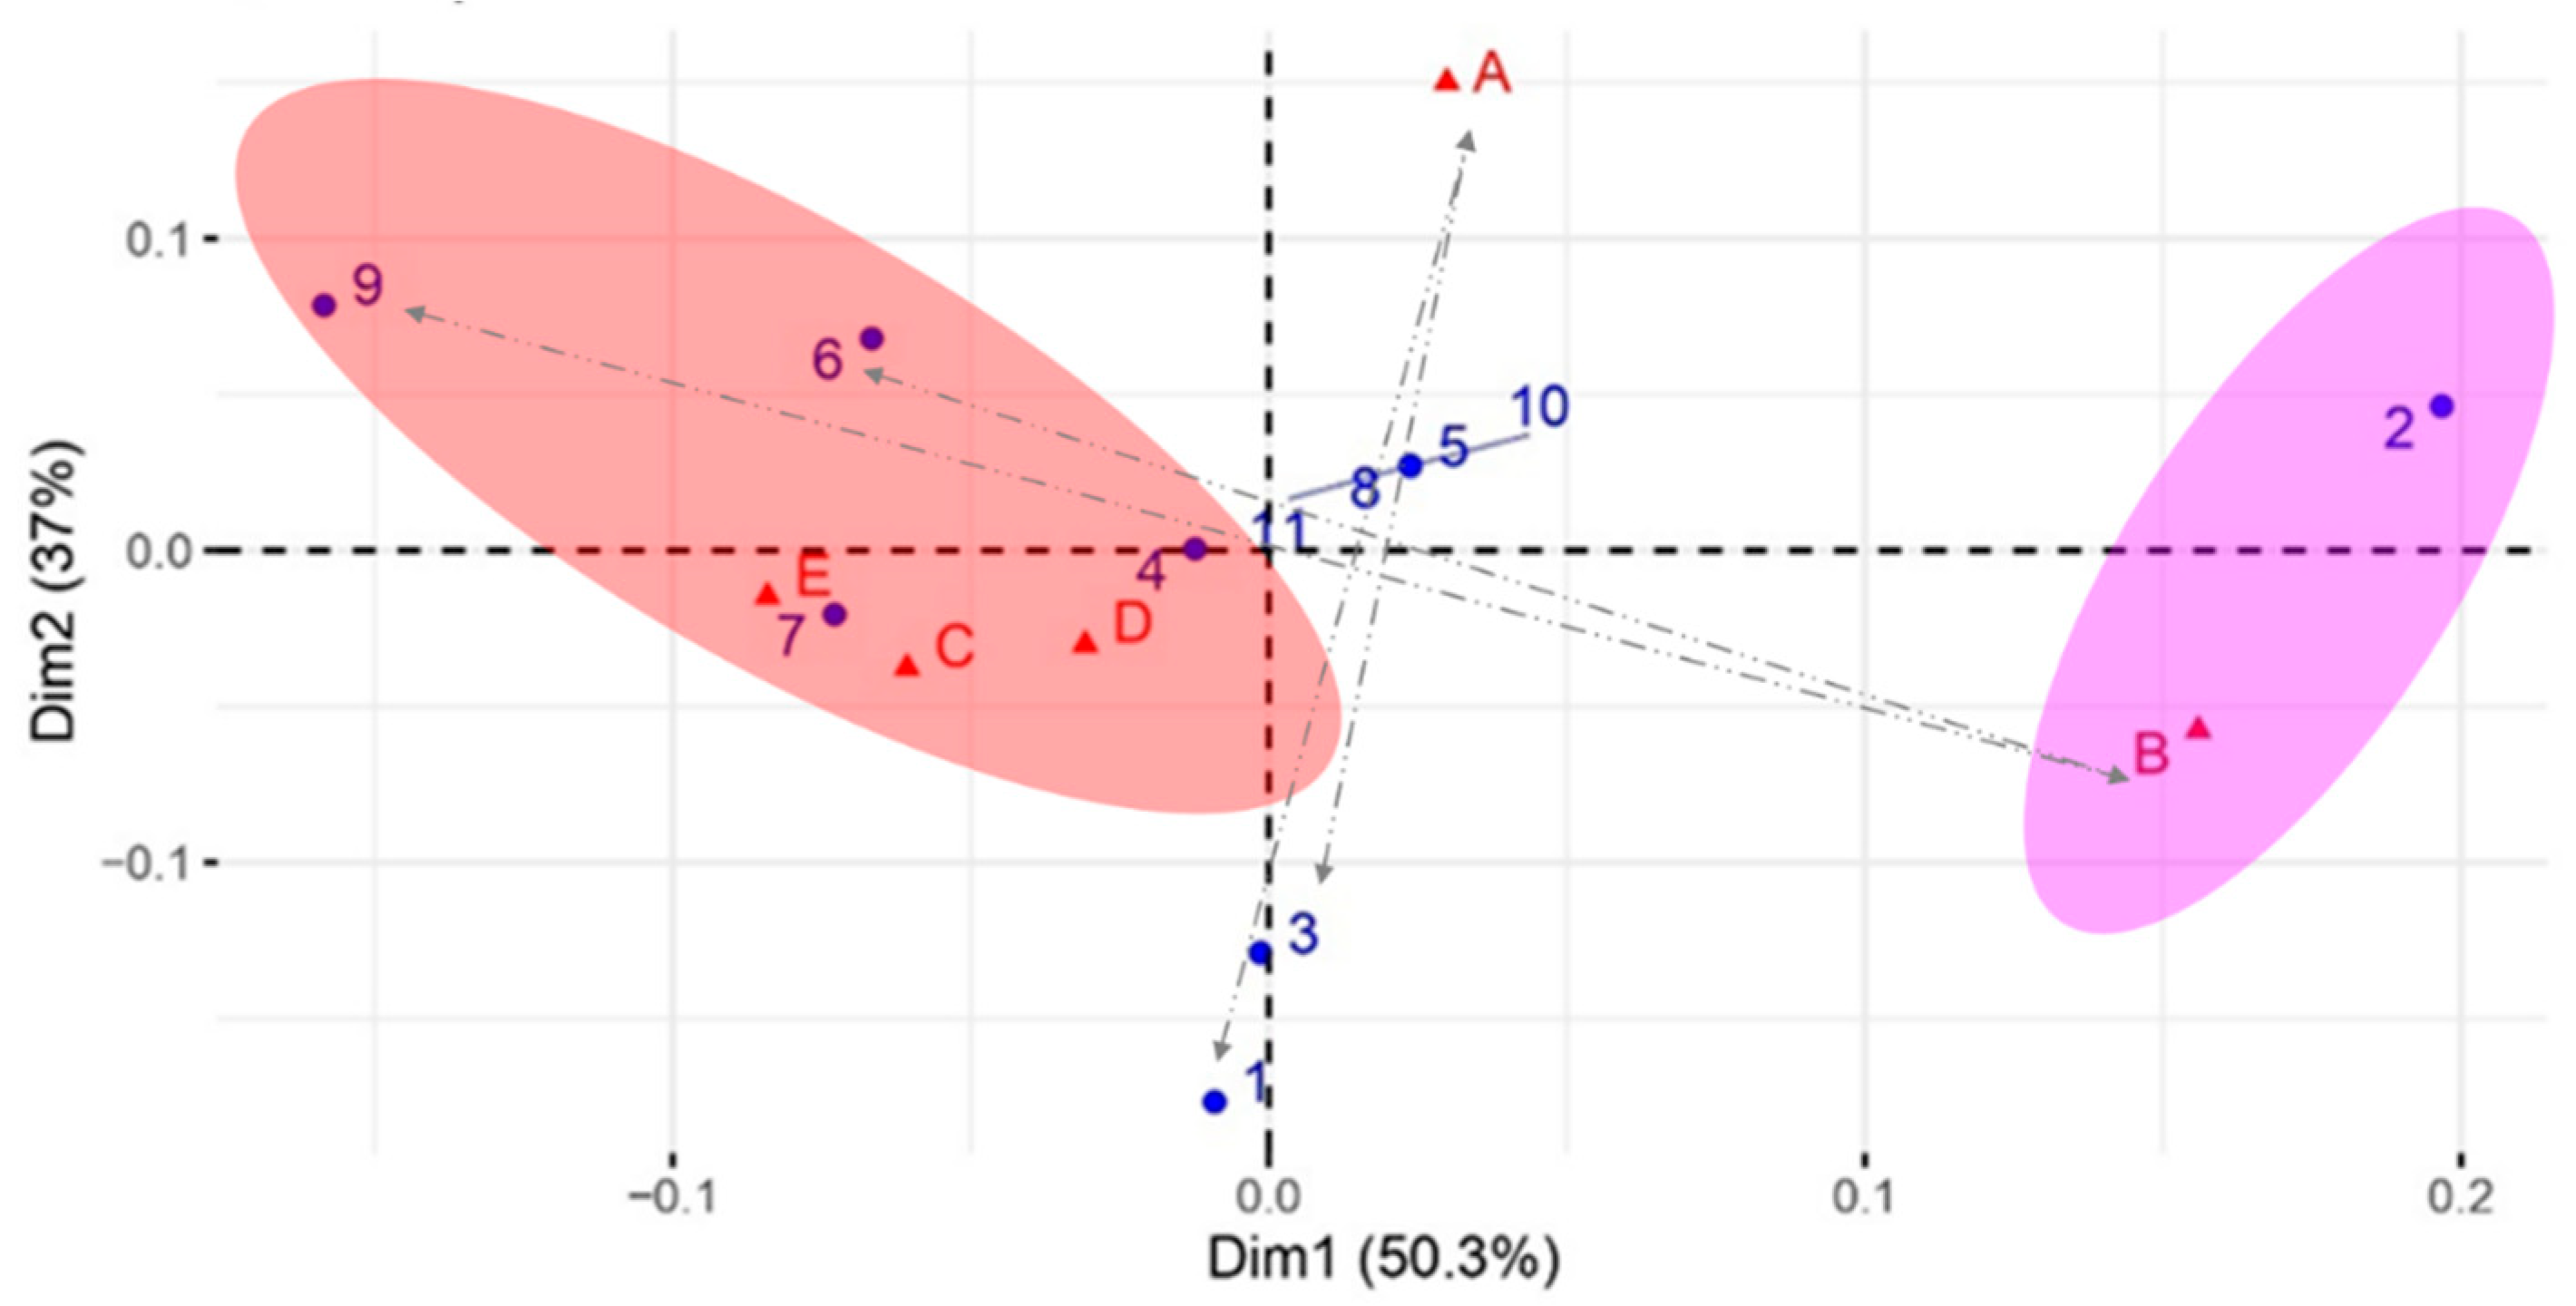
3.4. Relationship between Dairy Farmers’ Livelihoods and Perceptions of Climate Change

Positive (80%) and negative (20%) correlations were identified in perceptions between the variables of capital and CC (Table 4). The strongest positive associations were found between the variables: pasture area (4), number of cows in production (7), number of bulls (8), and total milk production in liters per day (9) and the variable “Has the farmer heard about global climate change?” (A). The variables: level of education (2), receipt of government welfare money (10), and receipt of agricultural/livestock insurance (11) were also positively associated with respect to “reduced rainfall” (D). Negative associations were identified between the variables of educational level (2) and receipt of agricultural/livestock insurance (11) with respect to the belief that livestock farming is responsible, on some level, for climate change (E) (Figure 2).
In the perceptions of medium-sized dairy farmers, positive (60%) and negative (40%) correlations were identified between the variables of capitals and CC (Table 4). Positive associations were found between the variables: pasture area (4), ownership of portable milking equipment (6), number of cows in production (7), and total milk production in liters per day (9) with respect to the variables of sudden changes in climate (C), reduction of rainfall (D), and the belief that livestock farming is responsible, on some level, for climate change (E). Negative associations were identified between the variables of age (1) and experience in milk production (years) (3) with respect to the variable “Has the farmer heard about global climate change?” (A). This was also the case for “owns portable milking equipment” (6) and total milk production in liters per day (9) with respect to the variable of extreme temperatures (B) (Figure 3).
In the perceptions of large dairy farmers, positive (37.5%) and negative (62.5%) correlations were identified between the variables of capital and CC (Table 4). Positive associations were shown between the variables crop area (ha) (5) and “Has the farmer heard about global climate change?” (A), educational level (2), and “climate change means reduced rainfall” (D). Negative associations were identified between the variables of pasture area (4) and total milk production in liters per day (9) as regards “Has the farmer heard about global climate change?” (A), age (years) (1), experience in milk production (years) (3), “climate change means extreme temperatures” (B). This was also true for “receipt of government welfare money” (10) and the belief that livestock farming is responsible, on some level, for climate change (E) (Figure 4).
Based on the correlation coefficients, different dynamics were identified (Table 7), in global terms, in human and social capital (32.14%), natural capital (21.53%), and financial and physical capital (46.42%) with respect to the relationships or approximations with the variables of CC perceptions.

4. Discussion

4.1. Characterization of Dairy Farmers’ Livelihoods Using Capital Theory

The average age of the dairy farmers was 48.22 years (Table 2), while the small-scale dairy farmers adjacent to Chimborazo Fauna Reserve (RPFC) in Ecuador were 5.32 years younger [37]. In the Sumaco Biosphere Reserve of the Ecuadorian Amazon, the farmers were 8.18 years older [38] and in the central Andes of Peru (Province of Pasco), they were 1.68 years older [39]. Regarding gender, there were 60.66% more men than women as heads of households in livestock systems, which could generate a nutritional imbalance among household members, since it has been shown that when women are heads of households, there is a significantly greater positive effect on child nutrition and household food security [40].
In relation to the years of education of household heads, 71.51% had completed primary school. Creating rural educational programs is essential, particularly for households with female heads, as children’s health and schooling are more closely related to the mother’s education than the father’s [41]. The average in years of experience in milk production was 21.32, which could have a direct relationship with a higher economic income [42] but could not be related to sustainable cattle farms from social, environmental, and governance perspectives [43]. Regarding advice from community leaders, 96.18% of livestock farmers indicated that they do not receive this benefit, which prevents the formation of networks needed to improve adaptive governance and social cohesion [44]. Therefore, advice, as a social process among people at a local level, is necessary as it helps to improve a community’s capacity to adapt to CC [45].
The average farm area was 9.99 ha (Table 3), which is 7.12 ha more than cattle-producer farms in Chimborazo and Tungurahua (Ecuador) [46]. Nonetheless, the farms we studied were smaller than the existing Mestizo cattle farms (27.9 ha) in the Sumaco Biosphere Reserve [47]. Of the total of the dairy farms studied, 71.17% of the surface area represented pastureland; therefore, it is important to reduce the environmental impact of milk production and optimize production on the available land without over-applying fertilizers, thus improving sustainable soil management and grazing rotation [48].
There were hardly any assets, such as motorized strimmers and mechanical milking equipment, among the dairy farms evaluated, with an average of 94.3% responding “No” to ownership. Meanwhile, only 26.69% did not have fertilizer spray pumps (Table 4), which puts at risk the theory that owning physical assets (farm size, bicycle, etc.) produces significant impacts. The characteristics of the farm help producers to improve the quality of their land and increase asset building, and microfinance programs can improve their food security [49].
The significant difference between the evaluated groups in the variables of the number of cows in production, total herd, milk production (liters per day), price per liter of milk (dollars/liter), and gross income from milk production (Table 4) implies a commercial disadvantage for small- and medium-scale producers. This is because it has been proven that different forms of technical and financial support for forage and herd management significantly impact the overall profitability of an investment [50].
Almost all (93.61%) the cattle farmers were not in receipt of welfare money, which could be detrimental to the home environment. In Mexico, Nicaragua, and Costa Rica, it has been shown that welfare, in social terms, increases school enrollment and attendance alongside improving nutrition and decreasing child labor [51,52,53]. In other settings in Ecuador, welfare money increased school enrollment by 5% [54], had a statistically significant positive effect on the nutritional status of children [55], and reduced child labor by around 17% [56,57,58].
Regarding livestock insurance on the farms, 99.57% were not in receipt of it. This could generate some uncertainty surrounding how CC impacts would be addressed, given that insurance is recognized as (1) a risk reduction strategy, and (2) an efficient way of building and improving resilience [59,60]. Livestock insurance offers compensation payments after a disaster and can be an effective way of decreasing vulnerability to CC [61]. Generally, a failure to insure livestock may be due to an inaccurate perception of the performance of insurance companies and insurance services [62].

4.2. Relationship between Livelihoods and Perceptions of Climate Change

Studies focusing on livestock farmers’ perceptions of CC in Latin America are limited, but some descriptive work was conducted [46,63,64]. CC is generally perceived as a greater risk in developing countries than in most of the western world [65]. Of course, CC risk judgments vary not only between different countries but also between individuals in the same country [66,67]. The dynamics found in the Maule region of Chile were similar to those of the producers studied here (Figure 1; Table 4), revealing that younger, more educated farmers and those who own their land tend to have clearer perceptions of CC than older, less educated, or tenant farmers [68].
Studies have shown that cattle farmers with larger farms—in terms of area, pasturelands, and larger numbers of animals—were more likely to have heard about CC, which could be related to concerns about production efficiency and reproduction in cattle. Increasing temperatures cause heat stress in cattle, which negatively affects milk production, reproduction, and animal health [69,70]. Climate change and seasonal fluctuations in forage quality and quantity affect cattle welfare and lead to a decrease in cattle production and reproductive efficiency [71].

4.3. Agri-Environmental and Educational Policy Implications for Dairy Farmers in a Changing Climate

The institutional framework, in terms of CC, for compliance with the NDCs for Ecuador was promoted under Executive Decree No. 1815 (2009) and, in 2010, the Modified Decree No. 1815 was issued under Decree No. 495. This declared climate change adaptation and mitigation to be a state policy, making it essential to promote agri-environmental policies in the productive-conservationist landscape (Figure 2). The sectoral policies committed to in the NDCs should be intensified in the rural productive sector and include incentives for low-carbon production in small-, medium-, and large-scale dairy producers (Table 2 and Table 3). Other strategies to be implemented are those that help mitigate greenhouse gas emissions with improvements in soil quality and agricultural system efficiency, sustainable land management, restoration of degraded pastures, and good livestock practices [72]. There should also be a strengthening of agri-environmental policies that promote the use of pastures resistant to extreme climate events, the use of efficient technologies for irrigation, the adoption of strategies to support small agricultural and livestock producers, and the dissemination of soil conservation systems.
Considering that the surveyed heads of households mostly had a primary-school educational level (Table 2), the means for acquiring climate information (Table 5), and that, according to the variables in CC perception (Table 6), there are divergences among dairy farmer groups, it is indispensable to develop local programs for climate education. Such education is a fundamental component when addressing CC problems [73]. Consideration should be given to UNESCO’s Education for Sustainable Development program that aims to help people understand the impacts of global warming today and develop a climate culture [74]. The key objectives of this program, which would help dairy farmers, are to (1) strengthen pedagogical programs to provide high-quality CC education for sustainable development at primary and secondary school levels; and (2) foster and enhance innovative teaching approaches to integrate high-quality CC education in formal and non-formal settings.
Educational strategies to enhance a climate culture among dairy farmers could include: improving local education policies; boosting education analysis, research, and planning; improving rural teacher education and training for education strategy-makers; promoting better climate science education; and promoting school-wide approaches to climate change education [75].

5. Conclusions

According to the rural livelihoods characterized, of the 20 variables evaluated, there are significant differences between small-, medium-, and large-scale dairy farmers in eight variables: gender, educational level, on-farm work, number of cows in production, number of bulls, total herd, production, and average milk price. Regarding the acquisition of climate information, 98.49% of producers did not receive information and only 1.55% obtained information from the government or non-governmental organizations, even though 85.29% of dairy farmers stated that it is important to obtain climate information. Furthermore, of the producers participating in the study, 26.31% had not heard about climate change but 93.95% think that it is a serious problem for farmers, and 87.09% consider that agricultural/livestock farming is responsible, on some level, for climate change.
In the relationship between the livelihoods of dairy farmers and perceptions of climate change, it was identified that younger dairy farmers had heard about global climate change more frequently than their older counterparts. Moreover, the higher the dairy farmers’ educational level, the greater the relationship with the variables of climate change perceptions. In broad terms, natural and physical capital had an impact on whether or not dairy farmers had heard about climate change. Future research should focus on strengthening the capacities of older livestock producers and on formulating non-formal educational programs to promote a climate culture among producers.

Author Contributions

Conceptualization, J.C.V.-B., M.H.-R. and B.T.; methodology, M.H.-R., L.P. and J.H.-G.; formal analysis, J.H.-G., L.P. and M.H.-R.; investigation and data curation, J.C.V.-B., B.N.H., J.C., A.T. and M.L.; writing—original draft preparation, J.C.V.-B., M.H.-R., Y.T. and L.P.; writing—review and editing, J.C.V.-B., M.H.-R., T.T. and B.T.; project administration, J.C. All authors have read and agreed to the published version of the manuscript.

Funding

This research received no external funding.

Institutional Review Board Statement

Not applicable.

Informed Consent Statement

Informed consent was obtained from all subjects involved in the study, which is part of the Project: Analysis of livelihoods, agrarian sustainability, and perception of climate change in mestizos and indigenous people in the Ecuadorian Andes.

Data Availability Statement

Data supporting the reported results can be found by emailing the first or corresponding author.

Acknowledgments

The authors thank the dairy farmers who participated in this study.

Conflicts of Interest

The authors declare no conflict of interest.

References

  1. Thornton, P.K.; van de Steeg, J.; Notenbaert, A.; Herrero, M. The impacts of climate change on livestock and livestock systems in developing countries: A review of what we know and what we need to know. Agric. Syst. 2009, 101, 113–127. [Google Scholar] [CrossRef]
  2. Escarcha, J.F.; Lassa, J.A.; Zander, K.K. Livestock under climate change: A systematic review of impacts and adaptation. Climate 2018, 6, 54. [Google Scholar] [CrossRef]
  3. Herrero, M.; Wirsenius, S.; Henderson, B.; Rigolot, C.; Thornton, P.; Havlík, P.; De Boer, I.; Gerber, P.J. Livestock and the environment: What have we learned in the past decade? Annu. Rev. Environ. Resour. 2015, 40, 177–202. [Google Scholar] [CrossRef]
  4. Weindl, I.; Lotze-Campen, H.; Popp, A.; Müller, C.; Havlík, P.; Herrero, M.; Schmitz, C.; Rolinski, S. Livestock in a changing climate: Production system transitions as an adaptation strategy for agriculture. Environ. Res. Lett. 2015, 10, 094021. [Google Scholar] [CrossRef]
  5. Toulkeridis, T.; Tamayo, E.; Simón, D.; Merizalde, M.J.; Reyes, D.F.; Viera, M.; Heredia, M. Cambio Climático según los académicos ecuatorianos—Percepciones versus hechos. Granja Rev. Cienc. Vida 2020, 31, 21–46. [Google Scholar] [CrossRef]
  6. Chambers, R.; Conway, G. Sustainable Rural Livelihoods: Practical Concepts for the 21st Century; Institute of Development Studies: Falmer, UK, 1992. [Google Scholar]
  7. DfiD (Department for International Development). Sustainable Livelihoods Guidance Sheets: Framework Introduction Vulnerability Transforming; Department for International Development: London, UK, 1999. [Google Scholar]
  8. Harvey, C.A.; Martínez-Rodríguez, M.R.; Cárdenas, J.M.; Avelino, J.; Rapidel, B.; Vignola, R.; Donatti, C.; Vilchez-Mendoza, S. The use of Ecosystem-based Adaptation practices by smallholder farmers in Central America. Agric. Ecosyst. Environ. 2017, 246, 279–290. [Google Scholar] [CrossRef]
  9. Pica-Ciamarra, U.; Tasciotti, L.; Otte, J.; Zezza, A. Livestock Assets, Livestock Income and Rural Households: Cross-Country Evidence from Household Surveys. 2011. Available online: https://openknowledge.worldbank.org/handle/10986/17890 (accessed on 1 January 2023).
  10. Thomson, G.R.; Penrith, M.L.; Atkinson, M.W.; Atkinson, S.J.; Cassidy, D.; Osofsky, S.A. Balancing livestock production and wildlife conservation in and around southern Africa’s transfrontier conservation areas. Transbound. Emerg. Dis. 2013, 60, 492–506. [Google Scholar] [CrossRef] [PubMed]
  11. Abay, K.A.; Jensen, N.D. Access to markets, weather risk, and livestock production decisions: Evidence from Ethiopia. Agric. Econ. 2020, 51, 577–593. [Google Scholar] [CrossRef]
  12. AMagrin, G.O.; Marengo, J.A.; Boulanger, J.-P.; Buckeridge, M.S.; Castellanos, E.; Poveda, G.; Vicuña, S. Central and South America. In Climate Change 2014: Impacts, Adaptation, and Vulnerability. Part B: Regional Aspects. Contribution of Working Group II to the Fifth Assessment Report of the Intergovernmental Panel on Climate Change; Barros, V.R., Field, C.B., Dokken, D.J., Mastrandrea, M.D., Mach, K.J., Bilir, T.E., White, L.L., Eds.; Cambridge University Press: Cambridge, UK, 2014; pp. 1499–1566. [Google Scholar]
  13. Marengo, J.A.; Chou, S.; Torres, R.R.; Giarolla, A.; Alves, L.M.; Lyra, A. Climate change in central and South America: Recent trends, future projections, and impacts on regional agriculture. In CCAFS Working Paper; CGIAR Research Program on Climate Change, Agriculture and Food Security (CCAFS): Copenhagen, Denmark, 2014. [Google Scholar]
  14. Hannah, L.; Ikegami, M.; Hole, D.G.; Seo, C.; Butchart, S.H.; Peterson, A.T.; Roehrdanz, P.R. Global climate change adaptation priorities for biodiversity and food security. PLoS ONE 2013, 8, e72590. [Google Scholar] [CrossRef]
  15. Vuille, M.; Francou, B.; Wagnon, P.; Juen, I.; Kaser, G.; Mark, B.G.; Bradley, R.S. Climate change and tropical Andean glaciers: Past, present and future. Earth-Sci. Rev. 2008, 89, 79–96. [Google Scholar] [CrossRef]
  16. Chevallier, P.; Pouyaud, B.; Suarez, W.; Condom, T. Climate change threats to environment in the tropical Andes: Glaciers and water resources. Reg. Environ. Chang. 2011, 11, 179–187. [Google Scholar] [CrossRef]
  17. IPCC. Summary for Policymakers. In Climate Change 2021: The Physical Science Basis. Contribution of Working Group I to the Sixth Assessment Report of the Intergovernmental Panel on Climate Change; Masson-Delmotte, V., Zhai, P., Pirani, A., Connors, S.L., Péan, C., Berger, S., Caud, N., Chen, Y., Goldfarb, L., Gomis, M.I., et al., Eds.; Cambridge University Press: Cambridge, UK; New York, NY, USA, 2021; pp. 3–32. [Google Scholar] [CrossRef]
  18. Seager, R.; Lis, N.; Feldman, J.; Ting, M.; Williams, A.P.; Nakamura, J.; Lui, H.; Henderson, N. Whither the 100th meridian? The once and future physical and human geography of America’s arid–humid divide. Part I: The story so far. Earth Interact. 2018, 22, 1–22. [Google Scholar] [CrossRef]
  19. Chakraborty, S.; Newton, A.C. Climate change, plant diseases and food security: An overview. Plant Pathol. 2011, 60, 2–14. [Google Scholar] [CrossRef]
  20. Elad, Y.; Pertot, I. Climate change impacts on plant pathogens and plant diseases. J. Crop Improv. 2014, 28, 99–139. [Google Scholar] [CrossRef]
  21. United Nations. United Nations Framework Convention on Climate Change; United Nations, General Assembly: New York, NY, USA, 1992. [Google Scholar]
  22. Læssøe, J.; Mochizuki, Y. Recent trends in national policy on education for sustainable development and climate change education. J. Educ. Sustain. Dev. 2015, 9, 27–43. [Google Scholar] [CrossRef]
  23. UNESCO United Nations Educational, Scientific and Cultural Organization (UNESCO). UNESCO Strategy for the Second Half of the United Nations Decade of Education for Sustainable Development; UNESCO United Nations Educational, Scientific and Cultural Organization (UNESCO): Paris, France, 2010. [Google Scholar]
  24. Mochizuki, Y.; Bryan, A. Climate change education in the context of education for sustainable development: Rationale and principles. J. Educ. Sustain. Dev. 2015, 9, 4–26. [Google Scholar] [CrossRef]
  25. GADPC Creación del Área de Conservación y Uso Sustentable de la Cordillera Oriental del Carchi. Gobierno Autónomo Descentralizado de la Provincia del Carchi/CONDESAN Proyecto EcoAndes; GADPC Creación del Área de Conservación y Uso Sustentable de la Cordillera Oriental del Carchi: Tulcán, Ecuador, 2016. [Google Scholar]
  26. MAE Sistema de Clasificación de los Ecosistemas del Ecuador Continental. Subsecretaría de Patrimonio Natural; Ministeriodel Ambiente del Ecuador: Quito, Ecuador, 2013. [Google Scholar]
  27. Cayambe, J.; Iglesias, A. The cost of mitigating greenhouse gas emissions in farms in Central Andes of Ecuador. Span. J. Agric. Res. 2020, 18, 101. [Google Scholar] [CrossRef]
  28. Cavendish, W. How Do Forests Support, Insure and Improve the Livelihoods of the Rural Poor? A Research Note; Center for International Forestry Research: Bogor, Indonesia, 2003. [Google Scholar]
  29. Ellis, F. The Determinant of Rural Livelihood Diversification in Developing Countries. J. Agric. Econ. 2000, 51, 289–302. [Google Scholar] [CrossRef]
  30. Scoones, I. Sustainable Rural Livelihoods: A Framework for Analysis; IDS Working Paper 72; IDS: Brighton, UK, 1998; pp. 1–22. [Google Scholar]
  31. Torres, B.; Andrade, A.; Enriquez, F.; Luna, M.; Heredia-R, M.; Bravo, C. Estudios Sobre Medios de vida, Sostenibilidad y Captura de Carbono en Chakra con Cacao: Casos de las Asociaciones Kallari, Wiñak y Tsatsayaku, Amazonía Ecuatoriana; FAO: Quito, Ecuador, 2022. [Google Scholar]
  32. Vanclay, F.; Baines, J.T.; Taylor, C.N. Principles for ethical research involving humans: Ethical professional practice in impact assessment Part I. Impact Assess. Proj. Apprais. 2013, 31, 243–253. [Google Scholar] [CrossRef]
  33. Zuur, A.F.; Ieno, E.N.; Walker, N.J.; Saveliev, A.A.; Smith, G.M. Zero-Truncated and Zero-Inflated Models for Count Data; Mixed Effects Models and Extensions in Ecology with R. Ed.; Springer: New York, NY, USA, 2009; pp. 261–293. [Google Scholar]
  34. Greenacre, M.J. Correspondence Analysis in Practice, 2nd ed.; Chapman & Hall/CRC Press: Boca Raton, FL, USA, 2010; pp. xiii + 280, 464. [Google Scholar]
  35. Di Rienzo, J.A.; Casanoves, F.; Balzarini, M.G.; Gonzalez, L.; Tablada, M.; Robledo, C.W. InfoStat Versión; Grupo InfoStat; FCA, Universidad Nacional de Córdoba, Córdoba, Argentina. 2015. Available online: http://www.infostat.com.ar (accessed on 15 January 2023).
  36. R Development Core Team. R: A Language and Environment for Statistical Computing; R Foundation for Statistical Computing: Vienna, Austria, 2019. [Google Scholar]
  37. Torres, B.; Cayambe, J.; Paz, S.; Ayerve, K.; Heredia-R, M.; Torres, E.; Luna, M.; Toulkeridis, T.; García, A. Livelihood Capitals, Income Inequality, and the Perception of Climate Change: A Case Study of Small-Scale Cattle Farmers in the Ecuadorian Andes. Sustainability 2022, 14, 5028. [Google Scholar] [CrossRef]
  38. Torres, B.; Andrade, V.; Heredia-R, M.; Toulkeridis, T.; Estupiñán, K.; Luna, M.; Bravo, C.; García, A. Productive Livestock Characterization and Recommendations for Good Practices Focused on the Achievement of the SDGs in the Ecuadorian Amazon. Sustainability 2022, 14, 10738. [Google Scholar] [CrossRef]
  39. Radolf, M.; Wurzinger, M.; Gutiérrez, G. Livelihood and production strategies of livestock keepers and their perceptions on climate change in the Central Peruvian Andes. Small Rumin. Res. 2022, 215, 106763. [Google Scholar] [CrossRef]
  40. Babu, S.; Gajanan, S.N.; Sanyal, P. Food Security, Poverty and Nutrition Policy Analysis: Statistical Methods and Applications; Academic Press: New York, NY, USA, 2014. [Google Scholar]
  41. Schultz, T.P. Why governments should invest more to educate girls. World Dev. 2002, 30, 207–225. [Google Scholar] [CrossRef]
  42. Holmann, F.J.; Rivas Ríos, L.; Carulla, J.; Giraldo, L.A.; Guzman, S.; Martinez, M.; Rivera, B.; Medina, A.; Farrow, A. Evolution of Milk Production Systems in the Tropics of Latin America and Its Interrelationship with Markets: An Analysis of the Colombian Case. In Proceedings of the Ninth World Congress on Animal Production, Porto Alegre, Brazil, 26–31 October 2003; ILRI: Nairobi, Kenya, 2002. [Google Scholar]
  43. Heredia-R, M.; Torres, B.; Vasseur, L.; Puhl, L.; Barreto, D.; HDíaz-Ambrona, C.G. Sustainability dimensions assessment in four traditional agricultural systems in the Amazon. Front. Sustain. Food Syst. 2022, 5, 545. [Google Scholar] [CrossRef]
  44. Vasseur, L.; Thornbush, M.J.; Plante, S. Engaging Communities in Adaptation to Climate Change by Understanding the Dimensions of Social Capital in Atlantic Canada. Sustainability 2022, 14, 5250. [Google Scholar] [CrossRef]
  45. Jones, N.; Clark, J.R.A. Social capital and the public acceptability of climate change adaptation policies: A case study in Romney Marsh, UK. Clim. Chang. 2014, 123, 133–145. [Google Scholar] [CrossRef]
  46. León-Alvear, V.; Torres, B.; Luna, M.; Torres, A.; Ramírez, P.; Andrade-Yucailla, V.; Muñoz-Rengifo, J.C.; Heredia-R, M. Percepción sobre cambio climático en cuatro comunidades orientadas a la ganadería bovina en la zona central de los Andes Ecuatorianos. Livest. Res. Rural Dev. 2020, 32, 165. [Google Scholar]
  47. Zambrano, E.; Torres, B.; Ochoa-Moreno, S.; Reyes, H.; Torres, A.; Velasco, C.; Heredia-R, M. Determinantes socioeconómicas del uso forestal maderable en la zona de amortiguamiento del Parque Nacional Sumaco Napo Galeras, Amazonía Ecuatoriana. Ecosistemas 2021, 30, 2216. [Google Scholar] [CrossRef]
  48. Galloway, C.; Conradie, B.; Prozesky, H.; Esler, K. Opportunities to improve sustainability on commercial pasture-based dairy farms by assessing environmental impact. Agric. Syst. 2018, 166, 1–9. [Google Scholar] [CrossRef]
  49. Kassie, M.; Stage, J.; Teklewold, H.; Olaf, E. Gendered food security in rural Malawi: Why is women’s food security status lower? Food 2015, 7, 1299–1320. [Google Scholar] [CrossRef]
  50. Bernet, T.; Hervé, D.; Lehmann, B.; Walker, T. Improving land use by slope farmers in the Andes: An economic assessment of small-scale sprinkler irrigation for milk production. Mt. Res. Dev. 2002, 22, 375–382. [Google Scholar] [CrossRef]
  51. Behrman, J.R.; Sengupta, P.; Todd, P. Progressing through PROGRESA: An impact assessment of a school subsidy experiment in rural Mexico. Econ. Dev. Cult. Chang. 2005, 54, 237–275. [Google Scholar] [CrossRef]
  52. Maluccio, J.; Flores, R. Impact Evaluation of a Conditional Cash Transfer Program: The Nicaraguan Red de Protección Social; International Food Policy Research Institute: Washington, DC, USA, 2005. [Google Scholar]
  53. Duryea, S.; Morrison, A. The Effect of Conditional Transfers on School Performance and Child Labor: Evidence from an Ex-Post Impact Evaluation in Costa Rica; Inter-American Development Bank (IDB): Belize, Costa Rica, 2004. [Google Scholar]
  54. Vos, R.; León, M.; Brborich, W. Are Cash Transfer Programs Effective to Reduce Poverty? Mimeo: New York, NY, USA, 2001. [Google Scholar]
  55. León, M.; Younger, S.D. Transfer payments, mothers’ income and child health in Ecuador. J. Dev. Stud. 2007, 43, 1126–1143. [Google Scholar] [CrossRef]
  56. Martínez, D.; Borja, T.; Medellín, N.; Cueva, P. ¿Cómo funciona el Bono de Desarrollo Humano?: Mejores Prácticas en la Implementación de Programas de Transferencias Monetarias Condicionadas en América Latina y el Caribe. BID. 2017. Available online: https://publications.iadb.org/es/publicacion/14081/como-funciona-el-bono-de-desarrollo-humano-mejores-practicas-en-la-implementacion (accessed on 20 January 2023).
  57. Ponce, J.; Bedi, A.S. The impact of a cash transfer program on cognitive achievement: The Bono de Desarrollo Humano of Ecuador. Econ. Educ. Rev. 2010, 29, 116–125. [Google Scholar] [CrossRef]
  58. Schady, N.R.; Araujo, M. Cash Transfers, Conditions, School Enrollment, and Child Work: Evidence from a Randomized Experiment in Ecuador; World Bank Publications: Washington, DC, USA, 2006; Volume 3. [Google Scholar]
  59. Ghahramani, A.; Bowran, D. Transformative and systemic climate change adaptations in mixed crop-livestock farming systems. Agric. Syst. 2018, 164, 236–251. [Google Scholar] [CrossRef]
  60. Amamou, H.; Sassi, M.B.; Aouadi, H.; Khemiri, H.; Mahouachi, M.; Beckers, Y.; Hammami, H. Climate change-related risks and adaptation strategies as perceived in dairy cattle farming systems in Tunisia. Clim. Risk Manag. 2018, 20, 38–49. [Google Scholar] [CrossRef]
  61. Karimi, V.; Karami, E.; Keshavarz, M. Vulnerability and adaptation of livestock producers to climate variability and change. Rangel. Ecol. Manag. 2018, 71, 175–184. [Google Scholar] [CrossRef]
  62. Biglari, T.; Maleksaeidi, H.; Eskandari, F.; Jalali, M. Livestock insurance as a mechanism for household resilience of livestock herders to climate change: Evidence from Iran. Land Use Policy 2019, 87, 104043. [Google Scholar] [CrossRef]
  63. Fierros-González, I.; Lopez-Feldman, A. Farmers’ perception of climate change: A review of the literature for Latin America. Front. Environ. Sci. 2021, 7, 672399. [Google Scholar] [CrossRef]
  64. Browning-Aiken, A.; Morehouse, B.; Davis, A.; Wilder, M.; Varady, R.; Goodrich, D.; Carter, R.; Moreno, D.; McGovern, E.D. Climate, water management, and policy in the San Pedro Basin: Results of a survey of Mexican stakeholders near the US–Mexico border. Clim. Chang. 2007, 85, 323–341. [Google Scholar] [CrossRef]
  65. Kim, S.Y.; Wolinsky-Nahmias, Y. Cross-national public opinion on climate change: The effects of affluence and vulnerability. Glob. Environ. Politics 2014, 14, 79–106. [Google Scholar] [CrossRef]
  66. Smith, N.; Leiserowitz, A. The rise of global warming skepticism: Exploring affective image associations in the United States over time. Risk Anal. Int. J. 2012, 32, 1021–1032. [Google Scholar] [CrossRef] [PubMed]
  67. Whitmarsh, L. Scepticism and uncertainty about climate change: Dimensions, determinants and change over time. Glob. Environ. Chang. 2011, 21, 690–700. [Google Scholar] [CrossRef]
  68. Roco, L.; Engler, A.; Bravo-Ureta, B.E.; Jara-Rojas, R. Farmers’ perception of climate change in mediterranean Chile. Reg. Environ. Chang. 2015, 15, 867–879. [Google Scholar] [CrossRef]
  69. Hammami, H.; Bormann, J.; M’hamdi, N.; Montaldo, H.H.; Gengler, N. Evaluation of heat stress effects on production traits and somatic cell score of Holsteins in a temperate environment. J. Dairy Sci. 2013, 96, 1844–1855. [Google Scholar] [CrossRef] [PubMed]
  70. Sanker, C.; Lambertz, C.; Gauly, M. Climatic effects in Central Europe on the frequency of medical treatments of dairy cows. Animal 2013, 7, 316–321. [Google Scholar] [CrossRef]
  71. Sejian, V.; Kumar, D.; Gaughan, J.B.; Naqvi, S.M. Effect of multiple environmental stressors on the adaptive capability of Malpura rams based on physiological responses in a semi-arid tropical environment. J. Vet. Behav. 2017, 17, 6–13. [Google Scholar] [CrossRef]
  72. Samaniego, J.; Alatorre, J.; Ferrer, J.; Muñoz, L.; Arpaia, L. Panorama de las Contribuciones Determinadas a Nivel Nacional en América Latina y el Caribe, 2019: Avances para el Cumplimiento del Acuerdo de París (LC/TS.2019/89-P); Comisión Económica para América Latina y el Caribe (CEPAL): Santiago, Chile, 2019. [Google Scholar]
  73. González-Gaudiano, E.J.; Meira, P.Á. Educación para el cambio climático: ¿Educar sobre el clima o para el cambio? Perfiles Educ. 2020, 42, 157–174. [Google Scholar] [CrossRef]
  74. Szczepankiewicz, E.I.; Fazlagić, J.; Loopesko, W. A Conceptual Model for Developing Climate Education in Sustainability Management Education System. Sustainability 2021, 13, 1241. [Google Scholar] [CrossRef]
  75. UNESCO. Climate Change Education for Sustainable Development. UNESCO Climate Change Initiative. 2010. Available online: http://unesdoc.unesco.org/images/0019/001901/190101E.pdf (accessed on 11 January 2023).
Figure 1. Location of dairy farms in the productive-conservationist landscape of the Ecuadorian Andes.
Sustainability 15 13157 g001
Figure 2. Ordering of Spearman’s correlation values between the capital theory variables (numbers) and perceptions of climate change variables (letters) in small-scale dairy farmers in the productive-conservationist landscape of the Ecuadorian Andes.
Sustainability 15 13157 g002
Figure 3. Ordering of Spearman correlation values between capital theory variables (numbers) and climate change perceptions variables (letters) in medium-sized dairy farmers in the productive-conservationist landscape of the Ecuadorian Andes.
Sustainability 15 13157 g003
Figure 4. Ordering of Spearman’s correlation values between capital theory variables (numbers) and climate change perception variables (letters) in large-scale dairy farmers in the productive-conservationist landscape of the Ecuadorian Andes.
Sustainability 15 13157 g004
Table 1. Themes and variables studied in capital theory.
ThemeVariables
Human and SocialAge, gender, and educational level of the head of the household; Experience in milk production, work outside the farm, and whether the farmer receives advice from community leaders.
Natural
Financial and Physical
Total farm area, pasture area, cultivated land area.
Owns motorized strimmer, portable milking equipment, owns manual fumigation pumps, number of cows in production, number of bulls, total herd, number of months cows are in production, total milk production in liters per day, milk price– average in dollars per liter, receipt of government welfare money, and receipt of livestock/agricultural insurance.
Table 2. Averages of the main variables that represent the human and social capital of milk producers in the productive-conservationist landscape of the Ecuadorian Andes.
VariableDairy Cattle Farmers
SmallMediumLargeAveragep-Value
Age (years) 46.73
(12.61)
49.16
(12.23)
48.76
(15.22)
48.220.6998 1
Gender (%)Men72 a80 ab89 b80.330.0847 2
Women28 a20 ab11 b19.67
Educational level (%)None6.415.452.704.860.0016 3
Literate1.280.000.000.43
Primary76.9272.7364.8671.51
Secondary14.1012.7329.7318.85
Technological training1.280.000.001.28
University---9.092.705.90
Experience in dairy production (years) 20.29
(11.58)
23.38
(13.38)
20.30
(12.90)
21.320.4657 1
Where they work (%)On the farm 52.56 a74.55 b89.19 c72.100.0001 2
Outside the farm47.44 a25.45 b10.81 c27.90
Receives advice from community leaders (%)Yes5.133.642.703.820.8050 2
No94.8796.3697.3096.18
p-value corresponds to: 1 the Kruskal–Wallis test for quantitative variables; 2 the effect of groups in the generalized linear model for the case of binary variables (Yes/No); and 3 the Chi-squared test for homogeneity. p-values in bold are less than the level of significance. Different letters in the rows indicate significant differences at 10% between producer groups for Fisher’s LSD test. The SD (σ) of the variables is indicated in brackets.
Table 3. Averages of the main variables that represent the natural capital of dairy farmers in the productive-conservationist landscape of the Ecuadorian Andes.
VariableDairy Cattle Farmers
SmallMediumLargeAveragep-Value
Area of the farm (ha)3.36 a (1.32)7.67 b (1.38)18.95 c (6.27)9.99<0.0001
Area of pastureland (ha)2.17 a (1.10)5.17 b (1.45)14.00 c (6.82)7.11<0.0001
Area of cultivated land (ha)1.19 a (0.82)2.50 b (1.41)4.95 c (3.23)2.88<0.0001
p-value corresponds to the Kruskal–Wallis test. p-values in bold are less than the significance level. Different letters in the rows indicate significant differences at 10% between groups for Fisher’s LSD test. The SD (σ) of the variables is indicated in brackets.
Table 4. Averages of the main variables that represent the physical and financial capital of dairy farmers in the productive-conservationist landscape of the Ecuadorian Andes.
VariablesDairy Cattle Farmers
SmallMediumLargeAveragep-Value
Owns a motorized strimmer (%)Yes3.85-5.414.630.1273 2
No96.1510094.5996.91
Owns portable milking equipment (%)Yes5.139.0910.818.340.4944 2
No94.8790.9189.1991.66
Owns manual fumigation pumps (%)Yes76.9272.7370.2773.310.7190 2
No23.0827.2729.7326.69
Number of cows in production 4.06 a
(2.54)
7.84 b
(4.37)
18.24 c
(15.65)
10.05<0.0001 1
Number of bulls 0.46 a
(0.68)
0.60 a
(1.05)
1.11 b
(0.99)
0.720.0005 1
Total herd 4.53 a
(2.74)
8.44 b
(4.47)
19.35 c
(15.70)
10.77<0.0001 1
Number of months that the cows are in production 7.11
(0.77)
7.22
(1.33)
7.06
(0.98)
7.130.8109 1
Total milk production (liters per day) 33.94 a
(21.10)
75.22 b
(58.11)
222.30 c
(203.57)
110.480.0001 1
Gross income from milk production 2663.62 a
(1737.19)
6048.46 b
(4821.63)
19,351.65 c
(18,816.23)
7390.82<0.0001 1
Average milk price (dollars per liter) 0.36 a
(0.04)
0.37 a
(0.03)
0.40 b
(0.04)
0.380.0002 1
Receipt of government welfare money (%)Yes 8.977.502.706.390.3824 2
No91.0392.5097.3093.61
Receipt of livestock insurance (%)Yes1.280.000.000.430.4572 2
No98.72100.00100.0099.57
p-value corresponds to: 1 the Kruskal–Wallis test for quantitative variables; 2 the effect of groups in the generalized linear model for the case of binary variables (Yes/No). p-values in bold are less than the level of significance. Different letters in the rows indicate significant differences at 10% between producer groups for Fisher’s LSD test. The SD (σ) of the variables is indicated in brackets.
Table 5. Averages of the main variables that represent the acquisition of climate information by dairy farmers in the productive-conservationist landscape of the Ecuadorian Andes.
VariableDairy Cattle Farmers
Small (%)Medium
(%)
Large
(%)
Average
(%)
p-Value
Does the farmer have access to climate information?Yes0.001.822.701.510.2786
No100.0098.1897.3098.49
Does the farmer consider obtaining climate information to be important? Yes88.4683.6483.7885.290.6701
No11.5416.3616.2214.71
Does the farmer consider information about temperature to be important? Yes51.0054.5545.9550.500.7204
No49.0045.4554.0549.50
Does the farmer consider information about precipitation to be important?Yes82.0080.0067.5776.520.2183
No18.0020.0032.4323.48
Does the farmer consider information about lunar phases to be important?Yes35.00 a29.09 a56.76 b40.280.0222
No65.0070.9143.2459.72
Does the farmer obtain climate information using ancestral knowledge? Yes15.007.275.419.230.1610
No85.0092.7394.5990.77
Does the farmer obtain climate information using an almanac or agricultural calendar?Yes60.0050.9156.7655.890.5637
No40.0049.0943.2444.11
Does the farmer obtain climate information through the media, e.g., newspapers, radio, and television?Yes21.0032.7332.4328.720.2044
No79.0067.2767.5771.28
Does the farmer obtain climate information through the Internet? Yes10.0014.5510.8111.790.7424
No90.0085.4589.1988.21
Does the farmer obtain climate information through a government body or NGO? Yes1.003.640.001.550.3188
No99.0096.36100.0098.45
Does the farmer believe the sources of information regarding the climate are reliable?Yes65.0070.9167.5767.830.7974
No35.0029.0932.4332.17
p-value corresponds to the hypothesis test of the effect of groups in the generalized linear model. p-value in bold are less than the level of significance. Different letters in the rows indicate significant differences at 10% between groups for Fisher’s LSD test.
Table 6. Averages of the main variables that represent perceptions of climate change held by dairy farmers in the productive-conservationist landscape of the Ecuadorian Andes.
Variables Dairy Cattle Farmers
Small (%)Medium
(%)
Large
(%)
Average
(%)
p-Value
(%)
Has the farmer heard about global climate change? Yes65.3880.0075.6873.690.1544
No34.6220.0024.3226.31
Does the farmer know that climate change means an increase in temperature? Yes24.3638.1832.4331.660.2252
No75.6461.8267.5768.34
Does the farmer know that climate change means extreme temperatures?Yes37.1836.3645.9539.830.6046
No62.8263.6454.0560.17
Does the farmer know that climate change means sudden weather changes?Yes67.95 a52.73 b43.24 b54.640.0283
No32.0547.2756.7645.36
Does the farmer know that climate change means reduced rainfall?Yes21.7927.2729.7326.260.6047
No78.2172.7370.2773.74
Does the farmer believe that climate change is a serious problem for cattle farmers? Yes93.5996.3691.8993.950.6338
No6.4103.648.116.05
Does the farmer believe that agriculture and livestock farming are responsible, on some level, for climate change? Yes82.0592.7386.4987.090.1865
No17.957.2713.5112.91
p-value corresponds to the hypothesis test of the effect of groups in the generalized linear model. p-value in bold are less than the level of significance. Different letters in the rows indicate significant differences at 10% between groups for Fisher’s LSD test.
Table 7. Values of Spearman’s correlation coefficients between the variables of the capital theory and climate change perceptions in small- (S), medium- (M), and large-scale (L) dairy farmers in the productive-conservationist landscape of the Ecuadorian Andes.
CapitalVariableHas the Farmer Heard about Global Climate Change? (A)Climate Change MeanDoes the Farmer Believe That Livestock Farming Is Responsible, on Some Level, for Climate Change? (E)
Extreme Temperatures (B)Sudden Weather Changes (C)Reduced Rainfall (D)
SMLSMLSMLSMLSML
Human and Social
1.
Age (years)
-−0.46 ****---−0.44 ***---------
2.
Educational level
-0.26 *--0.51 ****----0.19 *-0.29 *−0.20 *--
3.
Experience in milk production (years)
-−0.36 ***---−0.27 *---------
Natural
4.
Pastureland area (ha)
0.24 **-−0.36 ***---0.25 **0.26 *-------
5.
Area of cultivated land (ha)
--0.32 *--------0.45 ***---
Financial and Physical
6.
Owns portable milking equipment
----−0.24 *----------
7.
Number of cows in production
0.21 *------0.39 ***-----0.26 *-
8.
Number of bulls
0.24 **--------------
9.
Total milk production in liters per day
0.24 **-−0.34 **-−0.37 ***--------0.22 *-
10.
Receipt of government welfare money
---------0.27 **----−0.42 ***
11.
Receipt of agricultural/livestock insurance
---------0.21 *--−0.24 **--
Asterisks (*) indicate significant correlations at * 10%, ** 5%, *** 1%, and <0.1% ****. A dash (-) indicates no significance in the correlation between the variables.
Disclaimer/Publisher’s Note: The statements, opinions and data contained in all publications are solely those of the individual author(s) and contributor(s) and not of MDPI and/or the editor(s). MDPI and/or the editor(s) disclaim responsibility for any injury to people or property resulting from any ideas, methods, instructions or products referred to in the content.

