Article

The Effects of Non-Uniformly-Aged Photovoltaic Array on Mismatch Power Loss: A Practical Investigation towards Novel Hybrid Array Configurations

by
Ahmed Al Mansur
1,*,
Md. Ruhul Amin
2,*,
Molla Shahadat Hossain Lipu
1,
Md. Imamul Islam
3,
Ratil H. Ashique
1,
Zubaeer Bin Shams
4,
Mohammad Asif ul Haq
1,
Md. Hasan Maruf
1 and
ASM Shihavuddin
1
1
Department of EEE, Green University of Bangladesh, Dhaka 1207, Bangladesh
2
Department of EEE, Islamic University of Technology, Gazipur 1704, Bangladesh
3
Department of EEE, Universiti Malaysia Pahang, Pekan 26600, Malaysia
4
Department of EEE, Sonargaon University, Panthapath, Dhaka 1215, Bangladesh
*
Authors to whom correspondence should be addressed.
Sustainability 2023, 15(17), 13153; https://doi.org/10.3390/su151713153
Submission received: 15 May 2023 / Revised: 3 July 2023 / Accepted: 14 July 2023 / Published: 1 September 2023

Abstract

:
One of the most important causes of a reduction in power generation in PV panels is the non-uniform aging of photovoltaic (PV) modules. The increase in the current–voltage (I–V) mismatch among the array modules is the primary cause of this kind of degradation. There have been several array configurations investigated over the years to reduce mismatch power loss (MPL) caused by shadowing, but there have not been any experimental studies that have specifically examined the impact of various hybrid array topologies taking PV module aging into consideration. This research examines the influence of the non-uniform aging scenario on the performance of solar PV modules with various interconnection strategies. Experiments have been carried out on a 4 × 10, 400 W array with 12 possible configurations, including three proposed configurations (LD-TCT, SP-LD, and LD-SP), to detect the electrical characteristics of a PV system. Finally, the performances of different module configurations are analyzed where the newly proposed configurations (SP-LD and LD-SP) show 15.80% and 15.94% higher recoverable energy (RE), respectively, than the most-adopted configuration (SP). Moreover, among the twelve configurations, the SP configuration shows the highest percentage of MPL, which is about 17.96%, whereas LD-SP shows the lowest MPL at about 4.88%.

1. Introduction

In urbanized and densely populated countries, wide lands to be deployed for large-scale PV plant installations are scarce [1]. Such installations often have negative impacts by reducing the availability of agricultural lands for food security [2]. It is of utmost importance that we maximize the output power from the installed PV plants [3,4], which can be ensured through smart [5] and effective initial design and regular health monitoring, together with appropriate maintenance [6]. The power generation of PV panels is often limited by mismatch power losses (MPL) due to various sources of aging factors [7]. Aging (non-uniform by its nature) [8] caused by internal and external factors can also, in turn, generate mismatching through thermal effects among the cells [9]. This cyclic effect causes a lower lifespan [10] of the PV modules, reducing the return on investments [11]. PV modules could be rearranged efficiently using hybrid interconnection schemes, maintaining health conditions [12], and enhancing PV modules’ average lifespan, and their corresponding power outputs [13].
The idea of maximizing the power output of photovoltaic arrays by reducing the amount of module power loss (MPL) [14], and module interconnection schemes, has become more prominent among many academics [15,16,17,18]. The most popular interconnection schemes are total-cross-tied (TCT) [19], bridge-linked (BL) [18], series–parallel (SP) [18], and honey-combed (HC) [20]. In addition, different hybrid array configurations [21] are also popular in the literature, such as SP-TCT, HC-TCT [22], and BL-TCT for the minimization of power losses due to non-uniform shading effects [23,24,25,26]. In [27], a simulation-based comparison was made to extract the maximum power by mitigating MPL from series (S), parallel (P), S-P, TCT, BL, and HC PV array topologies under partial shading conditions. In [17], mathematical analysis was performed among SP, TCT, BL, and HC configurations in terms of output power maximization and MPL reduction under partial shading conditions; here, the performance of the TCT configuration was superior to that of others. In [18], a simulation-based comparison was performed for SP, BL, and TCT configurations under shadow conditions using different sizes of array dimensions (2 × 6, 6 × 2, 4 × 3, and 3 × 4), where TCT configuration was performed with higher output power in all respects. In [28], different array configurations (TCT, BL, SP, HC, and HC-TCT) were experimentally investigated for partial shading conditions, where TCT configuration was performed to lower MPL.
In the work [29], four types of 44 array topologies (TCT, SP-TCT, BL-TCT, and BL-HC) were investigated for MPL minimization due to various shading scenarios using simulation software. In [30], the effectiveness of three hybrid array configurations (SP-TCT, BL-TCT, and HC-TCT), as well as four conventional array configurations (SP, TCT, BL, and HC), was examined for a reduction in mismatch loss while using various moving shading patterns. Here, the results showed that MPL depends on shading patterns and that hybrid array topologies are comparatively better in terms of MPL reduction than conventional topologies. In [31], a novel structural (NS) PV array topology was presented and compared using Simulink based software to traditional hybrid PV array topologies (SP-TCT, BL-TCT, BL-HC) in a diagonally shaded environment. NS arrangement was preferred in some circumstances of shading effects, according to simulation results in those cases. According to the literature reviewed above, which is summarized in Table 1, hybrid interconnection methods outperform traditional interconnection schemes in terms of array output power maximization and MPL minimization when operating in shadow conditions.
In general, a photovoltaic panel is a current source [32,33] where its output current, as well as output power, is directly proportional to the input irradiance level [34]. On the other hand, its output voltage is inversely proportional to the temperature [35] and remains constant during the small variation in irradiance level [36]. However, the typical rates of short-circuit current (ISC) and open circuit voltage (VOC) deterioration in an aged PV panel are 10% and 2%, respectively [37]. Consequently, there is a close connection between the ISC and the power depreciation in an old module [38]. The non-uniform aging of PV modules is compared in [39], using the highest short-circuit current while taking constant open-circuit voltage into account. A short circuit current-based module rearrangement method is proposed in [40] to maximize output power from a non-uniformly-aged PV array and is practical to use in experiments. Figure 1 shows that a PV array can generate more output power by rearranging the non-uniformly-aged modules considering short-circuit current. Thereby, the circuit current-based module rearrangement process is applied in this work to arrange the aged modules in a 4 × 10 array. Furthermore, different interconnections are applied to extract more output power from the aged PV array.
The conventional array configurations, SP, TCT, BL, and HC, are introduced in [41] to maximize the output power from a 4 × 6 aged PV array, and the results of the experiments demonstrate that this configuration delivers the maximum power. However, module rearrangement techniques are not investigated here. To the best of the authors’ knowledge, short-circuit current-based module arrangements for aged PV array modules have not yet been addressed in the literature for hybrid array topologies for unevenly aged PV arrays. By examining several hybrid array designs on aging PV arrays to extract the most power, this article tries to close the gap. Moreover, the performance of some novel hybrid configurations is also investigated in this work. Furthermore, a comparative analysis has been performed among classical and novel array configurations concerning array power generation, MPL reduction, and recoverable energy.

2. Methodology

In this work, a total of twelve array configurations were tested and compared using non-uniformly-aged 400 W PV array modules experimentally. Forty modules are arranged in a 4 × 10 array size. The rated power of each module is 10 W. A block diagram of the project is shown in Figure 2, where each configuration is used on an old PV array to interconnect the modules. A method known as short-circuit current (SCC), which is based on the reorganization of modules, is used to rearrange the array modules before the interconnection techniques are applied. To find out the short-circuit current of each array module, the experimentation is performed with the support of a commercial PV manufacturer company. After that, the aged PV modules are reinstalled on a rooftop, and outdoor test measurements are performed by a professional PV test meter, PROVA 1011. The test data are stored in the meter automatically and the data extraction process is carried out using software from the meter to a computer. Finally, the result comparisons are made considering the PV array output power, mismatch power loss, and recoverable energy.

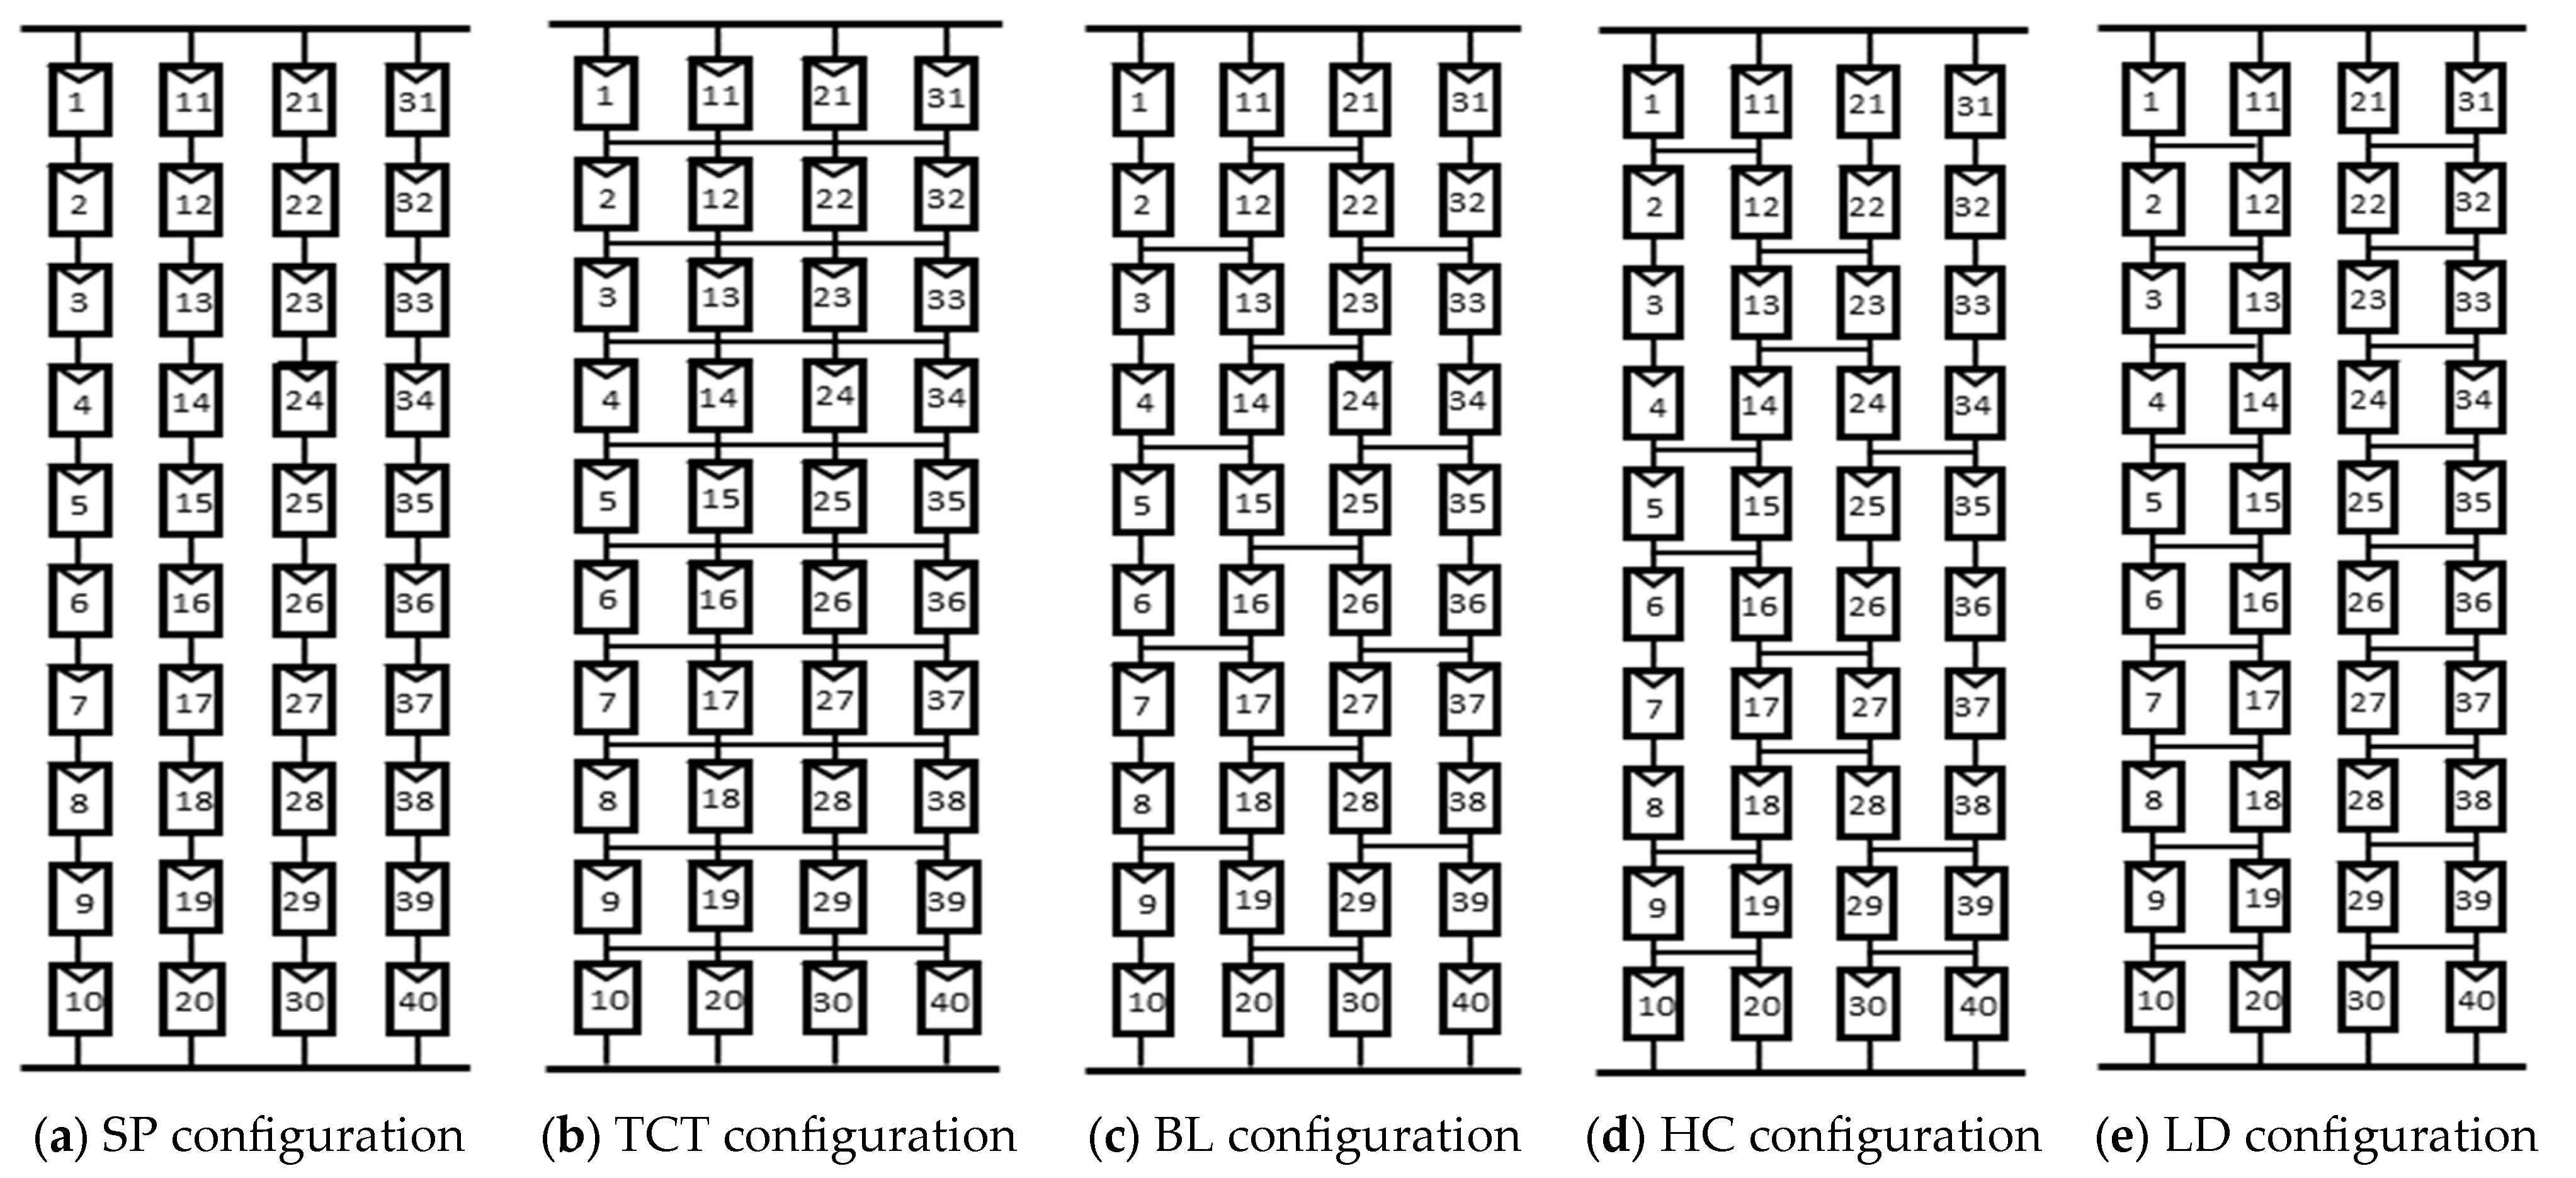
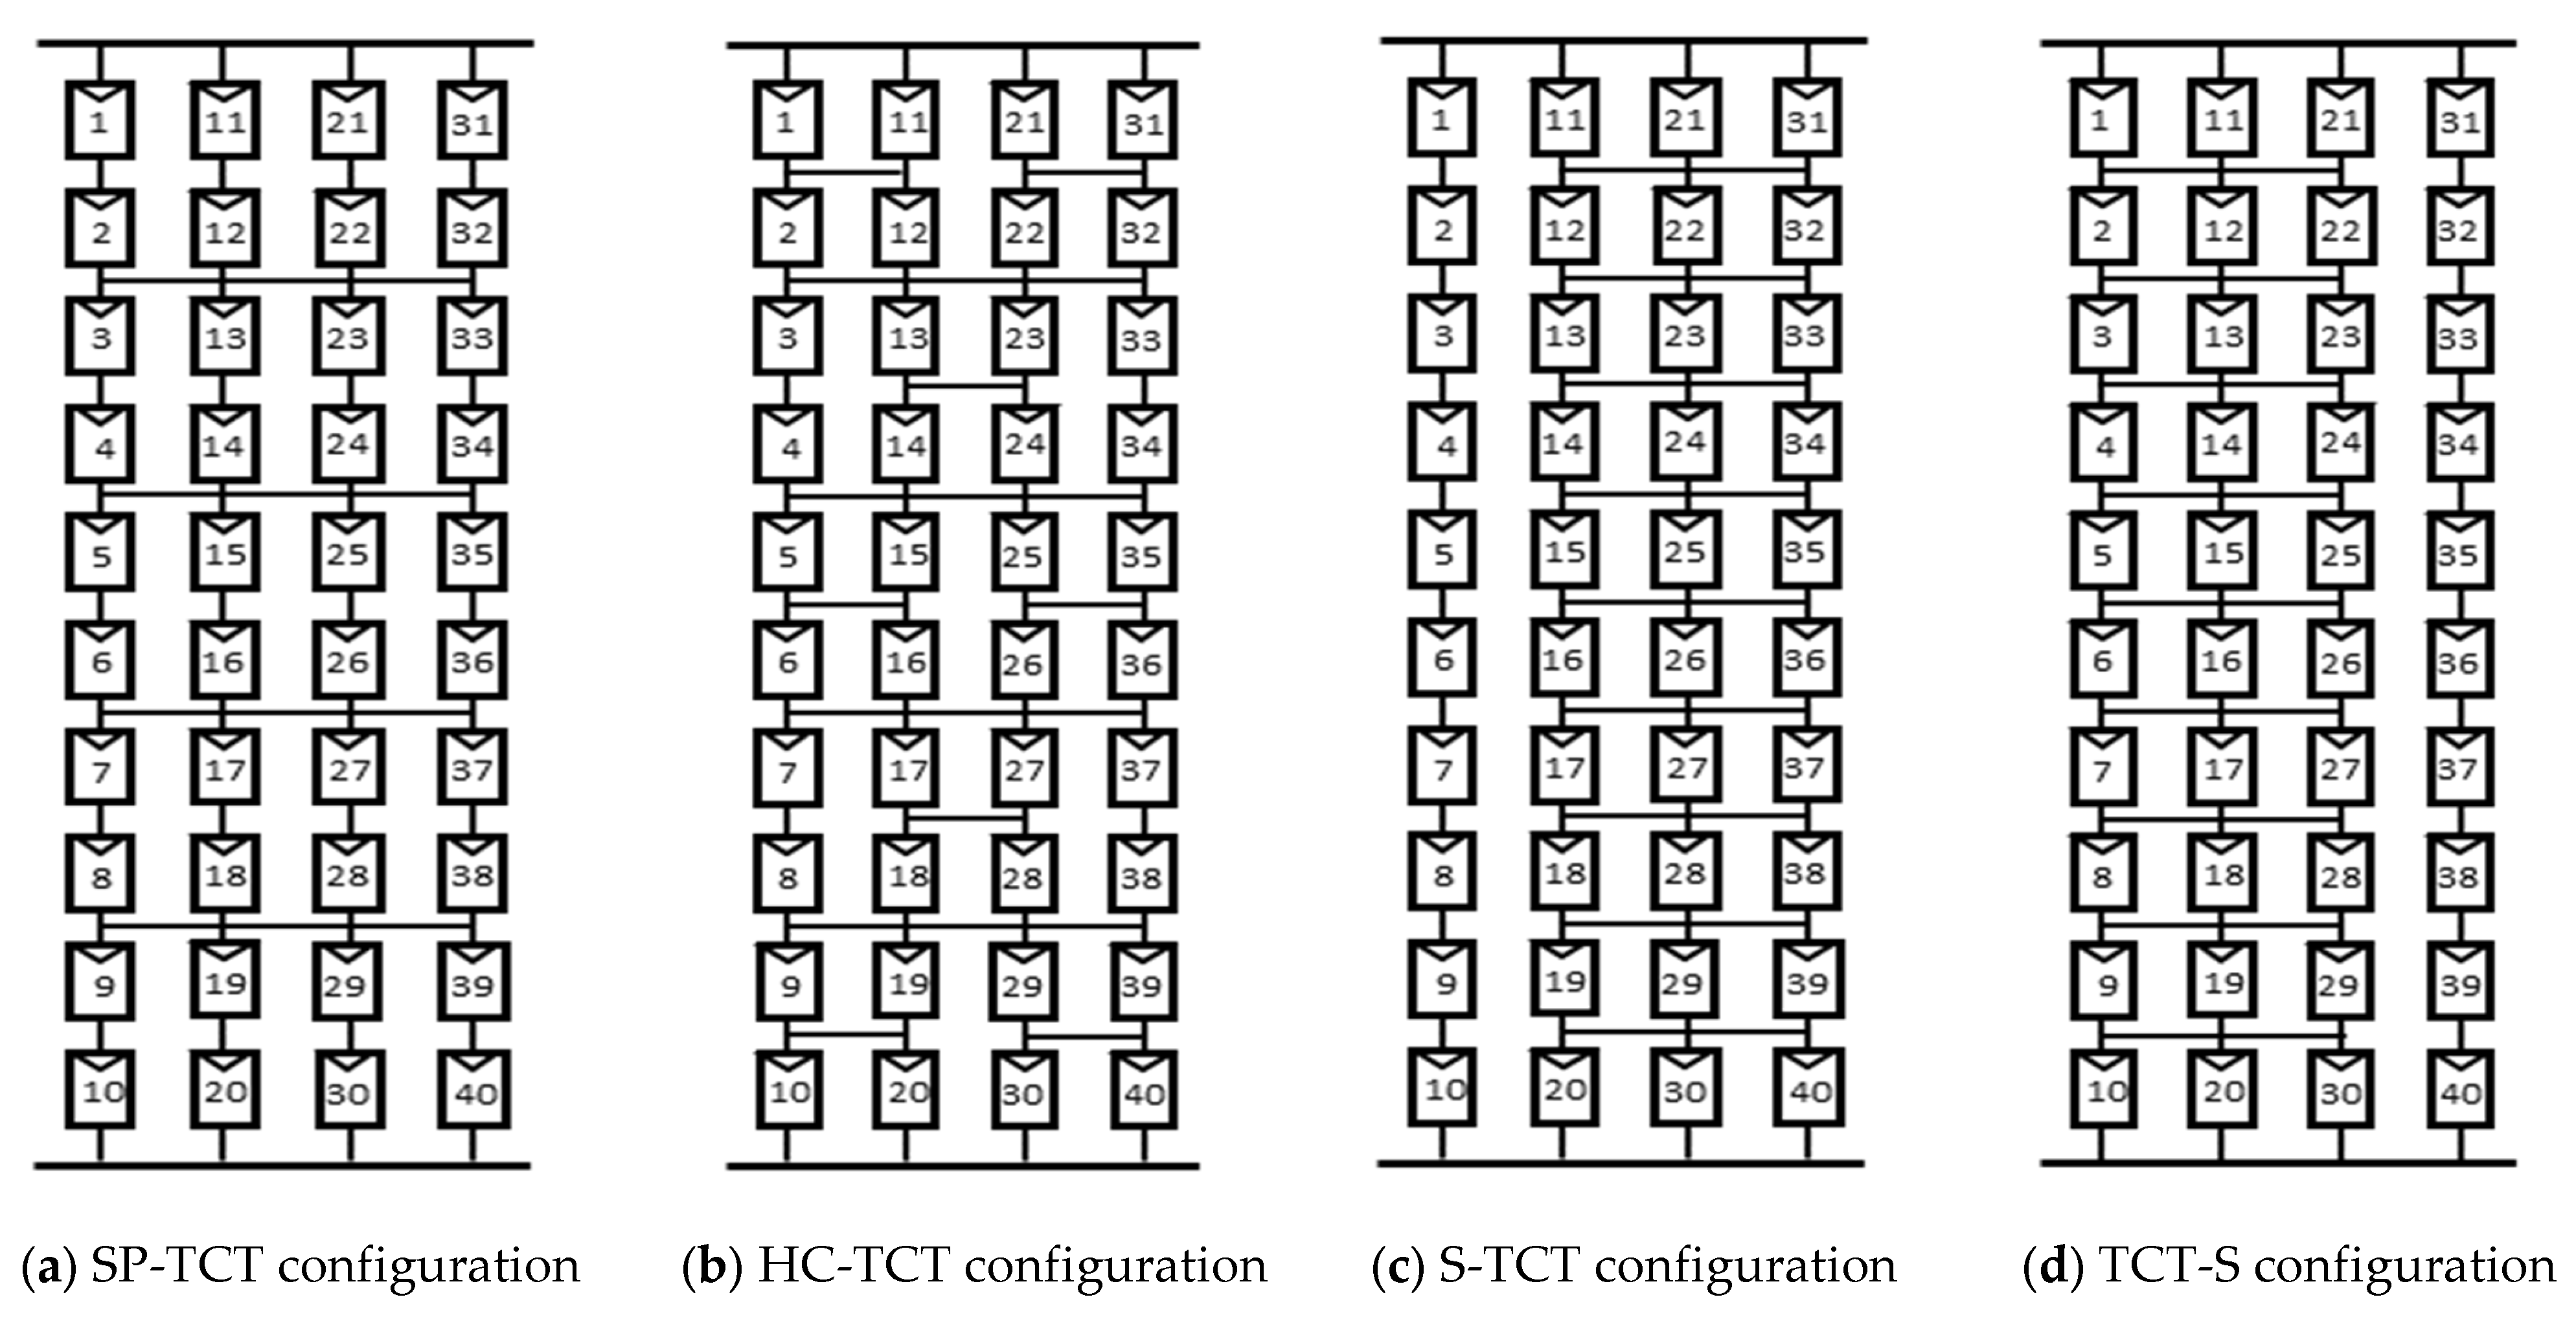
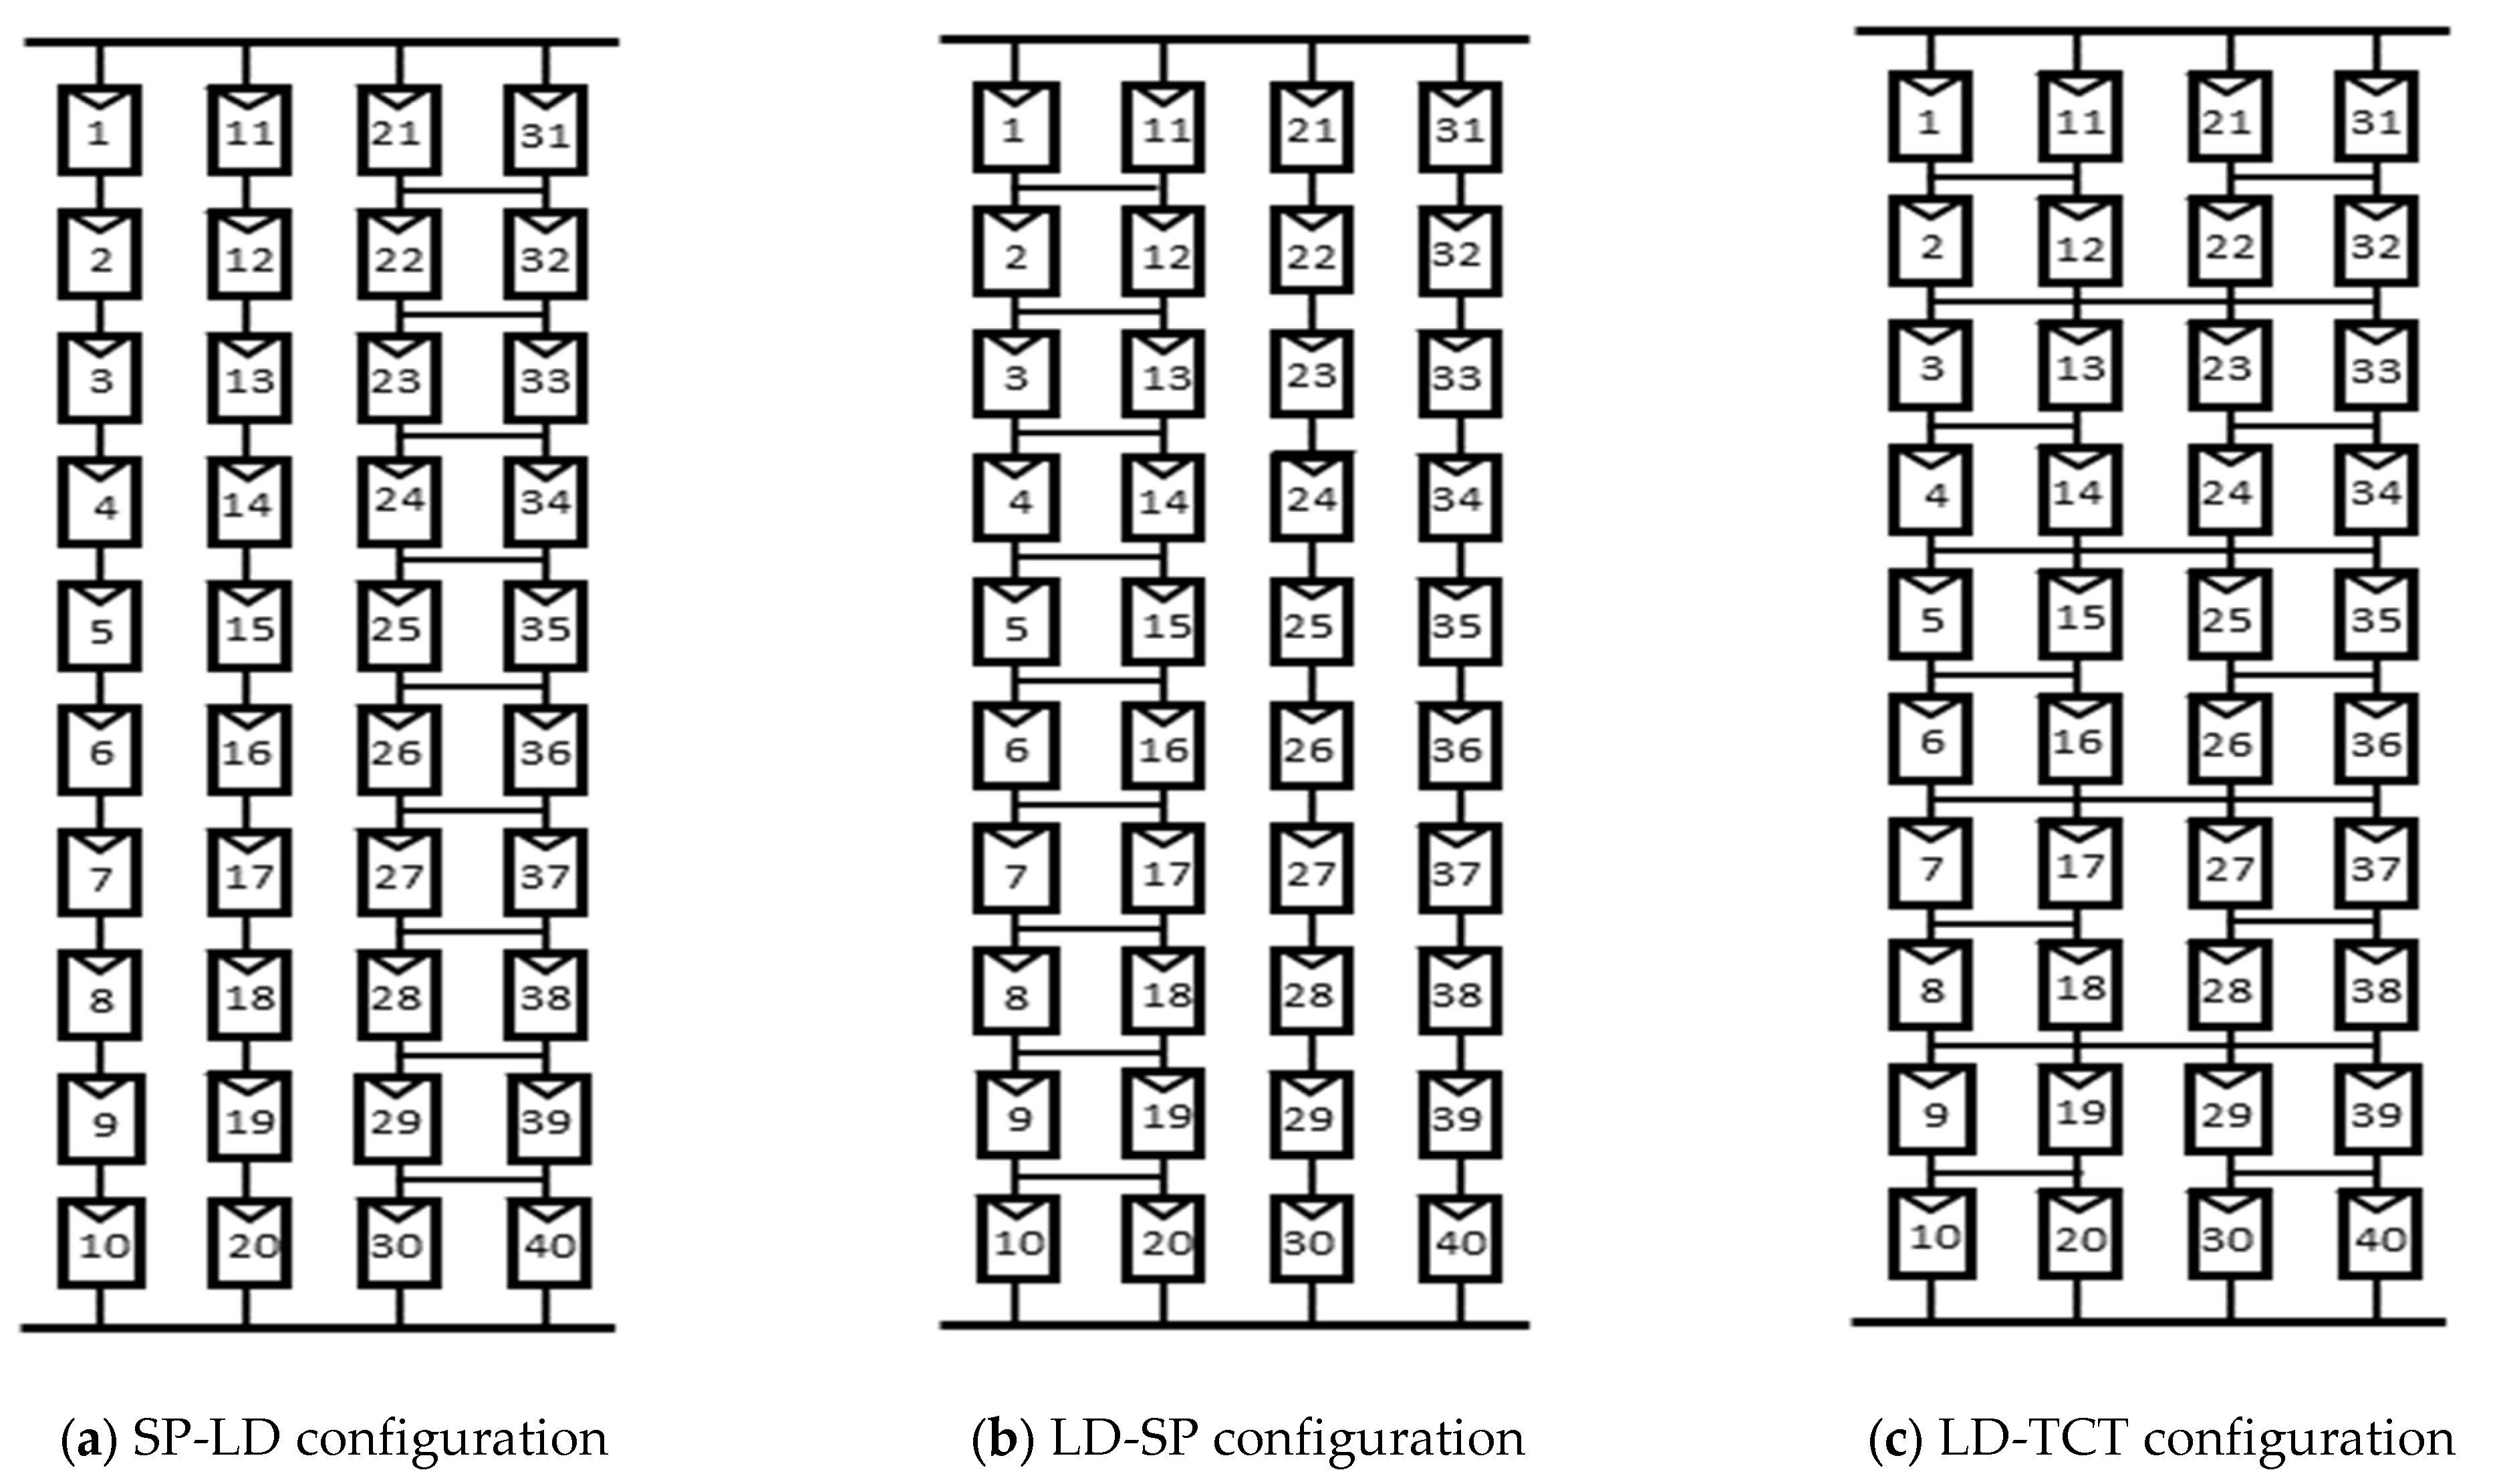
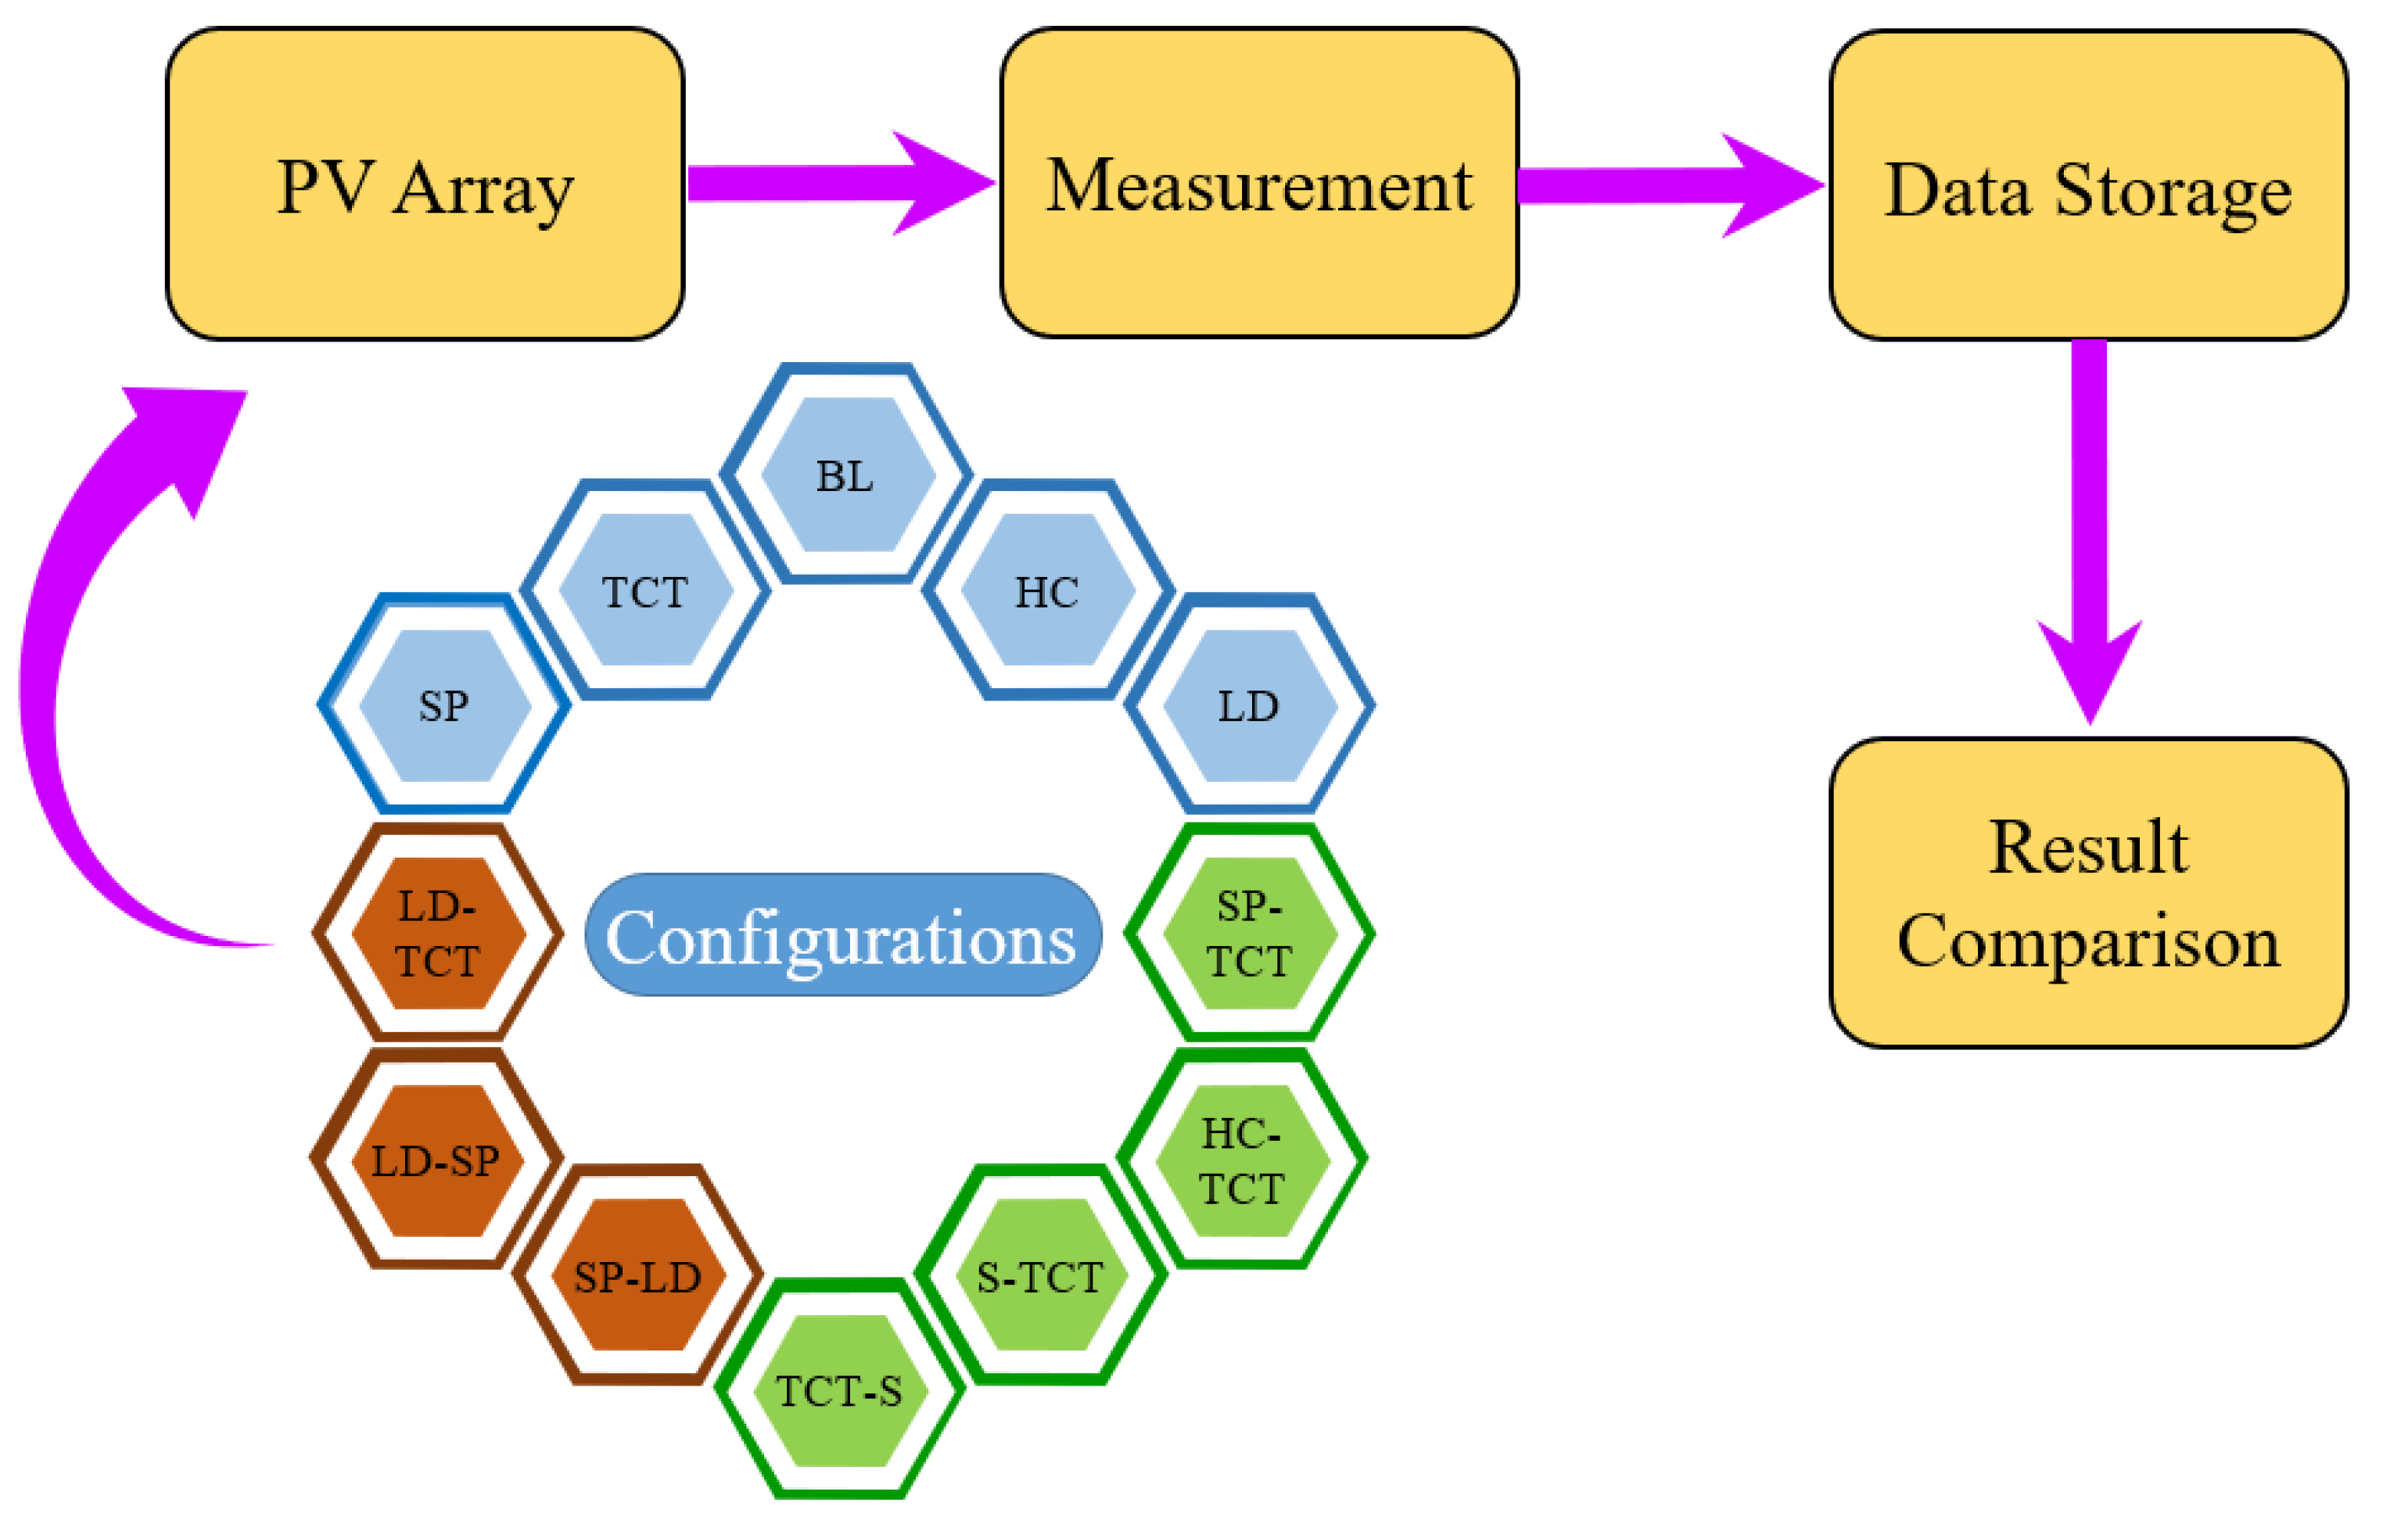
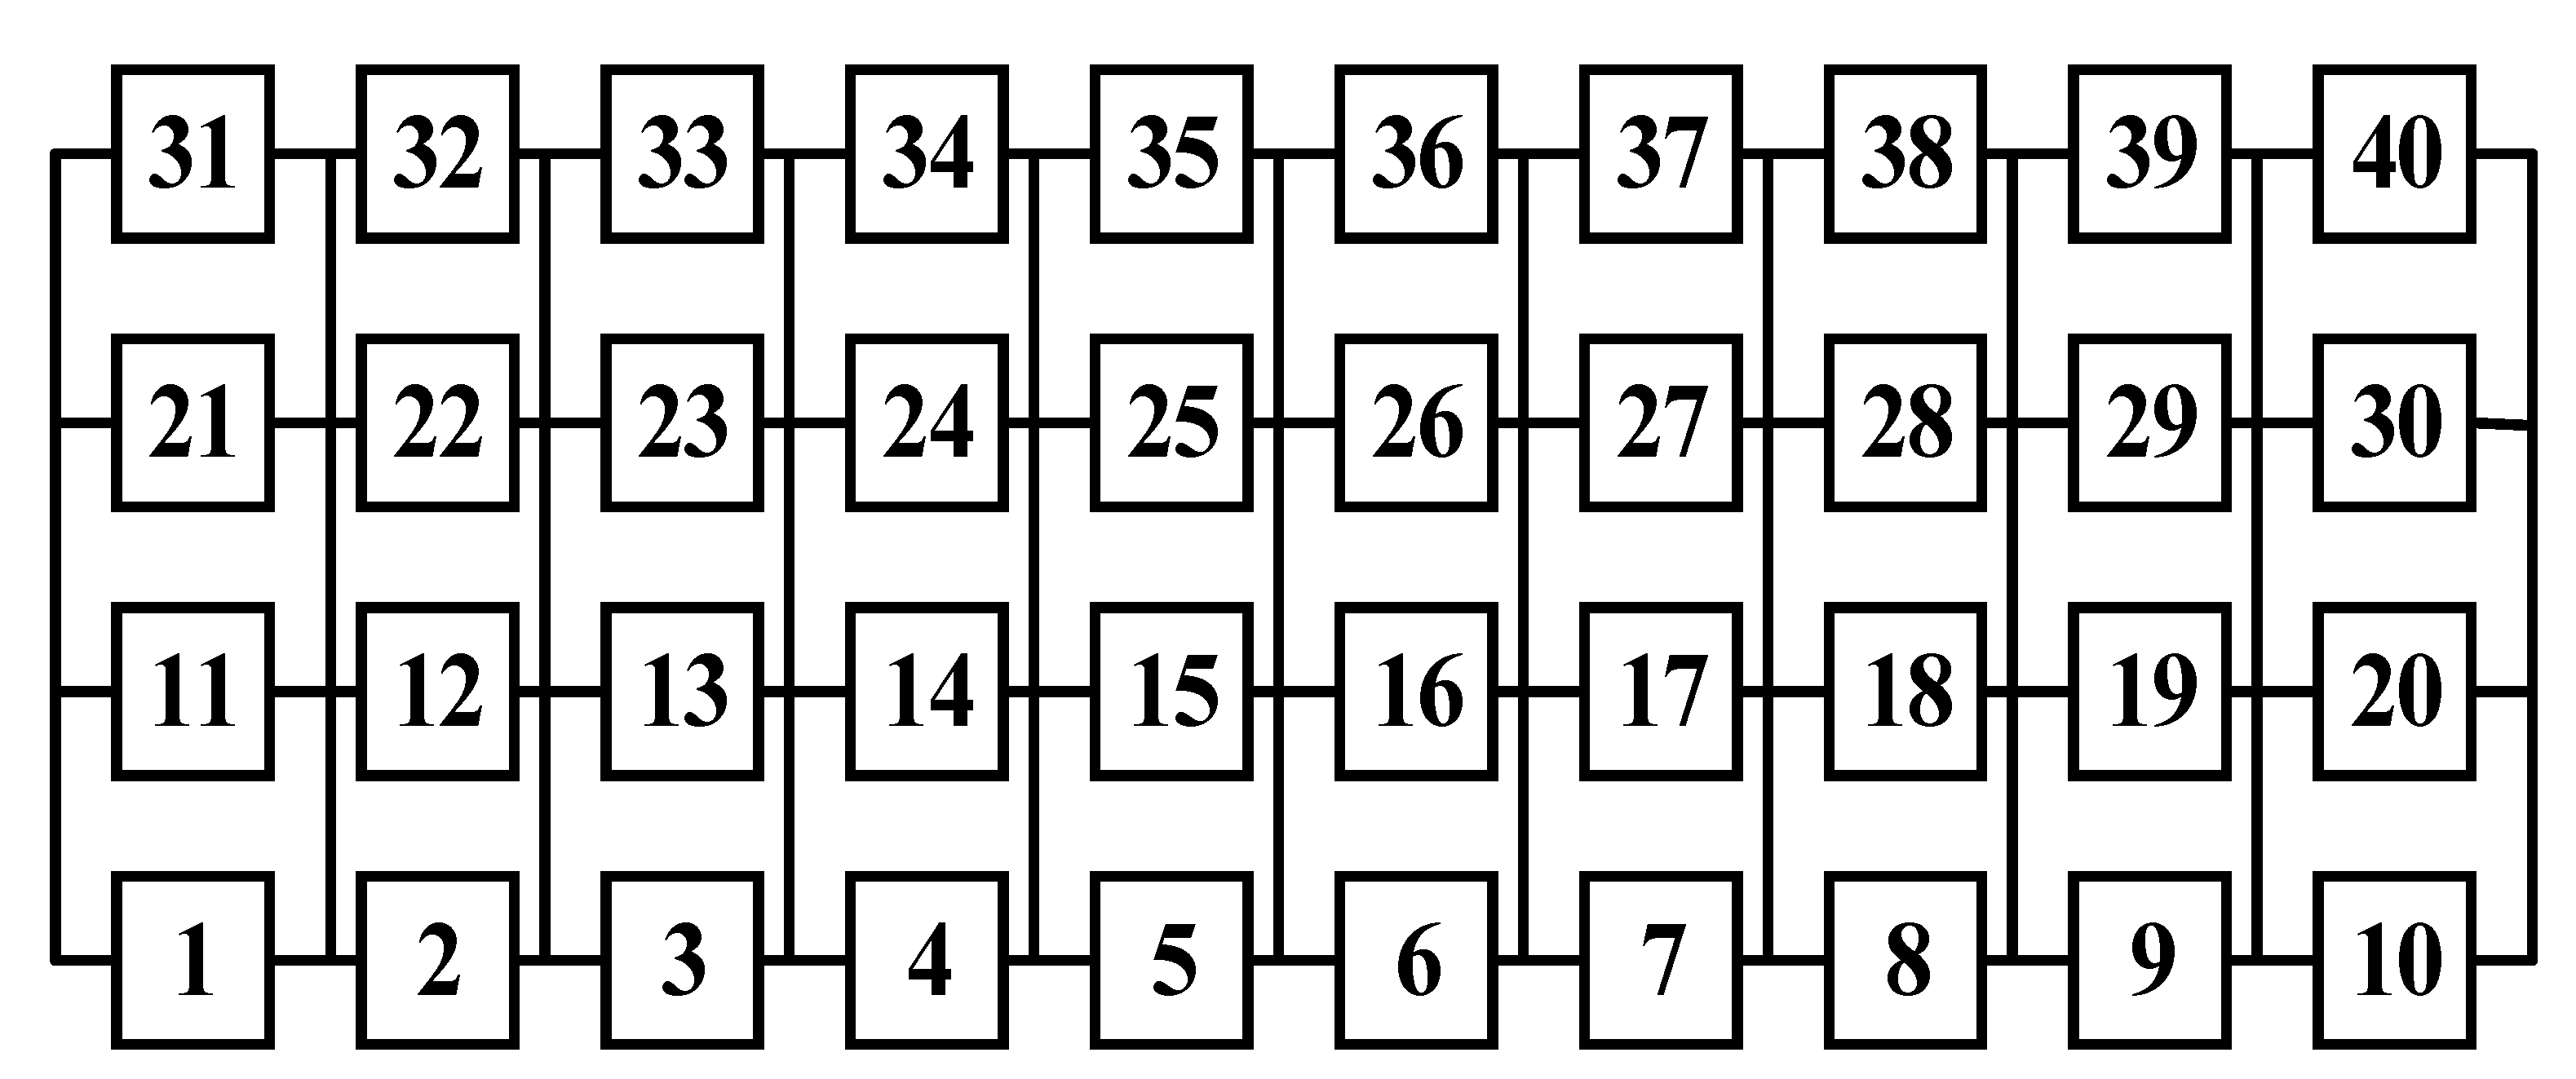
2.1. Conventional and Proposed Configurations of PV Array Module

Module interconnection in a PV array can play an important role to reduce the mismatch power loss due to the non-uniform degradation of aged PV modules. The performances of different conventional and hybrid array configurations are compared in this work experimentally. The comparisons are performed considering the output power increment and mismatch power loss reduction in the aged PV array, which is the prime objective of this work. Therefore, to implement the work, the connection diagram of the configuration is very important, which is discussed in this section. In Figure 2, the array configurations are classified into three types, standard, hybrid, and proposed hybrid array configurations, which are investigated in this work. The standard (conventional) array configurations are (a) SP (series–parallel), (b) TCT (total-cross-tied), (c) BL (bridge-linked), (d) HC (honey-combed), and (e) LD (ladder-diagram). The hybrid array configurations are (a) SP-TCT (series–parallel and total-cross-tied), (b) HC-TCT (honey-combed and total-cross-tied), (c) S-TCT (series and total-cross-tied), and (d) TCT-S (total-cross-tied and series). The proposed hybrid array configurations are (a) SP-LD (series–parallel and ladder-diagram), (b) LD-SP (ladder-diagram and series–parallel), and (c) LD-TCT (ladder-diagram and total-cross-tied).
The connection diagram of the above-mentioned PV array configurations is classified into three categories. Figure 3 shows the standard configurations for the interconnection of the 4 × 10 PV array: (a) SP, (b) TCT, (c) BL, (d) HC, and (e) LD. Figure 4 presents the hybrid configurations for the aged PV array such as (a) SP-TCT, (b) HC-TCT, (c) S-TCT, and (d) TCT-S. Figure 5 illustrates the proposed hybrid interconnections of the non-uniformly-aged 4 × 10 array: (a) SP-LD, (b) LD-SP, (c) LD-TCT.
Twelve array configurations are investigated in this work. All the interconnection schemes are tested experimentally. The module positions are pre-determined using the module rearrangement technique (SSC). The module numbering shown in the above 12 configurations is the same. However, the numbering is made lower to higher based on the short circuit current (Isc) of the modules. The tests are done in the commercial laboratory of a solar panel manufacturer company, Electro Solar Limited, in Dhaka, Bangladesh. Module position 1 specifies the PV module with the lowest value of Isc, and position 40 indicates the module with the highest value of Isc.

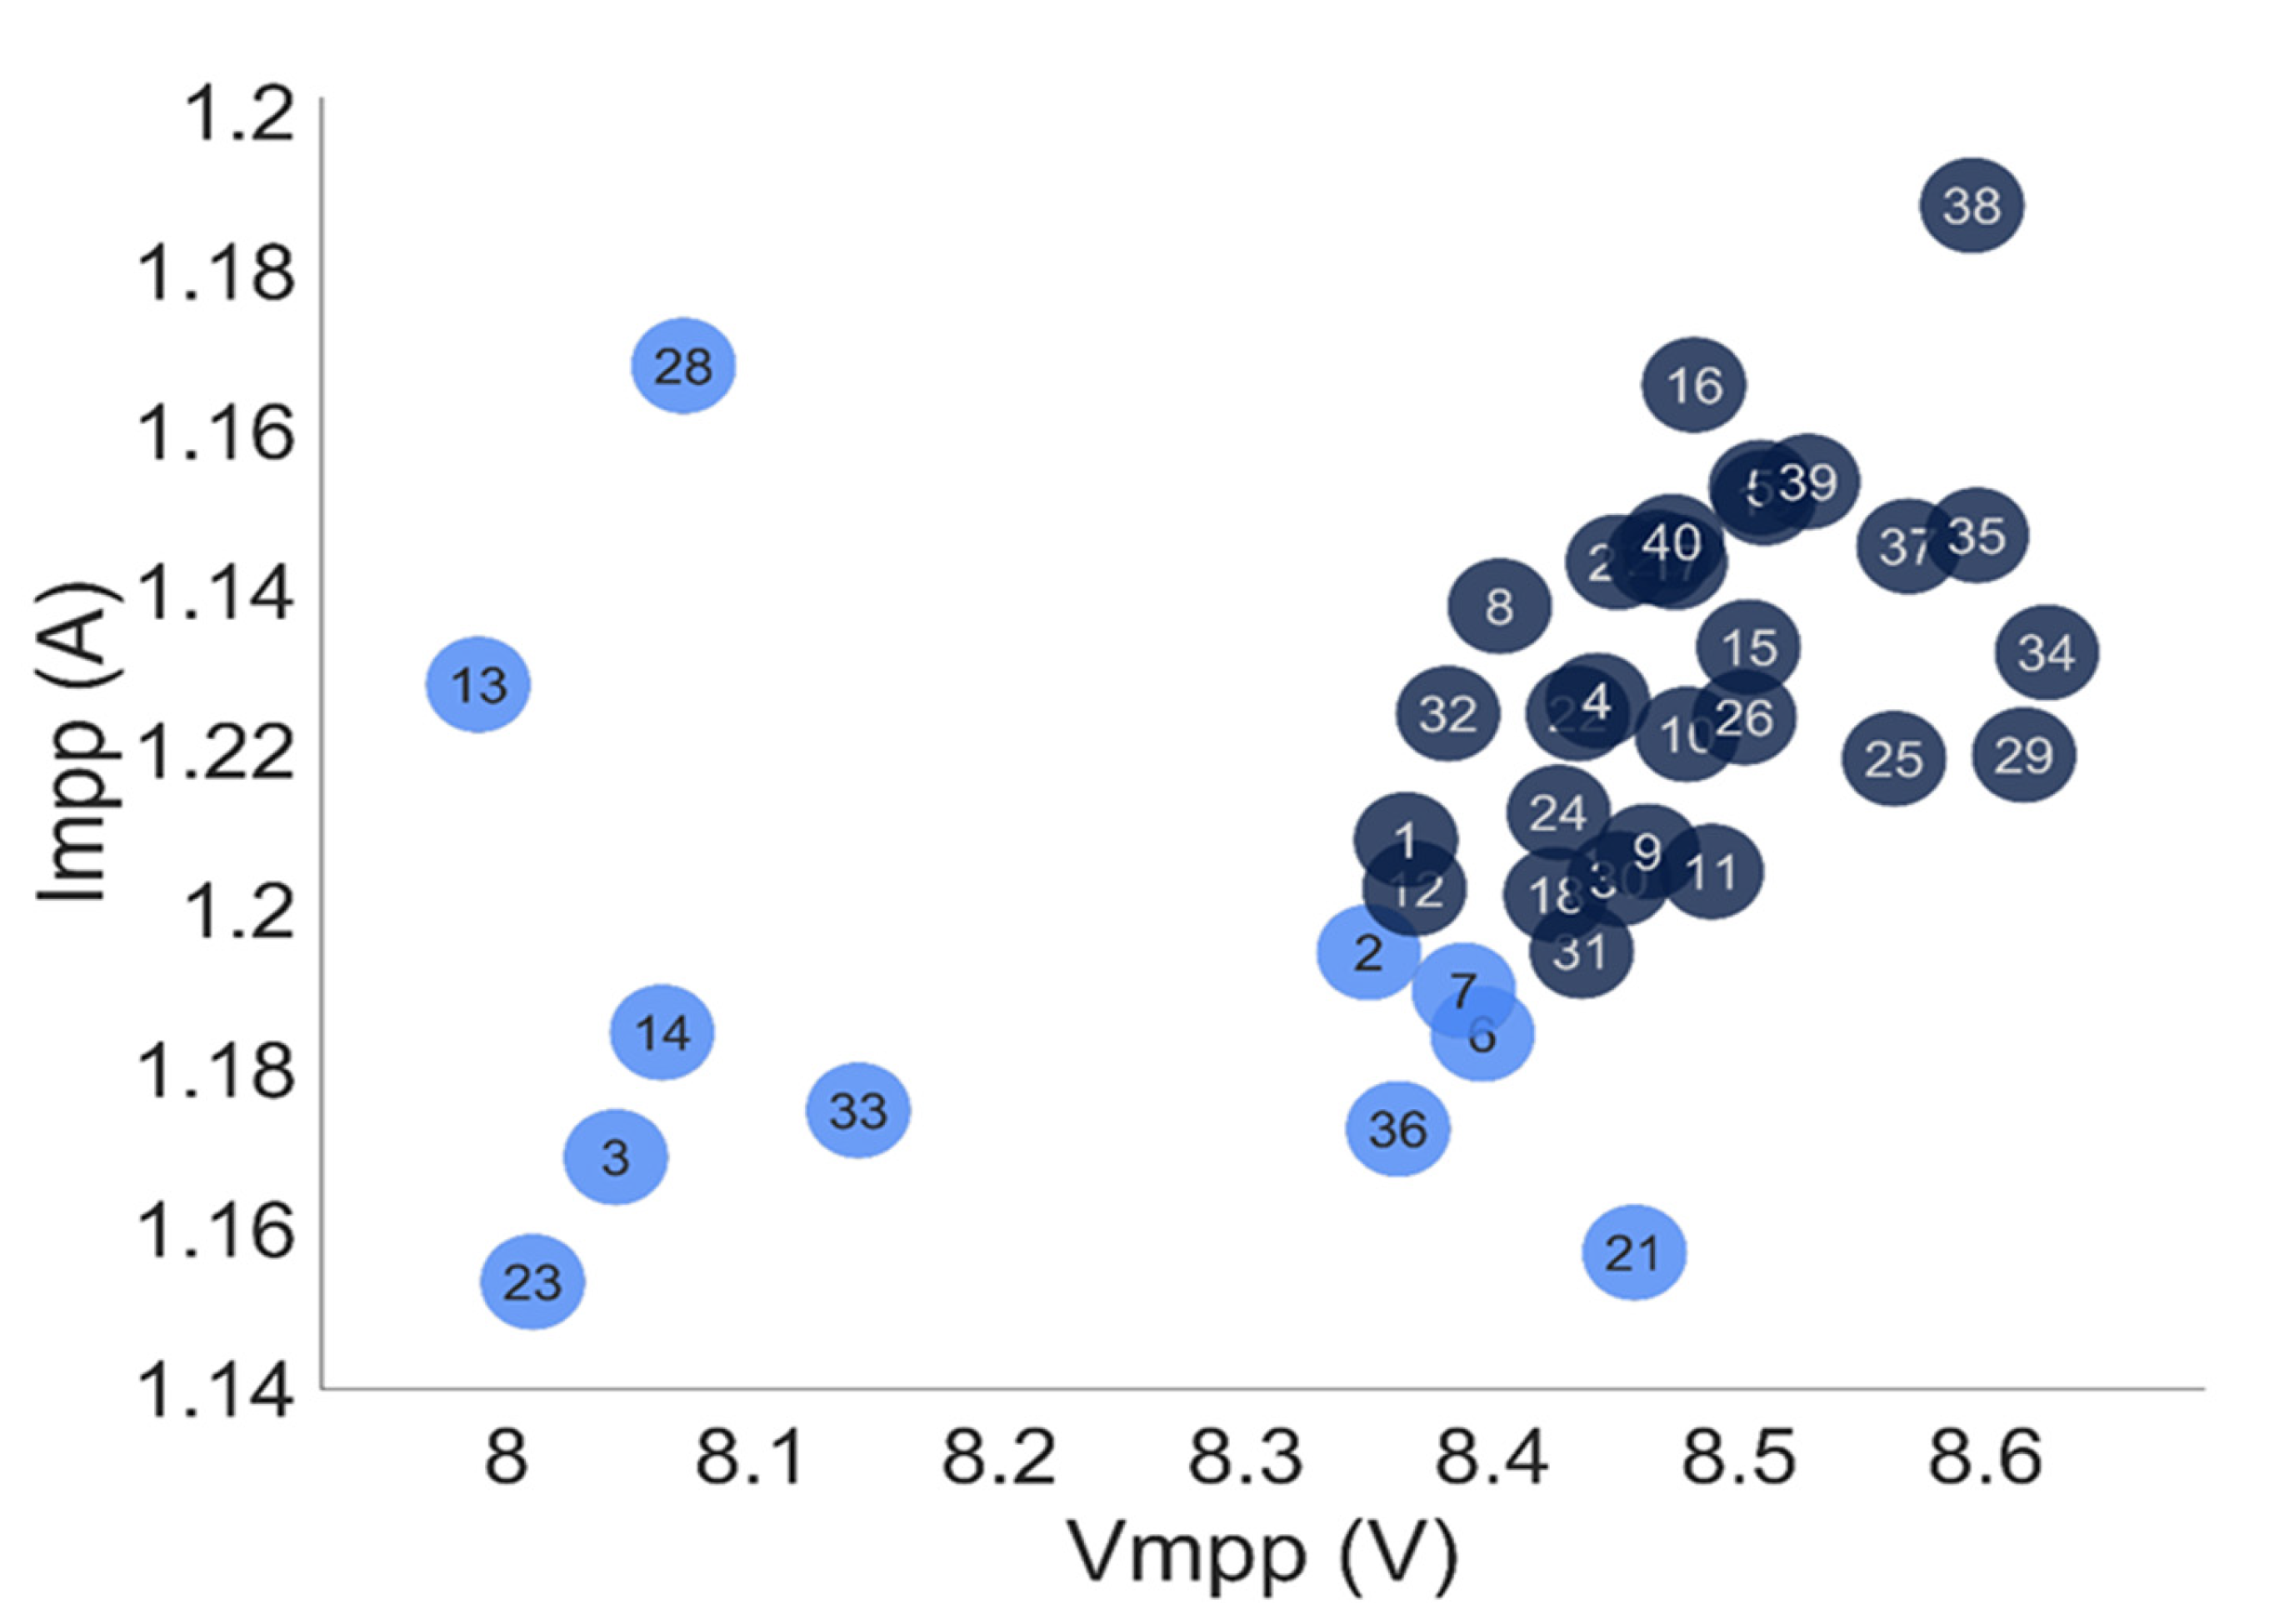
2.2. Dataset of the Tested PV Modules under Non-Uniform Aging Conditions

The percentage of MPL in PV arrays with non-uniform aging is examined in this study, employing 40 polycrystalline PV modules in twelve (12) different configurations. The non-uniform aging state of photovoltaic panels was caused by exposing the PV panel to outdoor weather conditions for four years. The aged PV modules are tested in a PV manufacturer company. The corresponding electrical characteristics are measured using a commercial PV testing simulator system by maintaining the IEC 60904-1 standard [42,43]. The testing process is shown in Figure 6. The tested data are converted at STC (25 °C, 1000 W/m2, AM 1.5 G) using the simulator’s built-in software system. According to the solar manufacturer, the conversion of the tested data from normal operating condition (OPC) to standard test condition (STC) has been made by the simulator using the IEC Standard 60904-1. The tested datasets are tabulated in Table 2. The electrical characteristics (Vmpp, Impp, Pmpp, Voc, Isc, and FF) [44] of each PV module are shown here. Figure 7 illustrates the correlation between the Vmpp and Impp of the non-uniformly-aged PV modules dataset, where the most degraded PV modules are characterized by blue color. The voltage and current ratings are decreased from their rated values due to different non-uniform aging factors such as discoloration, delamination, cell crack, hotspot, permanent soiling, corrosion, back sheet damage, junction box damage, and glass crack.

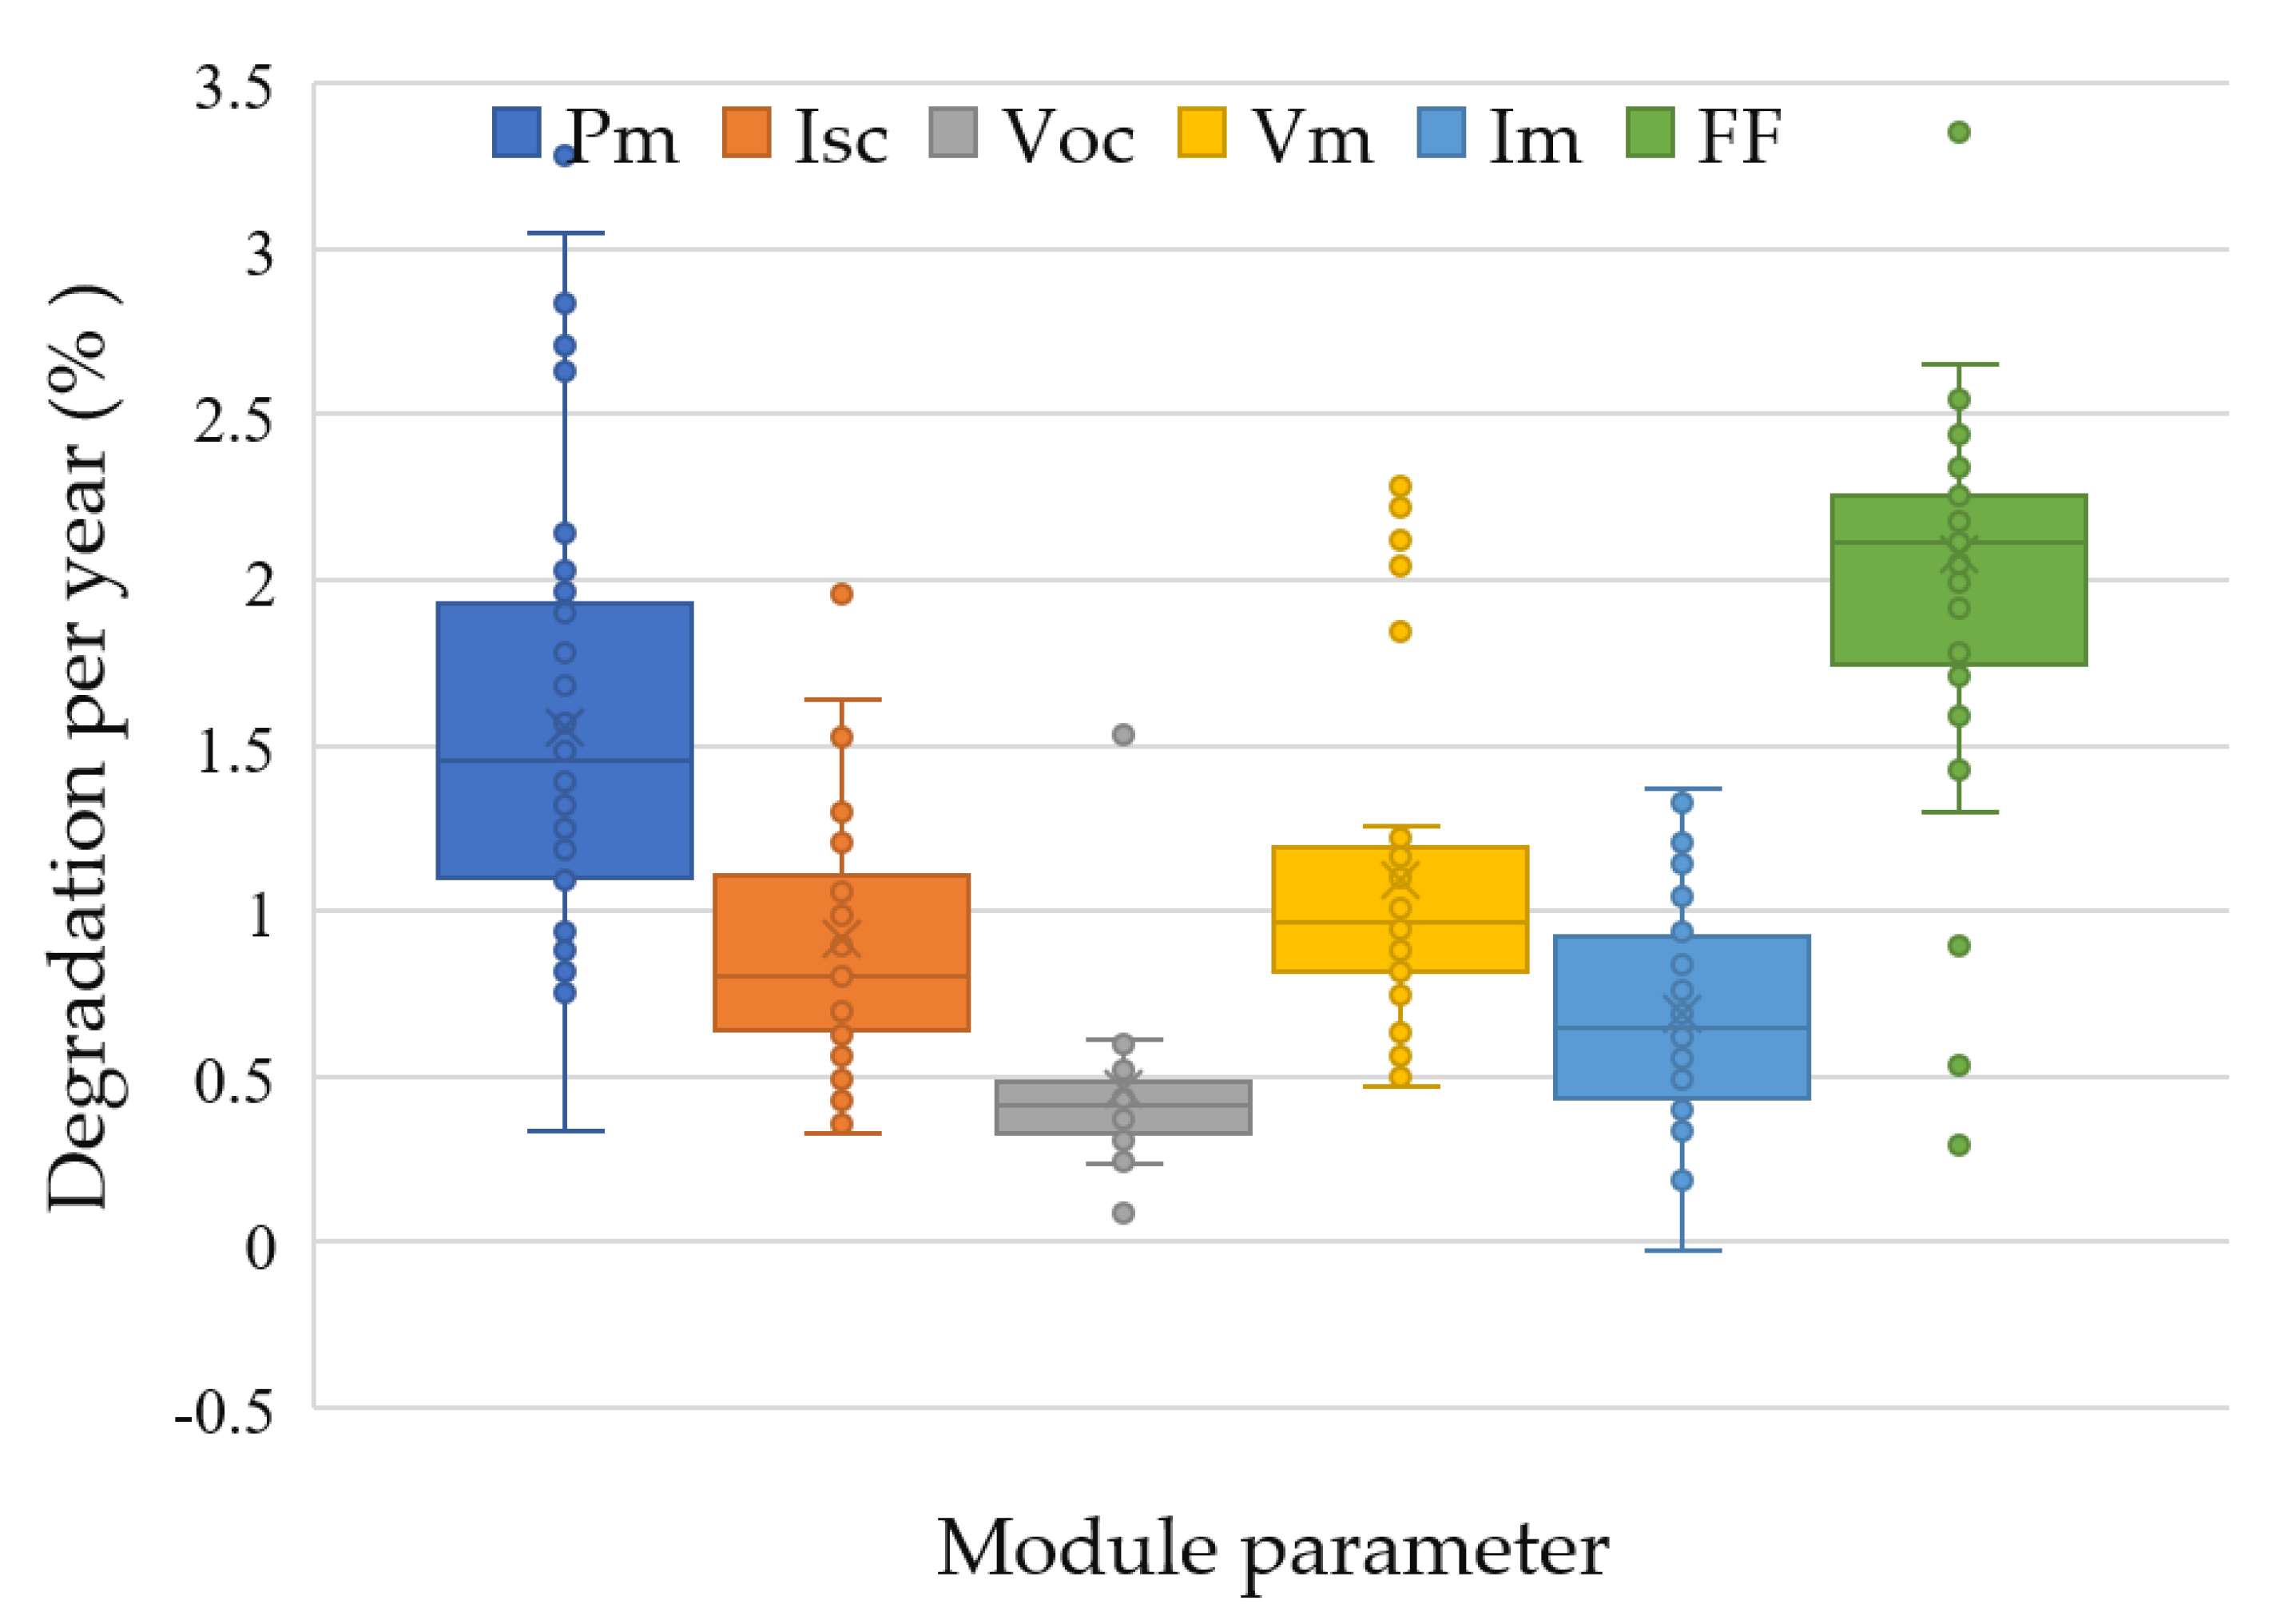
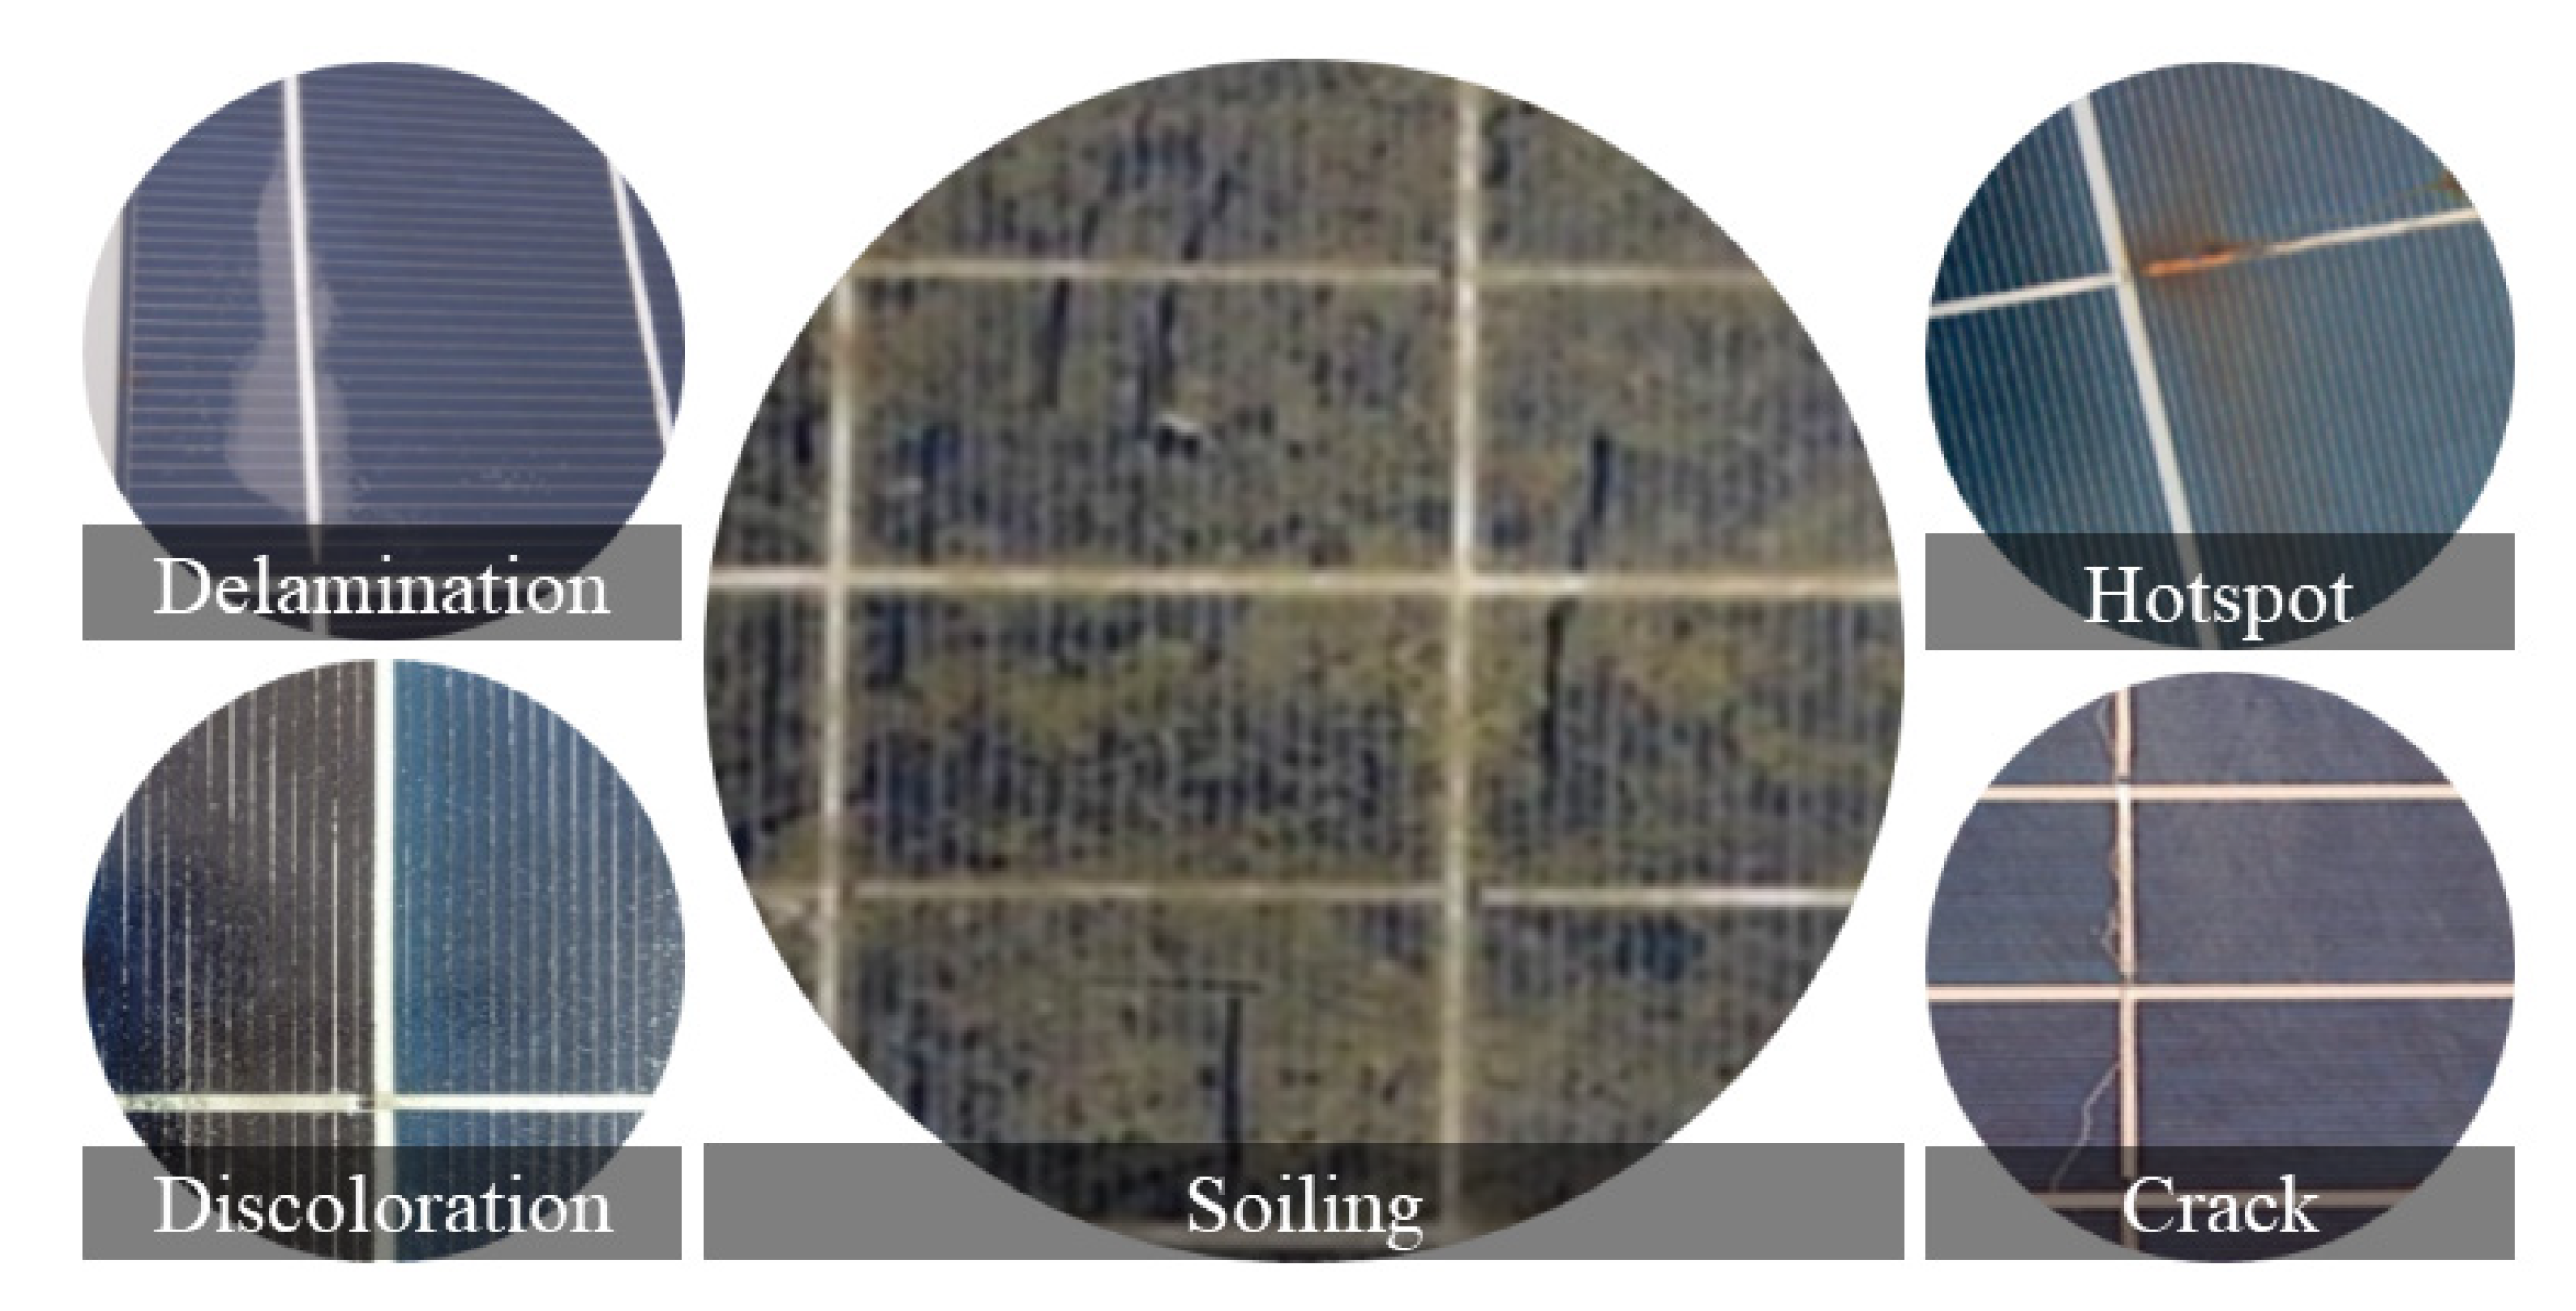
2.3. Calculation of Degradation Rate and Identification of Aging Factors

The degradation rate of the four-years-aged photovoltaic modules is calculated using the following Equation (1).
D e g r a d a t i o n   r a t e   p e r   y e a r   % = X n e w m o d u l e X a g i n g m o d u l e X n e w m o d u l e × 100 y e a r
where X is the PV module electrical parameter, such as Voc, Isc, Vm, Im, Pm, or FF. X n e w m o d u l e represents the parameter value at the new condition, and X a g i n g m o d u l e represents the parameter after four years of the aging condition. Figure 8 illustrates the degradation rate of the maximum power (Pm), short circuit current (Isc), open circuit voltage (Voc), maximum power point voltage (Vm), maximum power point current (Im), and fill factor (FF). The maximum deviation of the degradation rate is obtained for Pm, while the minimum is obtained for Voc. The degradation rate of FF is higher than for others because it depends on the degradation of both voltage and current parameters [45]. The formula of the fill factor [46] is shown in Equation (2). The power output of the PV module is directly proportional to the short-circuit current [18]. Therefore, the degradation rate of Pm is higher because the degradation of Isc is significantly higher than Voc.
F F = V m × I m V o c × I s c
The non-uniform aging factors of the four-year-old PV modules were determined using image-based diagnosis. All forty PV modules were tested, and different types of aging factors were found such as delamination, discoloration, hotspot, cell crack, corrosion, junction box damage, permanent dust or soiling, discoloration of glass, back sheet discoloration, and corrosion in the cooper connector inside the junction box. The most common aging factors were discoloration, delamination, soiling, cell crack, and a minor hotspot. Figure 9 shows the very common aging factors. However, discoloration is the most significant in all 40 modules. The size of the delamination is not that significant because the aging period was only 4 years. On the other hand, the soiling and discoloration of glass represent another common factor for all modules. However, regular cleaning can reduce these types of aging degradation. Moreover, small cell cracks and minor sizes of hotspots are commonly found in the aged modules.
In summary, it is very important to mention that the degradation rate of each parameter is calculated using the dataset of all tested PV modules under new and aging conditions. After four years of aging, it was found that the power degradation range is 1.1% to 1.9%. Therefore, the mismatch power loss occurs significantly in the aged PV array after a certain period of installation. The reasons behind this non-uniform aging and mismatching in the power outputs of the array modules are also identified in this subsection. The most common aging factors are identified in Figure 9, which are the key sources of non-uniform aging and mismatch power losses in aged PV arrays.

2.4. PV Module Arrangement Process Based on SCC Technique

In this method, the older PV modules have been organized following their short circuit current (SCC) [13]. As a result of the non-uniform aging condition, the ISC degraded in the aged PV panels. The SCC-based module arrangement approach has gained popularity in recent years due to its ability to decrease mismatch power loss while also improving branch current and output power. This is an easy process considering the array connection and experimental implementation [38]. Consider that a 4 by 10 size array with a total-cross-tied (TCT) array construction is made up of 40 modules, as shown in Figure 10. The following approach is used to apply the technique. The pre-collected dataset’s ISC for the modules is calculated, and the resulting values are organized ascendingly.
I S C 1 I S C 2   I S C 3 I S C 40
The ISC values have been sorted from lower to higher values, with module 1 having the lowest value ( I S C 1 ) and module 40 having the greatest value ( I S C 40 ). As a result, from the first row to the last row, the current progressively increases. As a result, the array current increases, which also raises the array power.

3. Experimental Work

The position of the solar panel experimental setup needed to be carefully considered to ensure the constant gathering of experimental data. The solar PV array was installed on a rooftop that received sufficient sunlight. Using traditional PV panel installation techniques, the optimal orientation for the installation area was identified. The south-facing orientation with a tilt angle of 23° was the ideal orientation for the site. A total of 40 solar PV modules with 10 W rated capacities were used to create the 400 W installed PV array for the experimental work. They were all polycrystalline photovoltaic modules. The panel manufacturers verified each module at the source, and reliability testing was performed using a manufacturer data set. The datasets are mentioned in the above sections and have already been published in Data in Brief. To test PV array performance from multiple array configurations without changing the position of the modules, the interconnection mechanisms between the PV modules needed to be versatile. To meet this demand, the terminals of each PV module were equipped with red and black crocodile clips. This enabled the reconfiguration of connections between modules, without having to modify the location of the modules while maintaining the proper polarity of the connections. Figure 11 shows the experimental setup, where 40 PV modules are placed in a 4 × 10 array size. A solar panel test meter PROVA 1011 is connected to the array output terminals. Irradiance sensors and temperature sensors are connected to the meter. A solar panel test meter PROVA 1011 is connected to the array output terminals. Irradiance sensors and temperature sensors are connected to the meter. The pertinent features of PROVA 1011 are presented in Table 3.

3.1. Experimental Procedure of PV Array Power Measurement in Outdoor Conditions

For the validation and comparability of the research, it was essential to make sure that the standard testing conditions (STC) were maintained during the data collection, according to the IEC standard [42], which requires that solar irradiation is over 800 W/m2 at 25 degrees Celsius. In the test environment of this study, each dataset was collected above the required irradiation level just mentioned. This was ensured by collecting the data at the time of the day when sunlight availability was very high. Moreover, the PV analyzer used in this study automatically and instantaneously converted the collected data to values corresponding to 1000 W/m2 irradiation at a 25-degree Celsius temperature. Since all the collected data are converted to this level, the data of different configurations are comparable under the same testing conditions. It must also be mentioned that the IEC standard requires that the parameters must be measured within a 1 min duration, while the variation in temperature cannot exceed 2 degrees Celsius. The PV analyzer used for this study completes the collection of one set of data within 15 s; so, the temperature remains nearly constant within the measurement period, thus meeting the IEC standard requirement.

3.2. Analysis of Experimental Results

This section analyzes the outcomes of the experiment. Table 4 shows the output voltage, current, and power of the 4 × 10 array obtained by using twelve array configurations. Among the standard array configurations (SP, TCT, BL, HC, and LD), the maximum output power is 342.18 W obtained via HC configurations, and the minimum power is 298.36 W obtained via SP configuration. Among the hybrid array configurations (HC-TCT, LD-TCT, TCT-S, S-TCT, SP-LD, LD-SP, and SP-TCT), the maximum power output is 345.91 W generated by the LD-SP configuration. Figure 12 shows that SP-LD and LD-SP configurations are outperforming in regard to output power. Figure 13 summarizes the MPL% values of all twelve array configurations, where SP configuration shows poor performance with 17.96% losses while LD-SP configuration shows only 4.88% losses. The experimental findings demonstrate the superiority of the LD-SP configuration over other ones for its lowest MPL% while producing the highest output power. The percentage of recoverable energy (%RE) is calculated for each configuration concerning the most used SP configuration. The values of %RE are also tabulated in Table 4. The maximum %RE is 15.94% achieved using LD-SP configuration. The percentage of mismatch power loss (MPL %) is calculated using the following equations.
M P L % = P m o d u l e P a r r a y P m o d u l e × 100
P m o d u l e = P m o d u l e 1 + P m o d u l e 2 + + P m o d u l e 40
P a r r a y = V a r r a y × I a r r a y
where the summation of all module power, P m o d u l e , is calculated using Equation (5). The module power of each module is found from the tested dataset of four years of aged PV modules. The array output power, P a r r a y , is calculated using Equation (6), where the array voltage and current are obtained from the measured value using a PROVA 1011 analyzer.
The recoverable energy is calculated using the following Equation (7).
% R E C O N = P o _ C O N P o _ S P P o _ S P × 100
where the percentage of recoverable energy for any configuration is presented by % R E C O N . All configurations are denoted by CON and the output power obtained by using any configuration is P o _ C O N . The output power of the most conventional SP configuration is P o _ S P .

3.3. Validation of Experimental Results

The following actions have been conducted to validate the proposed novel hybrid array configurations to mitigate the mismatch power loss for a non-uniformly-aged photovoltaic array:
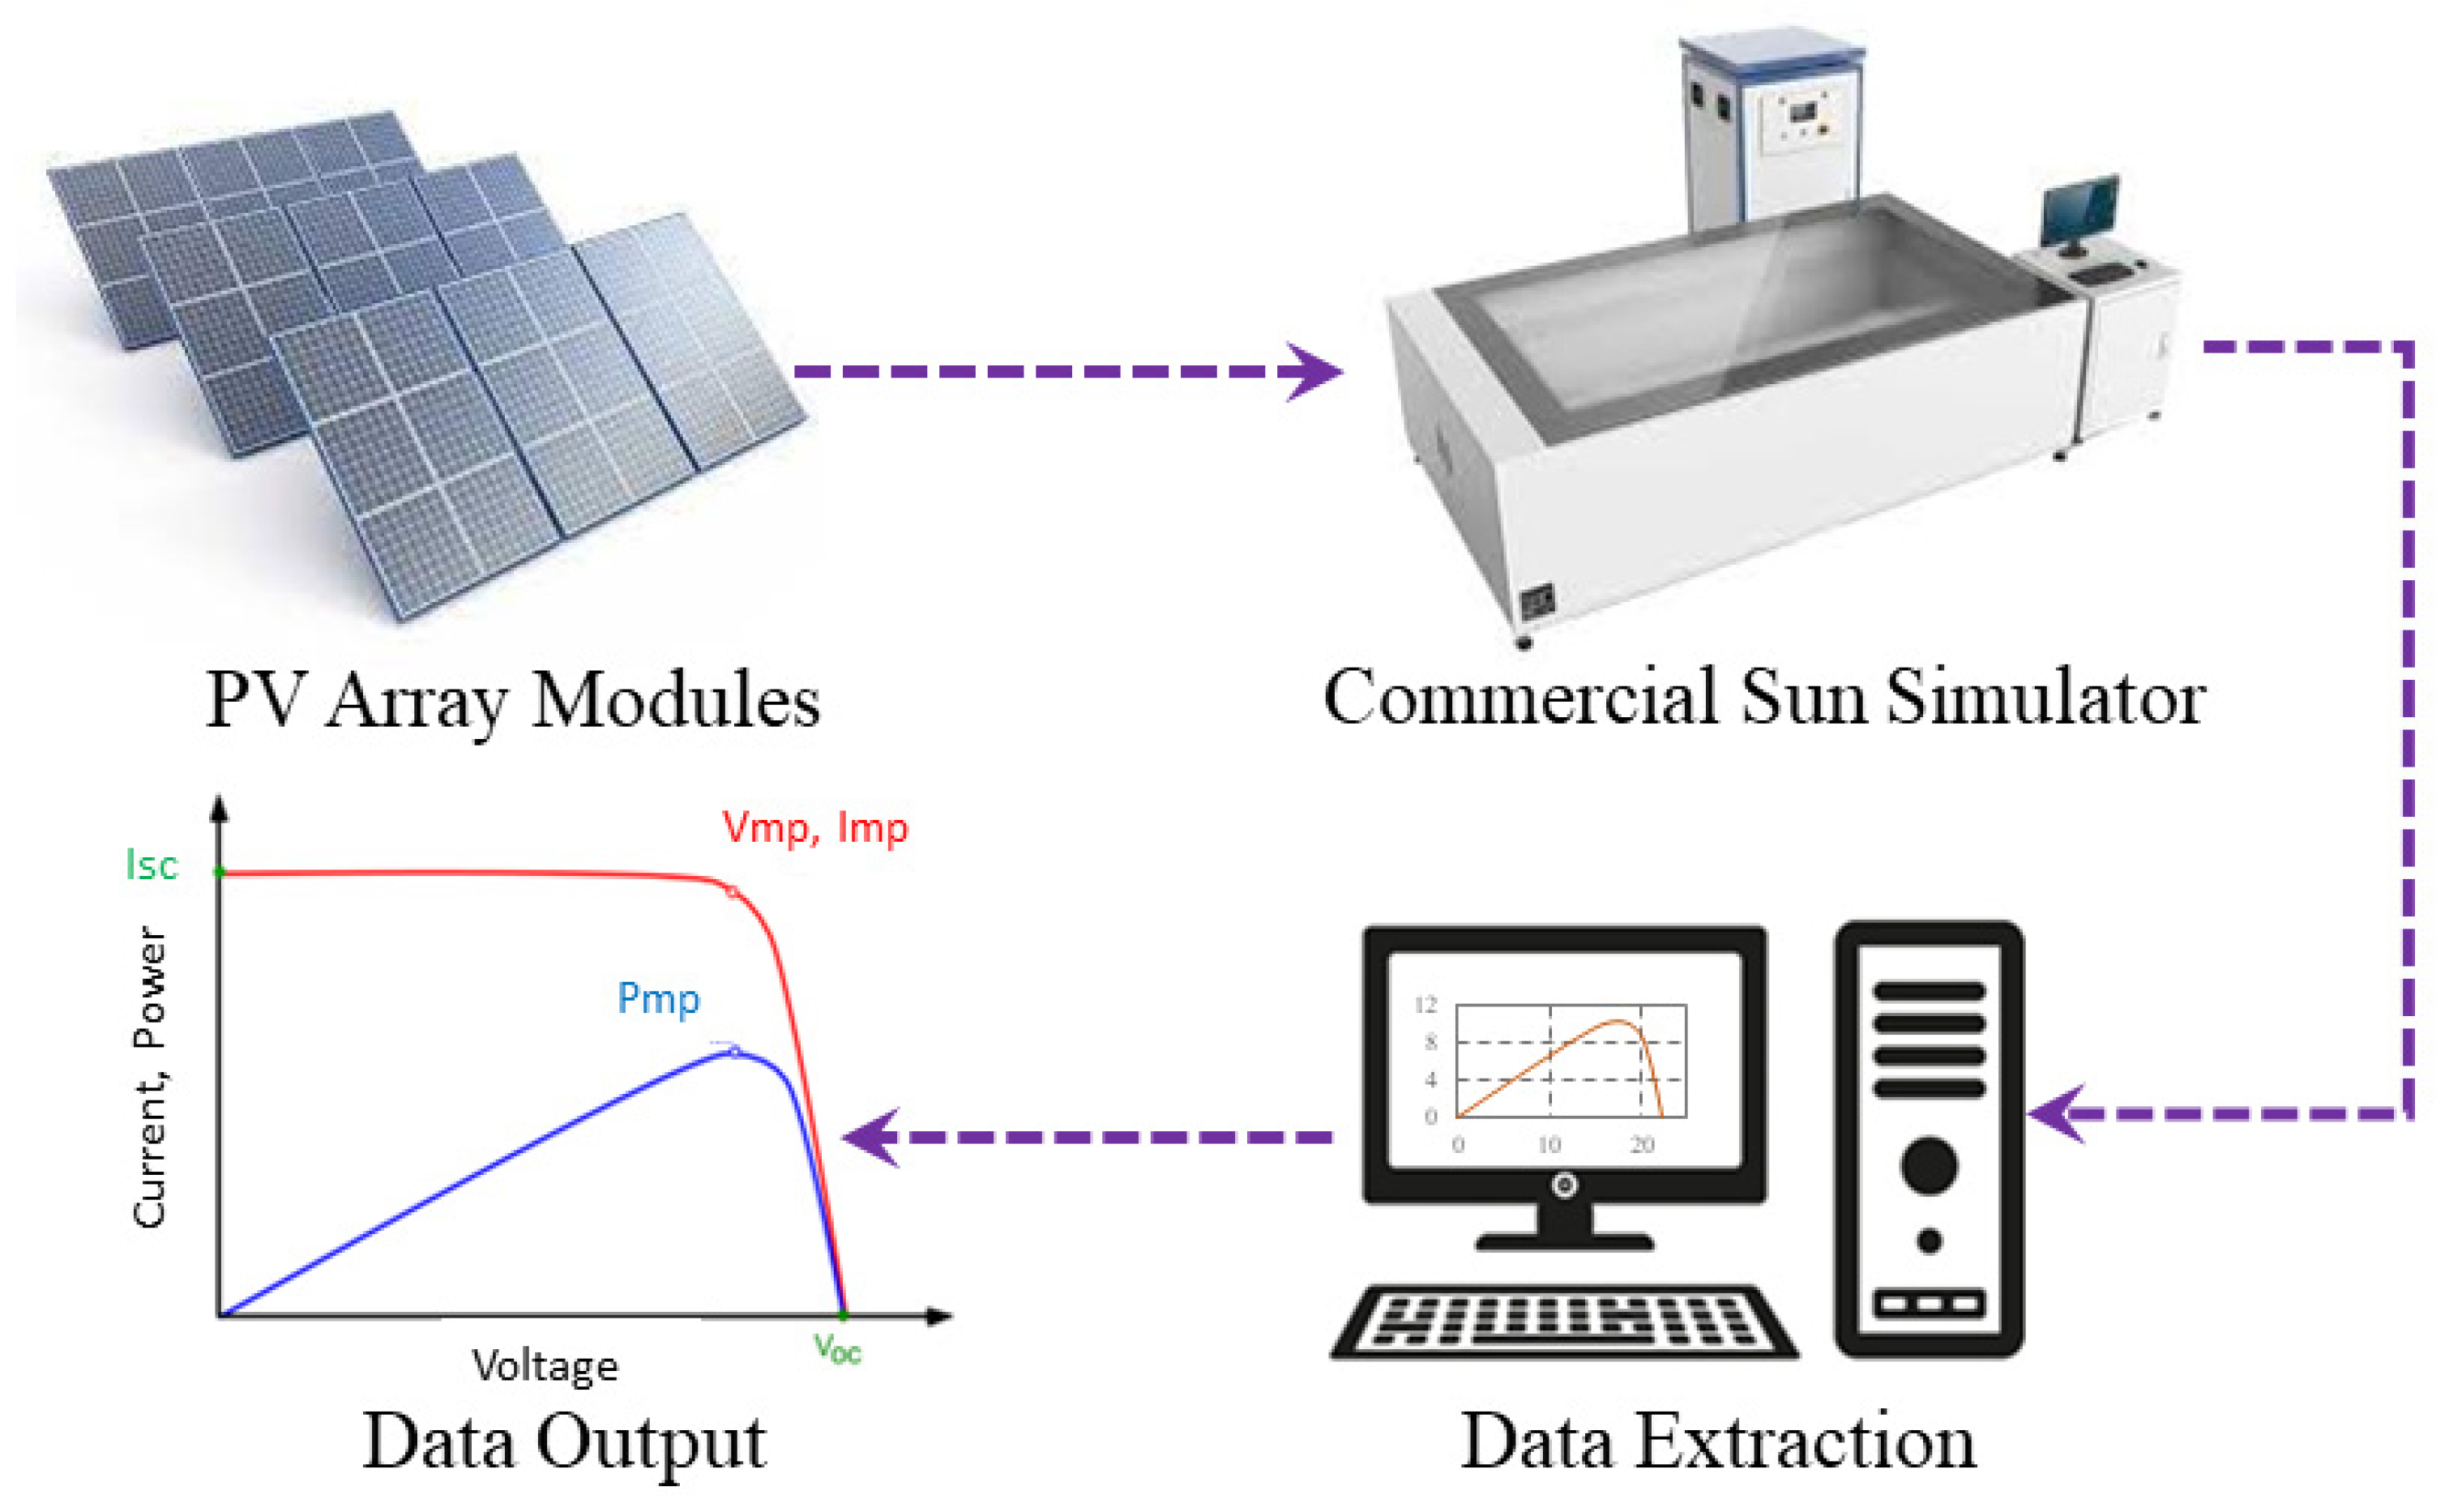
  • A professional PV system analyzer (PROVA 1011) built on IEC standards was used to convert data from the I–V curve under normal operating conditions (OPC) to data under standard test conditions (STC).
  • IEC 60904-1 specifies that for outdoor I–V curve measurements, the irradiance must be at least 800 W/m2. As a result, the experimental data were collected between irradiance ranges from 800 to 950 W/m2.
  • The practical array module rearrangement was accomplished using the SCC-based technique, wherein Electro Solar Limited Bangladesh, a commercial PV module producer, tested the module datasheet.
  • The performance comparison was carried out for the novel hybrid array configurations with series–parallel configurations in terms of mismatch power losses. This comparison demonstrates the effectiveness of the proposed hybrid configurations and their practical relevance.

4. Discussion

After conducting an experimental investigation into the effects of non-uniformly-aged photovoltaic (PV) arrays on the mismatch power loss reduction, several key findings were made:
  • The non-uniform aging of PV modules can lead to significant mismatch power losses in PV arrays, which can reduce the overall system efficiency.
  • When compared to standard PV array configurations, hybrid PV array topologies that integrate PV modules with various interconnections can dramatically reduce mismatch power losses.
  • In hybrid array topologies, the positioning of PV modules with varying degrees of degradation can have an impact on the performance of the entire system, with some configurations resulting in higher output power increases than others.
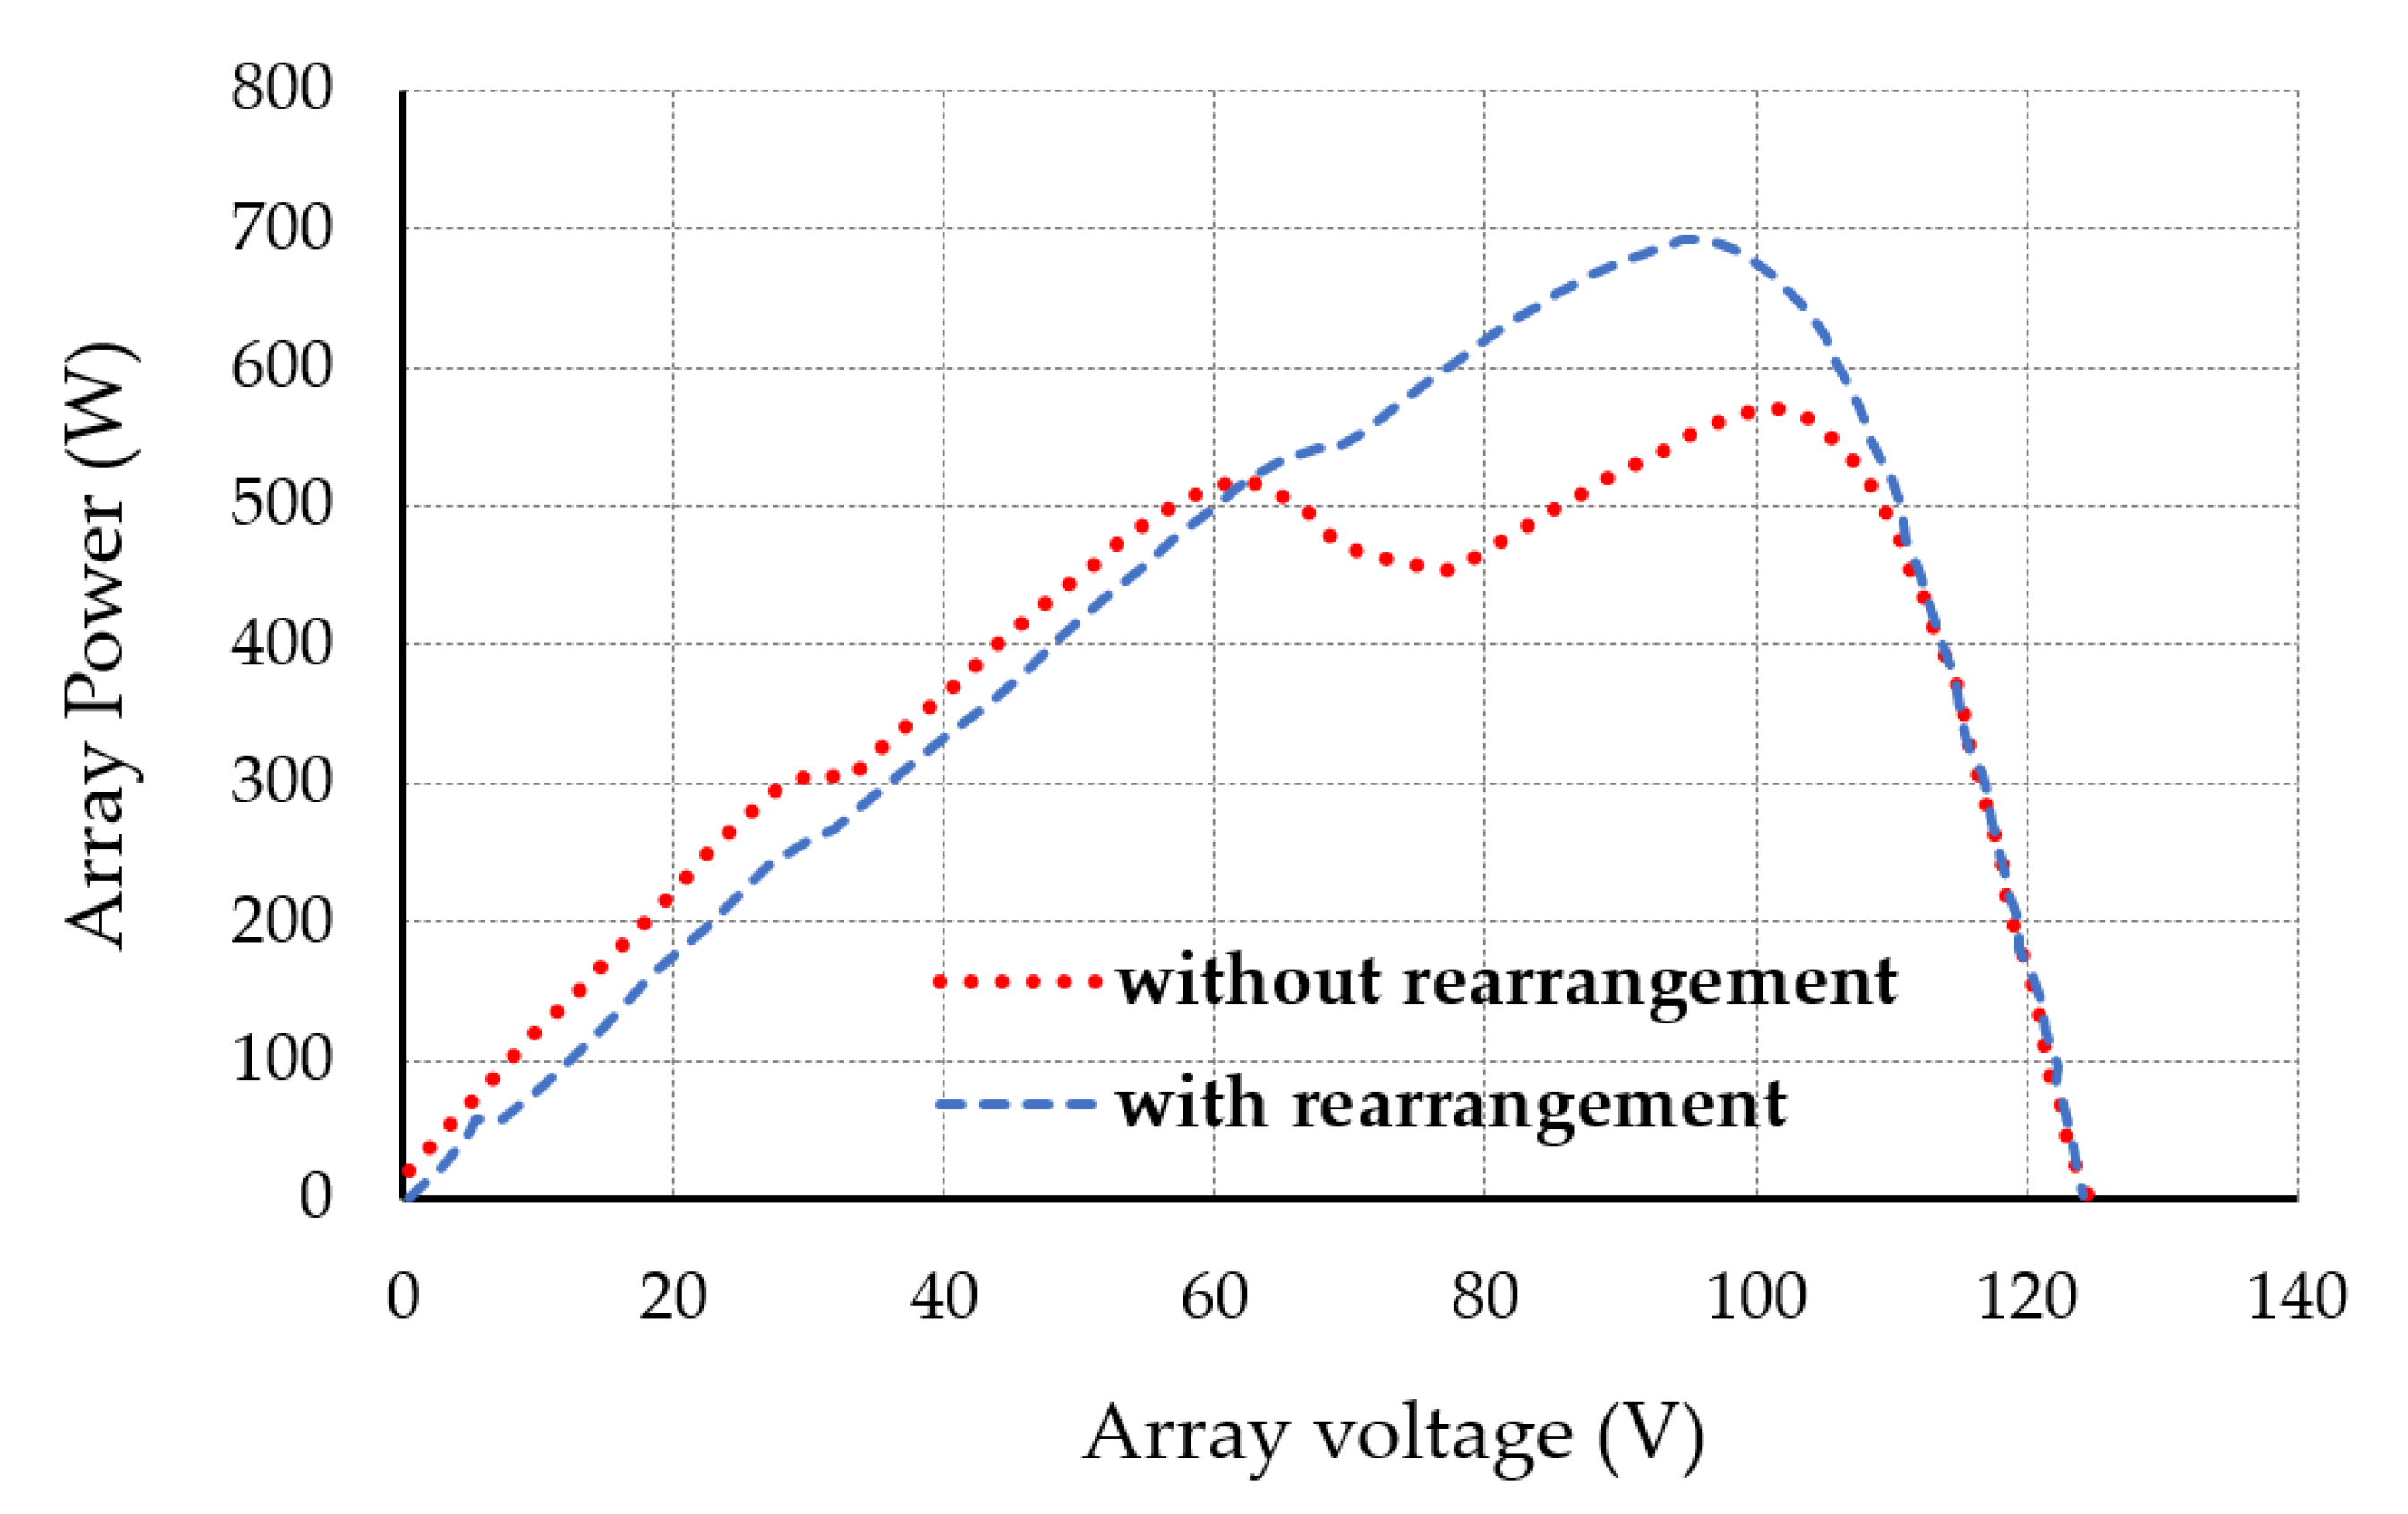
  • Utilizing a module rearrangement technique based on SSC, which can lessen the effects of mismatch power losses, these output power improvements are further boosted.
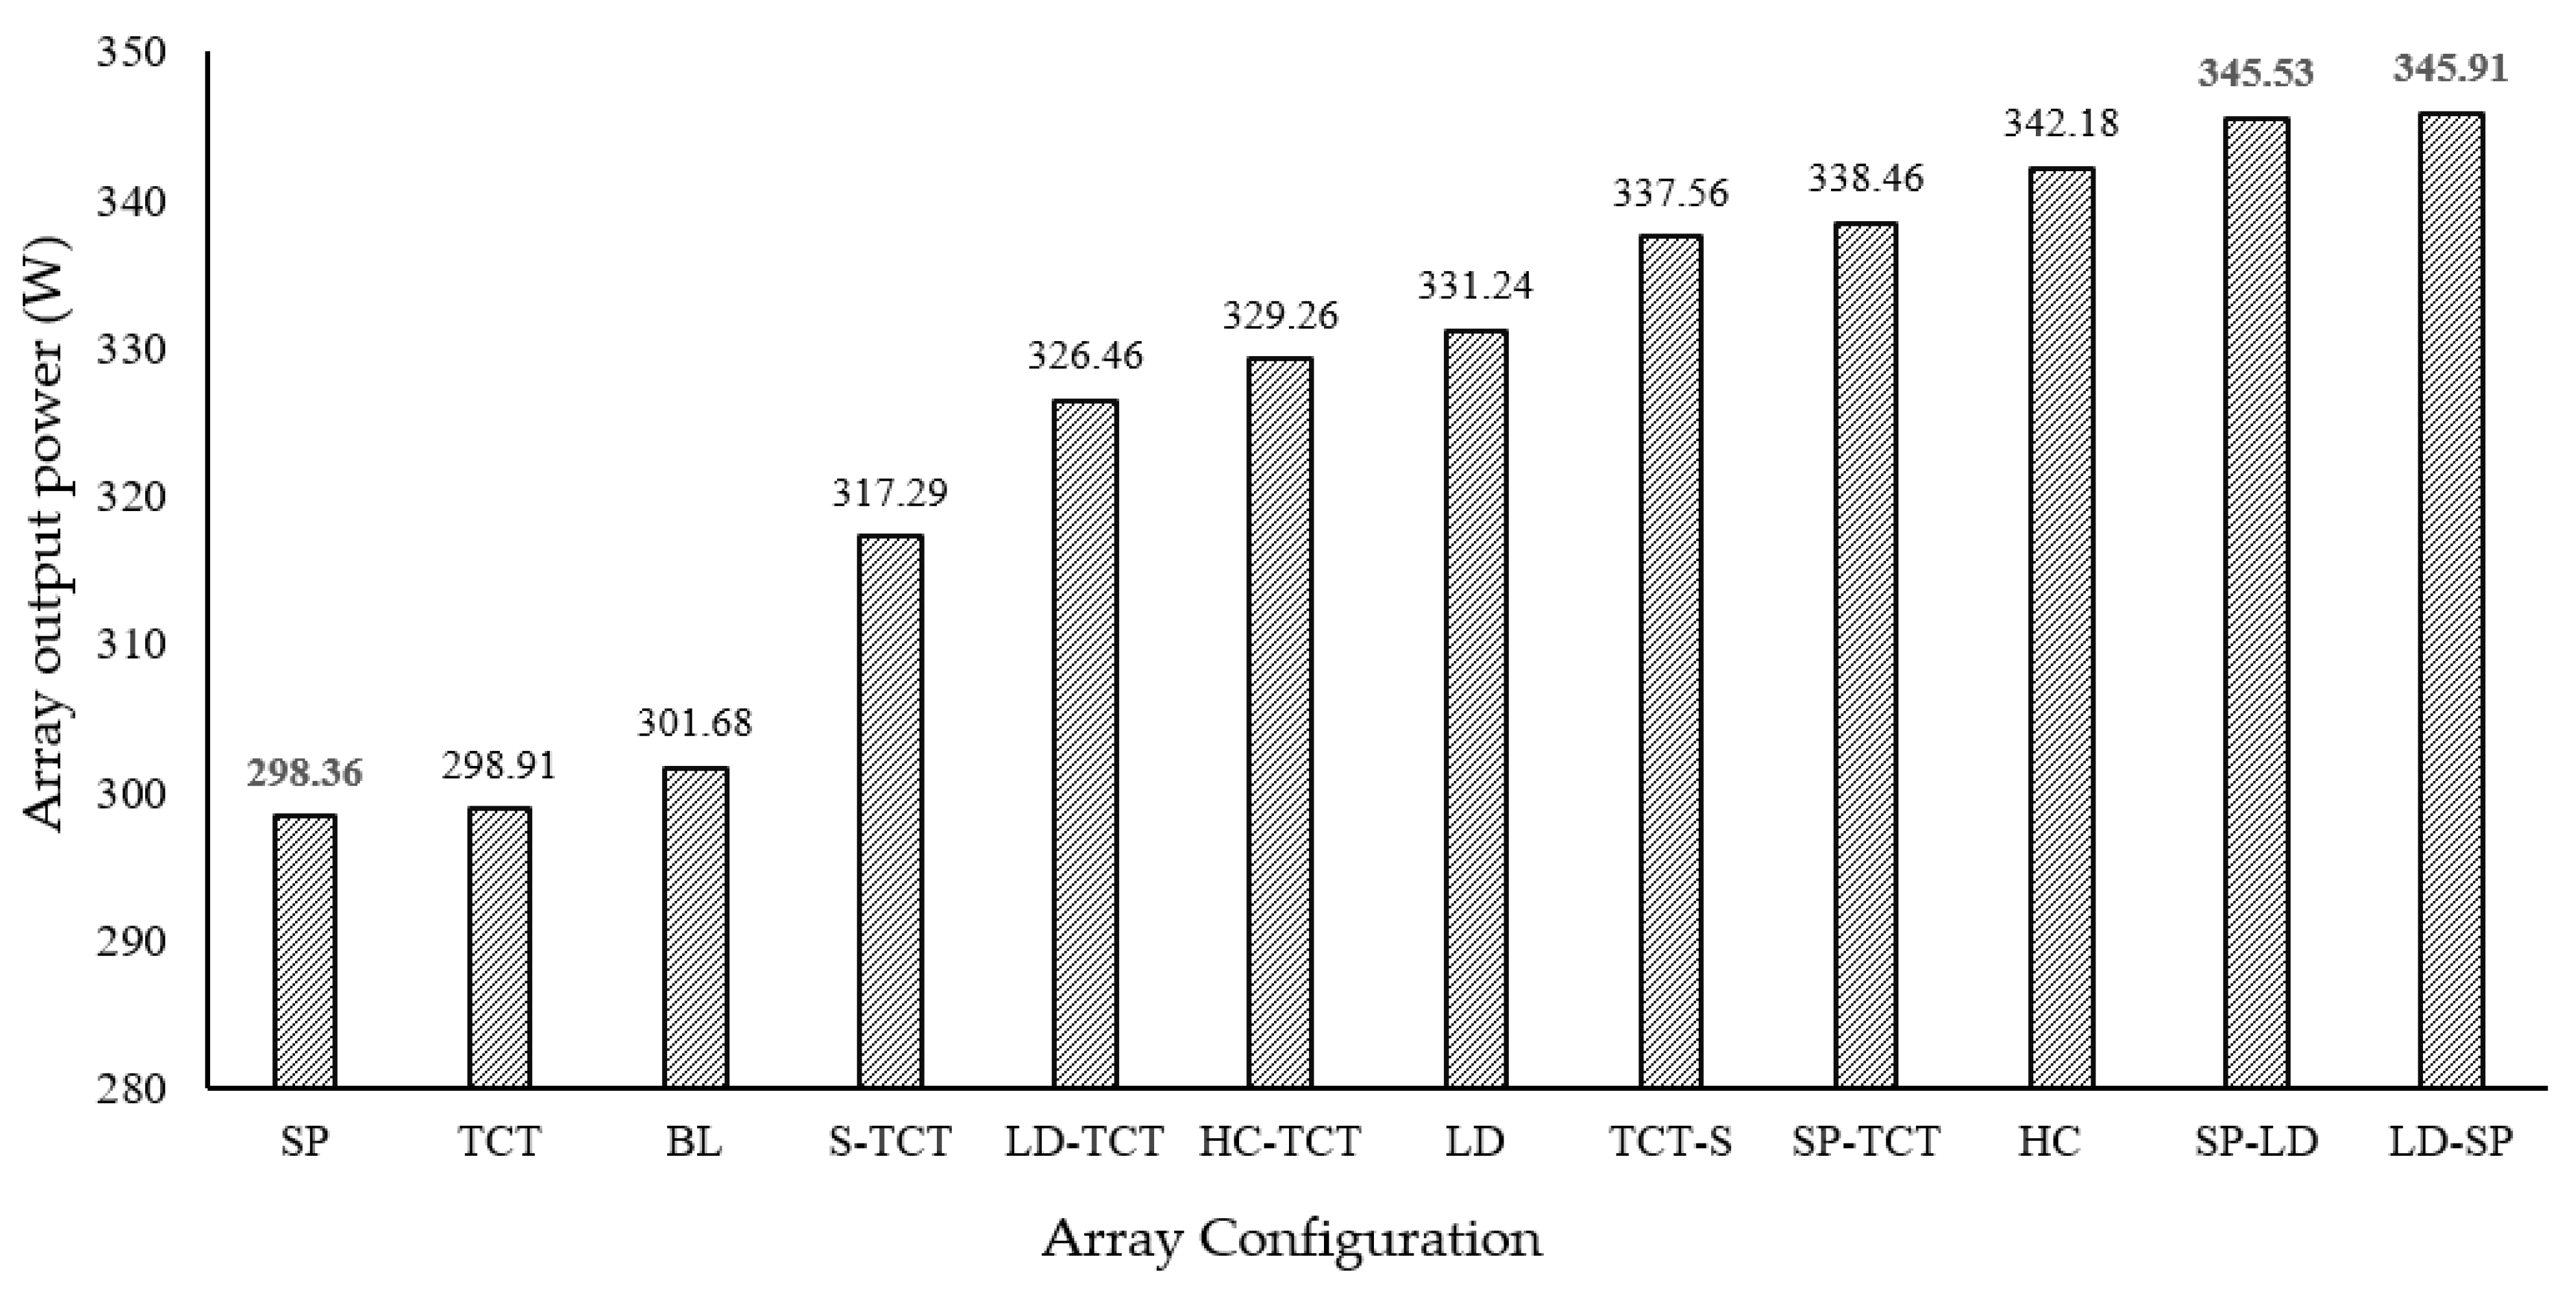
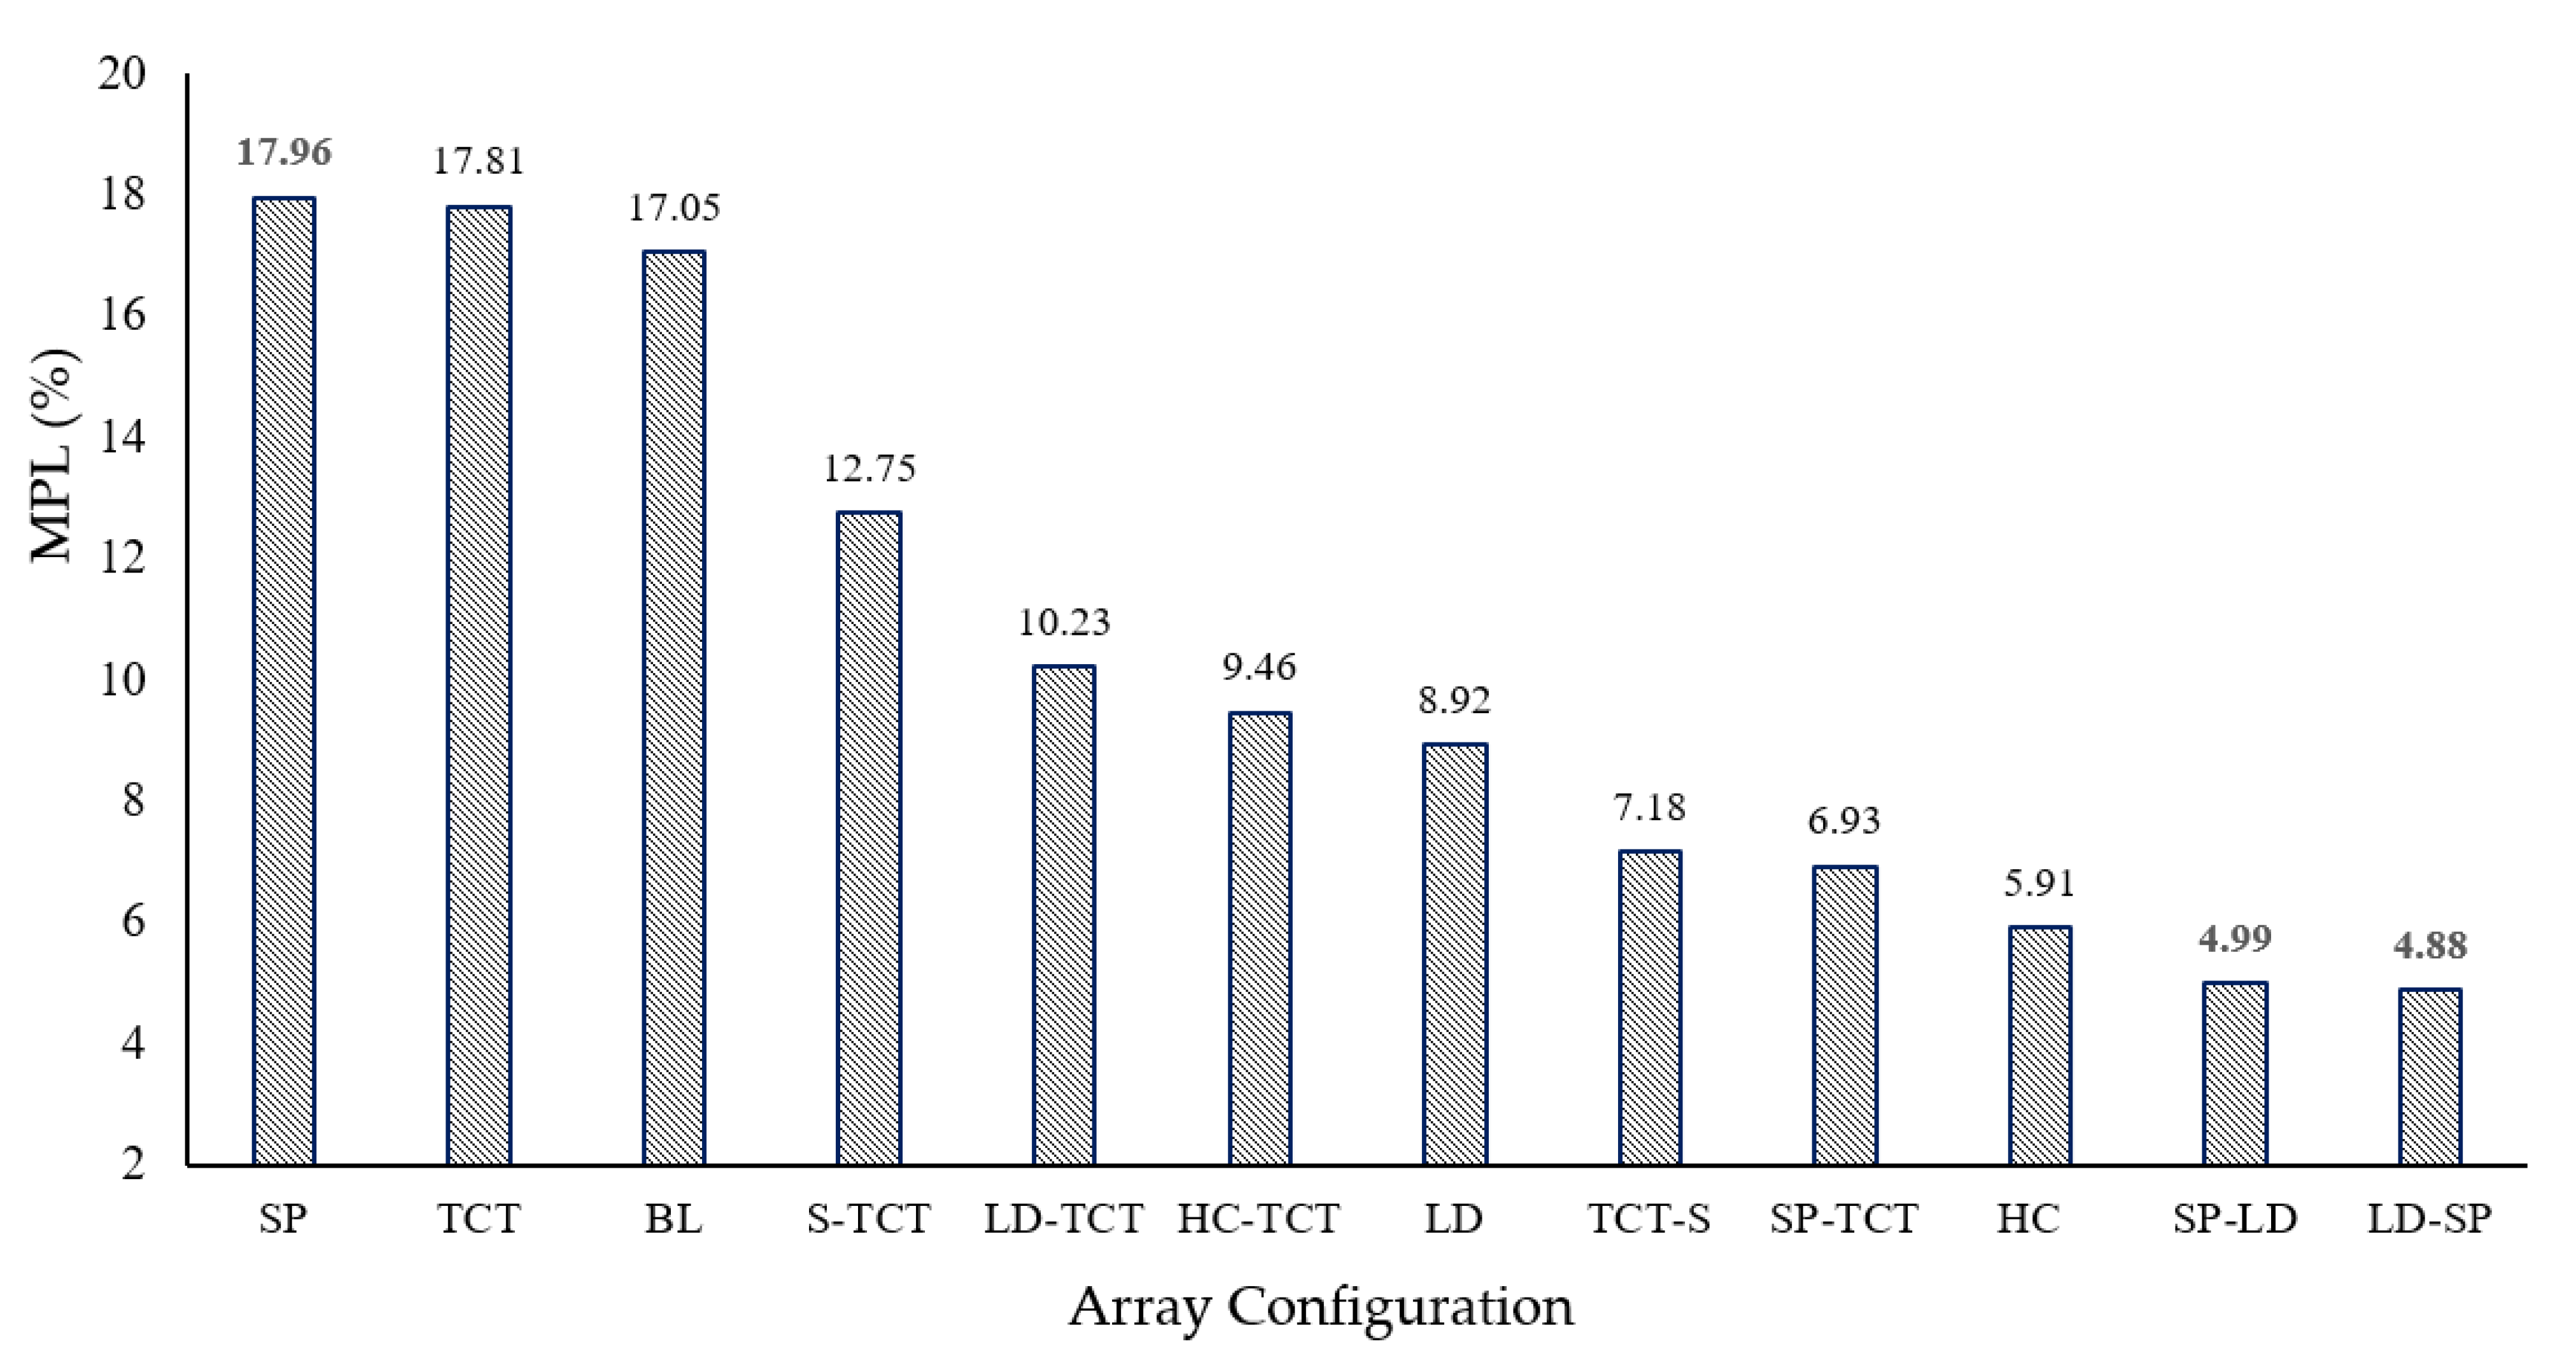
  • The novelty of the work is some new hybrid PV is introduced, and two of them (SP-LD, LD-SP) performed with higher output power by reducing the %MPL considering all other configurations.
  • One of the main differences of this research work compared to others is that here the different standard and hybrid array configurations are compared experimentally considering non-uniform aging conditions, while in other research the application was for a different scenario of partial shading conditions. To the best of the author’s knowledge, 12 different array configurations were not tested before in the literature.
  • It is important to note that the trends observed in Figure 12 and Figure 13 may not be universally applicable to all aged photovoltaic arrays due to variations in aging characteristics and conditions. The generalizability of the trends depends on several factors, including the specific aging mechanisms, the degree of non-uniformity, and the operating conditions. These figures reflect the performance of the proposed hybrid array configurations in mitigating mismatch power losses in the context of non-uniformly-aged arrays. While they provide valuable insights and guidance for similar scenarios, their applicability to different aging results needs to be assessed on a case-by-case basis.
Overall, these findings suggest that the use of novel hybrid PV array configurations that incorporate modules with different non-uniformly-aging conditions can be an effective strategy for reducing mismatch power losses and increasing overall system energy (%RE). The use of the module rearrangement method (SCC) has added a power increment and reduced the MPL, hence improving the performance of these systems. Further research can explore optimal configurations and other techniques of module rearrangement like a genetic algorithm or any other AI-based rearrangement for hybrid PV arrays, and the potential economic benefits of this approach.

5. Conclusions

In this paper, the maximum PV array output power was determined through a comparative examination of several array topologies. It has been shown that the hybrid array arrangements perform better than regular array configurations in terms of array output power, which is the key contribution of this work. For non-uniformly-aged PV arrays, the hybrid array topology can also more effectively reduce mismatch loss than traditional interconnection topologies. In this paper, twelve distinct array configurations have been investigated using a 400 W PV array. Experimental results show that the maximum %RE is 15.94% for LD-SP configuration. It should be noted that modifying array interconnections do not affect inverter/charger specifications; one single inverter can be used for all topologies. The LD-SP arrangement will be simpler to wire in bigger installations than the HC and TCT arrangements due to the pattern’s simplicity. Based on the findings of this work, LD-SP configuration is recommended for the non-uniform aging condition. The cable losses in the LD-SP connection are comparatively lower than those in the TCT connection. Therefore, the proposed LD-SP configuration will be cost-effective compared to the TCT configuration.

Author Contributions

Conceptualization, A.A.M. and M.R.A.; methodology, M.S.H.L.; formal analysis, M.I.I.; investigation, A.S.; data curation, M.I.I. and Z.B.S.; writing—original draft preparation, A.A.M.; writing—review and editing, M.A.u.H. and M.H.M.; visualization, R.H.A.; supervision, A.A.M.; project administration, M.R.A.; funding acquisition, A.A.M. and M.S.H.L. All authors have read and agreed to the published version of the manuscript.

Funding

This study was partially supported by MOST, SRG-222404, CRiT, Green University of Bangladesh (GUB), and Islamic University of Technology (IUT).

Institutional Review Board Statement

Not applicable.

Informed Consent Statement

Not applicable.

Data Availability Statement

Data is unavailable due to privacy and ethical restrictions.

Acknowledgments

The Center for Research, Innovation, and Transformation (CRiT), Green University of Bangladesh, was a source of research support, which the authors gratefully recognize. We appreciate the Ministry of Science and Technology (MOST), Government of the People’s Republic of Bangladesh, for providing us with a research grant (SRG-222404) to carry out the research.

Conflicts of Interest

The authors declare no conflict of interest.

References

  1. Abdalla, A.A.; El Moursi, M.S.; El-Fouly, T.H.; Al Hosani, K.H. A Novel Adaptive Power Smoothing Approach for PV Power Plant with Hybrid Energy Storage System. IEEE Trans. Sustain. Energy 2023, 14, 1457–1473. [Google Scholar] [CrossRef]
  2. Islam, I.; Maruf, H.; Al Mansur, A.; Ashique, R.H.; Haq, M.A.U.; Shihavuddin, A.; Jadin, M.S. Feasibility analysis of floating photovoltaic power plant in Bangladesh: A case study in Hatirjheel Lake, Dhaka. Sustain. Energy Technol. Assess. 2023, 55, 102994. [Google Scholar] [CrossRef]
  3. Islam, I.; Jadin, M.S.; Al Mansur, A.; Kamari, N.A.M.; Jamal, T.; Lipu, M.S.H.; Azlan, M.N.M.; Sarker, M.R.; Shihavuddin, A.S.M. Techno-Economic and Carbon Emission Assessment of a Large-Scale Floating Solar PV System for Sustainable Energy Generation in Support of Malaysia’s Renewable Energy Roadmap. Energies 2023, 16, 4034. [Google Scholar] [CrossRef]
  4. Sharma, M.; Pareek, S.; Singh, K. Robust reconfiguration strategies for maximum output power from large-scale photovoltaic arrays under partial shading conditions. Phys. Scr. 2023, 98, 035215. [Google Scholar] [CrossRef]
  5. Ali, T.; Al Mansur, A.; Shams, Z.B.; Ferdous, S.M.; Hoque, M.A. An overview of smart grid technology in Bangladesh: Development and opportunities. In Proceedings of the 2011 International Conference and Utility Exhibition on Power and Energy Systems: Issues and Prospects for Asia, ICUE, Pattaya, Thailand, 28–30 September 2011. [Google Scholar] [CrossRef]
  6. Rezazadeh, S.; Moradzadeh, A.; Pourhossein, K.; Akrami, M.; Mohammadi-Ivatloo, B.; Anvari-Moghaddam, A. Photovoltaic array reconfiguration under partial shading conditions for maximum power extraction: A state-of-the-art review and new solution method. Energy Convers. Manag. 2022, 258, 115468. [Google Scholar] [CrossRef]
  7. Rahman, T.; Al Mansur, A.; Lipu, M.S.H.; Rahman, S.; Ashique, R.H.; Houran, M.A.; Elavarasan, R.M.; Hossain, E. Investigation of Degradation of Solar Photovoltaics: A Review of Aging Factors, Impacts, and Future Directions toward Sustainable Energy Management. Energies 2023, 16, 3706. [Google Scholar] [CrossRef]
  8. Wu, Z.; Zhang, C.; Alkahtani, M.; Hu, Y.; Zhang, J. Cost Effective Offline Reconfiguration for Large-Scale Non-Uniformly Aging Photovoltaic Arrays Efficiency Enhancement. IEEE Access 2020, 8, 80572–80581. [Google Scholar] [CrossRef]
  9. Raj, R.D.A.; Naik, K.A. A novel scan pattern for reconfiguration of partially shaded photovoltaic arrays for maximum power extraction. Int. J. Circuit Theory Appl. 2022, 51, 668–701. [Google Scholar] [CrossRef]
  10. Chadge, R.B.; Sunheriya, N.; Giri, J.P.; Shrivastava, N. Experimental investigation of different electrical configurations and topologies for Photovoltaic system. Mater. Today Proc. 2022, 57, 316–320. [Google Scholar] [CrossRef]
  11. León, L.; Romero-Quete, D.; Merchán, N.; Cortés, C. Optimal design of PV and hybrid storage based microgrids for healthcare and government facilities connected to highly intermittent utility grids. Appl. Energy 2023, 335, 120709. [Google Scholar] [CrossRef]
  12. Malathy, S.; Ramaprabha, R. Reconfiguration strategies to extract maximum power from photovoltaic array under partially shaded conditions. Renew. Sustain. Energy Rev. 2018, 81, 2922–2934. [Google Scholar] [CrossRef]
  13. Al Mansur, A.; Amin, R.; Haq, M.A.U.; Maruf, H.; Mottalib, M.; Ashique, R.H.; Shihavuddin, A. Mitigation of mismatch power loss in aged photovoltaic arrays following a comparative investigation into module rearrangement techniques. Energy Rep. 2022, 8, 1896–1906. [Google Scholar] [CrossRef]
  14. Jagadeesh, K.; Chengaiah, C. A comprehensive review—Partial shading issues in PV system. In Proceedings of the AIP Conference Proceedings, Kolkata, India, 26–28 November 2021. [Google Scholar] [CrossRef]
  15. Jha, V. Generalized modelling of PV module and different PV array configurations under partial shading condition. Sustain. Energy Technol. Assess. 2023, 56, 103021. [Google Scholar] [CrossRef]
  16. Alkahtani, M.; Hu, Y.; Alghaseb, M.A.; Elkhayat, K.; Kuka, C.S.; Abdelhafez, M.H.; Mesloub, A. Investigating Fourteen Countries to Maximum the Economy Benefit by Using Offline Reconfiguration for Medium Scale PV Array Arrangements. Energies 2020, 14, 59. [Google Scholar] [CrossRef]
  17. Mohammadnejad, S.; Khalafi, A.; Ahmadi, S.M. Mathematical analysis of total-cross-tied photovoltaic array under partial shading condition and its comparison with other configurations. Sol. Energy 2016, 133, 501–511. [Google Scholar] [CrossRef]
  18. Karatepe, E.; Boztepe, M.; Çolak, M. Development of a suitable model for characterizing photovoltaic arrays with shaded solar cells. Sol. Energy 2007, 81, 977–992. [Google Scholar] [CrossRef]
  19. Narne, D.K.; Kumar, T.A.R.; Alla, R.R. Traditional and hybrid solar photovoltaic array configurations for partial shading conditions: Perspectives and challenges. Bull. Electr. Eng. Inform. 2023, 12, 642–649. [Google Scholar] [CrossRef]
  20. Satpathy, P.R.; Babu, T.S.; Mahmoud, A.H.; Sharma, R.; Nastasi, B. A TCT-SC Hybridized Voltage Equalizer for Partial Shading Mitigation in PV Arrays. IEEE Trans. Sustain. Energy 2021, 12, 2268–2281. [Google Scholar] [CrossRef]
  21. Aljafari, B.; Satpathy, P.R.; Thanikanti, S.B. Partial shading mitigation in PV arrays through dragonfly algorithm based dynamic reconfiguration. Energy 2022, 257, 124795. [Google Scholar] [CrossRef]
  22. Satpathy, P.R.; Aljafari, B.; Thanikanti, S.B. Power losses mitigation through electrical reconfiguration in partial shading prone solar PV arrays. Optik 2022, 259, 168973. [Google Scholar] [CrossRef]
  23. Krishna, G.S.; Moger, T. Improved SuDoKu reconfiguration technique for total-cross-tied PV array to enhance maximum power under partial shading conditions. Renew. Sustain. Energy Rev. 2019, 109, 333–348. [Google Scholar] [CrossRef]
  24. La Manna, D.; Vigni, V.L.; Sanseverino, E.R.; Di Dio, V.; Romano, P. Reconfigurable electrical interconnection strategies for photovoltaic arrays: A review. Renew. Sustain. Energy Rev. 2014, 33, 412–426. [Google Scholar] [CrossRef]
  25. Yang, B.; Ye, H.; Wang, J.; Li, J.; Wu, S.; Li, Y.; Shu, H.; Ren, Y.; Ye, H. PV arrays reconfiguration for partial shading mitigation: Recent advances, challenges and perspectives. Energy Convers. Manag. 2021, 247, 114738. [Google Scholar] [CrossRef]
  26. Yousri, D.; Allam, D.; Eteiba, M.B. Optimal photovoltaic array reconfiguration for alleviating the partial shading influence based on a modified harris hawks optimizer. Energy Convers. Manag. 2020, 206, 112470. [Google Scholar] [CrossRef]
  27. Pendem, S.R.; Mikkili, S. Modelling and performance assessment of PV array topologies under partial shading conditions to mitigate the mismatching power losses. Sol. Energy 2018, 160, 303–321. [Google Scholar] [CrossRef]
  28. Bana, S.; Saini, R. Experimental investigation on power output of different photovoltaic array configurations under uniform and partial shading scenarios. Energy 2017, 127, 438–453. [Google Scholar] [CrossRef]
  29. Yadav, A.S.; Pachauri, R.K.; Chauhan, Y.K.; Choudhury, S.; Singh, R. Performance enhancement of partially shaded PV array using novel shade dispersion effect on magic-square puzzle configuration. Sol. Energy 2017, 144, 780–797. [Google Scholar] [CrossRef]
  30. Satpathy, P.R.; Sharma, R. Power and mismatch losses mitigation by a fixed electrical reconfiguration technique for partially shaded photovoltaic arrays. Energy Convers. Manag. 2019, 192, 52–70. [Google Scholar] [CrossRef]
  31. Mishra, N.; Yadav, A.S.; Pachauri, R.; Chauhan, Y.K.; Yadav, V.K. Performance enhancement of PV system using proposed array topologies under various shadow patterns. Sol. Energy 2017, 157, 641–656. [Google Scholar] [CrossRef]
  32. Rezk, H.; Fathy, A.; Aly, M. A robust photovoltaic array reconfiguration strategy based on coyote optimization algorithm for enhancing the extracted power under partial shadow condition. Energy Rep. 2020, 7, 109–124. [Google Scholar] [CrossRef]
  33. Krishna, G.S.; Moger, T. Reconfiguration strategies for reducing partial shading effects in photovoltaic arrays: State of the art. Sol. Energy 2019, 182, 429–452. [Google Scholar] [CrossRef]
  34. Al Mansur, A.; Amin, M.R. Performance investigation of different PV array configurations at partial shading condition for maximum power output. In Proceedings of the 2019 International Conference on Sustainable Technologies for Industry 4.0, STI, Dhaka, Bangladesh, 24–25 December 2019. [Google Scholar] [CrossRef]
  35. Dhanalakshmi, B.; Rajasekar, N. A novel Competence Square based PV array reconfiguration technique for solar PV maximum power extraction. Energy Convers. Manag. 2018, 174, 897–912. [Google Scholar] [CrossRef]
  36. Rahman, T.; Al Mansur, A.; Islam, S.; Islam, I.; Sahin; Awal, R.; Shihavuddin, A.; Haq, M.A.U. Effects of Aging Factors on PV Modules Output Power: An Experimental Investigation. In Proceedings of the 2022 4th International Conference on Sustainable Technologies for Industry 4.0 (STI), Dhaka, Bangladesh, 17–18 December 2022; pp. 1–5. [Google Scholar] [CrossRef]
  37. Al Mansur, A.; Amin, R.; Islam, K.K. Performance Comparison of Mismatch Power Loss Minimization Techniques in Series-Parallel PV Array Configurations. Energies 2019, 12, 874. [Google Scholar] [CrossRef]
  38. Mansur, A.; Haq, M.; Maruf, H.; Shihavuddin, A.; Amin, R.; Islam, K. Experimental Investigation of PV Array Interconnection Topologies at Nonuniform Aging Condition for Power Maximization. GUB J. Sci. Eng. 2020, 6, 39–45. [Google Scholar] [CrossRef]
  39. Hu, Y.; Zhang, J.; Li, P.; Yu, D.; Jiang, L. Non-Uniform Aged Modules Reconfiguration for Large-Scale PV Array. IEEE Trans. Device Mater. Reliab. 2017, 17, 560–569. [Google Scholar] [CrossRef]
  40. Udenze, P.; Hu, Y.; Wen, H.; Ye, X.; Ni, K. A Reconfiguration Method for Extracting Maximum Power from Non-Uniform Aging Solar Panels. Energies 2018, 11, 2743. [Google Scholar] [CrossRef]
  41. Al Mansur, A.; Amin, M.R.; Islam, K.K. Determination of Module Rearrangement Techniques for Non-uniformly Aged PV Arrays with SP, TCT, BL and HC Configurations for Maximum Power Output. In Proceedings of the 2nd International Conference on Electrical, Computer and Communication Engineering, ECCE, Cox’s Bazar, Bangladesh, 7–9 February 2019. [Google Scholar] [CrossRef]
  42. Al Mansur, A.; Islam, I.; Kiron, M.K.; Haq, M.A.U.; Maruf, H.; Shihavuddin, A.; Ashique, R.H.; Amin, R. Electrical experimental data collection of polycrystalline and monocrystalline photovoltaic modules in an indoor environment using artificial sun simulator. Data Brief 2022, 43, 108389. [Google Scholar] [CrossRef]
  43. IEC 60904-1; Photovoltaic Devices—Part 1: Measurement of Photovoltaic Current-voltage Characteristics. International Electrotechnical Commission: London, UK, 2006.
  44. Al Mansur, A.; Ferdous, S.M.; Shams, Z.B.; Islam, M.R.; Rokonuzzaman, M.; Hoque, M.A. An experimental investigation of the real time electrical characteristics of a PV panel for different atmospheric conditions in Islamic University of Technology (OIC), Gazipur, Bangladesh. In Proceedings of the 2011 International Conference and Utility Exhibition on Power and Energy Systems: Issues and Prospects for Asia, ICUE, Pattaya, Thailand, 28–30 September 2012. [Google Scholar] [CrossRef]
  45. Al Mansur, A. Replication Data for: Tested Dataset of 10W, 40W, 80W and 250W Photovoltaic Modules under Aging Condition. Harv. Dataverse 2023, 47, 108989. [Google Scholar] [CrossRef]
  46. Al Mansur, A.; Islam, I.; Haq, M.A.U.; Maruf, H.; Shihavuddin, A.; Amin, R. Investigation of PV Modules Electrical Characteristics for Laboratory Experiments using Halogen Solar Simulator. In Proceedings of the 2020 2nd International Conference on Sustainable Technologies for Industry 4.0, STI, Dhaka, Bangladesh, 19–20 December 2020. [Google Scholar] [CrossRef]
Figure 1. Power increment of PV array modules under non-uniform aging conditions [39].
Sustainability 15 13153 g001
Figure 2. The conventional and proposed configurations are tested using an aged PV array. The array modules are rearranged via the SCC method. The output characteristics of the PV array are measured using PROVA 1011 for each configuration to make the result comparison.
Sustainability 15 13153 g002
Figure 3. Standard configurations of 4 × 10 PV Array.
Sustainability 15 13153 g003
Figure 4. Hybrid Configurations of 4 × 10 Array.
Sustainability 15 13153 g004
Figure 5. Proposed Hybrid Configurations of 4 × 10 Array.
Sustainability 15 13153 g005
Figure 6. Aged PV module testing system in the solar module manufacturer company.
Sustainability 15 13153 g006
Figure 7. The relationship between Vmpp and Impp of non-uniformly-aged forty polycrystalline PV modules dataset. The module number with light blue colors represents the mostly aged module and dark blue color modules are slowly degraded.
Sustainability 15 13153 g007
Figure 8. The degradation rate of different electrical parameters of aged photovoltaic modules.
Sustainability 15 13153 g008
Figure 9. The five common non-uniform aging factors delamination, discoloration soiling, hotspot, and cell crack are shown here from the 4 years of the aged 40 PV modules. Most of the PV modules are degraded by these types of aging factors.
Sustainability 15 13153 g009
Figure 10. TCT configuration is used to connect 4 × 10 array modules. The SCC approach chooses and arranges the PV modules’ positions.
Sustainability 15 13153 g010
Figure 11. Experimental data collection of the non-uniformly-aged PV array. Each configuration is applied to make the module interconnection, and output electrical characteristics are measured using the PROVA 1011.
Sustainability 15 13153 g011
Figure 12. Comparison of power outputs among different array configurations for 4 × 10 array.
Sustainability 15 13153 g012
Figure 13. Comparison of MPL% among different array configurations for 4 × 10 array.
Sustainability 15 13153 g013
Table 1. A summary of the literature review on different conventional and hybrid configurations.
Refs.Array ConfigurationsKey FindingsApplication
[27]SP, TCT, HC, BL, and a novel hybridA 6 × 6 array is used to perform the simulation. The novel hybrid configuration performed better considering output power.partial shading
[17]SP, TCT, BL, and HCMathematical model-based simulation is performed and TCT shows the highest output power.partial shading
[18]SP, BL, and TCTDifferent array dimensions 2 × 6, 6 × 2, 4 × 3, and 3 × 4 is investigated via simulation. TCT performed maximum output in all cases.partial shading
[28]TCT, BL, SP, HC, and HC-TCT)Experimental comparisons are conducted and TCT performed the lowest mismatch loss. partial shading
[29]TCT, SP-TCT, BL-TCT, and BL-HCA 4 × 4 array is used to perform the simulation in the MATLAB Simulink platform.partial shading
[30]Conventional (SP, TCT, BL, HC) and hybrid (SP-TCT, BL-TCT, HC-TCT)Simulation is carried out, where hybrid configurations performed better than the conventional interconnection in terms of MPL reduction.moving shading
[31]SP-TCT, BL-TCT, BL-HC, and NS hybridSimulink-based work is carried out, and hybrid NS configuration yielded the highest output power for this shading scenario.diagonal shading
Table 2. Tested data of 10 W PV modules after four years of outdoor exposure.
Si
No
Panel
Model No
Data Parameters of Photovoltaic Module
Pmpp (watt)Isc (amp)Voc (volt)Vmpp (volt)Impp (amp)FF
11612E0200019.8211.31410.4308.3641.1740.716
21612E0200029.7431.30010.3658.3491.1670.723
31612E0200039.2851.31810.4268.0441.1540.675
41612E0200049.9831.31110.4268.4421.1830.730
51612E02000510.1771.33110.4568.5081.1960.731
61612E0200069.7561.29410.3858.3951.1620.725
71612E0200079.7691.31110.4518.3881.1640.713
81612E0200089.9881.31810.3898.4021.1890.729
91612E0200099.9361.28910.3328.4621.1730.745
101612E02001010.0151.31410.4858.4781.1810.726
401612E02004610.1111.33510.4178.4721.1930.726
Average9.9171.30510.3908.4071.1790.731
Table 3. Features of the PV analyzer, temperature, and irradiance sensor.
ParameterLimit (Max)Precision (%)
Voltage1000 V±1
Current12 A±1
Light intensity2000 W/m2±3
Temperature85 °C±1
Table 4. Experimental work on array output power and MPL% for various array configurations.
SIConfigurationOutput Variable for the ArrayMPL (%)RE (%)
Voltage (V)Current (A)Power (W)
1SP72.544.113298.3617.960.00
2TCT73.124.088298.9117.810.18
3BL81.363.708301.6817.051.11
4S-TCT75.454.205317.2912.756.34
5LD-TCT74.774.366326.4610.239.41
6HC-TCT75.044.388329.269.4610.35
7LD76.394.336331.248.9211.02
8TCT-S75.734.457337.567.1813.13
9SP-TCT76.324.435338.466.9313.44
10HC78.184.377342.185.9114.68
11SP-LD78.64.396345.534.9915.80
12LD-SP78.744.393345.914.8815.94
Disclaimer/Publisher’s Note: The statements, opinions and data contained in all publications are solely those of the individual author(s) and contributor(s) and not of MDPI and/or the editor(s). MDPI and/or the editor(s) disclaim responsibility for any injury to people or property resulting from any ideas, methods, instructions or products referred to in the content.

