Article

A Low-Cost Energy Monitoring System with Universal Compatibility and Real-Time Visualization for Enhanced Accessibility and Power Savings

1
Neurocomputation Lab, National Center of Artificial Intelligence, Karachi 75270, Pakistan
2
Faculty of Electrical and Computer Engineering, NED University of Engineering and Technology, Karachi 75270, Pakistan
3
Department of Electrical and Computer Engineering, College of Engineering and Information Technology, Ajman University, Ajman P.O. Box # 346, United Arab Emirates
4
Artificial Intelligence Research Centre, Ajman University, Ajman P.O. Box # 346, United Arab Emirates
*
Author to whom correspondence should be addressed.
Sustainability 2024, 16(10), 4137; https://doi.org/10.3390/su16104137
Submission received: 6 February 2024 / Revised: 7 April 2024 / Accepted: 23 April 2024 / Published: 15 May 2024

Abstract

:
Energy management is important for both consumers and utility providers. Utility providers are concerned with identifying and reducing energy wastage and thefts. Consumers are interested in reducing their energy consumption and bills. In Pakistan, residential and industrial estates account for nearly 31,000 MW of the maximum total demand, while the transmission and distribution capacity has stalled at about 22,000 MW. This 9000 MW gap in demand and supply, as reported in 2022, has led to frequent load shedding. Although the country now has an excess generation capacity of about 45,000 MW, the aging transmission and distribution network cannot deliver the requisite power at all times. Hence, electricity-related problems are likely to continue for the next few years in the country and the same is true for other low- and middle-income countries (LMICs). Several energy monitoring systems (EnMS) have been proposed, but they face limitations in terms of cost, ease of application, lack of universal installation capability, customization, and data security. The research below focused on the development of an economical, secure, and customizable real-time EnMS. The proposed EnMS comprises low-cost hardware for gathering energy data with universal compatibility, a secured communication module for real-time data transmission, and a dashboard application for visualization of real-time energy consumption in a user-preferred manner, making the information easily accessible and actionable. The experimental results and analysis revealed that approximately 40% cost savings in EnMS development could be achieved compared to other commercially available EnMSs. The performance of the EnMS hardware was evaluated and validated through rigorous on-site experiments. The front-end of the EnMS was assessed through surveys and was found to be interactive and user-friendly for the target clients. The developed EnMS architecture was found to be an economical end-product and an appropriate approach for small and medium clients such as residential, institutional, commercial, and industrial consumers, all on one platform.

1. Introduction

The global energy crises calls for efficient management of electricity production and consumption, especially in low- and middle-income countries (LMICs) [1,2]. One of the possible solutions to overcome the energy crises is to increase energy production by using renewable energy resources [3,4]. However, the development and deployment of renewable energy resources is an expensive and complex task. Further, in the case of a surge in power demand, renewable sources cannot increase their generation unless a storage medium such as battery banks are present, which significantly increases the overall cost of the renewable energy solution. On the other hand, managing and balancing the load on the demand side to use resources efficiently is an economical solution. This addresses energy crises by reducing energy wastage such as standby consumption (leaving the device on standby), the use of outdated lighting fixtures, poor insulation in buildings, and leaving electronics devices plugged in. An efficient electrical system equipped with an energy monitoring system (EnMS) [1,5] is both reliable and resilient. This contributes to solutions for reducing energy waste by monitoring and analyzing energy consumption in real time. Consumers significantly benefit from this technology by gaining insights into their energy usage patterns. This empowers them to make informed decisions and modify their behavior to reduce energy waste. Examples of such changes include turning off devices instead of leaving them on standby, replacing outdated lighting fixtures with energy-efficient ones, and improving building insulation. These actions can lead to improved financial viability [6,7], unlike with conventional methods [8]. EnMSs can acquire electrical signal data from energy meters and then intelligently record and monitor the consumption of electricity and display this in real time through a user interface (UI) [6].
Advanced digital communication technologies are deployed to monitor and manage electrical changes within the grid. Such communication mechanisms for the bidirectional flow of information within several nodes of an EnMS need to be reliable, secure, and efficient [9,10]. The approach to connecting devices or nodes and monitoring them via the Internet is termed the Internet of things (IoT) [11,12]. Connecting these nodes using a cloud computing platform benefits decision-makers in applying real-time analysis in a more flexible and scalable way.
The architecture of real-time EnMSs can be divided into three tiers. A monitor tier (residing at consumer premises), cloud tier or server tier, and client tier (UI). Different software and functionalities are used at each tier to achieve real-time monitoring and data management [13]. The monitor tier may consist of an energy meter at a higher level for buildings and grids, or a smart plug at a lower level, for individual devices. For higher-level energy monitoring, a single node connects the building/grid, thus this is less complex and non-intrusive. This is preferable where individual load consumption and control of the device is not required. For the second tier, i.e., cloud tier, cloud-based service models can be classified into three types: PaaS (platform as a service), IaaS (infrastructure as a service), and SaaS (software as a service) [4]. PaaS and SaaS are easier to use but they are both relatively costly, as the service provider manages most of the cloud computing features and provides limited freedom when it comes to the infrastructure of the cloud. IaaS, on the other hand, is more economical and provides more freedom for developing the infrastructure of the cloud as per requirements, but it requires development expertise. Wireless technologies such as 3G, 4G, and Wi-Fi are preferred for communication in these decentralized systems [4,14,15]. The third tier, i.e., the client tier, provides a visual breakdown to the end-user/client in a customized way. This visual breakdown and monetary projections in real-time allow inducing changes in the behavior of consumers to use energy efficiently and improve financial viability [6] through demand-side management.
For higher-level energy monitoring, energy meters acquire and display energy data, i.e., the voltage, current, power, etc., of a building. A market survey revealed that buildings are usually already equipped with smart energy meters. In contrast to the market needs, the available EnMSs [16,17] offer a smart meter as a component, which eventually increases the cost of the system. The relatively higher cost of the available EnMSs, results in their use at sizeable power plants, making them impractical for smaller clients [4], such as residential or commercial building clients, and their complexity does not allow easy customization. This leads to the requirement for developing an economical EnMS capable of collecting electrical energy data in real-time and communicating with other devices (mobile phones, laptops, tablets, etc.), providing a customized visual breakdown to the client.
Second, besides cost, customers are always concerned about the security of their data being sent to the cloud over the Internet. Therefore, the security of IoT-based EnMSs is also extremely important. The communication medium of the connected nodes needs to be secured so that no one can hack, spy, or change the data during transmission [9,10]. This research focuses on the indigenous development of a low-cost cloud-based intelligent real-time energy monitoring solution. The research presents the architecture framework, design methodology, validation, and development of the proposed system, which is ready to be installed at the customer’s site for remote monitoring of their electricity load profiles. The performance of the system was evaluated through a demonstration and validation of a demo setup. The verification of the system was carried out by installing the node circuit at different locations in an engineering university. The system has two main parts; hardware and software. Hardware considerations were undertaken to keep the cost low for an economical end-product and thus feasible for small and medium sized clients. Software considerations were undertaken to attain high flexibility, seamless and secure communication, as well as the easy scalability of the system. The system’s hardware was implemented on a printed circuit board (PCB) for ease of installation. The PCB consists of a data acquisition (DAQ) module that communicates with energy meters through the Modbus protocol, a Wi-Fi module for communication with the cloud, and a power module to power the card through alternating current (AC) mains. In addition, it is possible to replace Wi-Fi connectivity with an Ethernet interface or mobile network modem. The data are transmitted to a database located on the server at user specified granularity. Our proposed system uses IaaS as a cloud computing model in our system. A live dashboard is hosted in the cloud that provides interactive visualizations and monetary projections (using local electricity provider tariffs) for the clients. The dashboard is available to the clients via the Internet on any peripheral capable of running a browser. The dashboard contains modules categorized as engineering, business, and user management, which are further divided into sub-categories for an interactive and engaging user experience. The visual breakdown supports changes in the behavior of consumers to use energy efficiently, thus reducing the demand-side load. This research proposed a low-cost and secure IoT-based real-time energy monitoring solution, with the main contributions as follows:
  • Low cost—the system was indigenously developed using open-source software and packages, and appropriate hardware was selected as per our requirements for a minimal cost.
  • User-friendly Multifunctional UI—all the options in the UI were customized and designed carefully, aiming at user preferences and ease, to make the information easily accessible and actionable. The UI was designed keeping the human–computer interface (HCI) in mind. The theme and placement of interactive features were designed and assessed regarding the ease of interaction of the end-user as well as the administrator. The development of the modules is carried out through a modular approach, and the features in each module were designed to encourage behavioral changes towards energy consumption.
  • Compatible Hardware—the EnMS’s universal installation capability makes it vendor-independent for energy meters. All energy meters that use Modbus are supported. The firmware was coded dynamically, so that the changing order of the pins of different parameters does not affect the logic of the insert operation on the cloud database.
  • Secure—the overall solution was secured by establishing a firewall and secure socket layer (SSL) for encrypted communication between different tiers of the IoT framework. Both device-to-cloud and cloud-to-user communications are end-to-end encrypted to provide complete security for the system.
The rest of this paper is organized as follows: Section 2 presents a literature review of related work. Section 3 elaborates on the design methodology, containing the architecture framework and a technological breakdown of the system, with a detailed description of the hardware and software components and security protocols of the system. Section 4 presents the performance validation and system verification, Section 5 presents the results and discussion, and Section 6 concludes the work and presents future directions.

2. Related Work

A lot of recent research work has focused on developing EnMS solutions. Numerous previous studies aimed to bring about long-term behavioral changes in end-user energy consumption patterns by offering EnMSs based on machine learning (ML), IoT, and cloud computing [18]. On the basis of functionality, demand-side energy solutions can mainly be categorized into management and monitoring systems. The monitoring systems provide real-time monitoring [4,18,19]. This is non-intrusive and thus easy to integrate with existing systems, at both higher level (buildings and grids) and low level (devices). On the other hand, management systems not only monitor but also control the connected devices, often with some feedback or load-detection mechanisms [6,20,21]. Due to featuring remote control, these systems are usually applicable for the lower levels, i.e., devices within a building targeting home automation for reducing residential consumption.
These energy management systems utilize different sensors along with a microcontroller to monitor and control energy-related parameters. They have been reported to be successful for home automation [9,21,22,23]. In [6,24,25], a remote energy management system was proposed for end-users to monitor and control multiple devices around the home in real-time from a web interface, thus conveniently controlling electrical appliances remotely. IntelliHome, a cloud-based IoT solution for saving home energy by giving recommendations on consumption, was proposed in [22]. These recommendations were expected to change the behavior of end-users towards efficient consumption. The smart energy management system (SEMS) [26] made a distinctive contribution by implementing a multi-tiered architecture based on cloud computing and the IoT. The transmission control protocol/Internet protocol (TCP/IP) protocol for bidirectional communication; an energy control (ECN) layer; and a flexible hardware configuration with an ESP32 microcontroller, relays, and analytics were all features of the SEMS. The system [27] benefited from the versatile ATmega328, renowned for its advanced virtual RISC (AVR) capabilities. This system combines a liquid crystal display (LCD) display, sensors, and a solar panel to provide effective energy management and monitoring. An ESP8266 was used to connect the ATmega328 to the IoT, allowing data processing on an IoT server or cloud.
An intelligent remote electrical power and supervisory control, supervisory control and data acquisition (SCADA) system was developed using an ASP.Net model-view-controller (MVC) for remote monitoring of electrical devices [13]. A system on chip (SoC) was designed for real-time monitoring and feedback of non-intrusive appliance load monitoring (NAILM) [28]. Apart from the work carried out on the IoT framework, some other frameworks have also been used in the field of home automation for energy consumption. The authors of [29] used fog computing for the development of an energy management system capable of controlling residential consumption at the device level.
Energy management systems have also been developed at a higher level for specific buildings. They were implemented to provide key insights to the building administration for consumption control. An LoRa-based building energy management system (LoBEMS) was developed for the local administration of a Kindergarten school to identify savings with the help of data visualization and implement saving actions locally with personalized heuristics. The authors observed a 20% saving in energy with control of AC and lighting [30]. An advanced IoT-based intelligent energy management system for buildings was built to provide daily and weekly action plans to the administration of the building [31]. An efficient energy monitoring and management IoT-based system was proposed for a machining workshop as an industrial application [32]. The system was designed to provide energy consumption breakdown regarding the actions of the machining workshop.
Now, in the next category, EnMSs for building-level energy consumption are inclined towards providing information about energy consumption patterns, primarily for decision making. A CitiSim-IoT and cloud-based energy monitoring and simulation platform proved to be a viable solution for providing economic key performance indicators (KPIs) to decision-makers [33]. Another application of EnMSs is for clusters of buildings or at grid level for monitoring real-time consumption at an accumulated level. These EnMSs are needed by commercial and industrial consumers for policymaking on efficient consumption. A large-scale IoT-based solution for monitoring a collection of educational buildings of different educational levels (primary, secondary, high school, and university) was developed using a mixture of open-source IoT hardware and platforms, with its responsiveness and scalability being evaluated for its overall performance. The system was capable of providing an open-IT infrastructure to different commercial vendors [2].
Besides conventional energy, many renewable resources for energy generation are now available to address the energy crises from the supply side. However, efficient energy consumption is equally important from the demand side for these renewable energy resources. For this purpose, a renewable energy monitoring system for a decentralized photovoltaic (PV) plant was developed using IoT and a web-based monitoring system for the real-time visualization of the consumption-related parameters [4]. In [3], a smart low-cost IoT solution for monitoring the electrical and environmental parameters of a photovoltaic system was proposed and validated using an economic study of the proposed system. Other than voltage, current, and power, an alternative way of presenting consumption information is in terms of cost/bills. In [34], the authors proposed an ML algorithm for forecasting electricity bills. Similarly, an application for forecasting electricity bills till the next due date for home meters was proposed in [35]. Smart meters (SM) were used for providing time-of-use or real-time pricing solutions in the context of energy awareness and home automation [5].
Apart from the backend architecture, the frontend of an EnMS is also crucial. Both energy monitoring and management systems usually come with a UI for the ease of interaction of the user. The UI helps the user in understanding their consumption usage in a more friendly way, with a level of abstraction of the implementation. Different studies have used different platforms for UI design and development. The ThingSpeak server was used by the authors of [9] to store and plot data graphs. A locally hosted web interface was developed in [33] for visualizing energy consumption breakdown based on the time selected by the user. A web interface is also capable of managing nodes remotely. The authors of [23], displayed daily current monitoring on a single web page. In [3,19], the authors used the open-source dashboarding tool Grafana for real-time visualization of recorded parameters. In [3], five parameters, namely power, current, voltage, temperature, and irradiance level, were visualized using the Grafana dashboard. This dashboard is also capable of generating alerts. The authors in [21] developed a chat-bot application that responds to a particular keyword to inform users about the energy units consumed. In [36], a web-based user interface was developed for monitoring real-time power usage, ratio, and overview on the web. A mobile app was developed in [22], which provides insights into annual and monthly consumption and energy-saving recommendation reports and charts. A mobile notification using the LINE application for forecasting electricity bills till the next due date for home meters was developed in [35]. The authors in [30] of LoBEMS used the Node-RED Dashboard for visualization of weather and consumption parameters, along with AC and lightning plug controllers. Their dashboard was focused on administrative staff and decision making, rather than customers. All of the above discussed UIs had a specialty, but none of them combined monitoring, monetary, and user management features. In addition, a single dashboard with user access control could serve both administrators and users.
Other than an efficient architecture and functional frontend UI, security is another important factor. Most of the proposed IoT-based EnMSs [18,21,22,23] either focused on cutting the cost of the system or introducing new features to the UI, but often overlooked the security aspects of IoT infrastructure. The security of the different layers of the IoT is extremely important. The different aspects of security include confidentiality, data integrity and concurrency, network authenticity, secure channels, etc. The node–server network communication of the connected nodes needs to be secured so that no one can hack, spy, or change the data during transmission. The client–server channel needs security in terms of the integrity, concurrency, and availability of the data. Vulnerabilities of the data layer lead to serious malfunctions and compromising of the data, which may lead to data loss, inconsistency, and unavailability of the system. Few researchers have presented a secured EnMS for household or renewable energy resources [4,19].
The above literature review revealed that there is a need for the development of an economical as well as efficient EnMS based on the decentralized approach, with a single UI facilitating both administrators and end-users by implementing reliability and security with the help of innovative technologies. This research focused on the design, development, and validation of a cost-effective and secure real-time energy-monitoring solution capable of accommodating residential, commercial, and industrial consumers; such as buildings, institutes, homes, and even grids, all in one platform.

3. Design Methodology

This section demonstrates the overall architecture of the proposed EnMS. It consists of a low-cost hardware circuit, a secure communication medium, and a customizable real-time dashboard. The hardware circuit fetches the readings from energy meters. It is highly compatible, i.e., not restricted to any specific vendor. The communication module is designed for the secure transmission of data at user-specified intervals via Wi-Fi to the cloud server. The server hosts a website that allows users to visualize and monitor real-time consumption and usage. The architecture of the EnMS is discussed below.

3.1. Overall System Architecture

The proposed EnMS architecture consists of a single cloud-based server, with multiple clients and nodes, as shown in Figure 1. A node is a specially designed low-cost embedded hardware responsible for acquiring the electrical energy consumption data from the energy meter and transmitting it to the server with the help of a Wi-Fi module. The server runs consistently over the cloud, receiving information from the nodes. The server also hosts a web interface allowing clients to remotely monitor their respective authenticated meter’s electrical energy parameters as well as accumulated bills for a default defined period. The end-user can change the defined period for billing as per the requirements for run-time. The dashboard is flexible and adaptable to the clients’ requirements. Triggers for alarms and warnings are customizable as per the clients’ needs. Clients can query the database and set rules for consumption alerts, i.e., defining minimum and maximum thresholds for different energy-consumption-related parameters. Clients can be any peripheral capable of connecting to a wired or wireless network exhibiting hypertext transfer protocol/hypertext transfer protocol secure (HTTP/HTTPS) web pages. The reason for using web pages is to avoid disputes of the compatibility with different operating systems for the application (app) like Google Android, Apple iOS, and Microsoft Windows. As each of the operating systems would require a custom-built version of the system (in different programming languages), but all support web browsers by default.

3.2. Technological Breakdown of the Architecture

The above-discussed architecture of the overall system was implemented using various open-source tools and technologies and off-the-shelf components to obtain the desired features. A technological breakdown of the overall architecture is depicted in Figure 2. The breakdown is based on the customer and server’s requirements for a smooth flow of data and ease of management. The energy monitoring node entails hardware and communication; the cloud server consists of services, security, database, and infrastructure; and the client has access to an interactive UI. The UI consists of several features for providing detailed information about consumption-related parameters. The technological breakdown is elaborated in Section 3.2.1, Section 3.2.2 and Section 3.2.3.

3.2.1. Energy Monitoring Node

Considerations were made for the proposed embedded circuit to keep it low-cost, highly compatible, and readily available with the necessary functionality. The circuit can be categorized into two major modules, namely the main controller board and the communication module. The RS-485 Modbus protocol is responsible for communicating with the energy meter, which is mostly available for clients and uses a DAQ card for raw data acquisition. Once it obtains all the parameter values, the main controller i.e., Arduino, fetches these values and makes a GET HTTPS request uniform resource locator (URL) along with a node mac, assigned device id, and password to distinguish between multiple devices at the same or different locations. This is then sent to the server using the ESP8266 Wi-Fi microchip communication module. The card design is generic so that the same base design can also be used to support a 2G/3G/4G modem or Ethernet connectivity module. The requisite power module for these communication mediums can be easily replaced instead of the existing power module required for Wi-Fi communication. The main controller Arduino board runs on firmware. Although there are other possible communication protocols for the IoT such as message queuing telemetry transport (MQTT) and Zigbee, etc., due to a limited number of nodes, a GET request at a higher level with HTTPS is sufficient. The circuit is protected from surges on the AC side by optocouplers on the input ports. The proposed embedded circuit is compatible with vendor-neutral energy meters, as long as they use Modbus. It currently supports meters from Schneider [37], Elmeasure [38], Crompton [39], Ziegler [40], and Selec [41]. Table 1 displays the circuit components with their respective functionalities and communication technologies.

3.2.2. Cloud Architecture

The cloud server is further categorized into storage, control, and communication. A standard virtual private server (VPS) is configured to provide services, security, and infrastructure to serve this purpose. The hardware configuration of the server is shown in Table 2. The hardware configurations of the server are easily scalable by upgrading the package, but as of now, these configurations satisfy our requirements. Ubuntu Linux 18.04 long-term support (LTS) is used as the operating system for the server. The storage space of the cloud needs management to store data within a single data center. The MySQL server is used as the relational database management system (RDBMS) for the create, read, update, delete (CRUD) operations, i.e., for managing and storing on our cloud. The received data are stored in a specified table format and their consistency and integrity are maintained by relational keys, thus avoiding data redundancy, as well as saving the memory space and cost for the server. Triggers are configured for every new reading, to quickly generate alarms and warnings as per user-defined thresholds. A custom application programming interface (API) was built for data management between the nodes and the server. These scripts use the PHP data object (PDO), which is a built-in class of hypertext pre-processor (PHP) allowing the database connection to run queries written in structured query language (SQL).
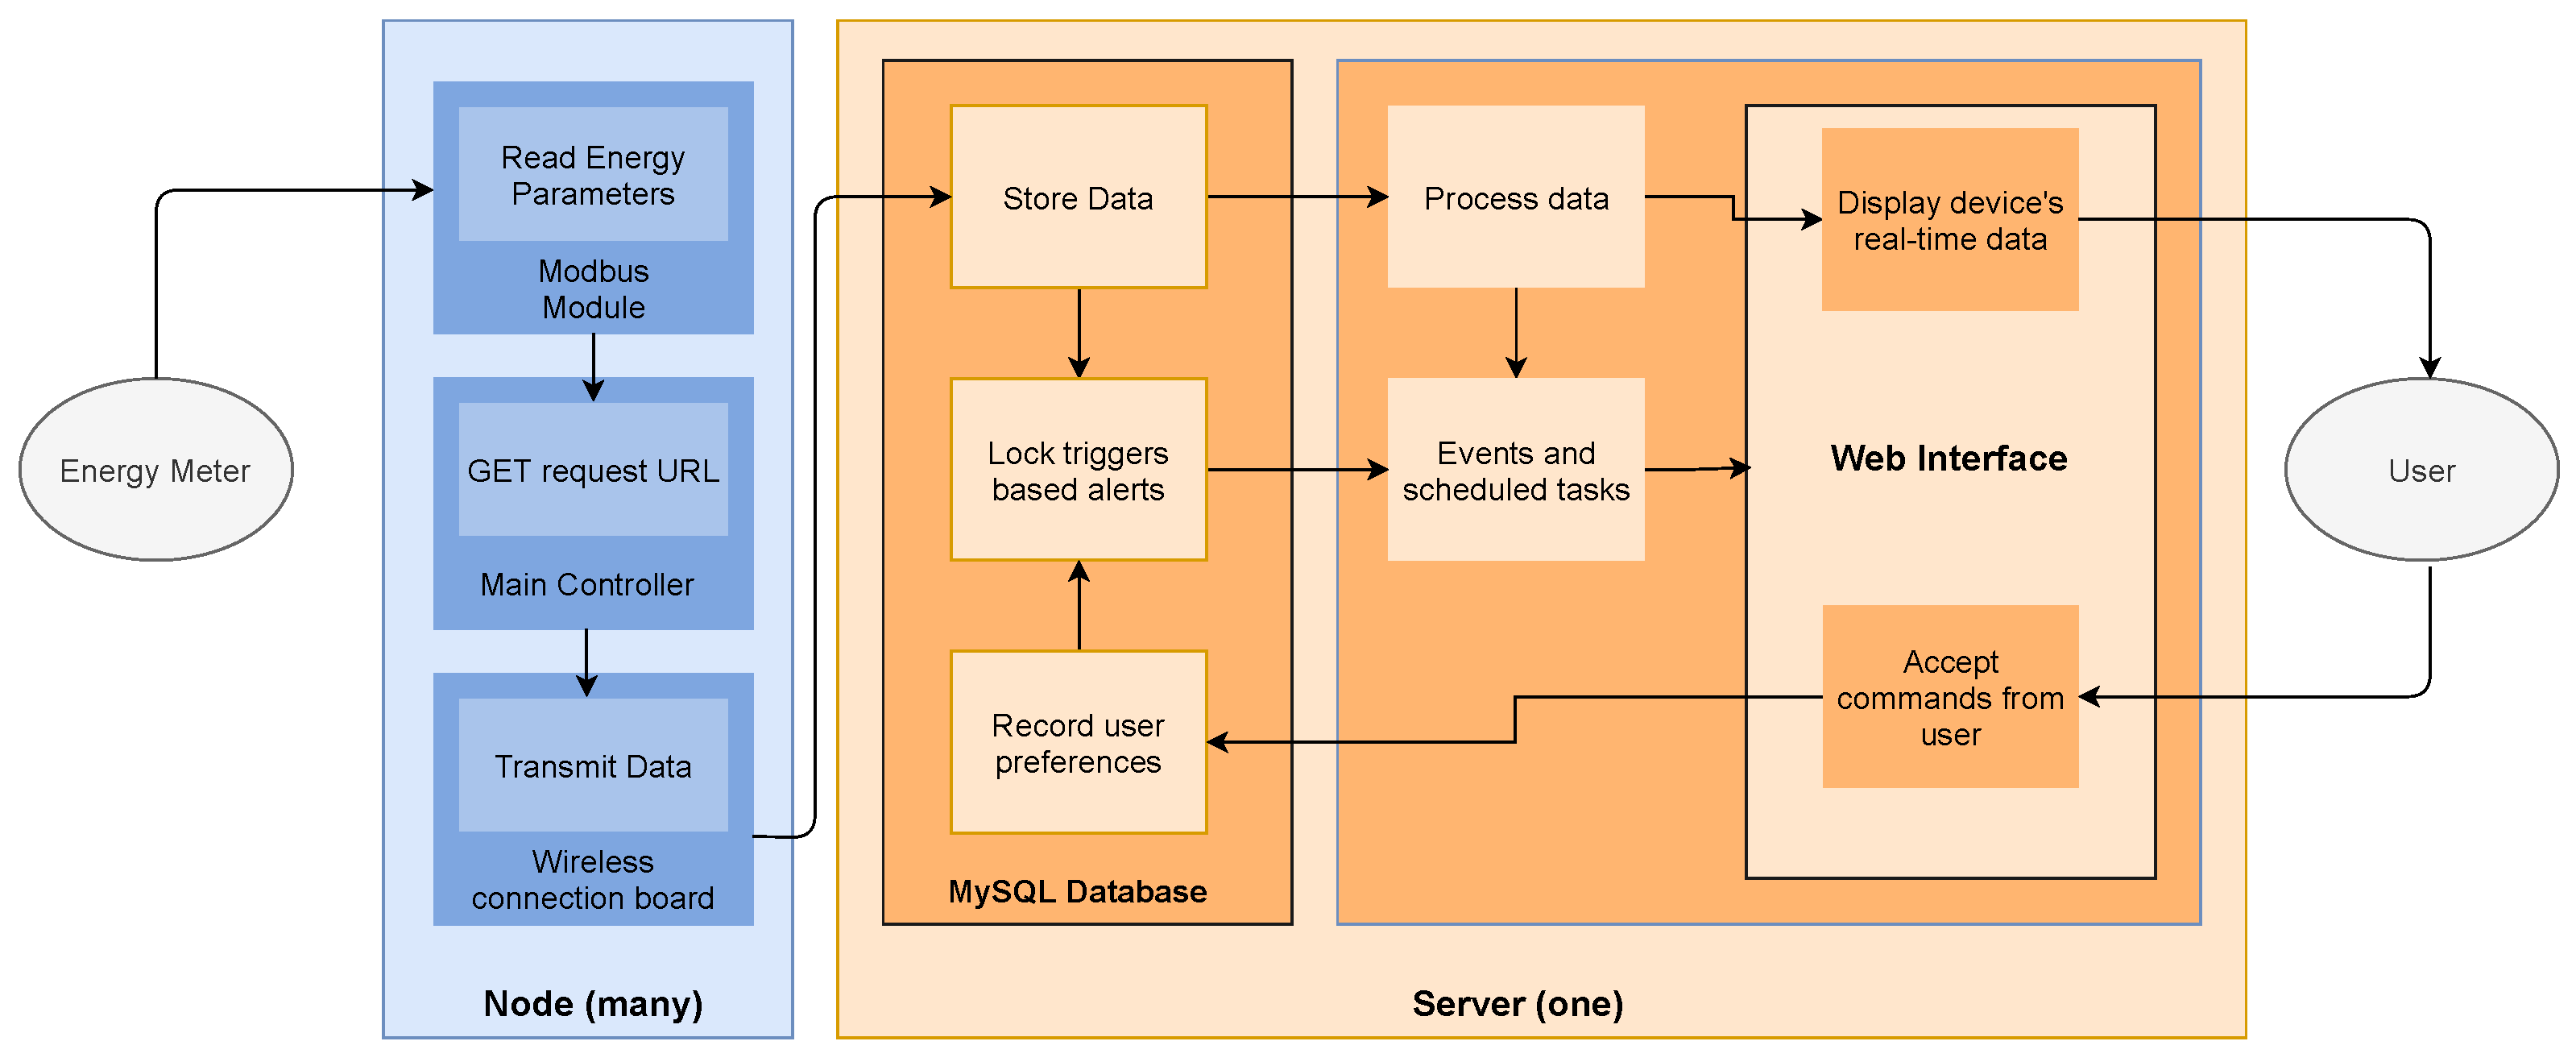
The complete dataflow of the EnMS is shown in Figure 3. The Modbus module reads energy parameters, i.e., voltages, currents, and powers from the energy meter. These parameters are then passed to the main controller module, which makes a GET request by assigning the values of the parameters to their designated variables. This request is then sent to the server, where the custom-built API receives the variables and then stores the values into the database. This is updated on the live monitoring module asynchronously. There are different triggers for alarms and warnings listed on the database for different parameters, and as soon as the event of storing a new record occurs, the triggers are activated and if any of the parameters crosses the specified threshold for an alarm or warning, an alert is sent to the dashboard as well as an email to the user if the user has subscribed for alarms and warnings. A warning and alarm log is also maintained on the dashboard for user access. The thresholds for the parameters are user-customizable, as different types of users have different types of consumption. When a new device is set up it has pre-defined thresholds. Users can update the thresholds as per their requirements and this updating automatically updates the triggers on the database. Apart from alerts, users can also set preferences for the types of charts to be displayed in the trends module. The trends module remembers these preferences, even after the session is closed by the user. The daily and monthly reporting of the energy consumption and budgeting is set to auto-generate and is emailed to the user through cron jobs.

3.2.3. The User Interface (UI)

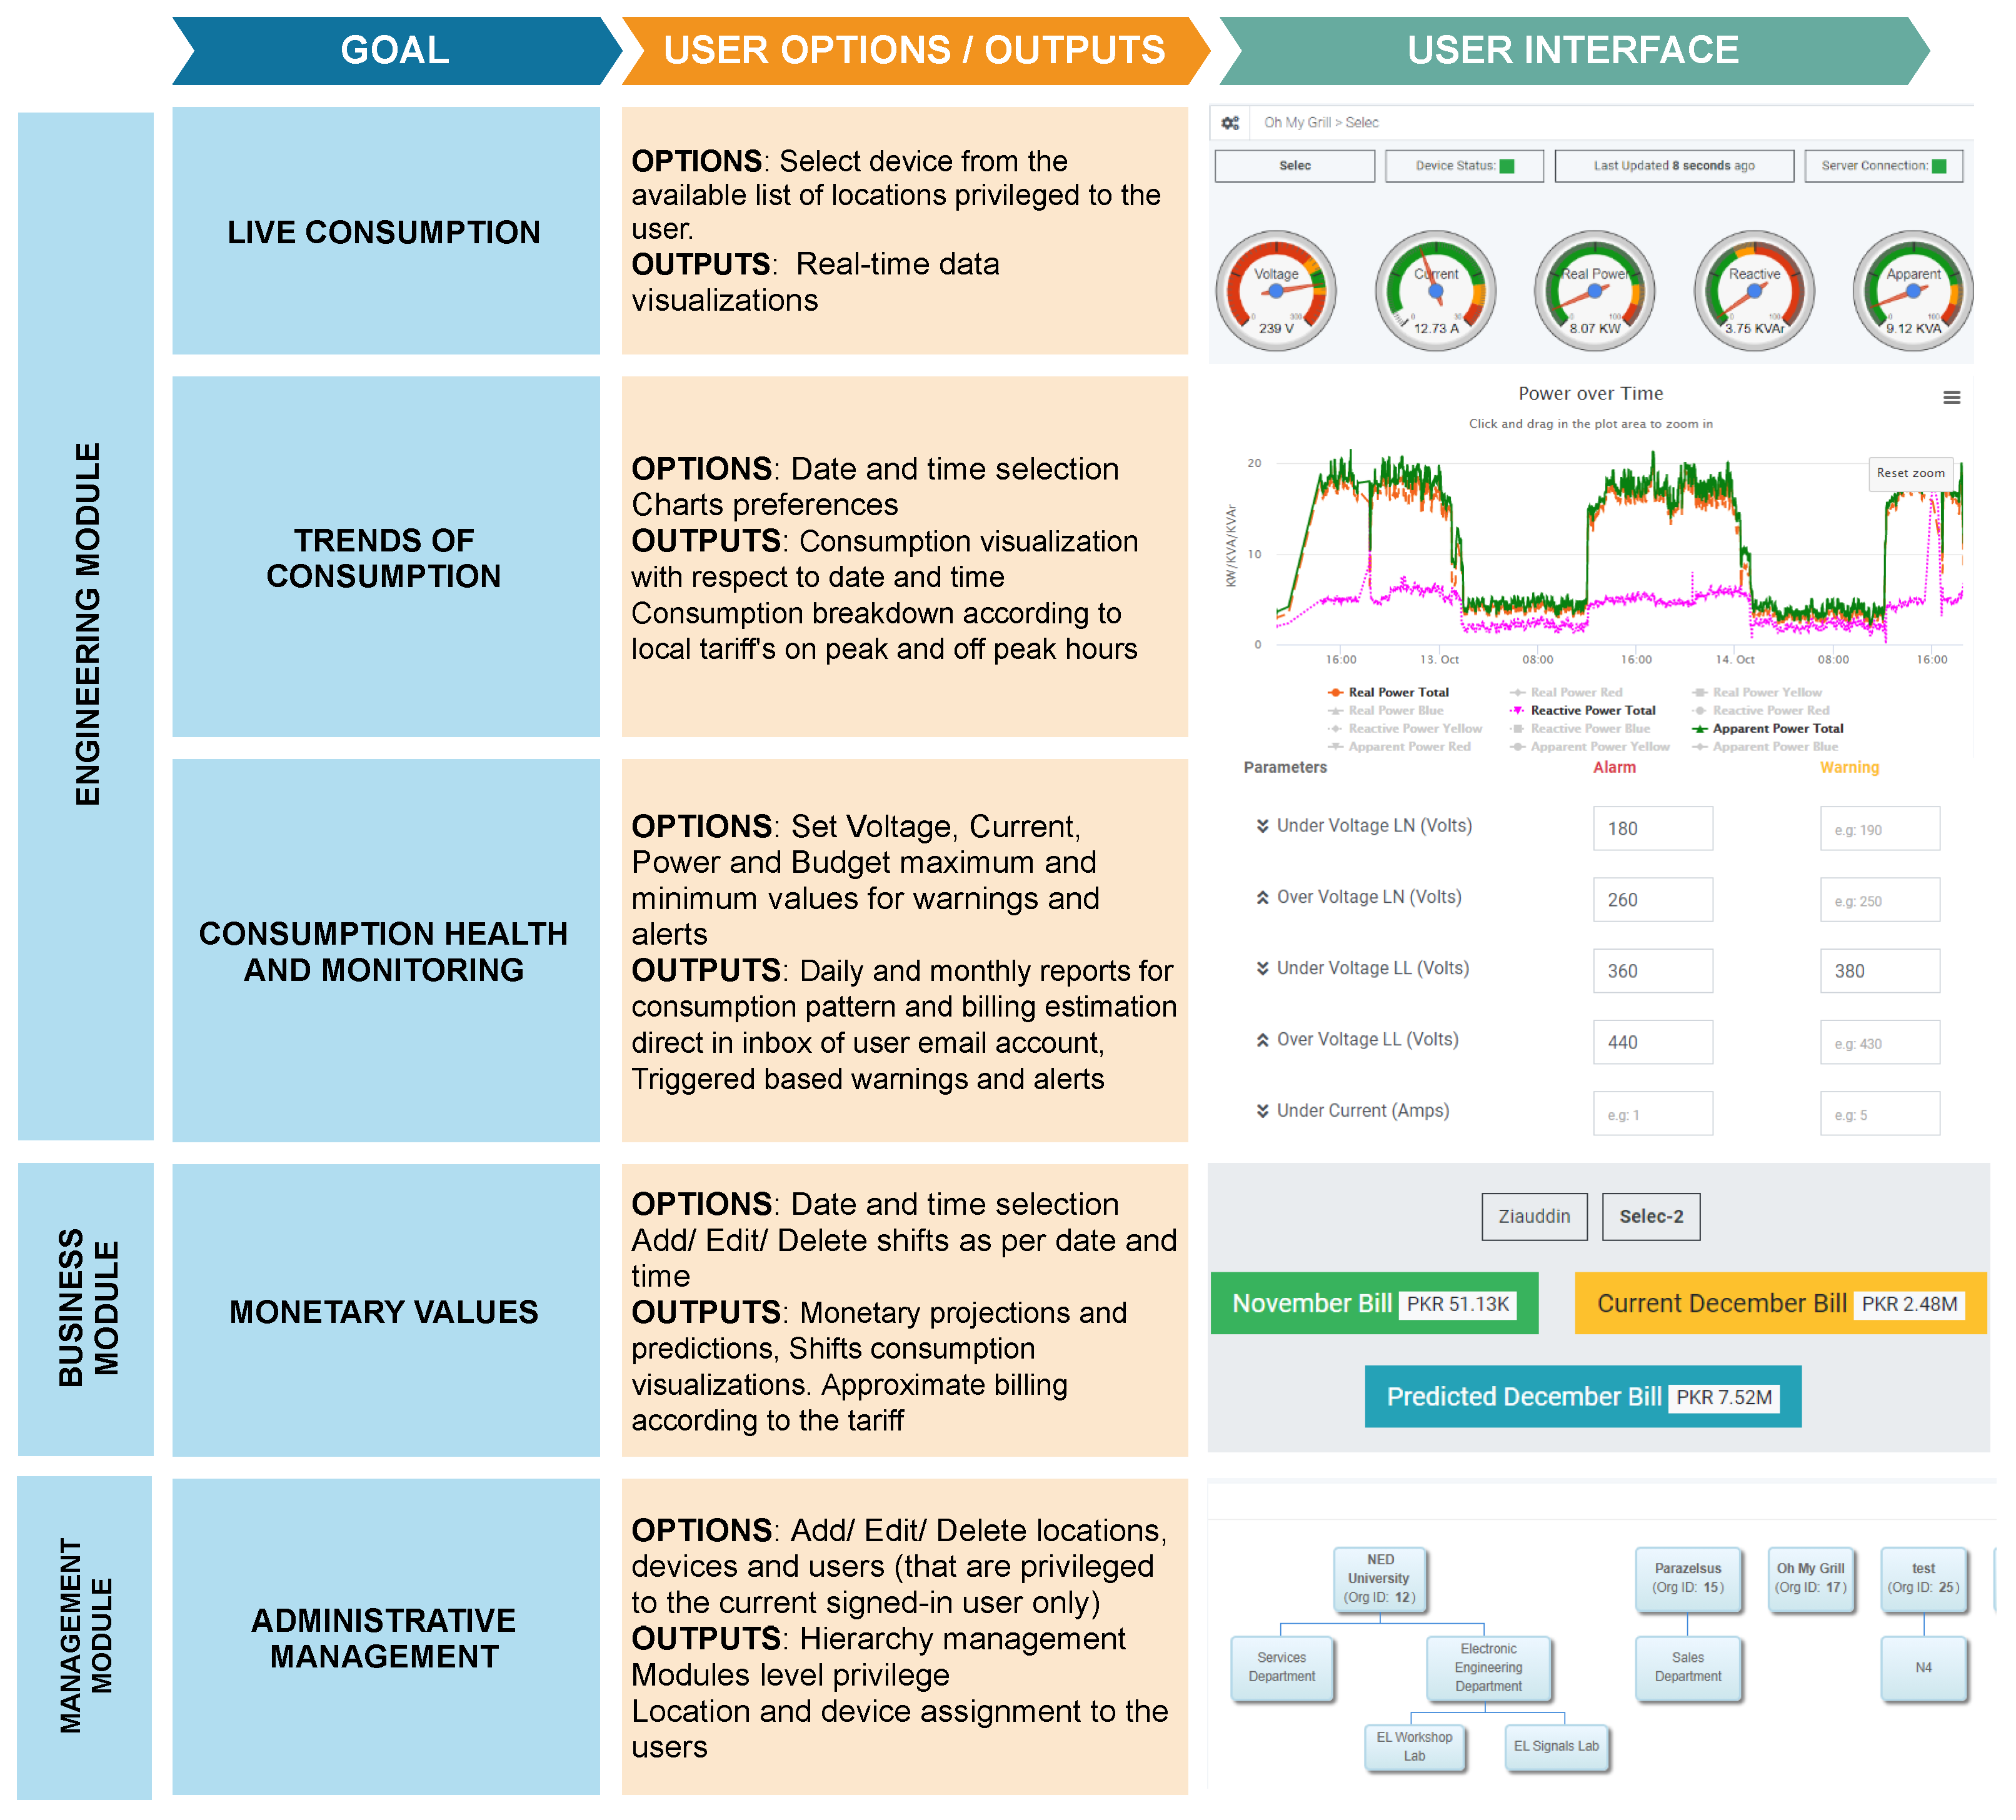
The transmitted data in raw form are hard to understand and interpret by the end-users. Therefore, the data are presented in a human-understandable form using a graphical user interface (GUI) accessed by the end-user through email authentication sign-up logic. For real-time visualization of the consumption, the following parameters are monitored: line neutral voltage, total line current, total real power, total reactive power, total apparent power, power factor average, all with their respective phases in yellow, red, and blue. The dials are configured for easy understanding of the consumption at a glance. The modular technique was used to develop the website. The modules are categorized as engineering, business, and management handlers. The engineering module is further divided into live monitoring, trends, reports, and warnings. Besides live monitoring, the engineering module is configured to generate trends, reports, alarms, and warnings for a consumption health record and timely feedback to the user. The business module consists of the intelligence and billing part of the EnMS. This module is targeted towards the financial viability of the end-user’s organization. The management module has organization and users, which allows the administration to remotely manage their locations, devices, and allowed users. Figure 4 shows the list of goals, user options, and outputs for each of the respective goals provided by the developed EnMS.
The above-discussed GUI was designed keeping HCI in mind. HCI focuses on the interfacing between humans and computers and incorporates ergonomics and psychology into the field of computer science. The color theme and placement of interactive features were designed and placed as per the user’s ease of interaction with similar websites. Responsive web design (RWD) was used to create a user-friendly web interface with an adjustable user screen size. Figure 5 shows the developed web-based dashboard for achieving the listed goals.
The user experience is enhanced by providing assorted features for behavioral change, expense monitoring, and consumption feedback. The developed features as listed in Table 3 are explained as follows:
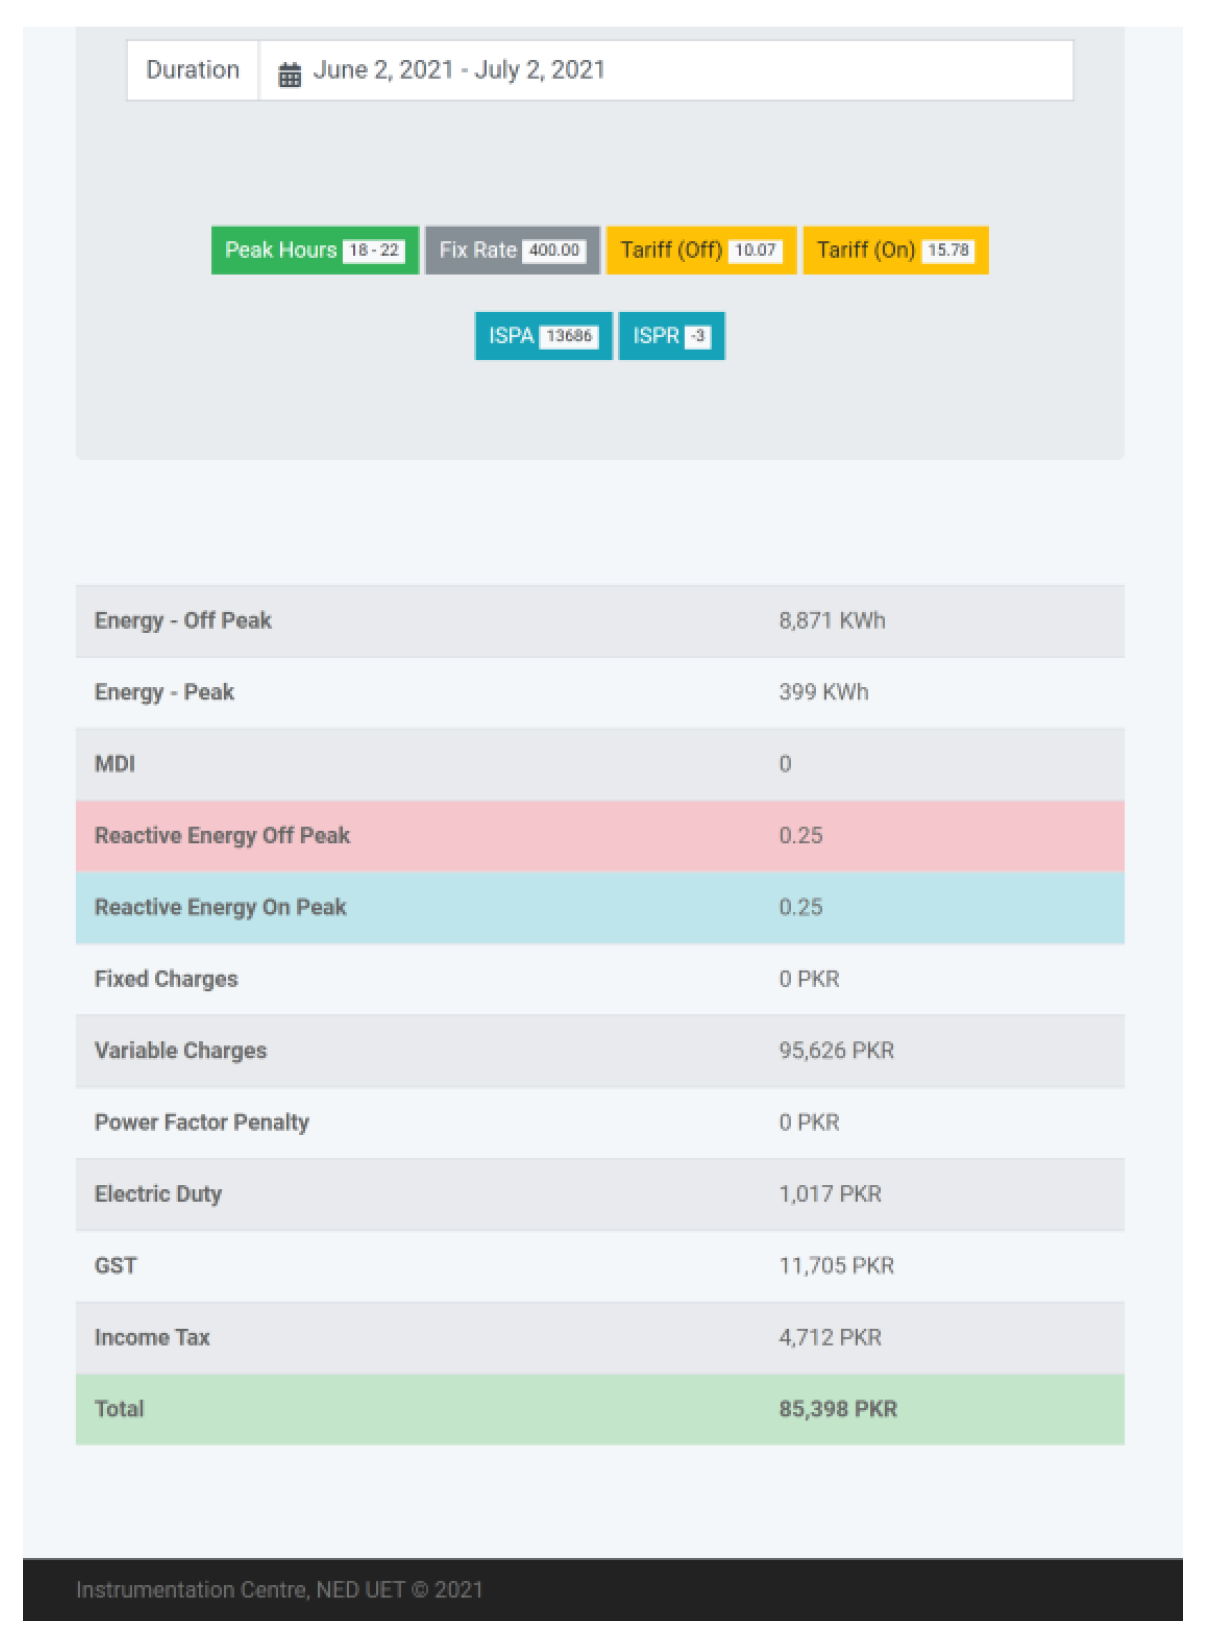
  • Behavior Change: The proposed EnMS architecture allows assisting in changing user behavior by gathering usage patterns and displaying information in a consciously modulating manner. Auto-generated daily and monthly reports are sent to the user by email at the end of each day/month. The daily report contains an energy consumption graph of the day with on-peak and off-peak hours highlighted. The consumption pattern is compared with the same day the previous week, as well as with the temperature of the current day. Conversely, the monthly bill received by the customer at the end of the month from the local energy utility provider has a minimal effect on the consumption behavior of the customer in a reactive manner. As that bill only shows a single bar for the whole month’s consumption, with no peak-hour breakdown. The proposed EnMS generates a monthly report as shown in the Appendix B.
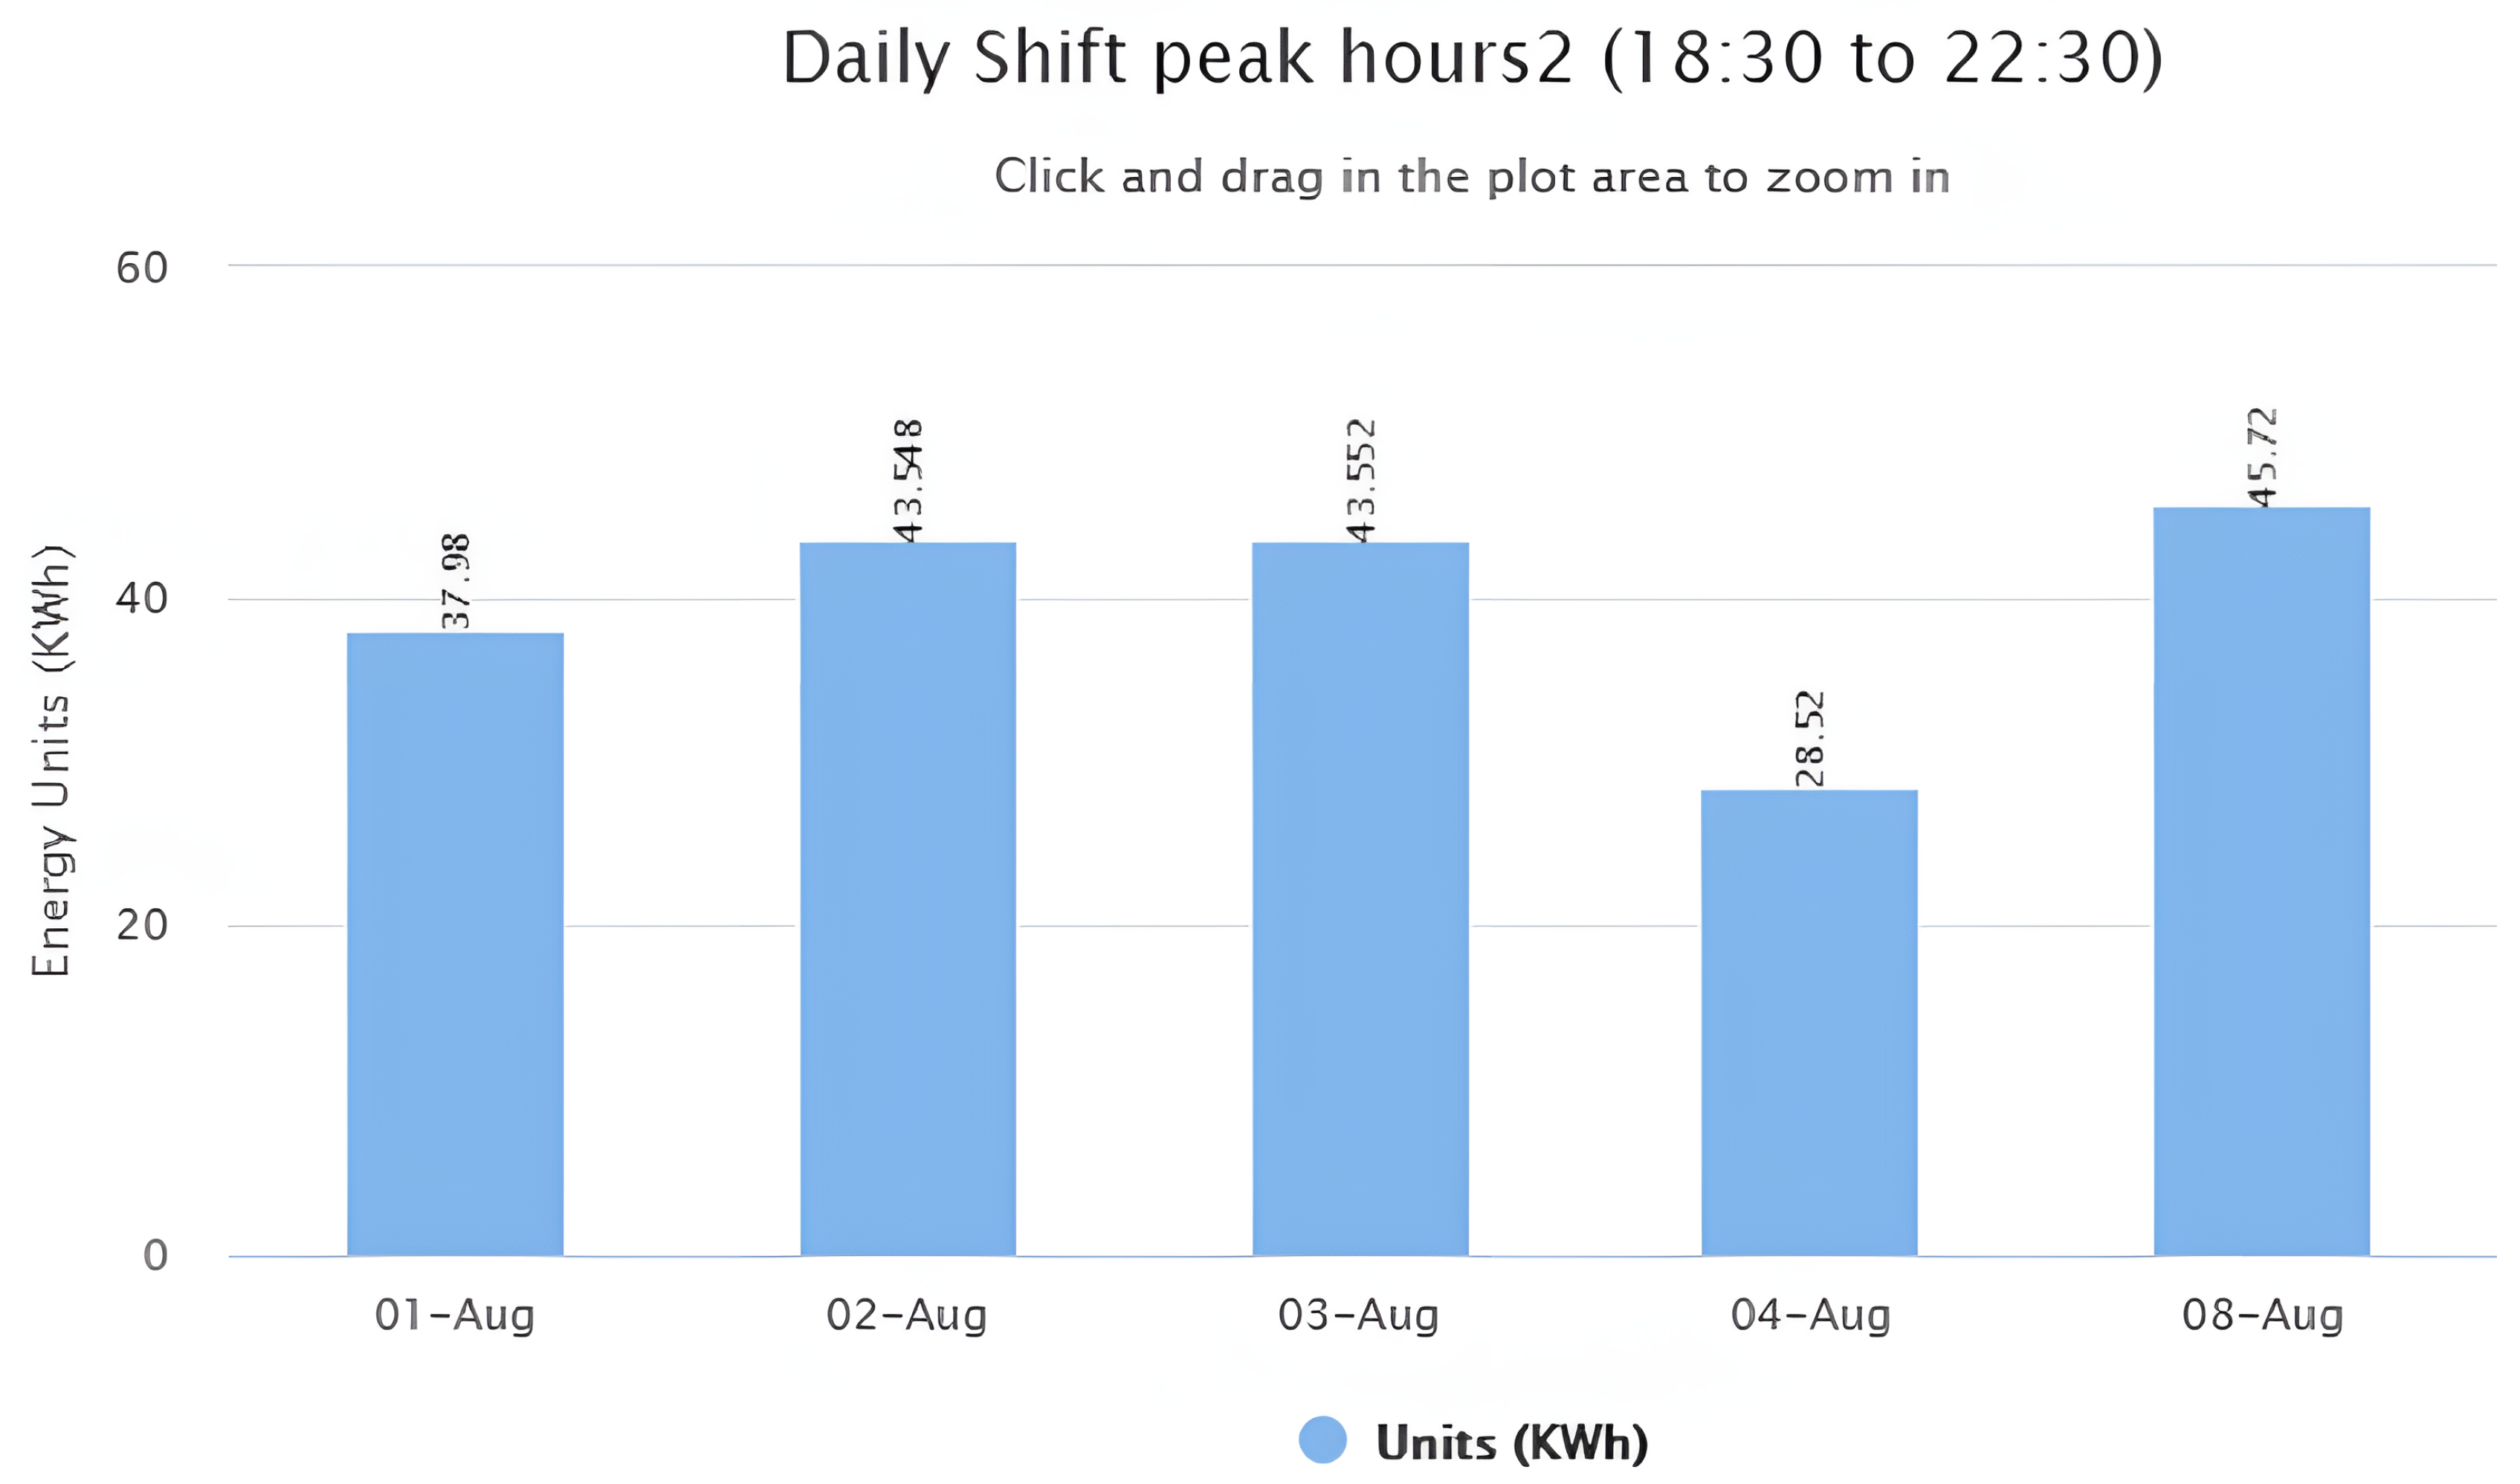
    Along with these reports, the daily shift graphs also help in monitoring and controlling consumption by allowing the users to make policies for the time of the shifts, as depicted in Figure 6. The shift graphs help in visualizing the energy consumption during the defined shifts of the user. This feature helps in keeping the track of the consumption in the allotted time period. The user can manage and relocate the shifts for efficient management and consumption in a proactive manner.
  • Expense Monitoring: The total energy units in terms of kilowatt hours (kWh), as well as on-peak and off-peak, are also shown in numeric form and converted into charges according to the tariff used by the customer. The daily consumption is broken down into on-peak and off-peak units, as well as charges calculating the amount in per-day and hour granularity. The amount is further divided per hour and a pie chart visualizes the contribution of on-peak and off-peak units to the total bill of the day. All this information helps in changing user behavior towards more efficient consumption, in contrast to just a lump sum amount at the end of the month with no breakdown based on per day or hour charges or a separate on-peak and off-peak consumption analysis, as shown in Appendix A. The accumulated billing calculation before the end-of-month helps in visualizing the consumption amount using the tariff provided by the commercial utility provider. The user can select any time period for generating the bill and can monitor upcoming estimated/expected expenses before the actual bill comes. The billing module is depicted in Figure 7.
  • Consumption Health: The users are allowed to set up the min and max values of the following parameters for the alarms and warnings thresholds of their consumption. The alarms and warnings when occurring in real-time consumption are locked with the time-stamp, as well as the value above/below the threshold, which helps the customer in monitoring the health of their consumption.
  • Feedback on Consumption: The generated reports contain feedback on the energy consumption of the day and month. The pie chart visualizes the bill’s monetary division, as shown in Appendix A. It shows a breakdown in terms of the money making up the whole bill. The ultimate target of the user is to reduce the amount of on-peak bills, so that the total amount of the bill can be reduced. The on-peak ratio is calculated and compared with a predefined chart based on scale division, as shown in Table 4. This interpretation of the ratio of consumption helps the user in reducing their on-peak ratio, so that the overall consumption and billing can be reduced. The on-peak ratio is calculated as shown in Equation (1).
    O n P e a k R a t i o = o n p e a k u n i t s o f t h e d a y t o t a l u n i t s o f t h e d a y

3.3. Security of the Proposed EnMS

The security of any cloud-based IoT architecture is the main concern during all phases of communication, whether it is node-server communication or client-server communication. The security challenges of the IoT framework requires the ability to ensure security through integrity, confidentiality, authentication, end-to-end encryption, etc. The confidentiality, integrity, availability (CIA) triad ensures security on the overall system.
The confidentiality of the system is defined as the availability of the data to authorized users and nodes only. The nodes must not reveal the information to any unauthorized IoT device connected to the same network. The developed EnMS secures the confidentiality of the system by ensuring that every time the server receives a request from a node it authenticates the node by matching its media access control (MAC) address, location, device id, and password already registered in the database. MAC addresses are always unique, and this allows the node to be identified by the server, even if its IP address changes due to the dynamic host configuration protocol (DHCP) network. If this does not match, the process will exit. This authentication process is mandatory every time a node hits the server. To ensure the confidentiality of the EnMS for the client, the client–server communication is secured through an SSL certificate, which is obtained on the domain name server (DNS) to ensure the HTTPS protocol on the browser. The HTTPS protocol encrypts the communication between the client and the server. Hence, it is impossible for third parties to read or modify messages in transit. The browsers indicate secure links by adding a small lock icon in the URL bar. The whole interaction of the user with the dashboard is also protected by session management.
This integrity is very important to ensure the accuracy of the data, i.e., that they are coming from the right nodes and have not been tampered with during the transmission process, due to any interference. The management of data traffic is crucial and is maintained by the use of firewalls and protocols. The integrity of the developed EnMS data is ensured as the requests between nodes and servers are sent through the TCP protocol rather than via a user datagram protocol (UDP) socket. The TCP guarantees that the information is received in the same order as it was sent along with a record of any information lost. UDP is faster than TCP but it can lead to receiving newly sent information before the older ones are received, thus losing the concurrency of data. TCP throughput and response time are sufficient for the proposed EnMS. The server’s firewall was configured to allow the listening port of Apache to use TCP communication only.
The availability of all the devices in the IoT framework helps the authentication mechanisms to work properly and protect the information by ensuring the availability of the data. Access channels and connected systems all have to work simultaneously to ensure the availability of the data when it is needed. The EnMS dashboard is available 24/7, and the nodes send data at user-specified intervals. If any node loses connection, it will automatically, non-intrusively connect to the network, due to its hardware configuration and ability to connect to known saved networks.

4. System Validation and Verification

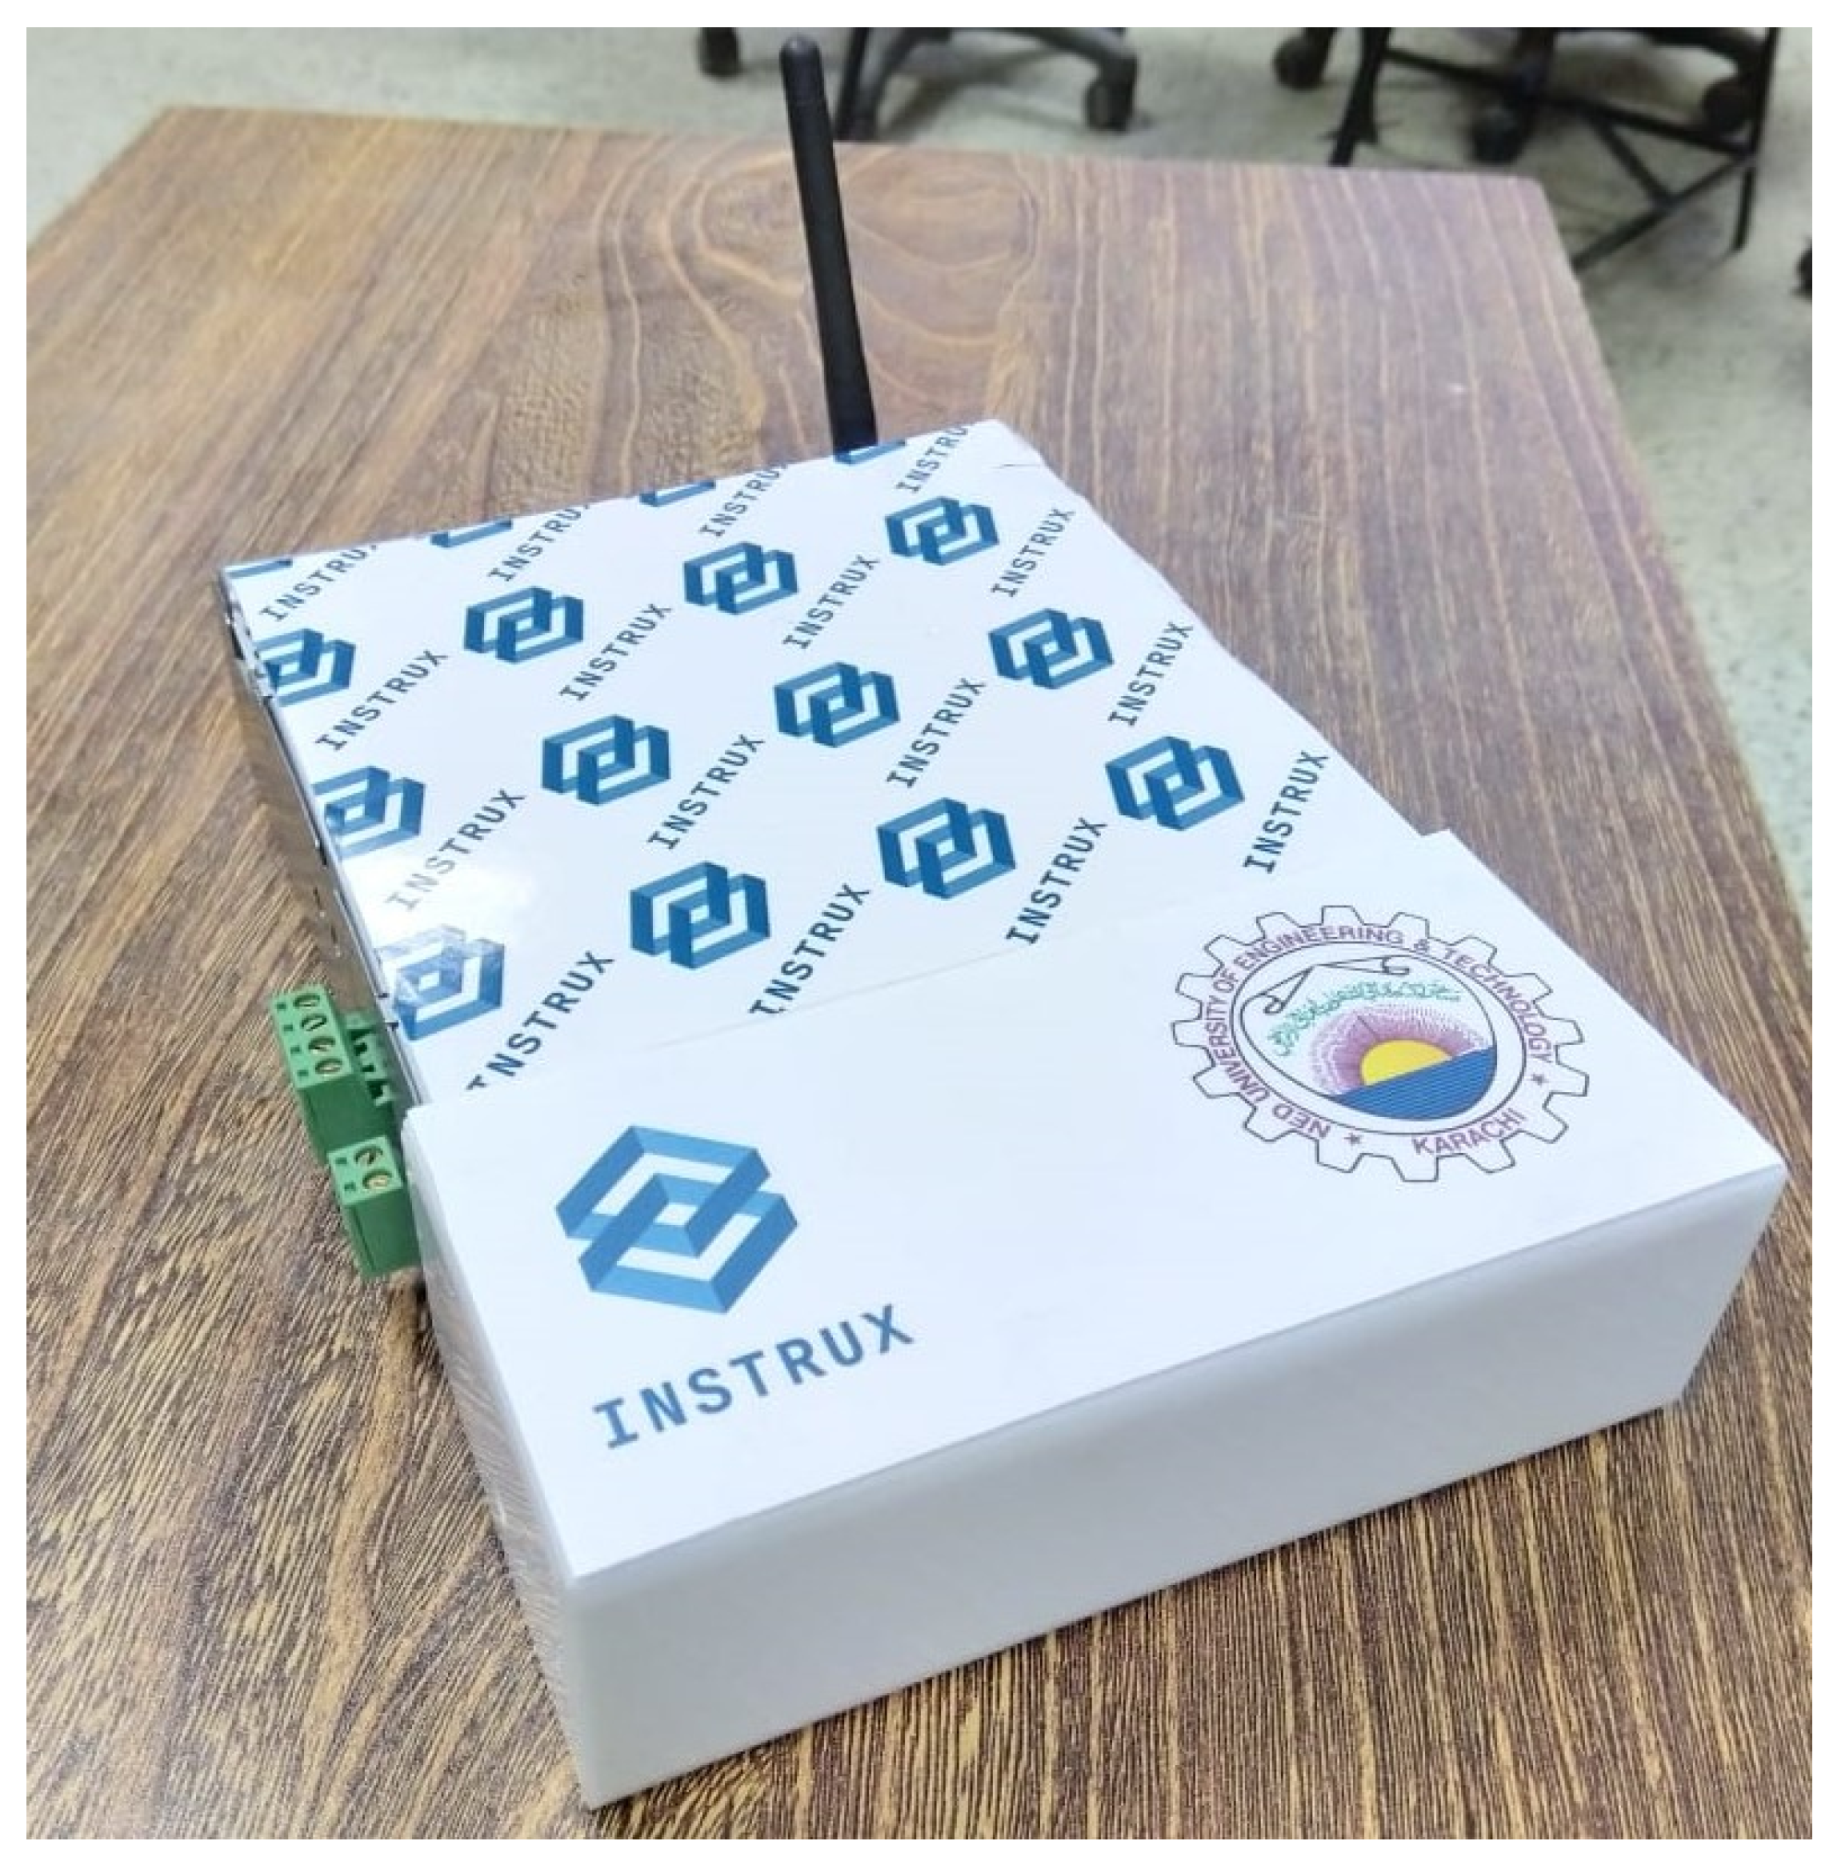
To analyze and validate the performance of the EnMS, several in-house testing techniques were implemented, such as unit testing, integration testing, and white box and black box testing. The unit testing was performed on each module and after integration of every module, and the integration testing was carried out to test the whole system. The white box testing of the embedded circuit hardware was conducted on the solder board as well as on the PCB. After successful testing of all the components, the PCB was transformed into a ready-to-install box for black-box testing. Figure 8 depicts the circuit box ready for installation.
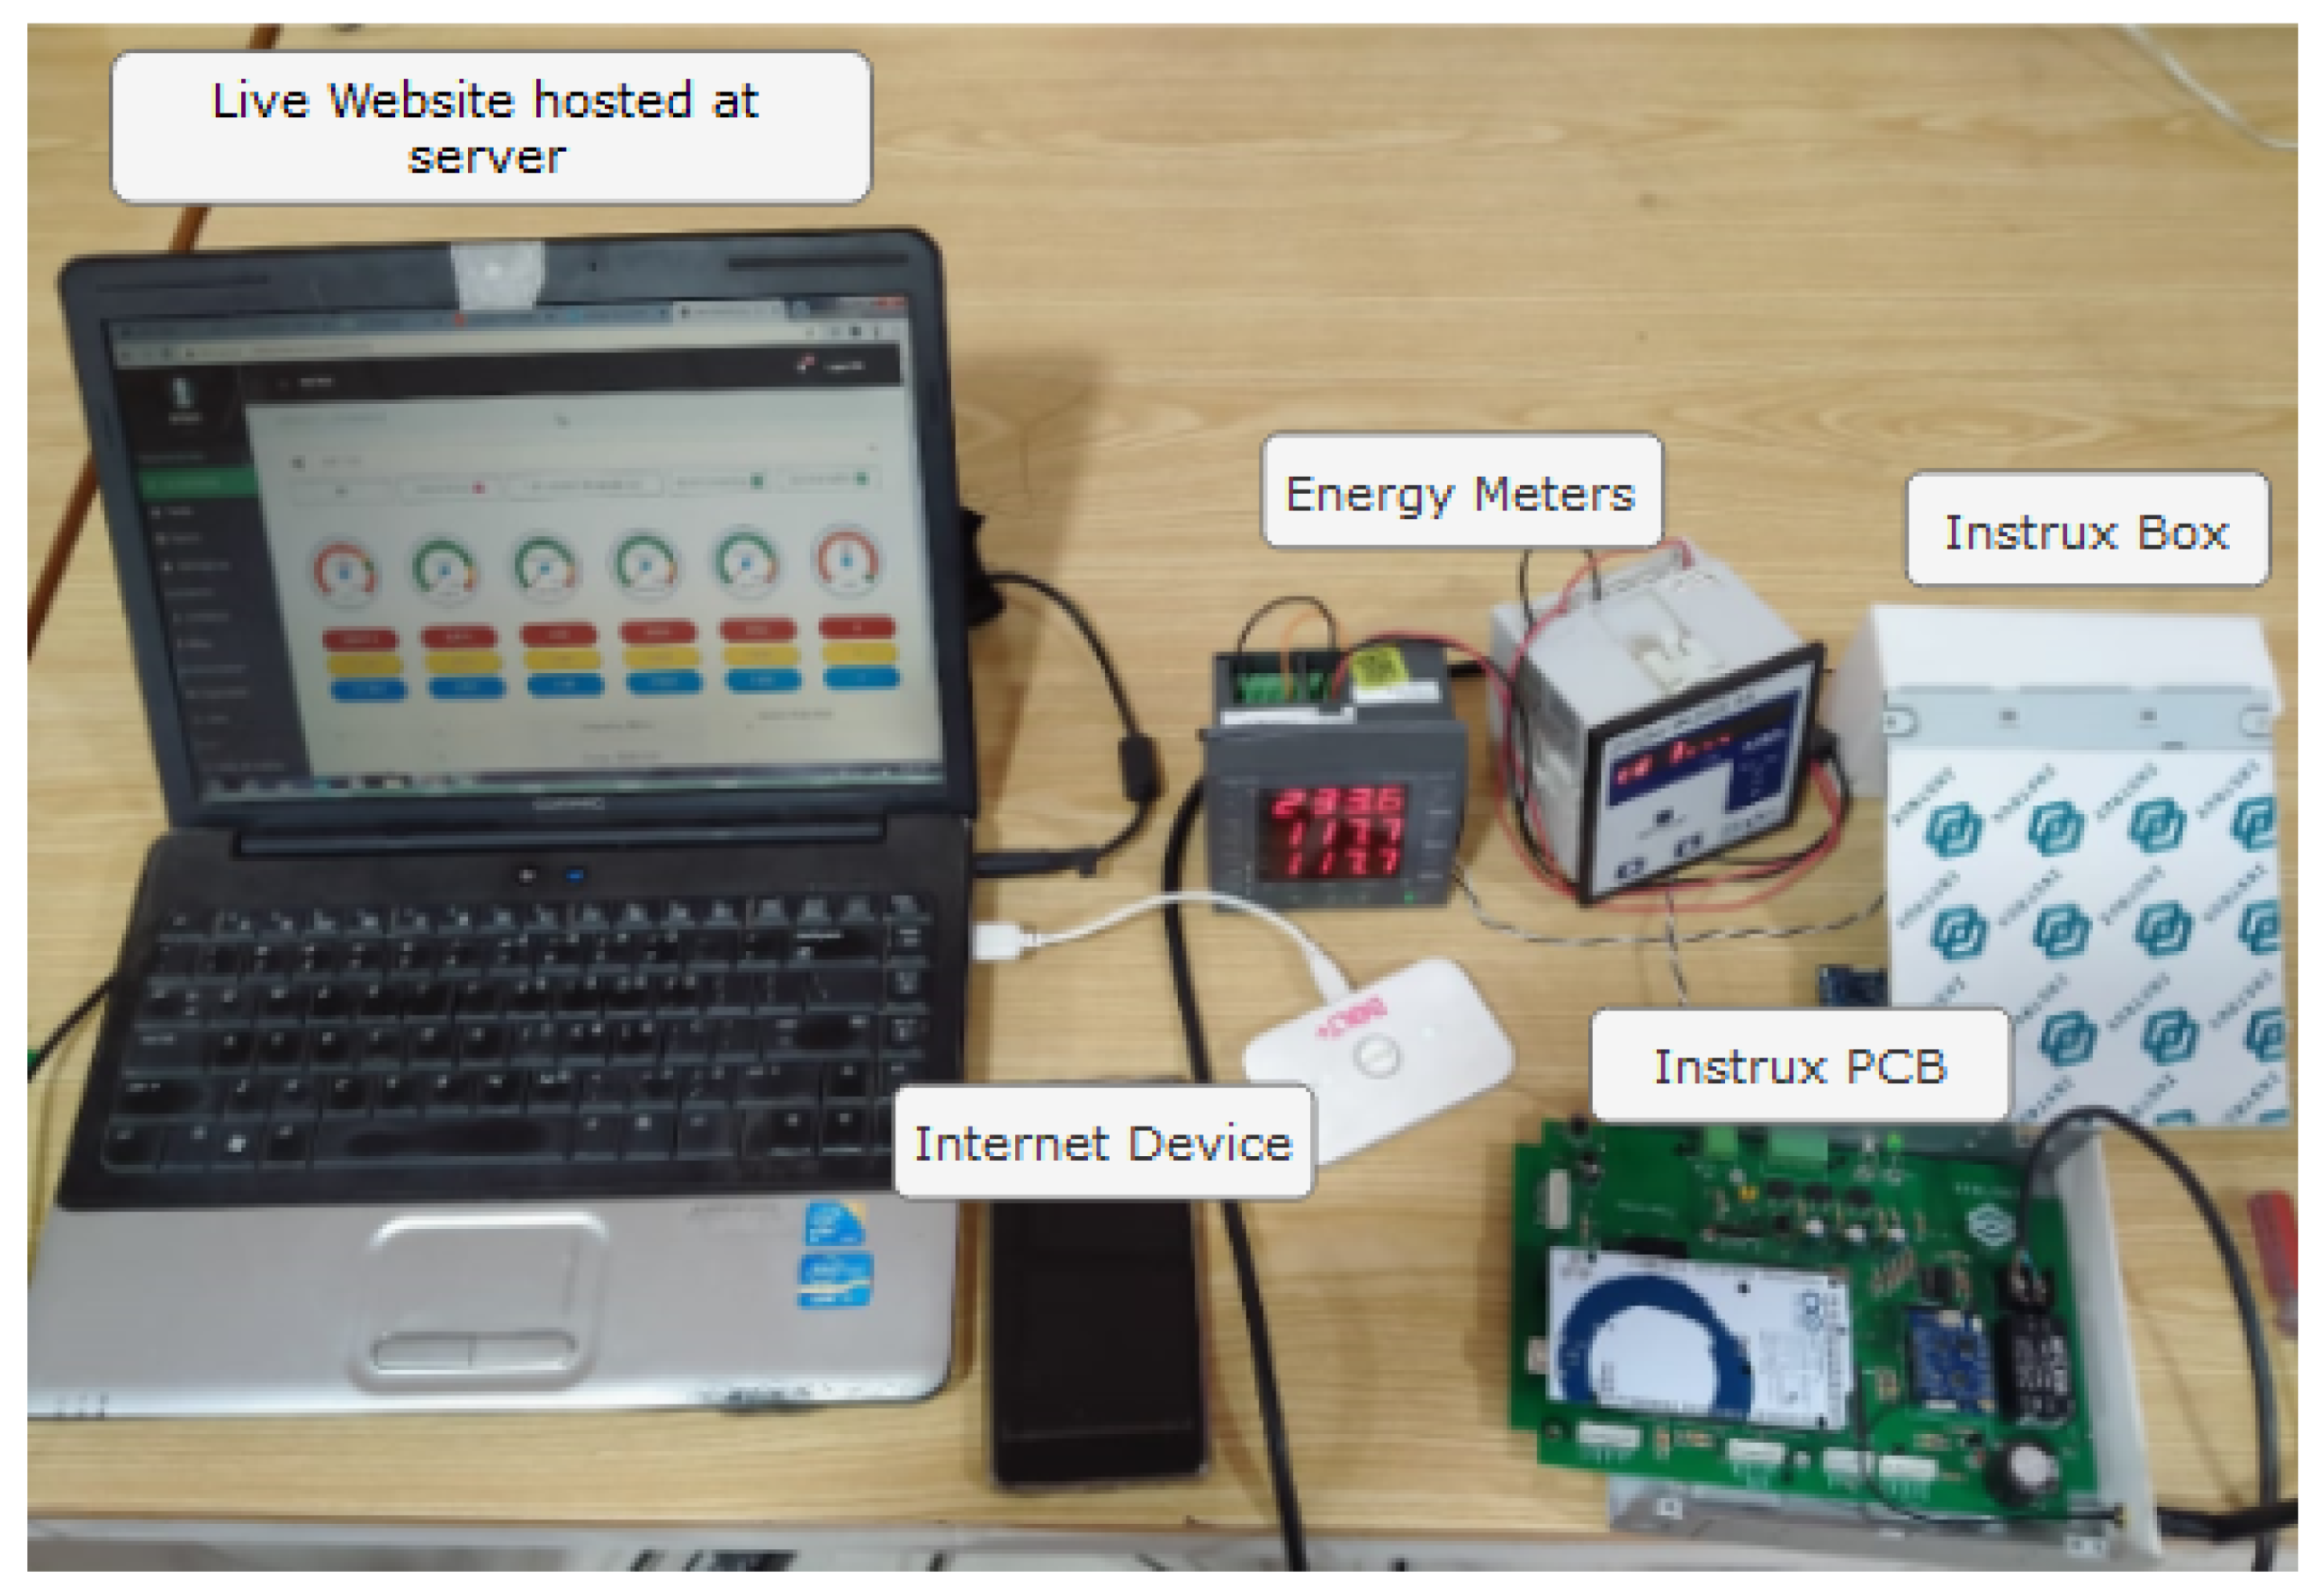
The in-house validation of the overall system was carried out using a demo setup, as shown in Figure 9. The system was validated by changing and connecting different vendor meters to the circuit one by one. The synchronization of the database and live monitoring front-end module was validated for displaying new readings without reloading the web page. After the successful validation of the overall system, it was deployed on real energy meters at different locations.
After demo testing, rigorous experiments were performed at the NED University of Engineering and Technology. For performance evaluation, the EnMS was installed at an energy substation, as well as the electronic department of the university for one complete year. The load connected to the substation under observation comprised the Services Department, National Incubation Center (NIC), Civil Engineering Department classes, Office of Student Affairs, Directorate of Industrial Liasion (DIL), Student Cafeteria, and Medical Department. The data sent to the server were analyzed for maintaining the integrity of the database. The node (embedded circuit) status and server connection, as well as their synchronization of, were programmed to check the last successful connection of each node to the server. In this way, malfunction tracking became easier, i.e., either a node was not able to connect to the server or the server itself was unresponsive. The EnMS was found to be efficient in all aspects. For more rigorous experiments and validation, the system was also installed at industrial and commercial clients. Further details are elaborated on in the case study below.

Case Study

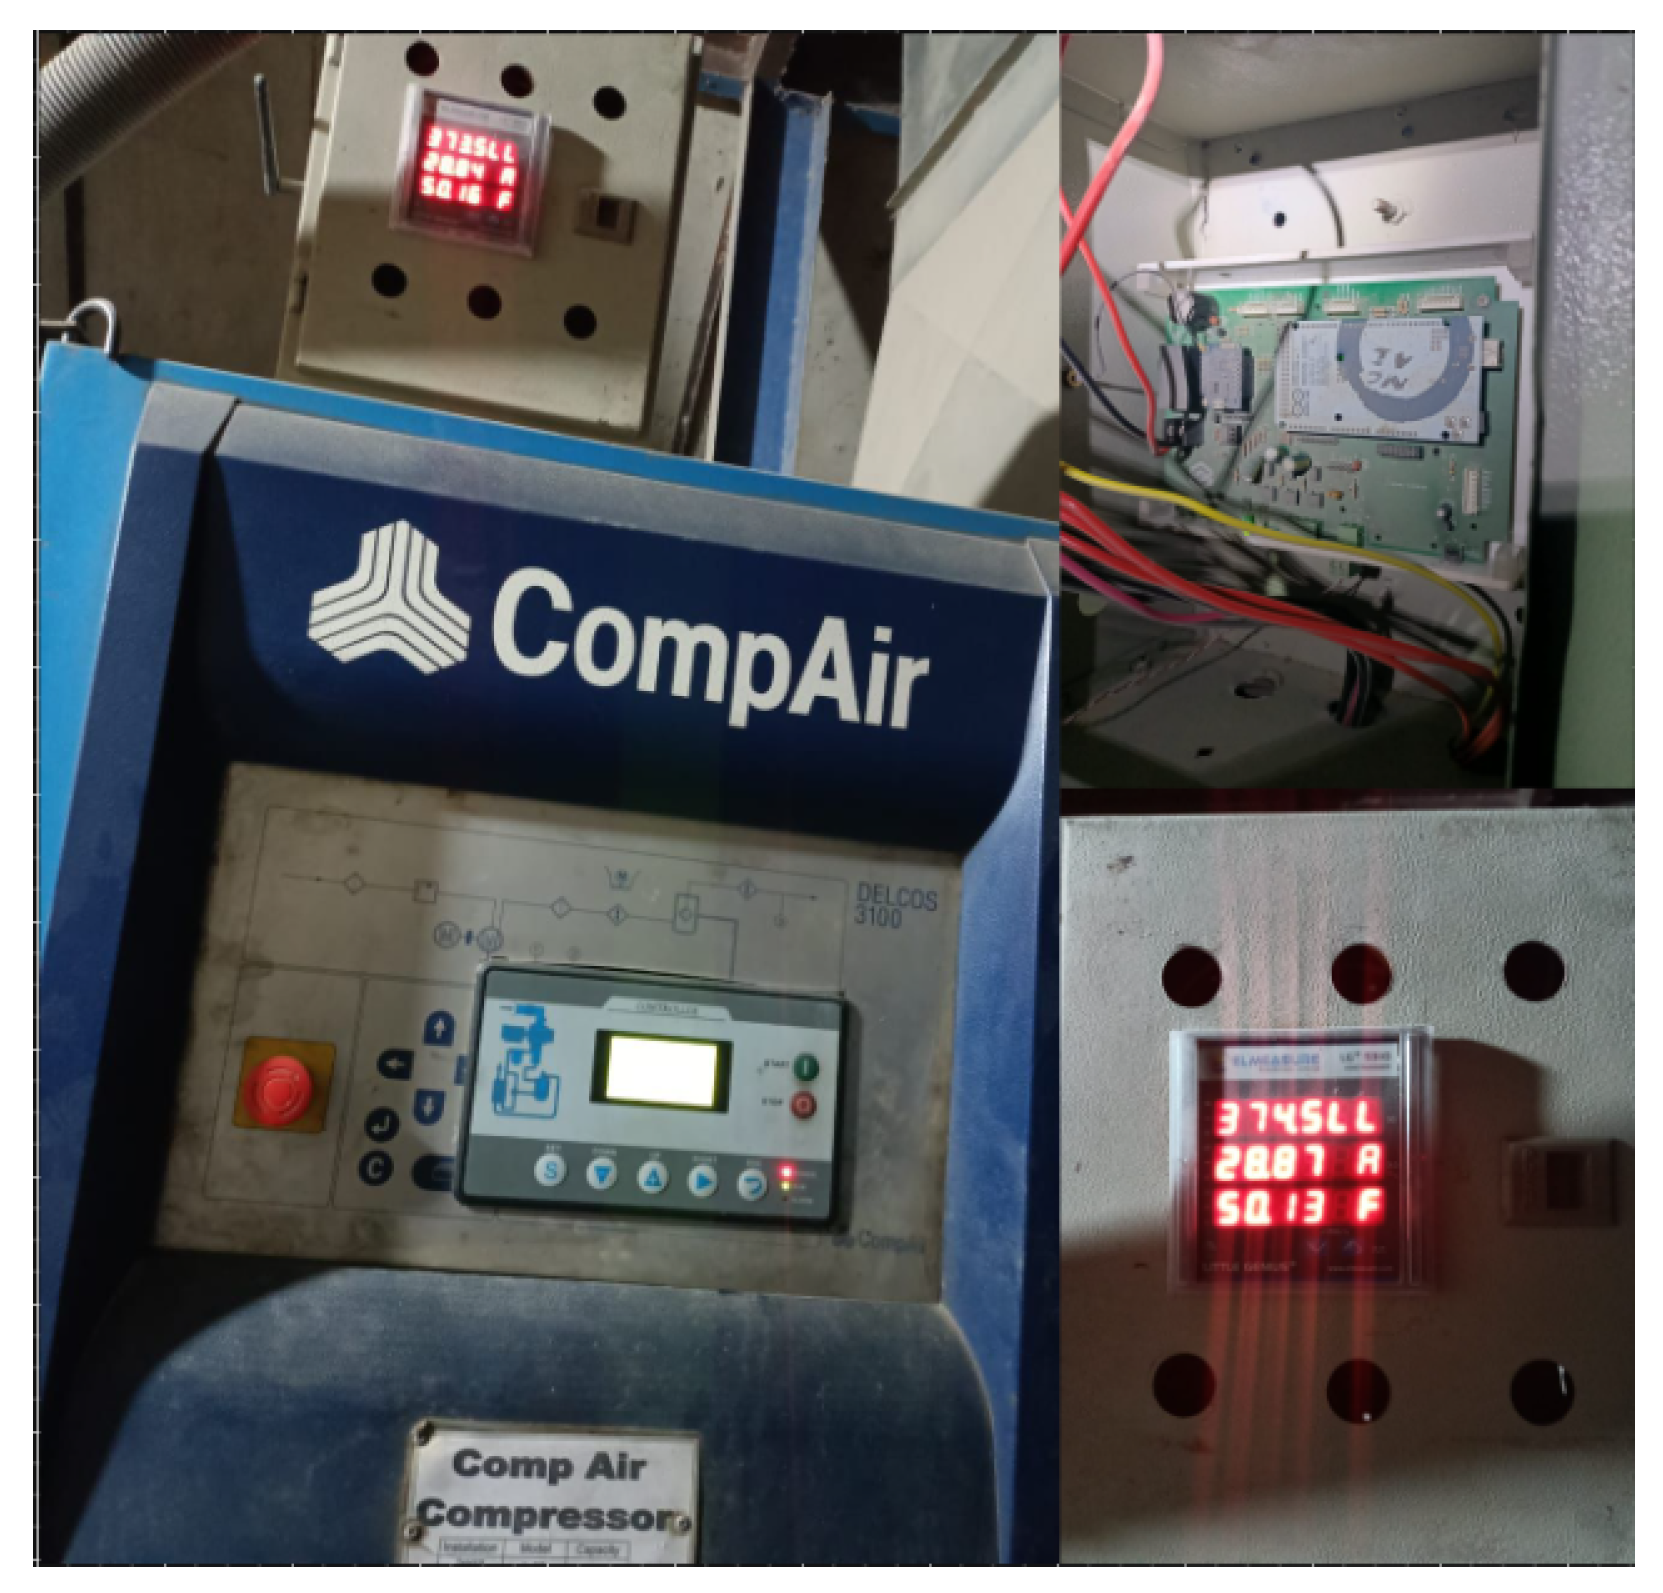
The system was installed at an international industrial client for real-time energy consumption monitoring with an industrial supply tariff, as depicted in Figure 10, showing the energy meter with embedded energy monitoring node in its installation case. The system was successfully run with real-time synchronization of the node and server. The timely notifications with alarms and warnings and shift-wise consumption breakdowns helped the administration with decision-making policies.
Another node was installed at a commercial fast-food chain branch for real-time monitoring and reporting of consumption. The owner of the chain, who was located remotely, had the ease of tracking working hours and managing expenses before the time of actual billing at the end-of-month, as shown in Appendix A. The daily and monthly auto-generated reports, summary, and visualizations of the consumption, as well as the monetary division, helped in drafting new administrative policies to save expenses and increase profits.

5. Results and Discussion

In this study, a low-cost and secure real-time EnMS was proposed for monitoring electrical consumption. It is easy to integrate with existing systems, at higher levels such as buildings, industries, and grids. The total cost of off-the-shelf hardware components used to develop our embedded circuit was USD 70. The system is end-to-end encrypted using SSL encryption. The software of the system was designed using open-source platforms to keep it easily scalable and customizable. Various experiments were carried out to test both the hardware and software modules. The hardware was tested using black box and white box testing techniques. The accuracy and concurrency of the data in the software modules were tested on localhost, as well as on Google Postman API. The measuring units of each energy-related parameter were verified as per the datasheet provided by the vendor of the energy meter. The data storage technique was tested for its resiliency on different energy meters. For the reliability of the business module of the UI, the accumulated billing of consumption according to local as well as the customized tariff was compared with the actual bills generated by the utility providers. The results were accurate, as the generated billing matched the actual billing. The on-peak and off-peak unit breakdown was validated with the time of use provided by the local tariff. The overall functionality of the EnMS proved to be efficient, smart, and fault-tolerant. The actual results of each module’s functionality complied with the expected results.
The results of proposed EnMS were compared with different solutions available for device-level and building-level energy monitoring. Usually, building-level EnMSs are costly, due to the inclusion of meters and costly hardware. In an initial survey conducted for gathering the requirements of commercial and industrial consumers residing in the local market, it was found that they usually have a smart meter available on site. However, that smart meter is only capable of displaying certain parameters on its light emitting diode (LED) display and no previous consumption record is maintained for trend generation. Different consumers prefer different vendors for smart energy meters. Thus, to cater to the needs of the local market, there is a need for an EnMS compatible with vendor-neutral energy meters. Considering the cost of the available energy monitoring solutions in the market, this study developed a low-cost solution with similar functionality for providing real-time energy consumption information to end-users. This system provides most of the energy monitoring features to the users at a reasonable cost.
Different solutions are commercially available that give an insight into the energy consumption of the consumer. They include Uplight with its behavioral energy efficiency solution [42]. The Energy Detective (TED) [16] provides a solution for monitoring the entire household consumption, costing USD 379. Wiser Energy Management [17] is a smart home system for monitoring energy consumption within the household and also generating alerts in case of energy-related anomalies. Its cost is USD 299. Wattson [43] provides an additional hardware device embedded in an energy monitoring system that can monitor individual home appliances. Tweet a Watt [44] is a solution that provides energy consumption information from individual appliances, costing USD 40. It uses ZigBee technology for wireless communication and stores data on Google. Digi XBee Smart Plug ZigBee [45] is a smart plug that measures and control the energy consumption of electrical devices through a local network. Each Digi XBee Smart plug costs around USD 84. Another smart plug with similar features is available on the market by the name of Elgato Eve Energy [46], it has an application for iOS only that shows the historical trends in consumption. Its cost is USD 50 per smart plug. The cost of our EnMS’s embedded circuit is USD 125 (70 USD for components + 55 USD for firmware and PCB printing). Table 5 compares the features and cost of commercially available energy monitoring solutions with the proposed system. The cost of the proposed EnMS is listed without the price of smart energy meters. However, after the addition of the smart energy meter’s cost on the local market, the total cost of the system would be USD 195, which is still less than the compared solutions.
The cost constraints of the solution are met by using appropriate low-cost hardware, as per the requirements of the proposed solution and open-source software. Due to a high computation capability, sufficient pins and memory, low power consumption, and open-source programming firmware, an Arduino ATmega2560 is used as the main controller. Besides its high calculation capability, it has integrated ADC, and hence no external analog-to-digital converter (ADC) is required. This choice leverages advancements to meet the demands of modern energy management, while staying consistent with previously published works [26,27]. In [27], the use of an ATmega328 demonstrated its versatility, ease of use, and familiarity. Table 6 below summarizes the cost of the microcontrollers used in IoT solutions for energy monitoring in the literature.
As shown in this table, micro-computers such as Beagle bone Black, Raspberry Pi, and openPicus Flyport provide very high computation, but on the other hand require external ADCs. Only openPicus Flyport comes integrated with four Analogue input/output (I/O) pins, while the Beagle bone and Raspberry Pi have none. These are more expensive and consume more power to operate. While node micro-controller unit (MCU)-based ESP boards have built-in Wi-Fi and are much cheaper compared to Arduino boards, they come with a smaller number of pins and low memory storage. Usually, an IoT framework faces a trade-off of computation with cost. The chosen Arduino board satisfies this trade-off to some extent by providing the advantages of easy to use programming tools, high capacity of memory, a larger number of pins, and a low cost. Considering all the above factors, the Arduino compensates for the possible weakness of the proposed EnMS’s IoT framework in terms of computation power.
The security of an IoT framework is extremely important, but most researchers in the open literature on EnMSs did not address this issue to the full extent. IoT-based EnMSs need to have security on all three levels of the framework, i.e., node, server, and the transmission of the data on the network. A summary of the security aspects of different EnMSs presented in the open literature is shown in Table 7.
As shown, most of the research works used standards for different levels of security of the IoT framework. The proposed EnMS also uses the standard available security mechanisms for ensuring the security of the overall system at all intended levels of the IoT framework. However, some of the works in open literature proposed enhanced algorithms for the security of their EnMS, exemplified by SEMS [26] and [9,10]. These novel algorithms tend to provide a more rigorous security for the system; however, the proposed EnMS’s security requirements were satisfied with the off-the-shelf available standard security mechanisms.
The UI of an EnMS holds the utmost importance when it comes to user interaction and accessibility. Any UI that covers all the aspects of the consumption, i.e., in terms of electrical parameters as well as monetary division, would benefit the users most. A single UI should be capable of providing both administrators and end-users with dynamic access control over the provided features. A complete EnMS UI may have various features, including engineering features such as real-time trends and reporting of consumption; business features, which include the monetary division of the consumption; and management features, which comprise of the users and node remote management. All these features are combined to give the end-user a broader perspective of consumption and ease of interaction with the system itself. The authors of [21,22,35] developed a mobile application for trend visualization and billing of consumption. The authors in [33] created a local dashboard for historical consumption imaging in the form of graphs. Most of the EnMSs hosted on website platforms are focused on representing real-time consumption [3,19,23,26,36], along with the trend visualization [9] and remote node management [30]. Table 8 represents a summary of the UI features of different EnMSs presented in the open literature.
The usability of any product is determined by its ease of use, which is why a survey was conducted with ab identified pool of researchers in the domain of electronics and software to assess the usability of the user interface. The web application was tested by 20 users using a questionnaire with a Likert scale from 1 to 5, where 1 stands for poor and 5 stands for excellent performance, as shown in Table 9. Around 65 percent of users gave an ‘Excellent’ rating, 29 percent of users rated ‘Very Good’, and only 6 percent of the users’ rated below ‘Good’. Table 10 shows the distribution of user ratings, along with the questionnaire’s evaluation statements.
The authors of [25] also used the same Likert scale and a similar questionnaire to evaluate their user interface and managed to achieve an average score of 4.3 for the usability of their user interface. The developed interface for this EnMS achieved an average score of 4.5 for ease of use. This score indicates that it had a better performance and was more user friendly.
The performance of an EnMS can be evaluated with regards to the following features: overall cost of the system, ease of use and access, and the flexibility of installation and security of the data throughout the system. Any EnMS providing all these features would be considered appropriate, practical, and efficient. An EnMS-Performance Metric (EMS-PM)is introduced in Equation (2) for comparison of the proposed EnMS with the already available ones. A higher value of EnMS-PM indicates an optimal system, and a lower value suggests that the system needs improvement, as all features may not be present.
E M S P M = C 2 + C 3 + C 4 C 1
where
  • C1 (Cost) = price in USD
  • C2 (user-friendly) = [access (website + android + iOS) + alerts + BI]
  • C3 (compatible HW) = [energy consumption (monitoring + controlling) + granularity (device + building + grid)]
  • C4 (security) = Node + Server
C1 is the overall cost of the system in USD. C2 comprises user-friendly options that include mode of access, alerts, and business intelligence, where access has three options of website, android, and iPhone operating system (iOS). Since a website is accessible on any web-enabled peripheral, it is awarded 2 points, while both android and iOS have 1 point each. C3 is compatible hardware, which comprises the mode of energy consumption, including both the monitoring and controlling option and being awarded 1 point for each. There is also the granularity level, which is further divided into three options, which are device having 1 point, as this is the lowest level of energy monitoring, then building having 2 points, as this is the intermediate level, and finally the grid level, which is the highest level, having 3 points. C4 is related to the overall security of the system. C4 has two options of node and server, as security is needed at both ends. Since security is equally important at both ends, 1 point is awarded for each of these options.
Table 11 shows the calculated performance evaluation for works presented in the literature. The comparison indicates that [46] outperformed the proposed EnMS, but it was implemented at device level, hence it cannot be directly compared with the proposed solution. Refs. [16,17] were implemented at the building level, for a direct comparison with the proposed EnMS. The calculated performance evaluation metric indicated that the proposed EnMS outperformed the related works.
According to the daily activities of different localities, different utility providers charge different rates based on time of use or peak hours. Peak hours are defined as the busiest hours in terms of electricity consumption, which is why the utility providers charge extra per unit to discourage the usage of electricity in the peak hours. In Pakistan, on-peak and off-peak hours are applied to commercial and industrial buildings; and in May 2019, the major utility provider K-Electric announced that it will impose peak hours on residential buildings as well in the near future [49]. Thus, a monitoring system is needed now more than ever for effective demand-side management. The developed EnMS is capable of catering for all these requirements; i.e, it is low-cost, secure, and developed indigenously for load profile generation in a customized way.

6. Conclusions

This manuscript reported a low-cost EnMS that provides a mechanism to quantify the expenditure of energy within an installed site, identifies any potential waste of energy, and helps in assessing the impact of any intervention taken to mitigate the problem. Thus, the presented system is a valuable tool for controlling the energy expenses at an installation, while having a quantifiable impact on the output and effectively helping to overcome the challenge of the energy crisis on the demand side. The proposed real-time EnMS generates customized consumption load profiles for consumers, which are remotely accessible to the end-users via any web-enabled peripheral. The system provides a low-cost versatile hardware and software solution that can raise awareness about the user’s habits of energy consumption, based on real data usage. The development includes nodes, a server, and an online dashboard. The production of a working node and communication with the server; supporting multiple node connections and hosting a user interface via web pages; calculating and visualizing energy consumption; recording data; generating alerts; and performing scheduled tasks were all implemented successfully, as demonstrated in this research. Moreover, in many LMICs, commercial and industrial organizations cannot afford a state-of-the-art EnMS from leading vendors. This is because facilities are built over time and energy meters are typically from different brands. Without an estimate of energy utilization patterns, the viability of any project and hence its sustainability is always under question. Our low-cost EnMS helps to evaluate energy consumption where and when needed, reducing the cost and ensuring the sustainability of the solution. This solution can not only benefit large/medium scale clients but it is also commercially feasible for small-scale clients, including residential, commercial, and industrial consumers to adopt the system. The comprehensive nature of our EnMS, achieved through the use of low-cost hardware components and open-source software, enables effective gathering, storing, and displaying data to the user, all within a single platform. The major achievements of this project include a viable solution for secure monitoring of real-time energy consumption through a remote online dashboard using low-cost developed hardware and open-source software, a detailed log of usage pattern visualization and warnings to alter the behavior of the user in their daily consumption, and a module for monetary projected value and accumulated billing using the tariffs of the local energy provider to give an insight into the consumption in financial terms.
This study provides a baseline for researchers to extend the developed system, for generation of a more detailed and predictive load profile for predictive maintenance of client consumption. In addition, in future work, the researchers aim to implement a blind color palette to extend the accessibility of the proposed system.

Author Contributions

Conceptualization, H.R.K. and S.A.Q.; methodology, H.R.K., M.K., and L.; software, L. and M.H.B.K.; validation, L. and M.H.B.K.; formal analysis, M.K. and L.; investigation, M.K. and L.; resources, U.A., K.A. (Kamran Arshad), and K.A. (Khaled Assaleh); data curation, U.A., K.A. (Kamran Arshad), K.A. (Khaled Assaleh), and M.H.B.K.; writing—original draft preparation, L.; writing—review and editing, M.K. and L.; visualization, M.K. and L.; supervision, H.R.K., M.K., and S.A.Q.; project administration, H.R.K. and S.A.Q.; funding acquisition, U.A., K.A. (Kamran Arshad), and K.A. (Khaled Assaleh). All authors have read and agreed to the published version of the manuscript.

Funding

This research was supported by Ajman University Internal Research Grant No. 2023-IRG-ENIT-3. The research findings presented in this paper are solely the author(s)’ responsibility.

Institutional Review Board Statement

Not applicable.

Informed Consent Statement

Not applicable.

Data Availability Statement

Data are contained within the article.

Conflicts of Interest

The authors declare no conflict of interest.

Abbreviations

The following abbreviations are used in this manuscript:
ADCAnalog-to-Digital Converter
AESAdvanced Encryption Standard
AJAXAsynchronous JavaScript and XML
APIApplication Programming Interface
CIAConfidentiality Integrity Availability
CPUCentral Processing Unit
CRUDCreate, Read, Update and Delete
CSSCascading Style Sheet
DAQData Acquisition
DHCPDynamic Host Configuration Protocol
DNSDomain Name Server
ECDHEElliptic-curve Diffie–Hellman
EnMSEnergy Monitoring System
GCMGalois/Counter Mode
GUIGraphical User Interface
HCIHuman Computer Interface
HTMLHyper Text Markup Language
HTTPHyperText Transfer Protocol
HTTPSHyperText Transfer Protocol Secure
IaaSInfrastructure as a Service
IPInternet Protocol
ISPInternet Service Provider
JSONJavaScript Object Notation
LAMPLinux, Apache, MySQL, PHP
LMICLow and Middle-Income Country
LTSLong Term Support
MACMedia Access Control
MDPIMultidisciplinary Digital Publishing Institute
MLMachine Learning
PaaSPlatform as a Service
PCBPrinted Circuit Board
PDOPHP Data Object
PHPHypertext Preprocessor
PRFPseudo-Random Function
RAMRandom Access Memory
RDBMSRelational Database Management System
RSARivest, Shamir, and Adleman, the inventors of the technique
RWDResponsive Web Design
SaaSSoftware as a Service
SHA-256Secure Hash Algorithm 256-bit
SMTPSimple Mail Transfer Protocol
SQLStructured Query Language
SSLSecure Socket Layer
TCPTransmission Control Protocol
TLSTransport Layer Security
UDPUser Datagram Protocol
UIUser Interface
URLUniform Resource Locator
USBUniversal Serial Bus
VPSVirtual Private Server
XMLeXtensible Markup Language

Appendix A. Daily Energy Consumption Report
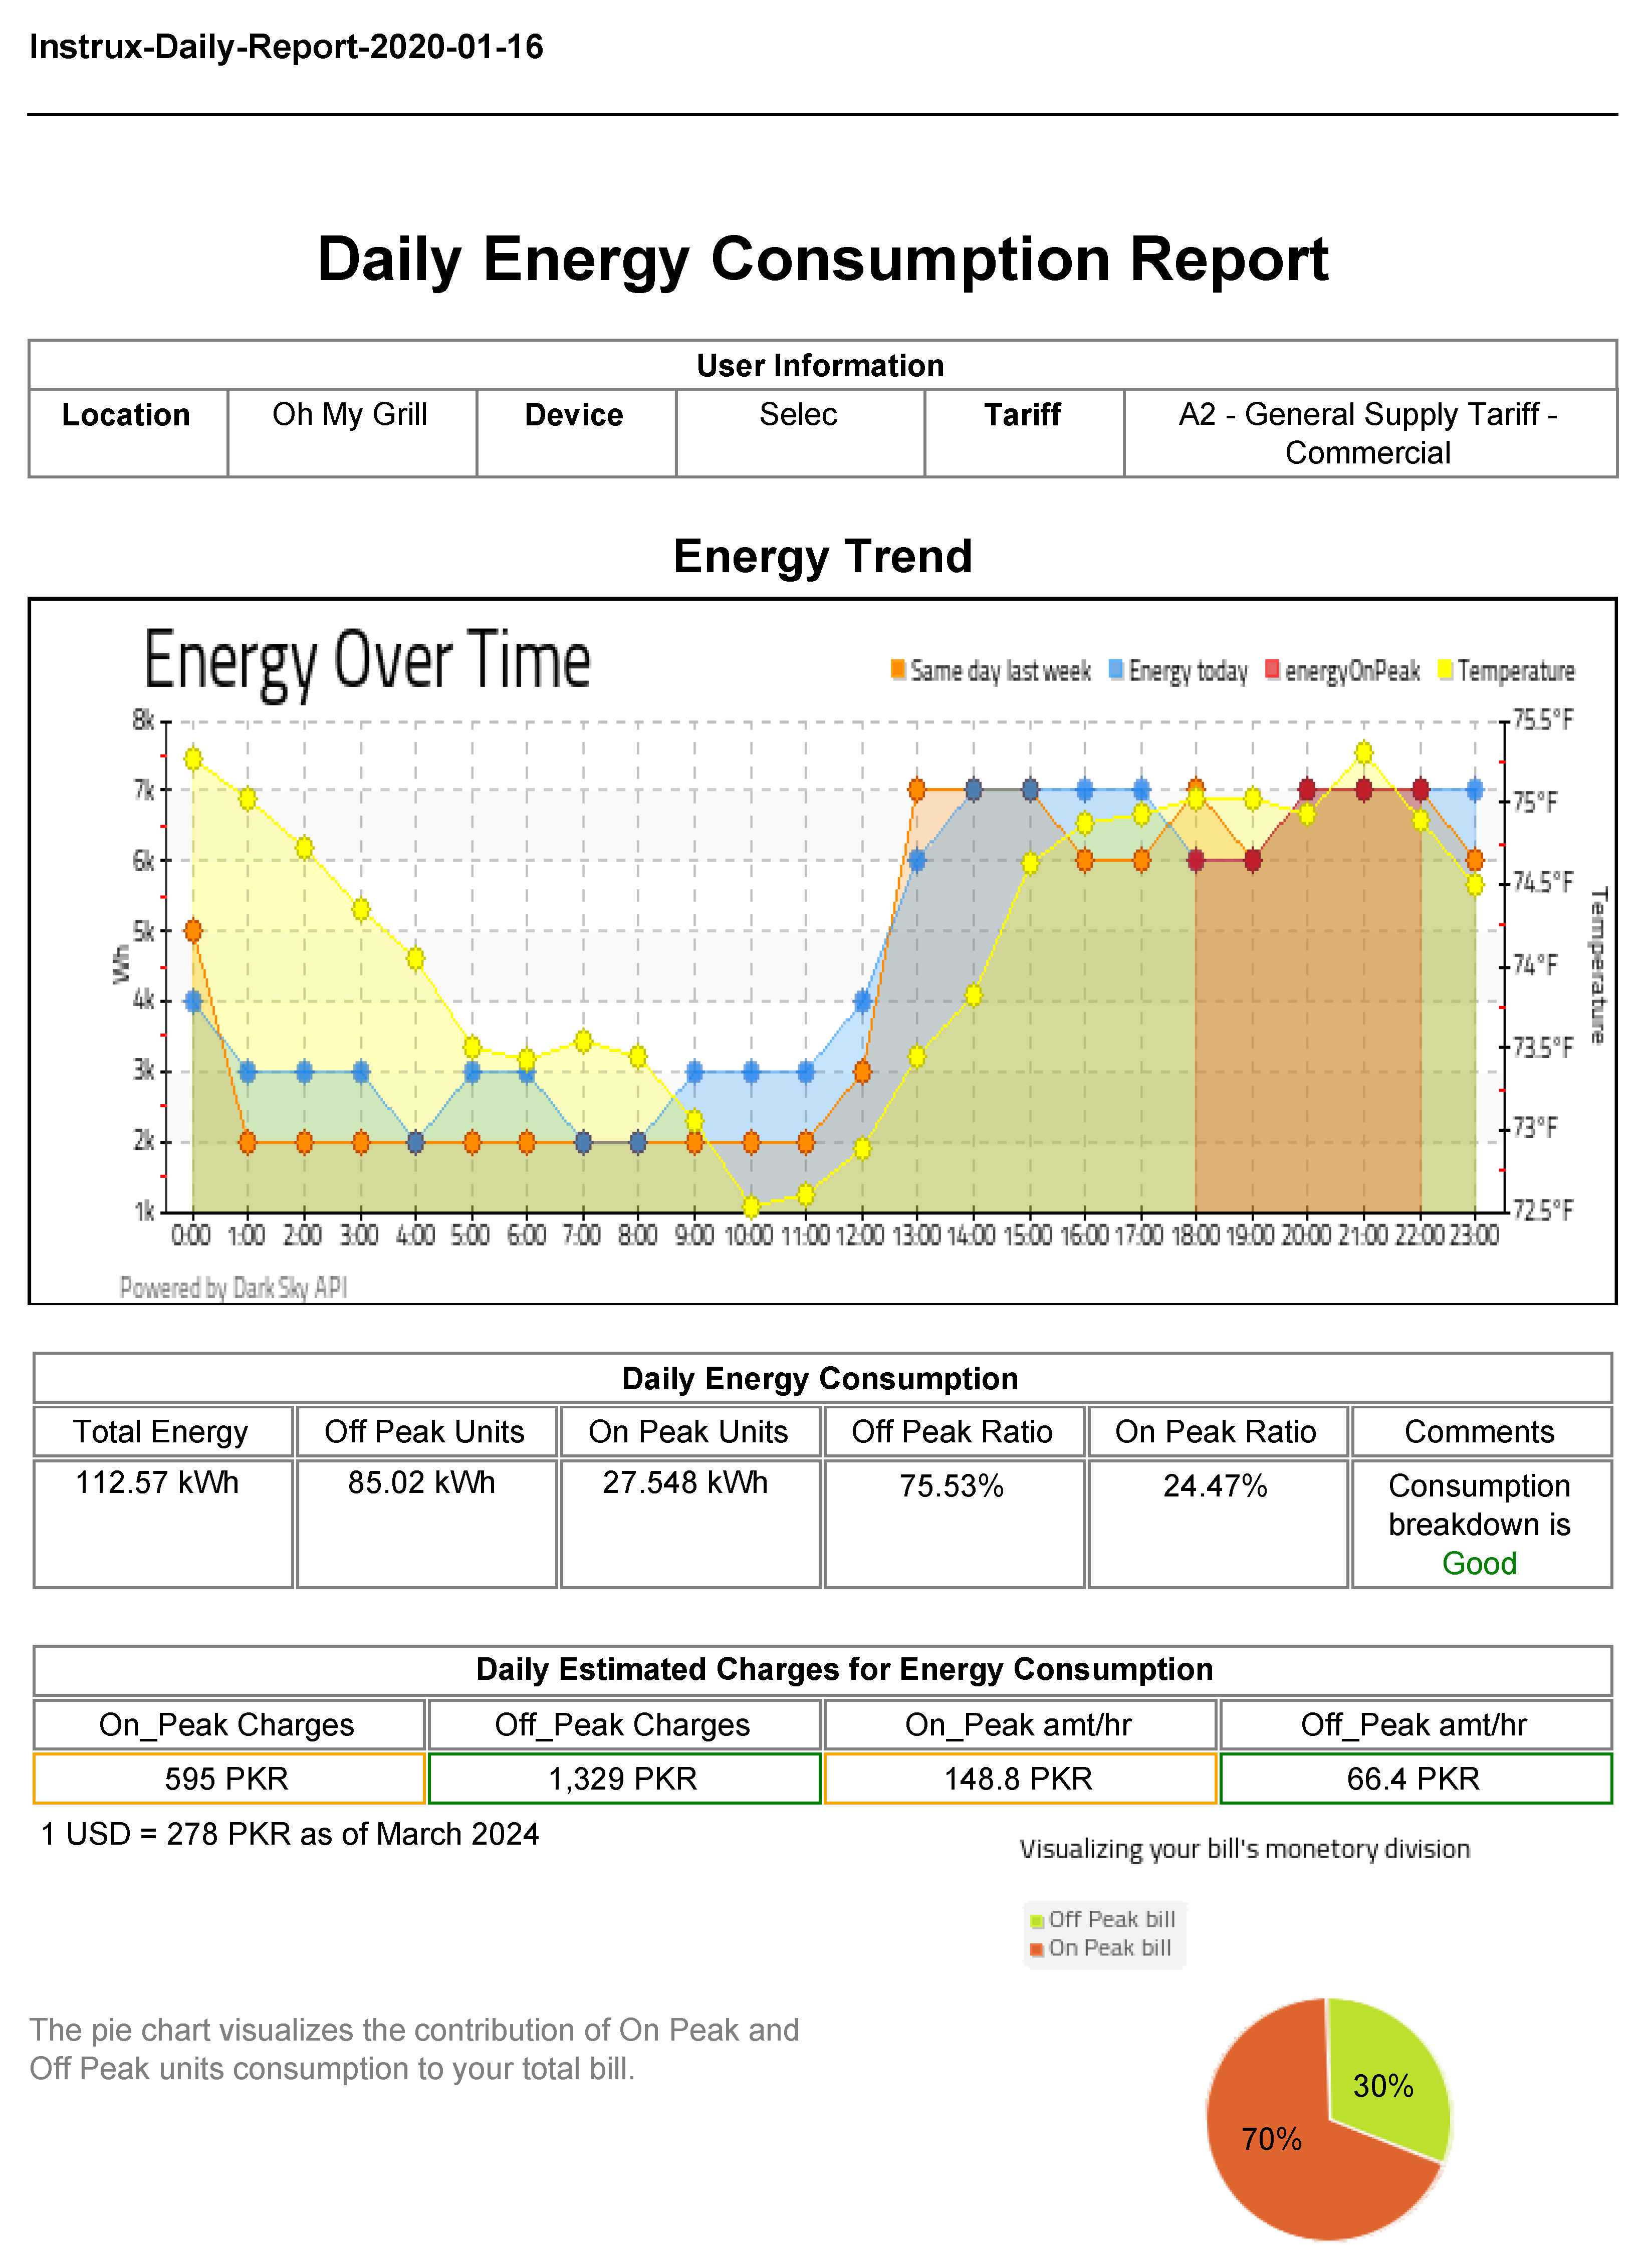
Figure A1. Daily energy consumption report with estimated daily charges.
Sustainability 16 04137 g0a1

Appendix B. Monthly Energy Consumption Report
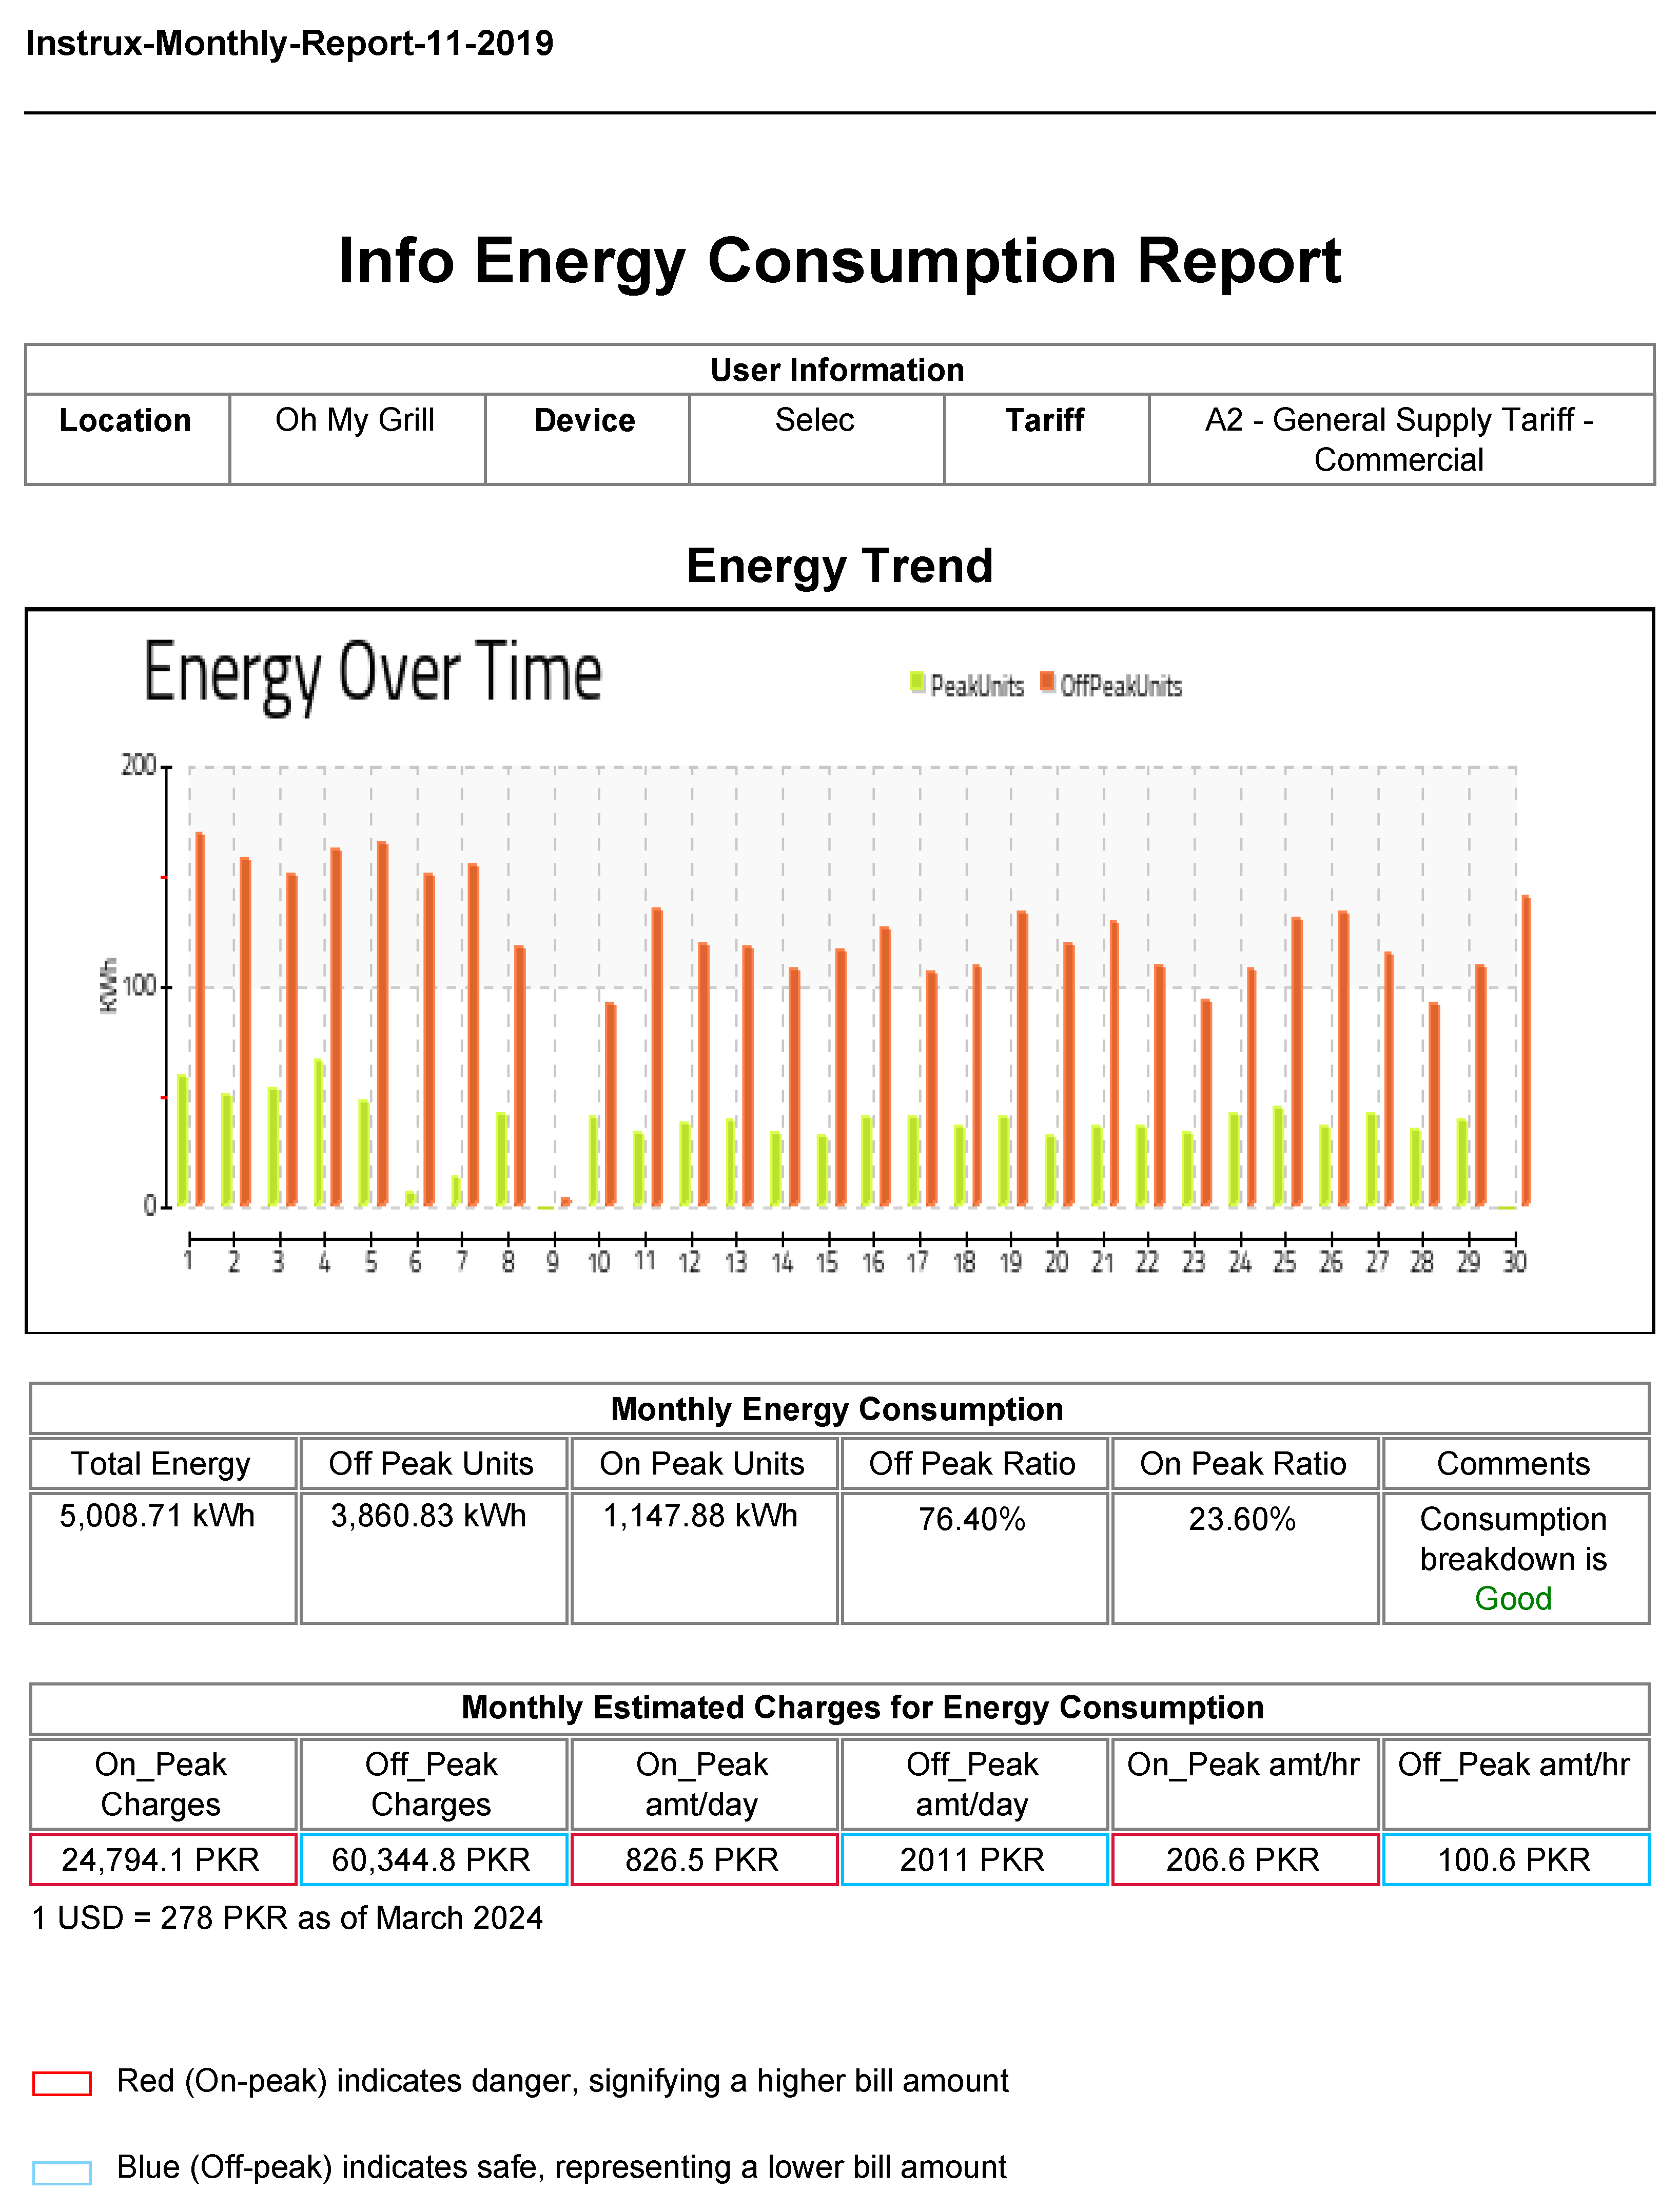
Figure A2. Monthly energy consumption report with estimated monthly charges.
Sustainability 16 04137 g0a2

References

  1. Al-Turjman, F.; Altrjman, C.; Din, S.; Paul, A. Energy monitoring in IoTbased ad hoc networks: An overview. Comput. Electr. Eng. 2019, 76, 133–142. [Google Scholar] [CrossRef]
  2. Amaxilatis, D.; Akrivopoulos, O.; Mylonas, G.; Chatzigiannakis, I. An IoT-based solution for monitoring a fleet of educational buildings focusing on energy efficiency. Sensors 2017, 17, 2296. [Google Scholar] [CrossRef]
  3. Cheddadi, Y.; Cheddadi, H.; Cheddadi, F.; Errahimi, F.; Es-sbai, N. Design and implementation of an intelligent low-cost IoT solution for energy monitoring of photovoltaic stations. SN Appl. Sci. 2020, 2, 1165. [Google Scholar] [CrossRef]
  4. Pereira, R.I.; Dupont, I.M.; Carvalho, P.C.; Jucá, S.C. IoT embedded linux system based on Raspberry Pi applied to real-time cloud monitoring of a decentralized photovoltaic plant. Meas. J. Int. Meas. Confed. 2018, 114, 286–297. [Google Scholar] [CrossRef]
  5. Pitì, A.; Verticale, G.; Rottondi, C.; Capone, A.; Lo Schiavo, L. The role of smart meters in enabling real-time energy services for households: The Italian case. Energies 2017, 10, 199. [Google Scholar] [CrossRef]
  6. Fletcher, J.; Malalasekera, W. Development of a user-friendly, low-cost home energy monitoring and recording system. Energy 2016, 111, 32–46. [Google Scholar] [CrossRef]
  7. Chooruang, K.; Meekul, K. Design of an IoT Energy Monitoring System. In Proceedings of the 2018 16th International Conference on ICT and Knowledge Engineering (ICT&KE), Bangkok, Thailand, 21–23 November 2018; pp. 48–51. [Google Scholar] [CrossRef]
  8. Taktak, E.; Rodriguez, I.B. Energy Consumption Adaptation Approach for Smart Buildings. In Proceedings of the 2017 IEEE/ACS 14th International Conference on Computer Systems and Applications (AICCSA), Hammamet, Tunisia, 30 October–3 November 2017; IEEE: Piscataway, NJ, USA, 2017; pp. 1370–1377. [Google Scholar]
  9. Pirbhulal, S.; Zhang, H.; Alahi, M.E.E.; Ghayvat, H.; Mukhopadhyay, S.C.; Zhang, Y.T.; Wu, W. A novel secure IoT-based smart home automation system using a wireless sensor network. Sensors 2017, 17, 69. [Google Scholar] [CrossRef] [PubMed]
  10. Talal, M.; Zaidan, A.A.; Zaidan, B.B.; Albahri, A.S.; Alamoodi, A.H.; Albahri, O.S.; Alsalem, M.A.; Lim, C.K.; Tan, K.L.; Shir, W.L.; et al. Smart Home-based IoT for Real-time and Secure Remote Health Monitoring of Triage and Priority System using Body Sensors: Multi-driven Systematic Review. J. Med. Syst. 2019, 43, 42. [Google Scholar] [CrossRef]
  11. Oliver, S.T.; González-Pérez, A.; Guijarro, J.H. An IoT proposal for monitoring vineyards called senviro for agriculture. In Proceedings of the IOT’18: Proceedings of the 8th International Conference on the Internet of Things, Barbara, CA, USA, 15–18 October 2018. [Google Scholar] [CrossRef]
  12. Tasong, A.C.; Abao, R.P. Design and development of an IoT application with visual analytics for water consumption monitoring. Procedia Comput. Sci. 2019, 157, 205–213. [Google Scholar] [CrossRef]
  13. Kao, K.C.; Chieng, W.H.; Jeng, S.L. Design and development of an IoTbased web application for an intelligent remote SCADA system. IOP Conf. Ser. Mater. Sci. Eng. 2018, 323, 012025. [Google Scholar] [CrossRef]
  14. Liu, W.; Tang, R.; Peng, T. An IoT-enabled Approach for Energy Monitoring and Analysis of Die Casting Machines. Procedia CIRP 2018, 69, 656–661. [Google Scholar] [CrossRef]
  15. Athira, K.; Devidas, A.R.; Ramesh, M.V.; Rangan, V.P. User centered energy management scheme for smart buildings. In Proceedings of the 2017 International Conference on Advances in Computing, Communications and Informatics (ICACCI), Udupi, India, 13–16 September 2017; pp. 1296–1302. [Google Scholar]
  16. TED: The Energy Detective Website. Available online: http://www.theenergydetective.com/tedprohome.html (accessed on 4 January 2021).
  17. Wiser Energy, Energy Management System IEC, Schneider Electric. Available online: https://www.se.com/ww/en/product-range-presentation/62107-wiser-energy/?selected-node-id=12147001324#tabs-top (accessed on 4 January 2021).
  18. Nasroollah, Z.; Moonsamy, I.; Chuttur, Y. A Cloud-Based Energy Monitoring System Using IoT and Machine Learning. In Advances in Intelligent Systems and Computing; Springer: Singapore, 2019; pp. 165–174. [Google Scholar]
  19. Shivaraman, N.; Saki, S.; Liu, Z.; Ramanathan, S.; Easwaran, A.; Steinhorst, S. Real-Time Energy Monitoring in IoT-enabled Mobile Devices. In Proceedings of the 2020 Design, Automation & Test in Europe Conference & Exhibition (DATE), Grenoble, France, 9–13 March 2020; pp. 991–994. [Google Scholar] [CrossRef]
  20. Kaman, K.K.; Faramarzi, M.; Ibrahim, S.; Yunus, M.A.M. Artificial neural network for non-intrusive electrical energy monitoring system, Indones. J. Electr. Eng. Comput. Sci. 2017, 6, 124–131. [Google Scholar] [CrossRef]
  21. Karthikeyan, S.; Bhuvaneswari, P.T. IoT based real-time residential energy meter monitoring system. In Proceedings of the 2017 Trends in Industrial Measurement and Automation (TIMA), Chennai, India, 6–8 January 2017. [Google Scholar] [CrossRef]
  22. Paredes-Valverde, M.A.; Alor-Hernández, G.; García-Alcaráz, J.L.; Salas-Zárate, M.D.P.; Colombo-Mendoza, L.O.; Sánchez-Cervantes, J.L. IntelliHome: An internet of things-based system for electrical energy saving in smart home environment. Comput. Intell. 2020, 36, 203–224. [Google Scholar] [CrossRef]
  23. Sulistyanto, M.P.; Pranata, K.B.; Afandi, A.N.; Sendari, S.; Sulistiyowati, I. Monitoring electrical energy in electronic energy audits through internet of things technology. J. Phys. Conf. Ser. 2019, 1402, 077067. [Google Scholar] [CrossRef]
  24. Peng, C.; Huang, J. A home energy monitoring and control system based on ZigBee technology. Int. J. Green Energy 2016, 13, 1615–1623. [Google Scholar] [CrossRef]
  25. Galera, K.M.E.; Llantos, O.E. Mobile Web Energy Monitoring System Using DFRduino Uno. Procedia Comput. Sci. 2017, 124, 706–713. [Google Scholar] [CrossRef]
  26. Saleem, M.U.; Shakir, M.; Usman, M.R.; Bajwa, M.H.T.; Shabbir, N.; Shams Ghahfarokhi, P.; Daniel, K. Integrating Smart Energy Management System with Internet of Things and Cloud Computing for Efficient Demand Side Management in Smart Grids. Energies 2023, 16, 4835. [Google Scholar] [CrossRef]
  27. Rani, D.P.; Suresh, D.; Kapula, P.R.; Akram, C.M.; Hemalatha, N.; Soni, P.K. IoT based smart solar energy monitoring systems. Mater. Today Proc. 2023, 80, 3540–35405. [Google Scholar] [CrossRef]
  28. Nguyen, T.K.; Dekneuvel, E.; Jacquemod, G.; Nicolle, B.; Zammit, O.; Nguyen, V.C. Development of a real-time non-intrusive appliance load monitoring system: An application level model. Int. J. Electr. Power Energy Syst. 2017, 90, 168–180. [Google Scholar] [CrossRef]
  29. Froiz-Míguez, I.; Fernández-Caramés, T.; Fraga-Lamas, P.; Castedo, L. Design, Implementation and Practical Evaluation of an IoT Home Automation System for Fog Computing Applications Based on MQTT and ZigBee-WiFi Sensor Nodes. Sensors 2018, 18, 2660. [Google Scholar] [CrossRef]
  30. Mataloto, B.; Ferreira, J.; Cruz, N. LoBEMS—IoT for Building and Energy Management Systems. Electronics 2019, 8, 763. [Google Scholar] [CrossRef]
  31. Marinakis, V.; Doukas, H. An advanced IoT-based system for intelligent energy management in buildings. Sensors 2018, 18, 610. [Google Scholar] [CrossRef] [PubMed]
  32. Chen, X.; Li, C.; Tang, Y.; Xiao, Q. An Internet of Things based energy efficiency monitoring and management system for machining workshop. J. Clean. Prod. 2018, 199, 957–968. [Google Scholar] [CrossRef]
  33. Suciu, G.; Necula, L.; Iosu, R.; Usurelu, T.; Ceaparu, M. IoT and Cloud-Based Energy Monitoring and Simulation Platform. In Proceedings of the 2019 11th International Symposium on Advanced Topics in Electrical Engineering (ATEE), Bucharest, Romania, 28–30 March 2019; pp. 1–4. [Google Scholar] [CrossRef]
  34. Rashid, R.A.; Chin, L.; Sarijari, M.A.; Sudirman, R.; Ide, T. Machine Learning for Smart Energy Monitoring of Home Appliances Using IoT. In Proceedings of the 2019 Eleventh International Conference on Ubiquitous and Future Networks (ICUFN), Split, Croatia, 2–5 July 2019. [Google Scholar] [CrossRef]
  35. Chupong, C.; Plangklang, B. Electricity bill forecasting application by home energy monitoring system. In Proceedings of the 2017 International Electrical Engineering Congress (iEECON), Pattaya, Thailand, 8–10 March 2017. [Google Scholar] [CrossRef]
  36. Yang, C.T.; Chen, S.T.; Liu, J.C.; Liu, R.H.; Chang, C.L. On construction of an energy monitoring service using big data technology for the smart campus. Clust. Comput. 2020, 23, 265–288. [Google Scholar] [CrossRef]
  37. Schneider Electric, Home/All Products/Building Automation and Control/Power Monitoring and Control. Available online: https://www.se.com/ww/en/product-category/4100-power-monitoring-and-control/ (accessed on 6 January 2021).
  38. Elmeasure, V3. Programming Guide 3. Available online: https://www.elmeasure.com/storage/app/media/resources/documents/elmeasure-multifunction-meter-multifunction2r-programming-guide.pdf (accessed on 6 January 2021).
  39. Crompton Instruments Energy Meter. Available online: https://www.crompton-instruments.com/ (accessed on 6 January 2021).
  40. Muller Ziegler. Available online: https://mueller-ziegler.de/ (accessed on 6 January 2021).
  41. Selec, Home/Digital Meters/Energy Meters. Available online: https://www.selec.com/ (accessed on 6 January 2021).
  42. Tendril Networks Inc. Available online: http://www.tendrilinc.com/ (accessed on 6 January 2021).
  43. DIY Kyoto. Available online: http://www.diykyoto.com (accessed on 6 January 2021).
  44. Tweet A Watt. Available online: https://learn.adafruit.com/tweet-a-watt (accessed on 6 January 2021).
  45. Digi: Digi XBee Smart Plug ZigBee. Available online: https://www.digi.com/products/xbee-rf-solutions/boxed-rf-modems-adapters/xbee-smart-plug-zb (accessed on 6 January 2021).
  46. Elgato. Available online: https://www.evehome.com/en/eve-energy (accessed on 6 January 2021).
  47. Ngo, G.C.; Floriza, J.K.I.; Creayla, C.M.C.; Garcia, F.C.C.; Macabebe, E.Q.B. Real-time energy monitoring system for grid-tied Pho- tovoltaic installations. In Proceedings of the TENCON 2015—2015 IEEE Region 10 Conference, Macao, China, 1–4 November 2015; pp. 1–4. [Google Scholar]
  48. Benghanem, M. Measurement of meteorological data based on wireless data acquisition system monitoring. Appl. Energy 2009, 86, 2651–2660. [Google Scholar] [CrossRef]
  49. Zuberi, M.A. Peak-Hour Rates to Be Imposed: K-Electric Not to Charge Meter Rent, Bank Fee from Next Billing Cycle. Business Recorder, Karachi. 2019. Available online: https://fp.brecorder.com/2019/05/20190529482005/ (accessed on 6 January 2021).
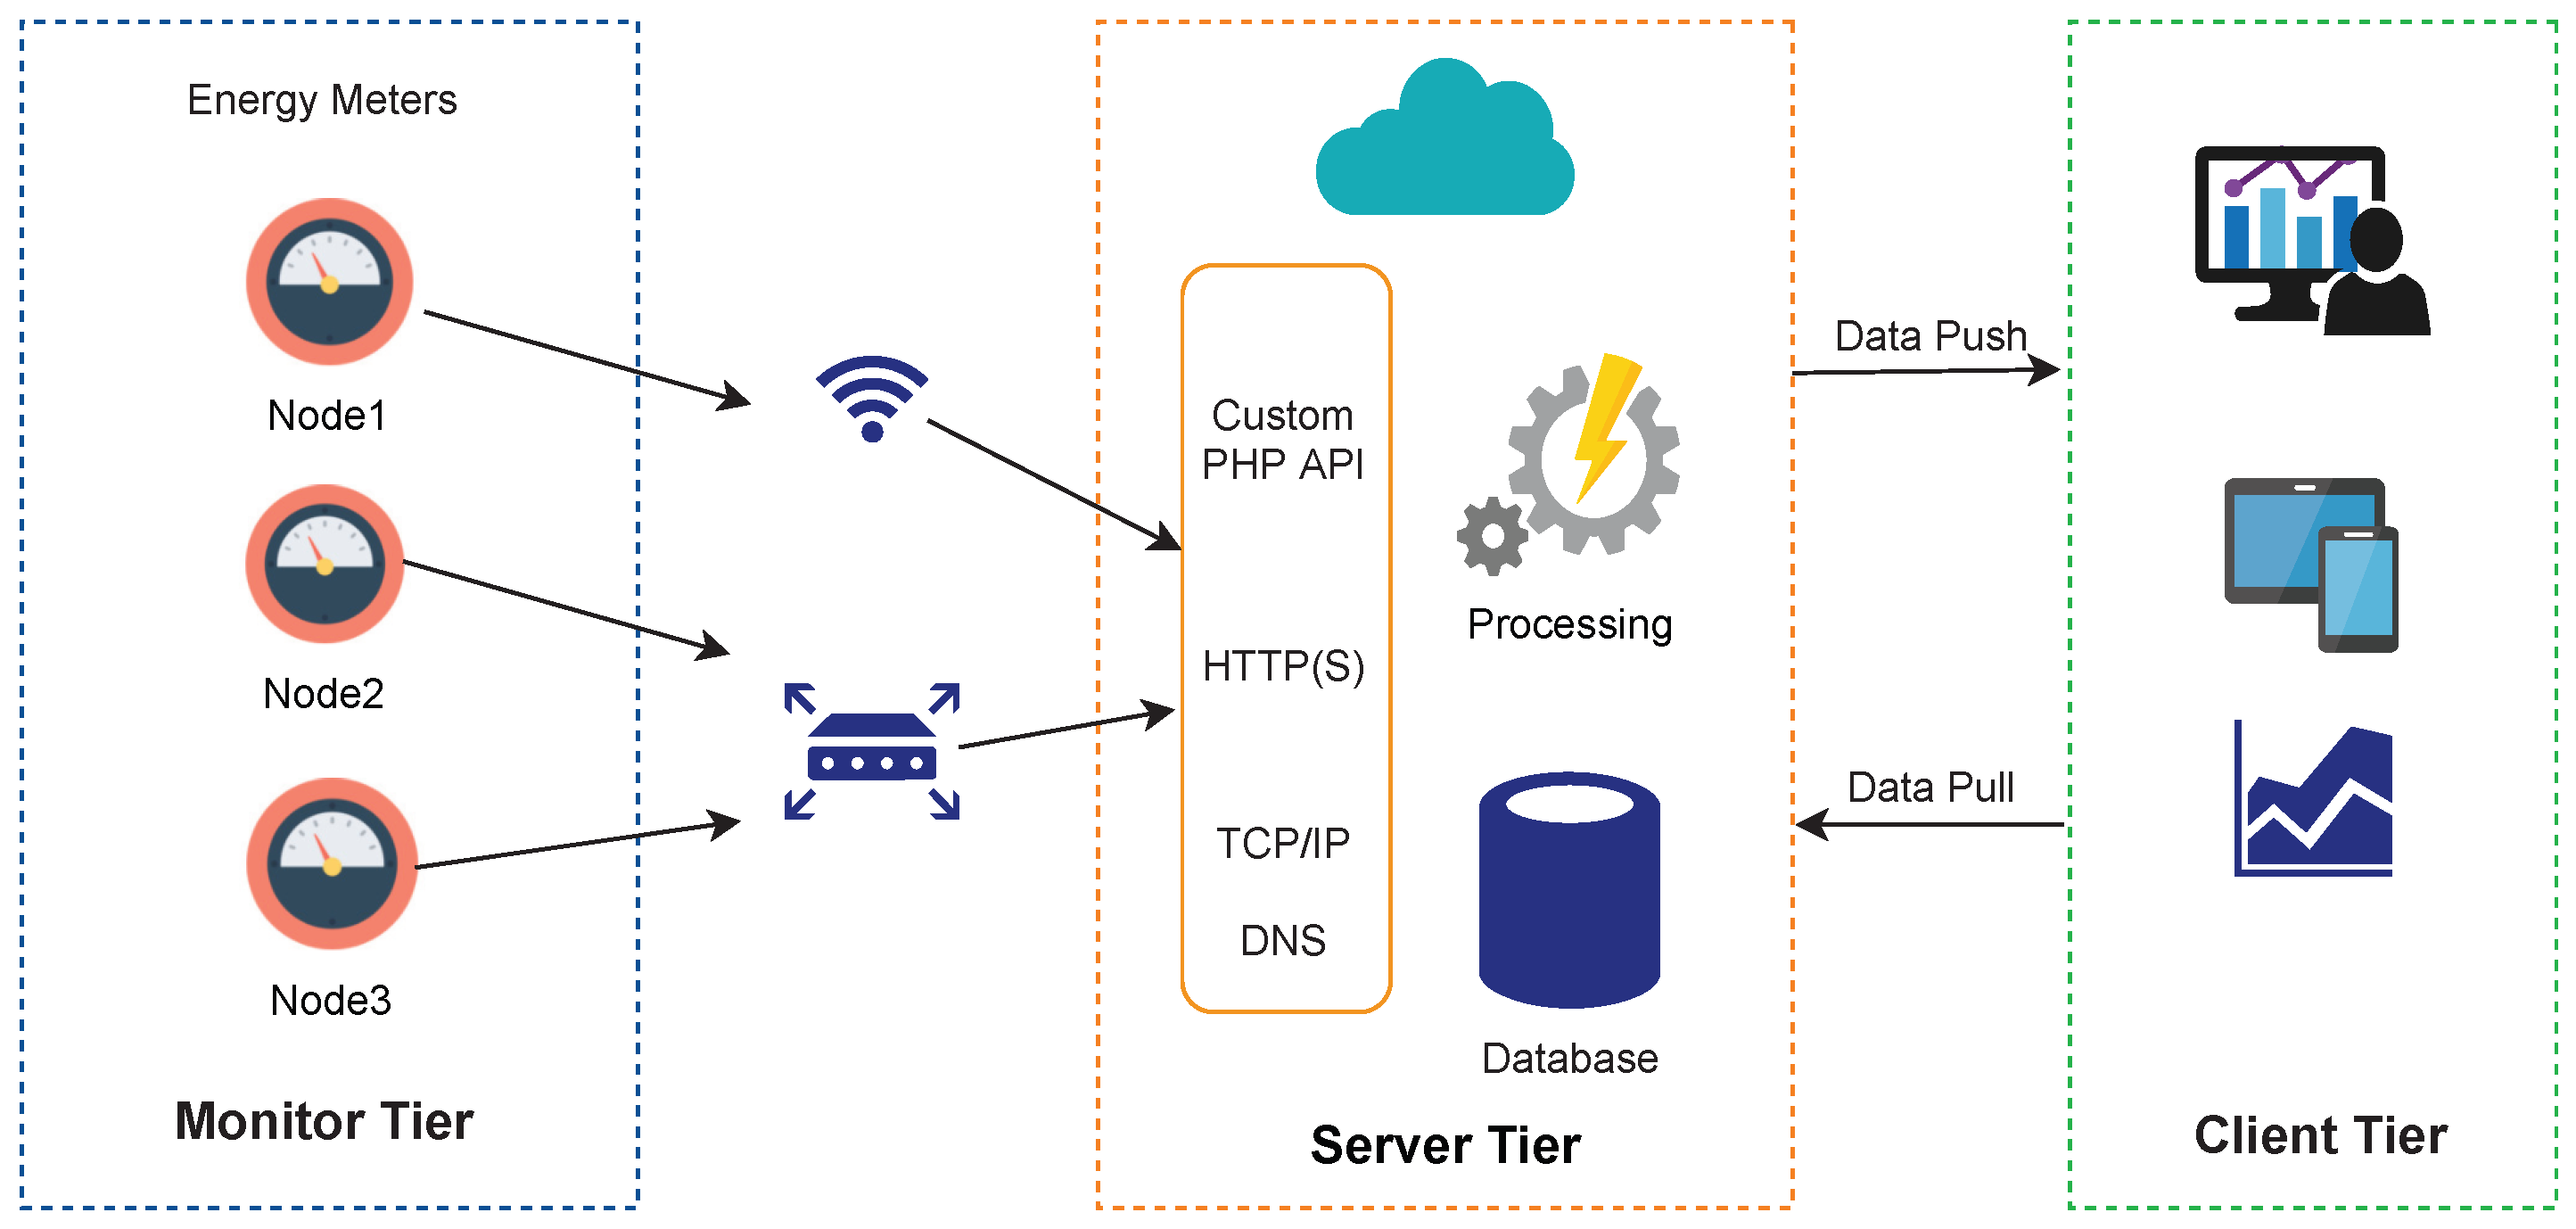
Figure 1. Proposed energy monitoring system architecture.
Sustainability 16 04137 g001
Figure 2. Technological breakdown of energy monitoring system.
Sustainability 16 04137 g002
Figure 3. Data flow of the energy monitoring system.
Sustainability 16 04137 g003
Figure 4. Summary of useful features of UI.
Sustainability 16 04137 g004
Figure 5. Proposed EnMS dashboard.
Sustainability 16 04137 g005
Figure 6. Energy consumption during shifts.
Sustainability 16 04137 g006
Figure 7. Billing of the selected period.
Sustainability 16 04137 g007
Figure 8. Embedded circuit ready for installation.
Sustainability 16 04137 g008
Figure 9. Demo setup of the developed energy monitoring system.
Sustainability 16 04137 g009
Figure 10. Proposed system installed at industrial client.
Sustainability 16 04137 g010
Table 1. Circuit components with description.
Circuit ComponentsFunctionCommunication Technology
DAQ cardInterface between Arduino and analog signalsModbus
ESP8266 Wi-Fi ChipGives access for Wi-Fi to Arduino boardTCP/IP
Arduino BoardSaves the raw data into pre-defined variables, makes a GET requestUSB
Ethernet ShieldGives LAN network access to Arduino boardTCP/IP
Table 2. Server hardware configuration.
FeaturesSpecifications
Memory1 GB RAM
Processora vCPU
Data rate1 TB transfer
Hard disk25 GB SSD
Cost5 USD PM
Table 3. User experience features.
User ExperienceFeature
Behavior ChangeDaily, Monthly energy trend/shifts graph
expense monitoringEstd breakdown of on-peak/off-peak charges, billing before
end of month
Consumption HealthAlarms and warnings with timestamp and value
Feedback on Consumptionconsumption ratio, on-peak/off-peak units contribution
to the total bill
Table 4. On-peak consumption feedback.
RatioInterpretation
On Peak Ratio < 0.3Good
0.3 < On Peak Ratio < 0.4Average
0.4 < On Peak Ratio < 0.3Needs Improvement
On Peak Ratio > 0.5Poor
Table 5. Comparisons of features and hardware cost of EnMSs.
ParametersFeaturesDigi XBee Smart Plug Zigbee [45]Elgato Eve Energy [46]Tweet A Watt [44]TED [16]Wiser Energy [17]Proposed EnMS
Energy ConsumptionMonitoringYesYesYes (Sold for $22.99 separately)YesYesYes
ControllingYesYesNoNoNoNo
CommunicationWirelessYesYesYesYesYesYes
AccessWebsiteNoNoYesYesNoYes
Android accessNoNoYesYesYesYes
iOS accessNoYesYesYesYesYes
AlertsAlarms and WarningsNoNoNoYesYesYes
BusinessBilling IntelligenceNoYesNoYesYesYes
GranularityImplementation LevelDeviceDeviceDeviceDevice & BuildingBuildingsBuilding/Grid
Price(USD) 845040379299125
Table 6. Cost comparison of microcontrollers used in IoT solutions.
WorkCharacteristicsMicrocontrollerPrice (USD)
[4,10]ADC: req.
Wi-Fi: built-in
Power consumption: High
Computation: High
Pin Density: Not Applicable
Memory: Very High
Raspberry Pi49.88
[47]ADC: req.
Wi-Fi: req.
Power consumption: High
Computation: Very High
Pin Density: Not Applicable
Memory: Very High
Beagle Bone black54.40
[6]ADC: Integrated
Wi-Fi: built-in
Power consumption: Low
Computation: High
Pin Density: High
Memory: High
openPicus Flyport50.73
[25]ADC: Integrated
Wi-Fi: req.
Power consumption: Low
Computation: High
Pin Density: Low
Memory: Low
DFRDuino V3 Microcontroller19.9
[48]ADC: Integrated
Wi-Fi: req.
Power consumption: Low
Computation: Low
Pin Density: Moderate
Memory: Low
PIC 16F8773.20
[3]ADC: Integrated
Wi-Fi: built-in
Power consumption: Low
Computation: High
Pin Density: Low
Memory: Low
ESP 324.61
[12,21,35]ADC: Integrated
Wi-Fi: built-in
Power consumption: Low
Computation: Low
Pin Density: Low
Memory: Low
ESP82664.11
The ProposedADC: Integrated
Wi-Fi: req.
Power consumption: Low
Computation: High
Pin Density: High
Memory: High
Arduino ATmega25605.5
Table 7. Security features of IoT-based EnMSs.
WorkNode SecurityServer SecurityCommunication Protocol
[6]MAC address confirmationHTTPSTCP
[25]-HTTP-
[4]-HTTPMU-MIMO
Proposed EnMSMAC address, password, location confirmationHTTPS/SSLTCP/Firewall
Table 8. User interface features of IoT-based EnMS.
WorkPlatformEngineeringBusinessManagement
Real-TimeTrendsBillingUserRemote Node
[9]Website (hosted)
[33]Dashboard (local)
[23]Website (hosted)
[19]Website (hosted)
[21]Mobile app
[3]Website (hosted)
[36]Website (hosted)
[22]Mobile app
[35]Mobile app
[30]Website (hosted)
[26]Website (hosted)
Proposed EnMSWebsite (hosted)
Table 9. Evaluation criteria for usability assessment.
ScaleRangeInterpretation
54.6–5Excellent
43.7–4.5Very Good
32.8–3.6Good
21.9–2.7Fair
11.0–1.8Poor
Table 10. Usability assessment questionnaire.
Questions54321TotalMeanInterpretation
I found the web interface easy to use134300204.5Excellent
All the functions (historical trends, billings, consumption comparisons) I expected were presented in understandable form612200204.2Very Good
The UI is organized and well managed173000204.8Excellent
The website does not lag or crash510401204.0Very Good
The colour scheme and theme are consistent164000204.8Excellent
The navigation options are self-explanatory1010000204.5Excellent
The navigation options are easily available164000204.8Excellent
The interactive visualizations (bar graphs, line charts) are easily interpretative164000204.8Excellent
Average Mean4.5Very Good
Table 11. Performance evaluation with regards to the derived EnMS-PM.
Workc1c2c3c4EnMS-PM
[45]8401+110.035
[46]501+12+110.120
[44]62.992+1+11+100.095
[16]3792+1+11+100.015
[17]2991+1+1+11+210.026
Proposed EnMS1252+1+1+1+12+31+10.104
Disclaimer/Publisher’s Note: The statements, opinions and data contained in all publications are solely those of the individual author(s) and contributor(s) and not of MDPI and/or the editor(s). MDPI and/or the editor(s) disclaim responsibility for any injury to people or property resulting from any ideas, methods, instructions or products referred to in the content.