Article

Study on Effects of Operating Parameters on a Water-Cooled Loop Thermosyphon System under Partial Server Utilization

1
School of Civil Engineering and Architecture, East China JiaoTong University, Nanchang 330013, China
2
School of Energy Science and Engineering, Central South University, Changsha 410083, China
*
Authors to whom correspondence should be addressed.
Sustainability 2023, 15(17), 13100; https://doi.org/10.3390/su151713100
Submission received: 3 August 2023 / Revised: 24 August 2023 / Accepted: 29 August 2023 / Published: 31 August 2023

Abstract

:
During the operation of a data center, servers are gradually installed in racks, causing most racks to work under a low heating load for a long time and affecting the cooling efficiency of the loop thermosyphon system (LTS). Thus, the effects of operating parameters on the thermal performance should be investigated. In this study, a water-cooled LTS was experimentally investigated under different airflow rates and heating loads. The results show that the additional liquid refrigerant reduced the heat transfer performance and aggravated a drop in cooling capacity when the airflow rate and heating load were decreased. To further reveal the effects of the operating parameters on the thermal performance and cooling efficiency, a steady-state distributed-parameter model was developed and validated based on the experimental data. The results show that the excessive cooling capacity was reduced by decreasing the airflow rate according to the upper limit of the server exhaust air temperature under partial server utilization. The excessive cooling capacity was reduced by 14.5–52.1% under 5–56.5% server utilization. To further reduce the excessive cooling capacity while ensuring thermal security, the water side operating parameters (including the supply chilled water temperature and water flow rate) were adjusted according to the upper limit of the rack’s average outlet air temperature, which reduced the excessive cooling capacity by more than 23.8% under partial server utilization.

1. Introduction

With digital and information technologies, the demands for data storage, transmission, and processing have increased dramatically, resulting in a dramatic increase in the number and scale of data centers. However, the energy consumption of data centers is also growing rapidly. In 2018, the total energy consumption of data centers reached 160.8 billion kWh in China, which accounted for 2.35% of the total national energy consumption [1]. One of the main reasons is that the energy consumption of servers increases dramatically with the improvement of chip manufacturing processes. The other main reason is that cooling systems use huge energy volumes to ensure IT equipments’ thermal safety in data centers. Because the energy consumption of servers is inevitably generated during the operation of the data center, improving the energy efficiency of the cooling system is the key strategy for saving energy. In the past decade, most data centers have used the computer room air conditioning system (CRACS) to cool IT equipment due to its wide application scenarios. However, the CRACS is a direct expansion split air conditioning system that cannot use natural cold sources, so it needs to operate at a high load all year round. In general, the CRACS accounts for more than 30% of the total energy consumption in data centers [2,3,4].
In order to improve the energy efficiency of the CRACS, the cold source uses side energy-saving technologies, such as direct or indirect airside free cooling technologies [5,6]. Limited by the low specific heat capacity and heat conductivity of air, these free cooling technologies are more commonly used in telecommunication base stations and small data centers with low cooling requirements. In addition, the local climate and air cleanliness would also limit the use of airside free cooling technologies. Therefore, more and more data centers use the water-cooled computer room air handler system (CRAHS) to replace the CRACS for energy saving. The CRAHS uses a chilled water system (composed of cooling towers, water pumps, heat exchangers, and chillers) as the cold source, which can use natural water [7], ariside economizers [8], and water-side economizers [9] for free cooling. Compared to the CRACS, the CRAHS can provide a greater cooling capacity and use a wider variety of free cooling techniques, which is more suitable to cool nearly all scales of data centers. Limited by the low-efficiency single-phase heat transfer from the terminal equipment and inefficient airflow distribution, the CRAHS can only use relatively low-temperature natural cold sources, limiting its improvement in energy efficiency. In order to improve the energy efficiency of terminal equipment, energy-saving technologies, such as airflow distribution and management technologies, have been proposed [10,11,12]. However, due to the different air supply distances of racks, room-level cooling systems such as the CRACS and CRAHS that use these technologies still struggle to accurately and efficiently cool IT equipment. In order to solve the above problems, the loop thermosyphon system (LTS) is a kind of terminal equipment for the cooling system proposed for rack-level cooling. The schematic diagram of a loop thermosyphon system is shown in Figure 1. The hot air generated by servers is driven by extractor fans on the backplate, which transfers the heat to the evaporator installed on the backplate. The refrigerant in the evaporator evaporates and enters the condenser through the vapor pipe. The vapor refrigerant is cooled into the liquid phase with the chilled water inside the condenser and returned to the evaporator by gravity. Because of the rack-level cooling and two-phase heat transfer, the LTS can accurately and efficiently cool IT equipment. Thus, the LTS can increase the supply of chilled water temperatures to make better use of the natural cold source for energy saving [13,14,15].
In order to improve the thermal performance and reduce energy consumption, several experimental and numerical studies were carried out to investigate the influencing factors of the LTS. Ling et al. [16], Ding et al. [17], and Zhang et al. [18] analyzed the effect of the filling ratio on the cooling capacity. The results showed that the LTS can achieve the maximum cooling capacity at an optimal filling ratio. At the optimal filling ratio, the effects of the geometrical parameters [19] and refrigerant type [20] on the thermal performance of the LTS were also studied. The cooling capacity can be increased via parameter optimization and refrigerant substitution. In addition to the above factors, the operating parameters, such as the airflow rate and supply chilled water temperature, have a noticeable impact on the thermal performance of the LTS. Ling et al. experimentally investigated the effect of the airflow rate and supply chilled water temperature on the cooling capacity of the LTS. The results showed that the cooling capacity increased by 42.8% when the airflow rate increased from 1712 m3/h to 2980 m3/h [16]; it also increased by 11.1% when the supply chilled water temperature decreased from 16 °C to 12 °C [21].
The above results are helpful in optimizing the design and operating parameters of an LTS under rated server utilization, but the operating conditions of servers in actual data centers are more complex. Since the servers are gradually installed in racks according to the user demand, most racks are operated under a low heating load for a long time. The data centers’ average utilization rate is only 50.61% compared to 29.01% for large-scale data centers in China [22]. The server utilization is also related to the CPU usage rate on the workdays [23]. However, the set value of the supply chilled water temperature was often designed according to the demand of the LTS under full server utilization. When an LTS is operated under a relatively low heating power and supply chilled water temperature, the cooling capacity of the LTS would obviously exceed the heating load, resulting in energy wastage. In our previous study [24], controlling extractor fans to adjust the airflow rate could reduce the excessive cooling capacity and power of extractor fans. The average increase rate of the LTS’s energy efficiency ratio (EER) was more than 432% under 2 kW of heating power (the heating power was 6 kW under full server utilization). However, adjusting the airflow rate for energy saving will affect the server’s exhaust air temperature, which in turn affects the thermal security of the chips under partial server utilization. According to the lectures [25,26], the chip-to-air temperature differences need to be larger than 45 °C under maximum heating loads; thus, the inlet air temperature of servers should be lower than 40 °C to keep a chip safe, but few studies have paid attention to this problem. In addition, the supply chilled water temperature and the chilled water flow rate also should be adjusted for energy saving under partial server utilization on the premise of ensuring the thermal safety of servers. Therefore, it is necessary to investigate the effects of the operating parameters (including the airflow rate, supply chilled water temperature, and water flow rate) on the performance of an LTS to improve the cooling efficiency and thermal security under partial server utilization.
This paper aims to conduct an experimental and numerical investigation on a water-cooled LTS under partial server utilization. Firstly, experimental studies were carried out in an enthalpy difference laboratory. The effects of the airflow rate and heating load on the cooling capacity, refrigerant mass flow rate, and rack’s average outlet air temperature were analyzed. Then, a steady-state distributed-parameter model was developed and validated based on the experimental data. To reduce the excessive cooling capacity and ensure thermal security, the effects of the operating parameters (including the airflow rate, supply chilled water temperature, and water flow rate) on the thermal safety and cooling efficiency were analyzed and evaluated, and several suggestions for operating parameter optimization were put forward.

2. Experimental Method

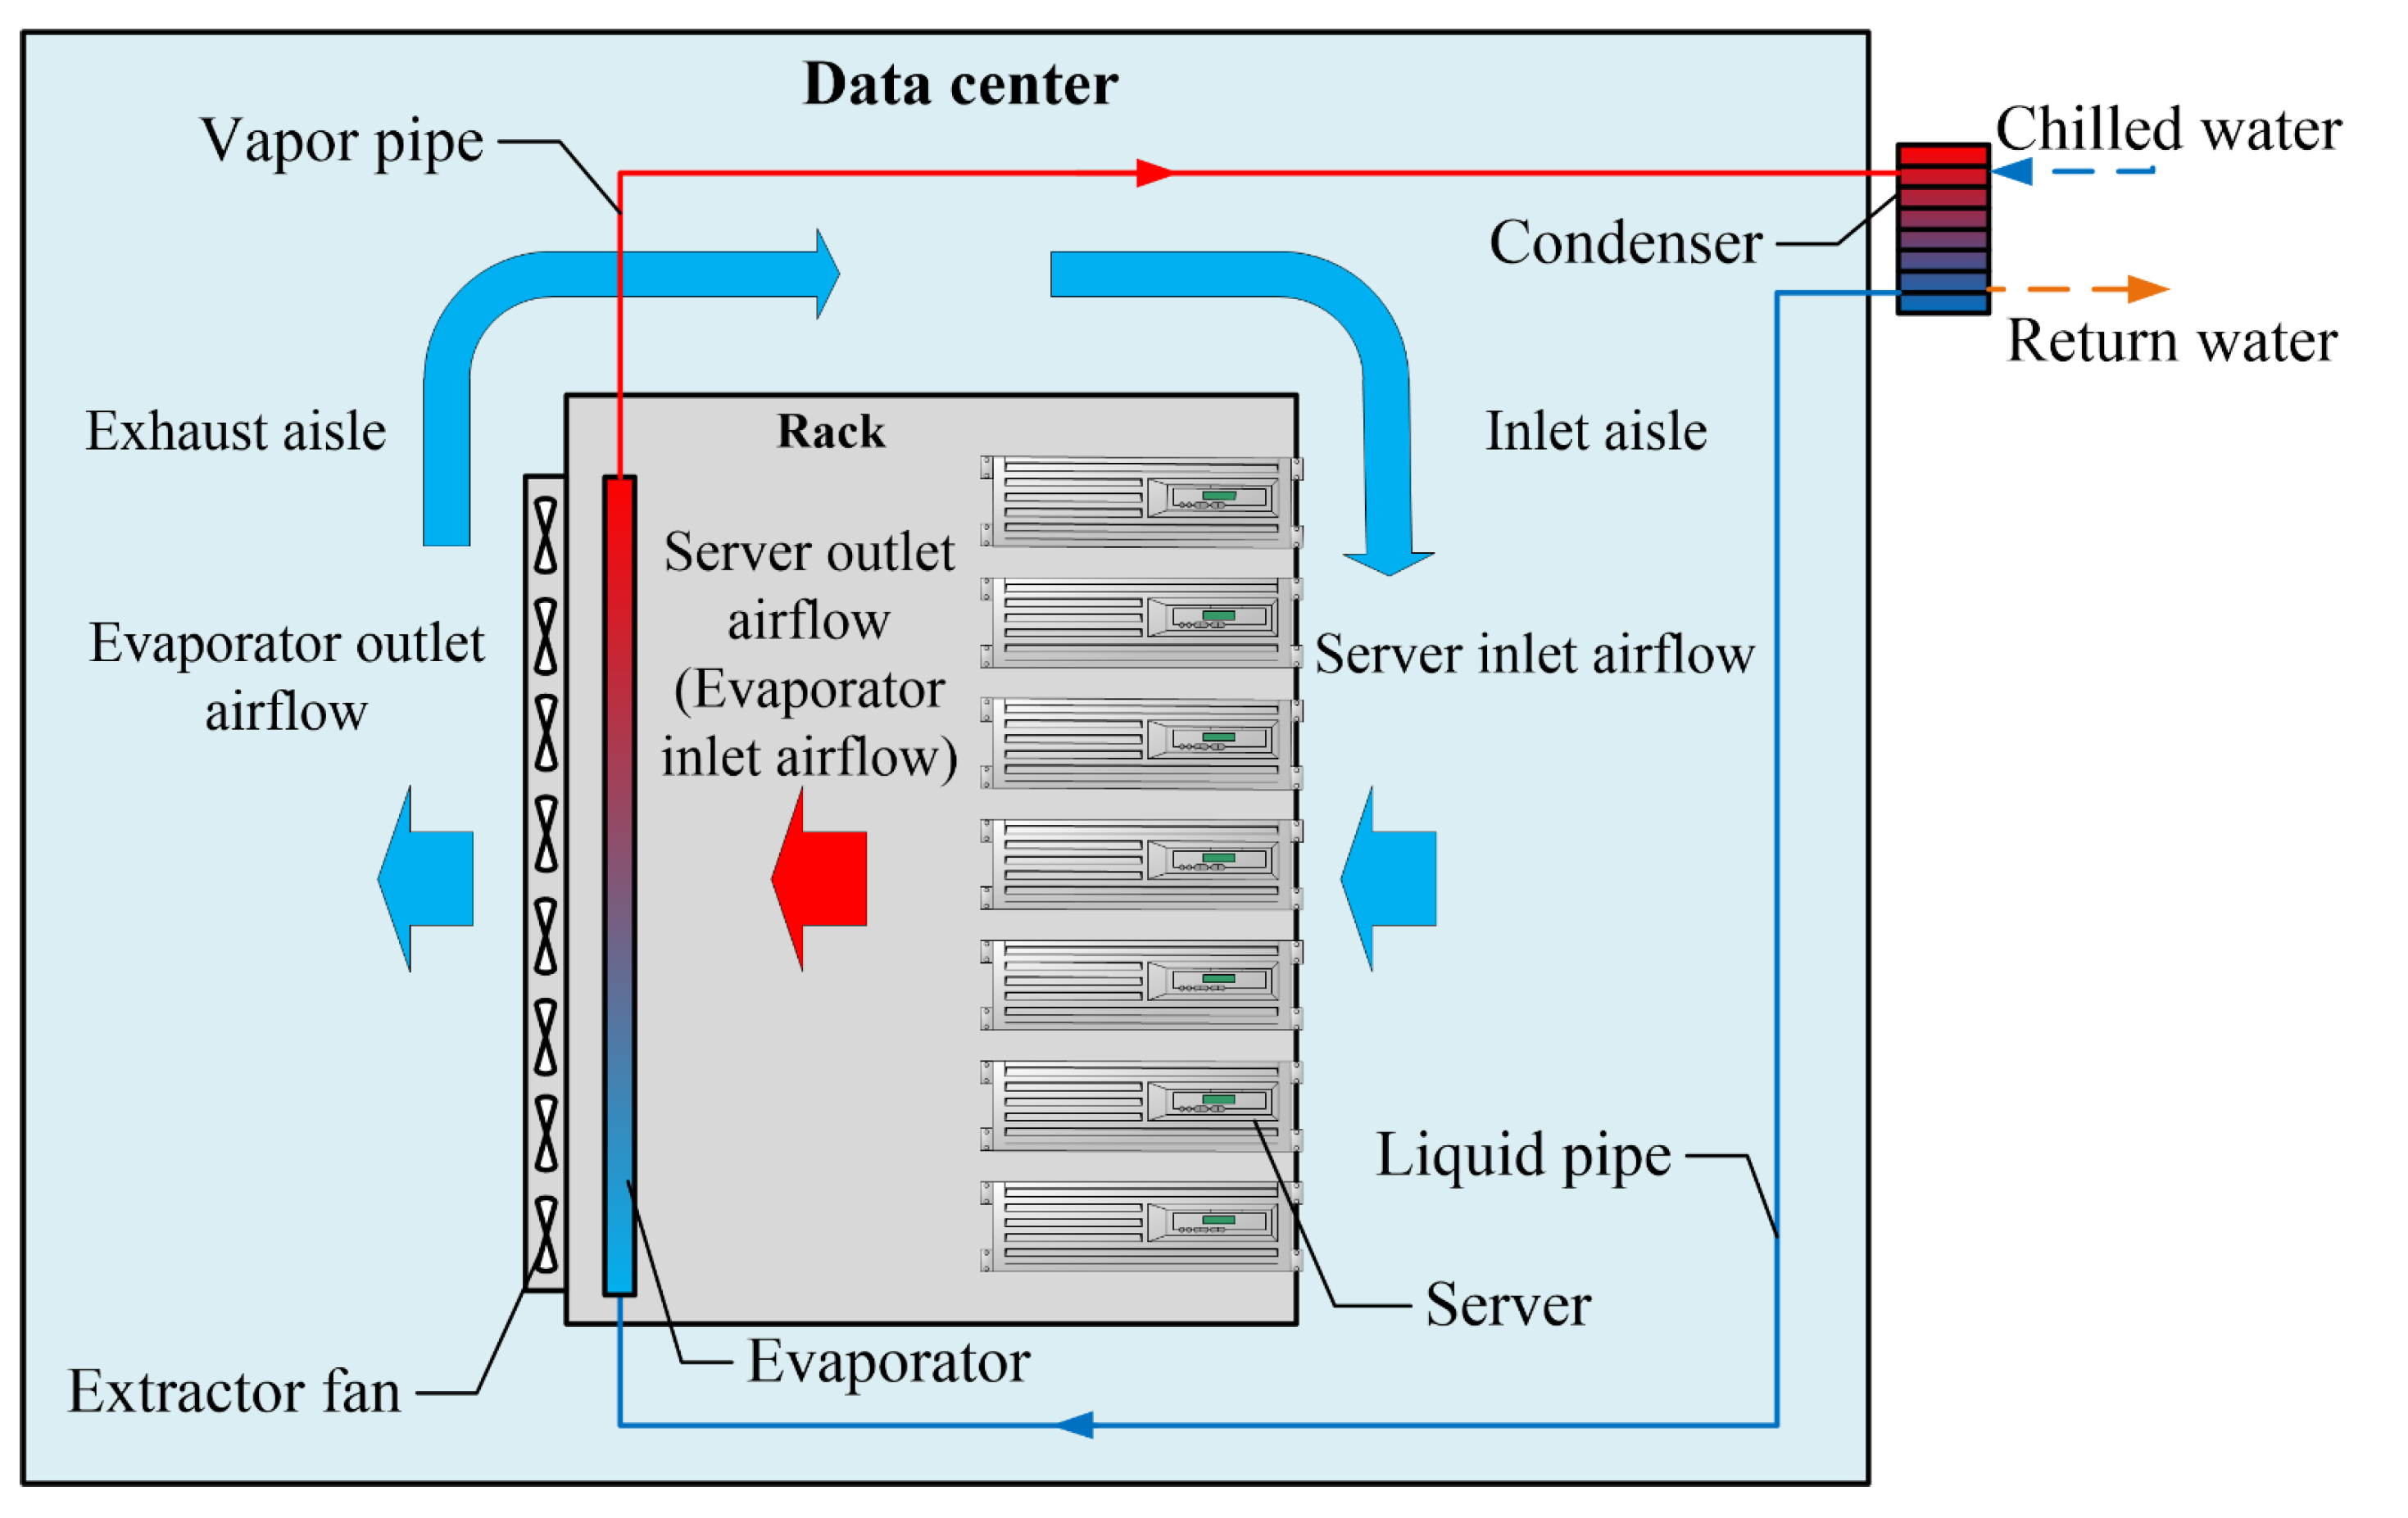
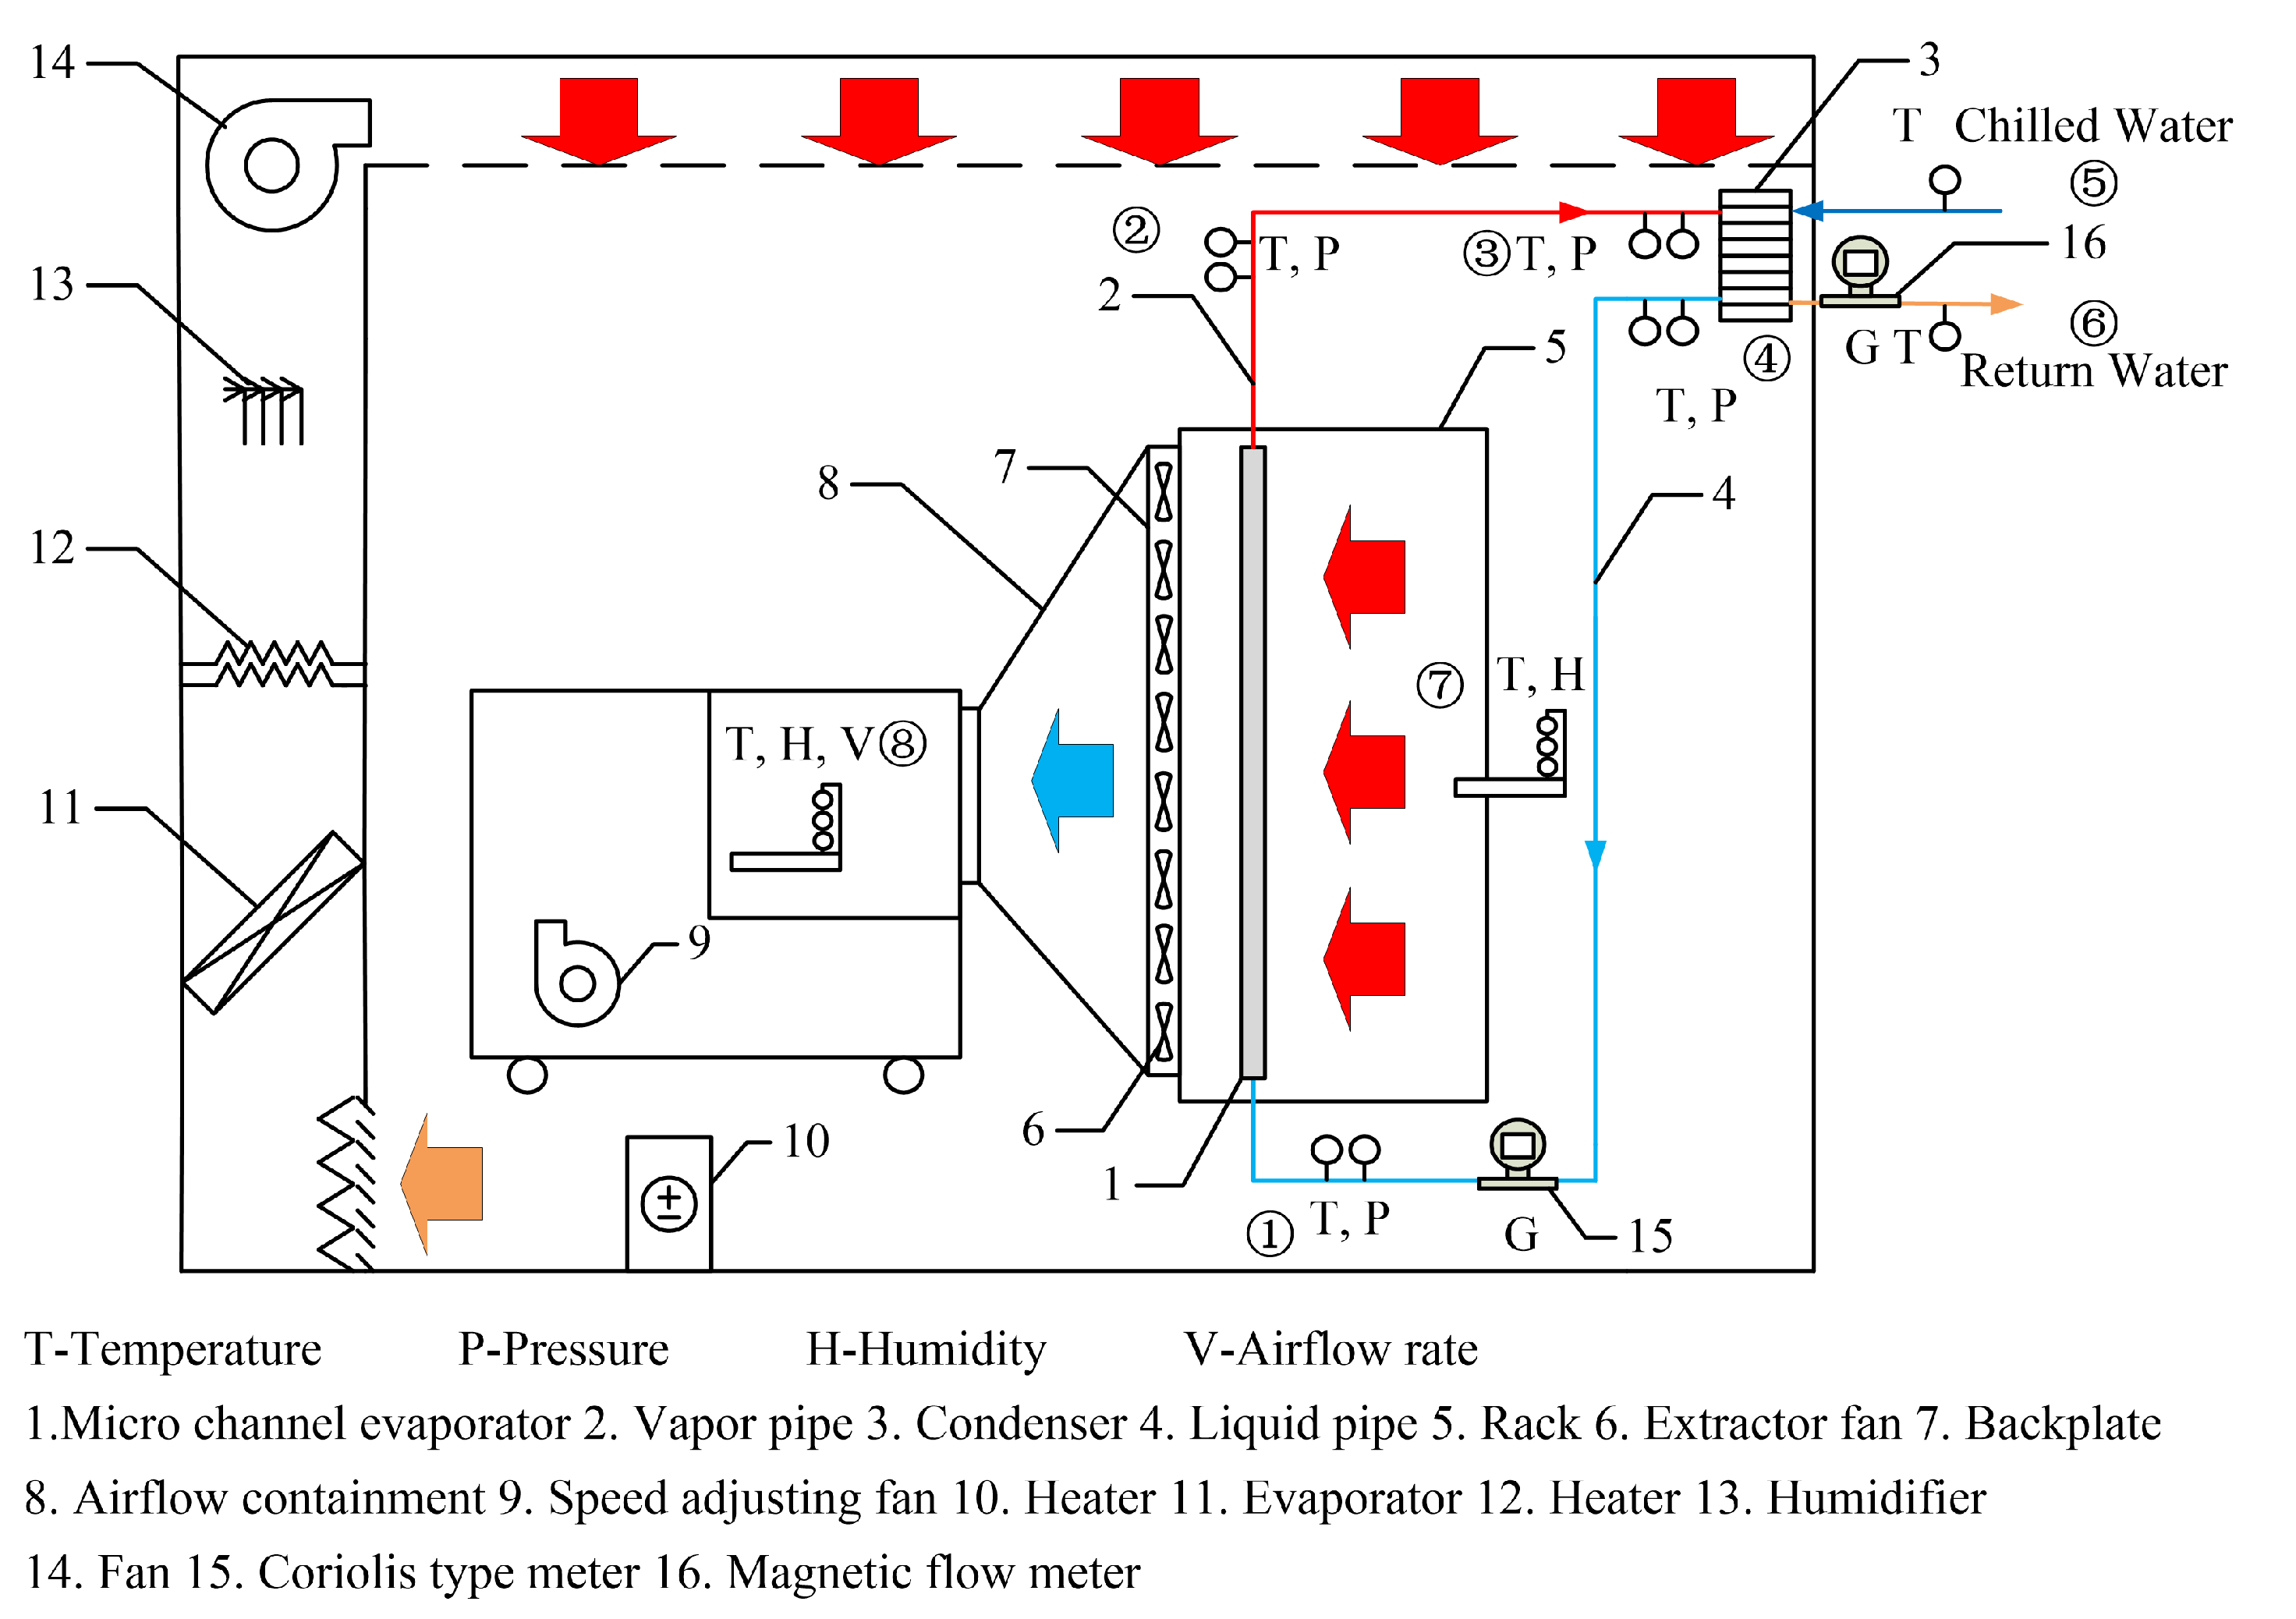
2.1. Experimental Setup

The experiments were carried out in an enthalpy difference laboratory, as shown in Figure 2. In order to obtain stable and uniform test conditions, the enthalpy difference laboratory provides hot air at dry and wet bulb temperatures of 35 °C and 21 °C, respectively, to simulate hot exhaust airflow generated by servers. The hot air was driven by extractor fans to carry the servers’ heat to the evaporator of an LTS mounted on the rack backplate and was cooled by the endothermic evaporation of the refrigerant. The vaporized refrigerant was condensed with 12 °C chilled water. The heating loads under different partial server utilizations were simulated by changing the airflow rate of extractor fans, and the airflow rate was measured by enthalpy difference laboratory. The structure parameters of the LTS are shown in Table 1.
Refrigerant temperatures and pressures at the inlet and outlet of the evaporator and condenser ①–④ were measured with PT100 platinum resistors and AKS32 pressure transmitters. Chilled water temperatures at the inlet and outlet of condenser ⑤–⑥ were also measured with PT100 platinum resistors. The air temperatures and humidity at the evaporator inlet and outlet ⑦–⑧ and the air temperatures and humidity at rack inlet ⑨ were measured by enthalpy difference laboratory. The refrigerant mass flow rate was measured by a Coriolis type meter, and the water flow rate was measured by a magnetic flow meter of the enthalpy difference laboratory. The measured ranges and uncertainties for test equipment are shown in Table 2. The uncertainties were calculated using Moffat method [27], and the maximum uncertainty for the cooling capacity was 6.8%.

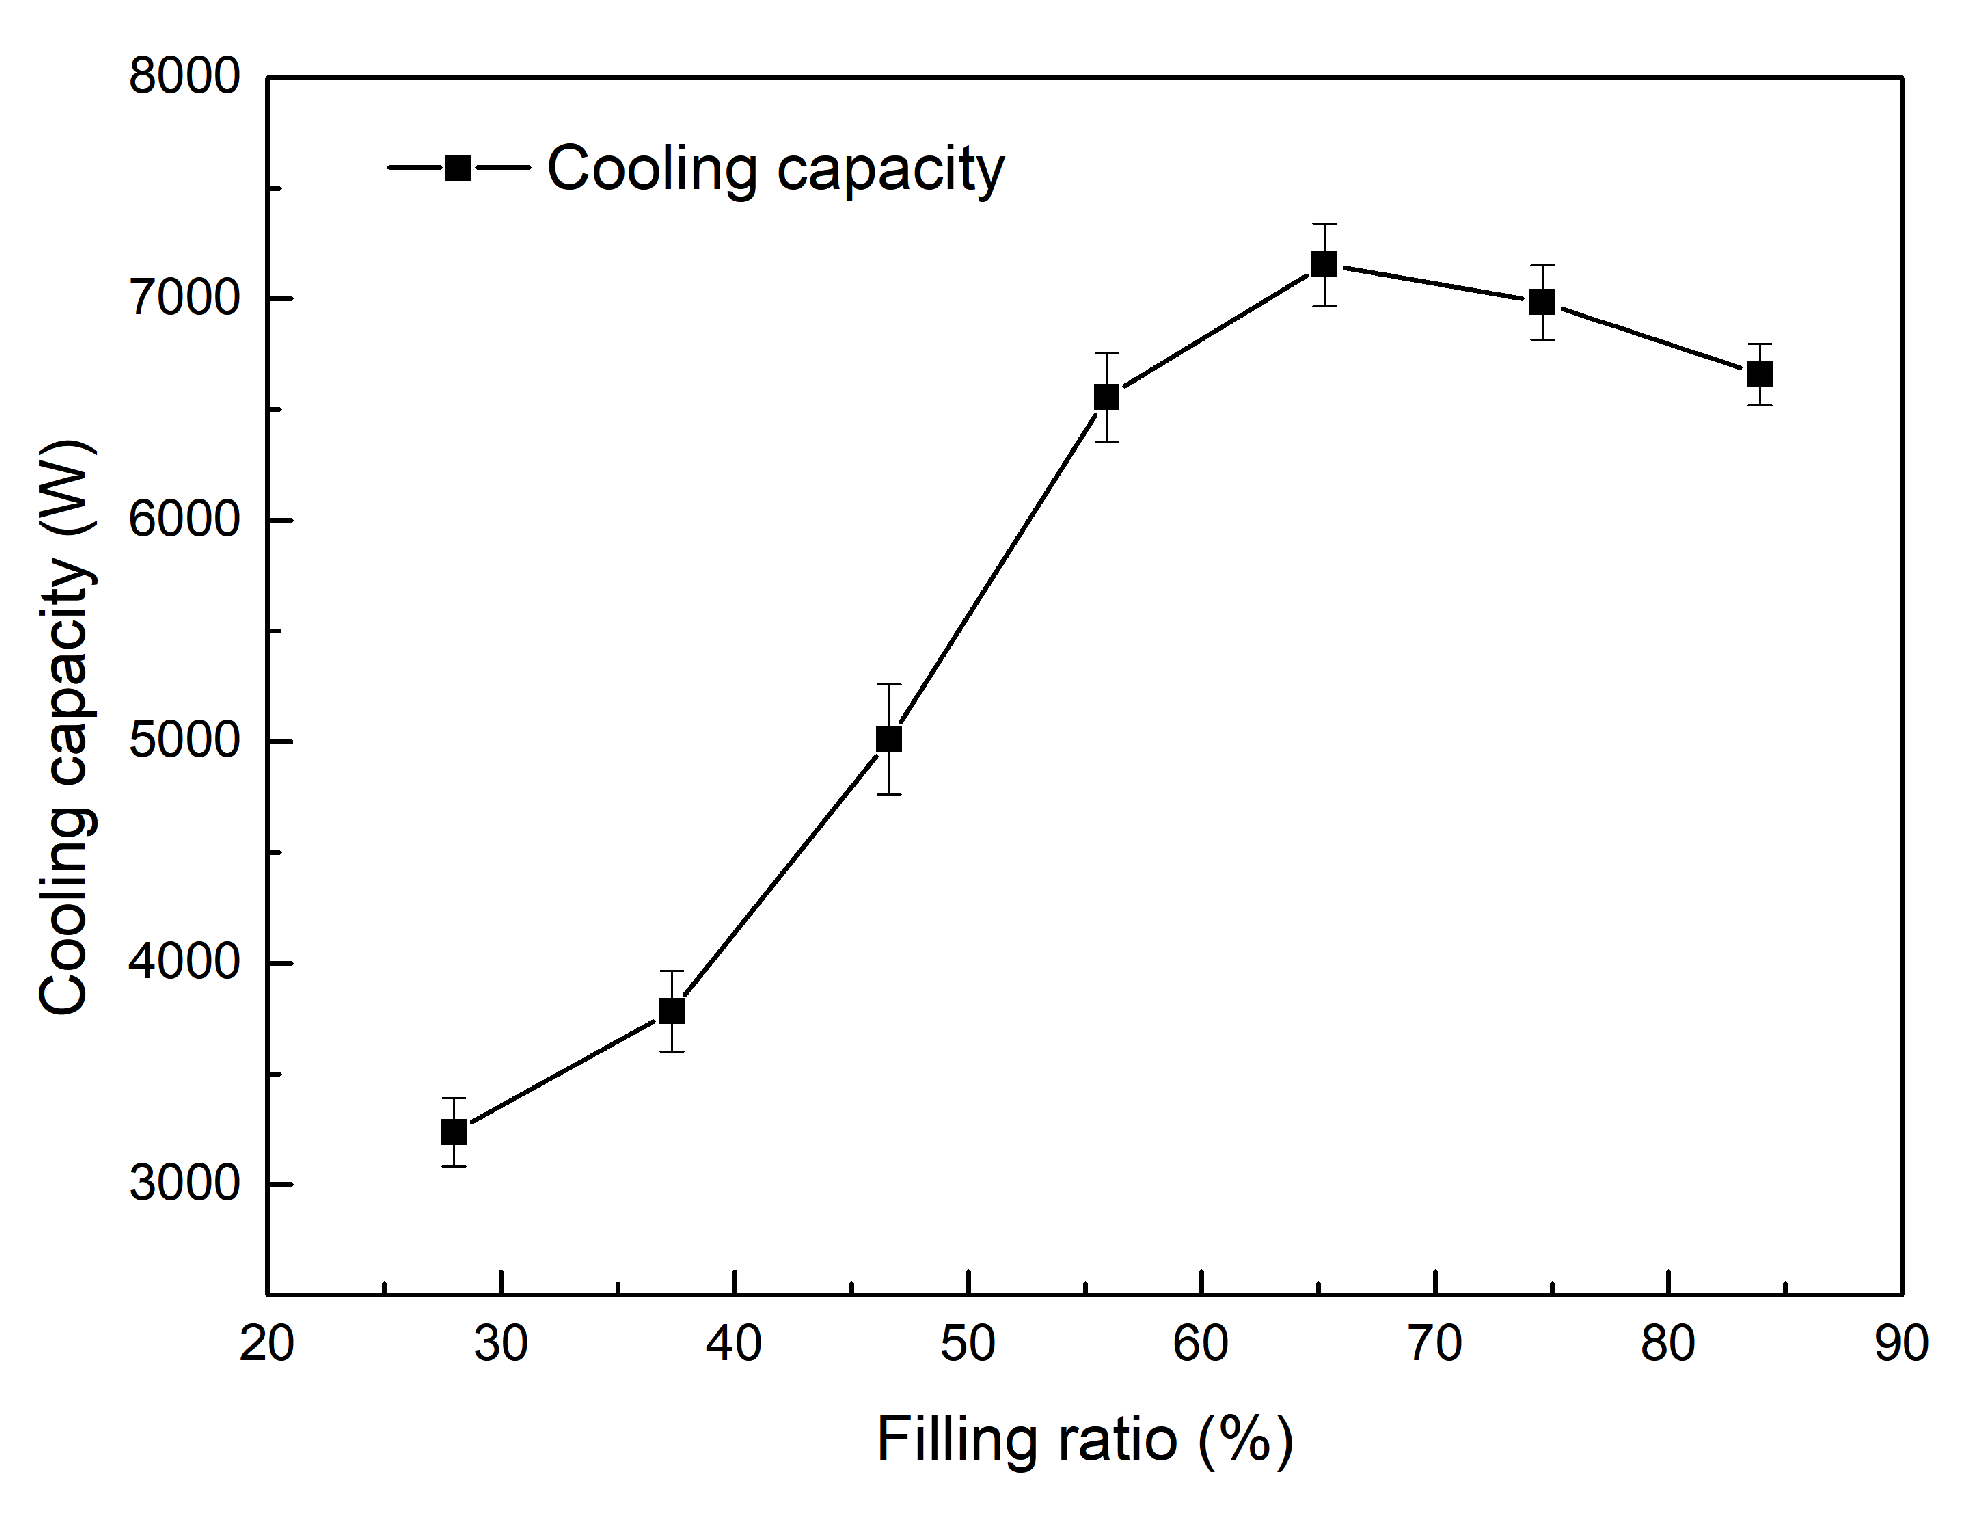
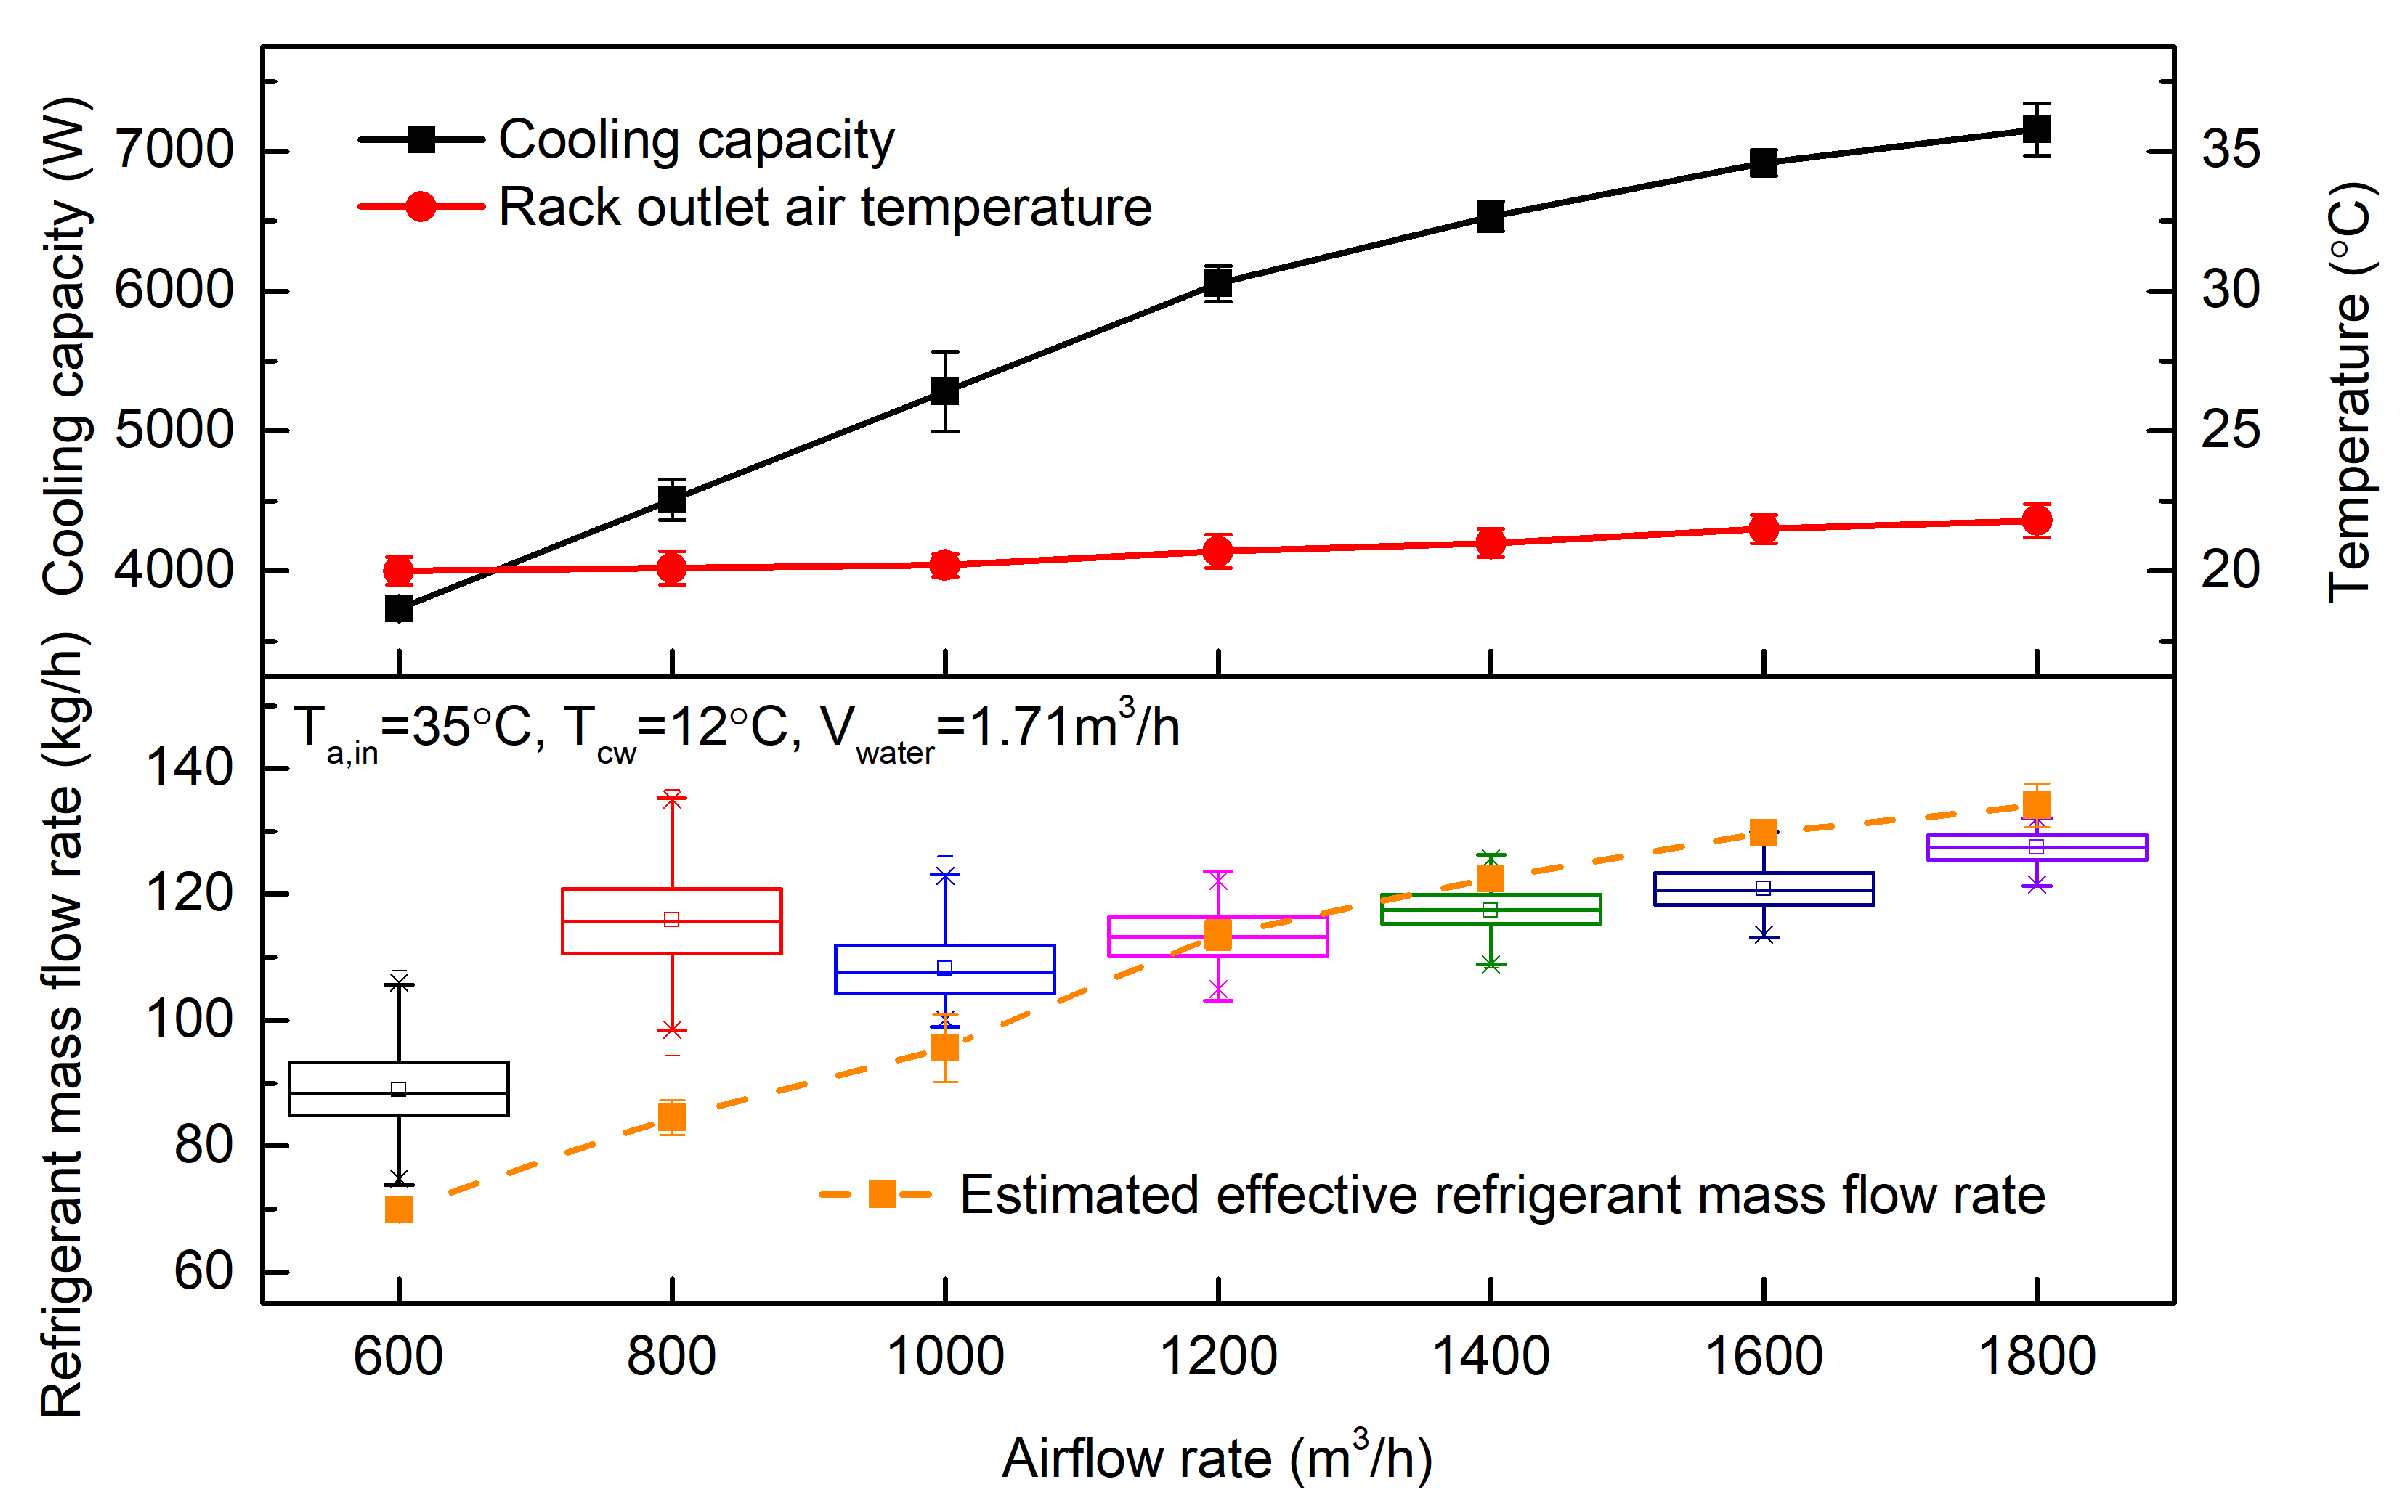
2.2. Test Conditions and Results
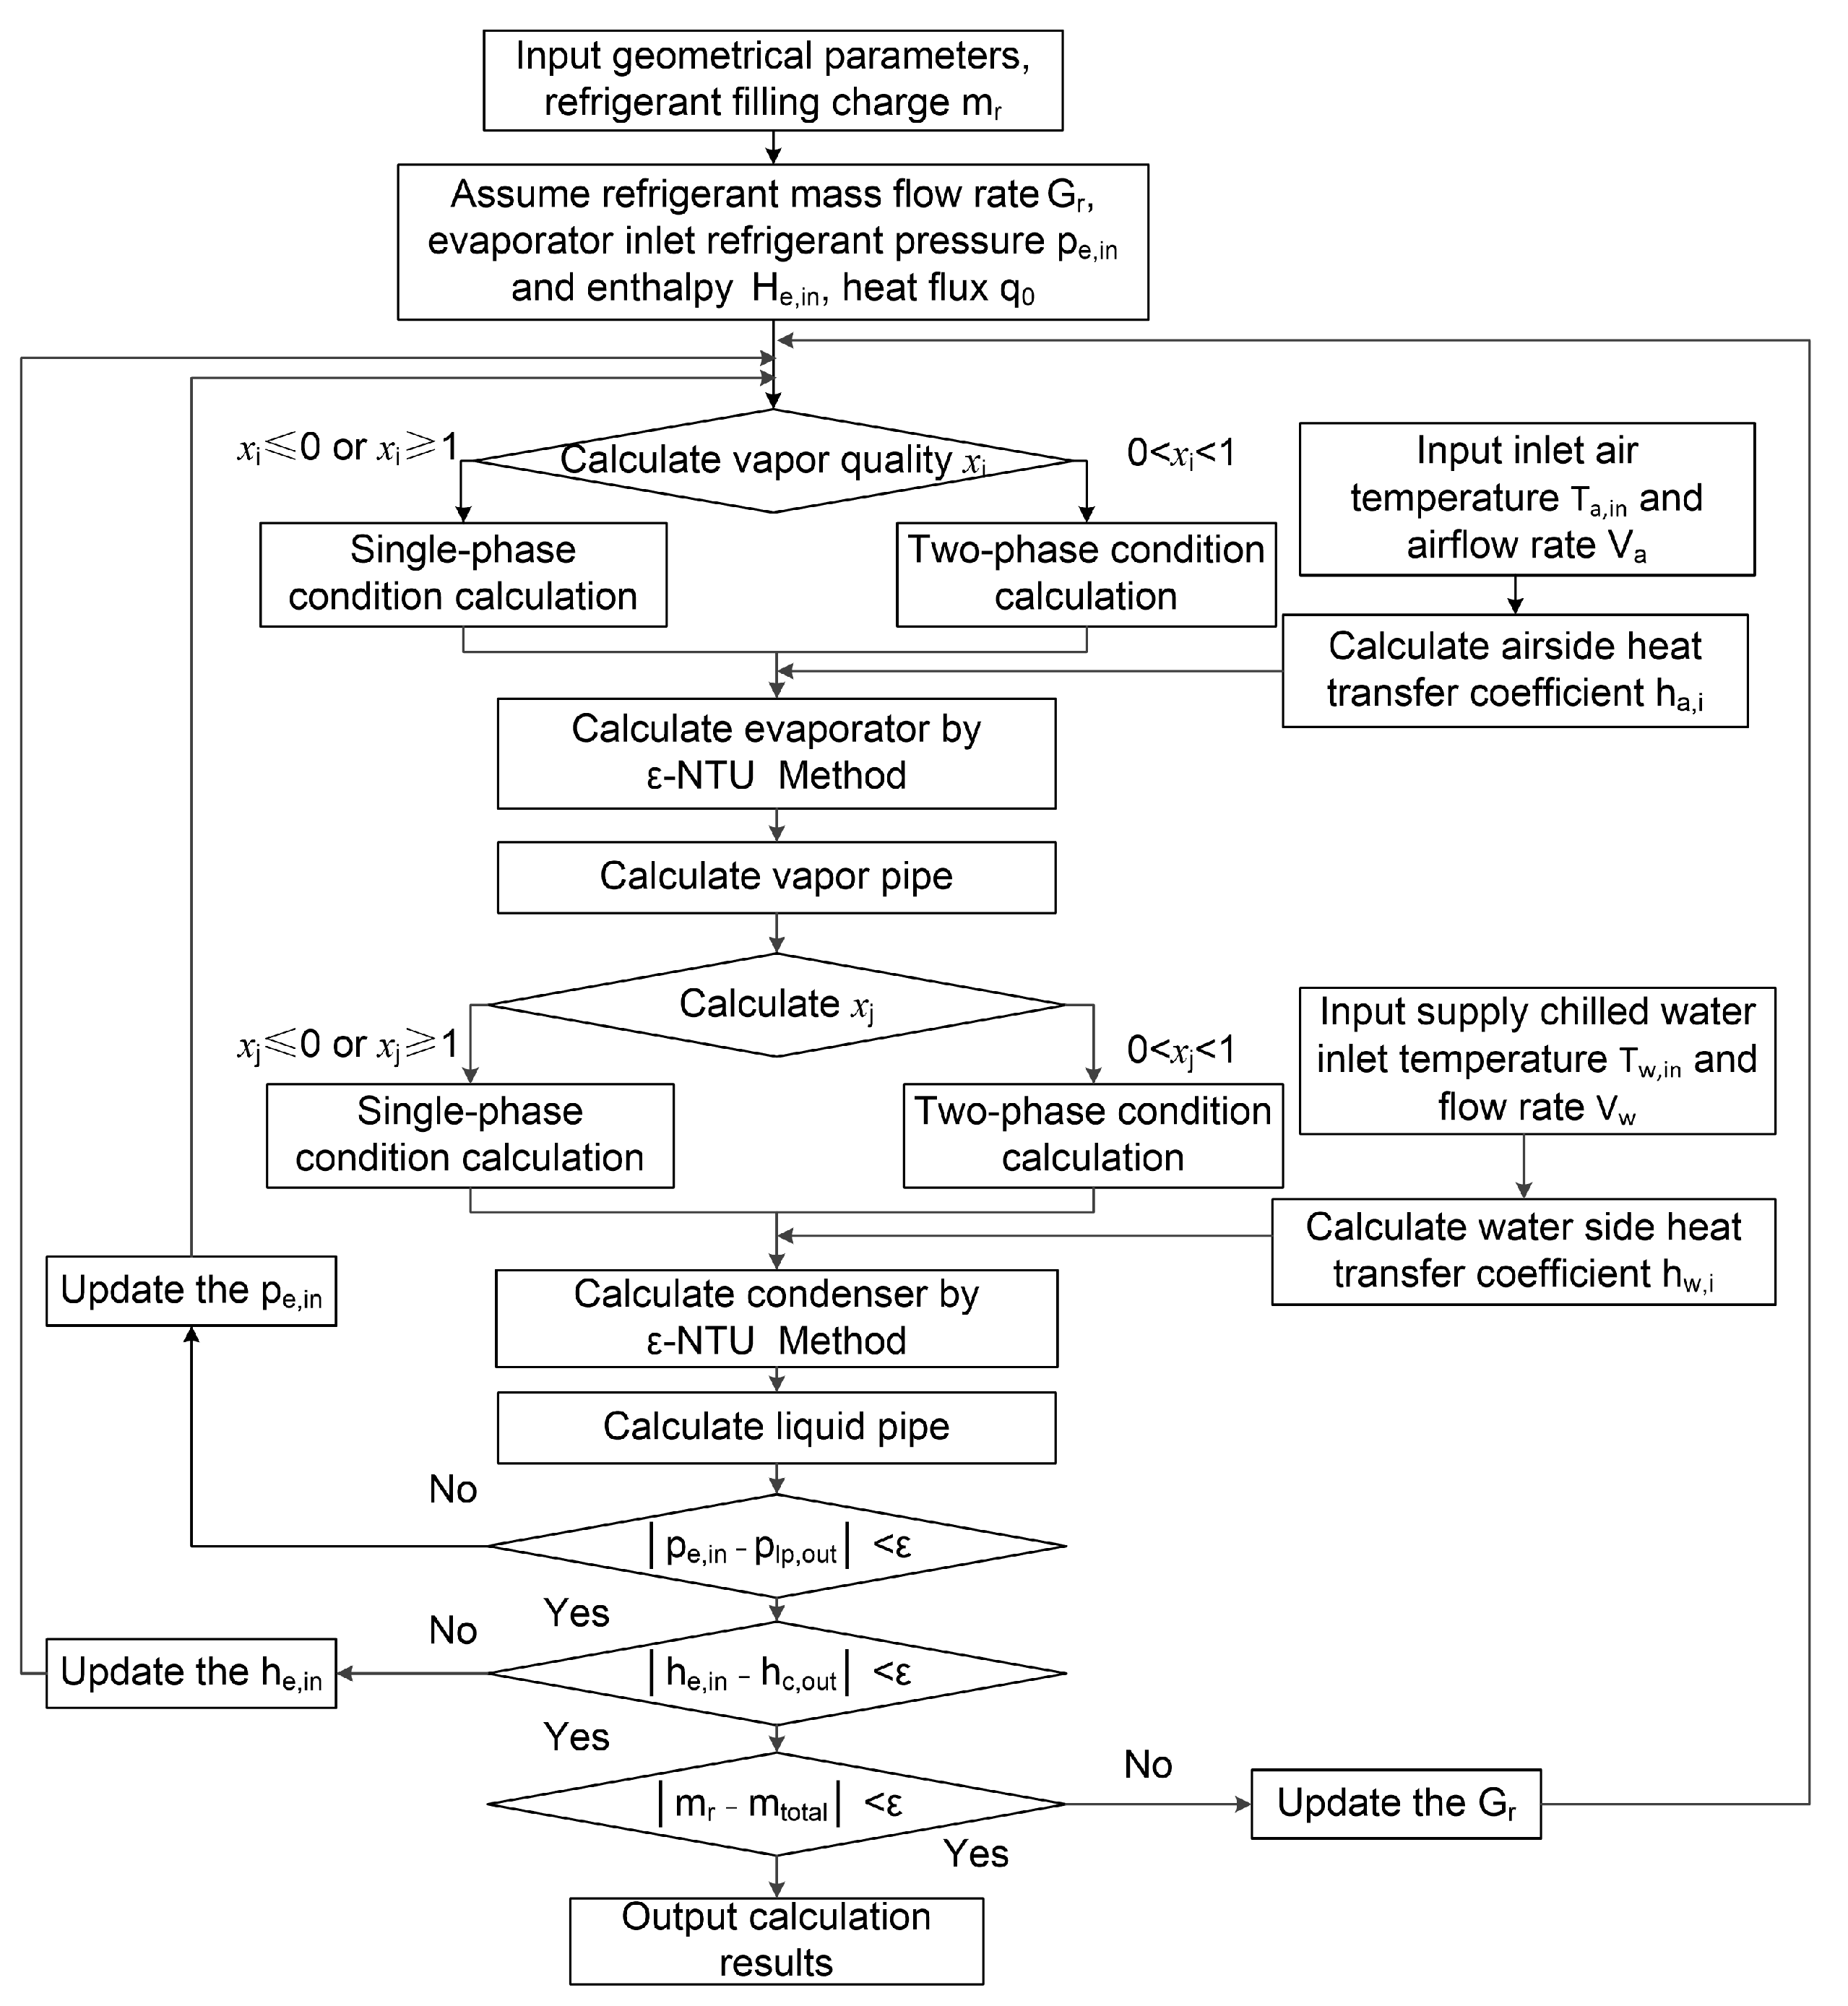
Since the refrigerant filling ratio was a main factor that determines the thermal performance of LTS [16,17], the optimal refrigerant filling ratio was tested at first. During the filling charge test, the airflow rate was constant at the rate of 1800 m3/h; the evaporator inlet air temperature (Ta,in) was 35°C, and the filling charge increased from 0.6 kg to 1.8 kg with each increase of 0.2 kg, corresponding to the filling ratio from 27.9% to 83.7%. In this study, the refrigerant filling ratio was defined using the following equation:
F i l l i n g r a t i o = m r ρ l q V e × 100 %
where mr is the refrigerant filling charge, kg; ρlq is the density of liquid refrigerant, kg/m3; and Ve is the interior volume of the evaporator, m3. At the optimal refrigerant filling ratio, the thermal performance was tested under different airflow rates and partial heating loads. The test conditions are shown in Table 3.
Figure 3 shows the cooling capacity under different filling ratios. The results showed that the cooling capacity increased with increasing filling ratio and reached the maximum value when the filling ratio reached 65.1%. With the further increase in filling ratio, the cooling capacity began to decrease. This indicates that the optimal filling ratio was 65.1%.
The thermal performance of LTS was tested at the optimal refrigerant filling ratio. The cooling capacity can be calculated with water side parameters:
Q e = ρ w a t e r V w a t e r C p w a t e r ( T r w T c w )
where Qe is the cooling capacity of LTS, W; ρwater is the density of water, kg/m3; Vwater is the chilled water mass flow rate, m3/h; Cpwater is the specific heat capacity of water, kJ/(kg·K); Tcw is the supply chilled water temperature, °C; Trw is the return water temperature, °C.
The thermal performance was tested under Ta,in = 35 °C, and airflow rate ranged from 600 m3/h to 1800 m3/h, as shown in Figure 4. Under 1800 m3/h airflow rate, the Qe was 7155 W. Then, Qe decreased rapidly due to reduced airflow rate and heating load. When the airflow rate was reduced from 1800 m3/h to 1200 m3/h, the Qe decreased by 15.4%. However, the decrement of Qe reached 32.5% when the airflow rate varied from 1200 m3/h to 600 m3/h, which means the decrements of Qe caused by airflow rate and heating load variation were nonlinear.
To better illustrate the above phenomenon, the refrigerant mass flow rate (Gr) is also shown in Figure 4. The refrigerant mass flow of the LTS was composed of two parts. The main part was the vaporized refrigerant, which reflected the thermal performance of LTS. The secondary part was the additional liquid refrigerant entrained by the vaporized refrigerant; it occupies a part of the two-phase heat transfer region in condenser, reducing the heat transfer performance of the whole system [28]. The effective refrigerant mass flow rate Gr,eff was estimated with:
G r , e f f = Q e h l g
where hlg is the latent heat of vaporization, kJ/kg.
Under 1800 m3/h airflow rate, almost all Gr was Gr,eff, and the maximum oscillation amplitude of Gr was only 4.8%. With the decrease in airflow rate and heating load, the Gr,eff decreased, while the oscillation amplitude of Gr increased. When airflow rate decreased to less than 1200 m3/h, the Gr,eff was significantly lower than Gr, which meant a part of condensation heat transfer region was occupied by additional liquid refrigerant. Due to the mixture flow of vapor and additional liquid refrigerant being unstable, the oscillation amplitudes of Gr were increased to more than 15%. This well-explained why the Qe dropped dramatically under 600–1200 m3/h airflow rate. However, the rack outlet air temperature changed less when airflow rate and heating load decreased. This suggested that LTS can still ensure the thermal safety of the data center under low airflow rates and partial server heating loads.

3. Numerical Model

To further reveal the effects of operating parameters on thermal performance and cooling efficiency, a steady-state distributed-parameter model was built for the water-cooled LTS. This model comprises three modules: a micro channel evaporator, a water-cooled condenser, and connection tubes. The modules of the evaporator and condenser used the finite volume method and ε-NTU method [29] to predict the cooling capacity (Qe), airside heat transfer coefficient (ha,i), refrigerant mass flow rate (Gr), pressure drop, and heat transfer coefficient. Each flow channel inside the evaporator and condenser was divided into 100 segments. The refrigerant thermodynamic properties were acquired from the REFPROP [30]. The working fluids along the system cycle abide by momentum (pressure), energy (enthalpy), and mass conservation.
Figure 5 illustrates the flow chart of the LTS modeling. The refrigerant mass flow rate, enthalpy, and pressure are unknown at the beginning of the calculation, and three iterations are required throughout the simulation. The heat transfer coefficient and pressure drop of working fluids are calculated with correlations in Table 4.
For the developed model, several assumptions were made as follows:
  • The working fluids in the evaporator and condenser have a one-dimensional homogeneous flow;
  • The airflow was evenly distributed among the micro channel exchanger;
  • There was no air backflow or leakage in the rack;
  • The refrigerant flow rate, temperature, and pressure were evenly distributed in every channel of the heat exchanger;
  • The acceleration pressure drop of the working fluids was neglected;
  • The axial heat transfer and heat dissipation of the working fluids were neglected.

3.1. Evaporator Module

In the evaporator module, the airside and refrigerant side heat transfer coefficients of each segment were calculated with the heat transfer correlations. These correlations would affect the related prediction accuracies of the evaporator module and other modules. For the tested LTS, the lowest airside Reynolds number was lower than 50 when the airflow rate was 600 m3/h. However, the existing airside heat transfer correlations [38,39,40,41] used to predict the louver fin micro channel heat exchanger are primarily suitable for the prediction of airside heat transfer coefficients in regions with Reynolds numbers exceeding 100.
According to the comparisons in our previous study [42], Kim and Bullard’s correlation [38] was finally selected from four widely used airside heat transfer correlations, which can be calculated with:
j = R e a 0.487 θ 90 0.257 F p P l 0.13 H f P l 0.29 B f P l 0.235 L l e P l 0.68 P f P l 0.279 δ f P l 0.05
h a = j R e a P r a 1 / 3 k a P l
R e a = V a D h , a ν a
where j is the Coburn factor; θ is the louver angle, °; Fp is the fin pitch, mm; Pl is the louver pitch, mm; Hf is the fin height, mm; Bf is the fin width, mm; Lle is the louver length, mm; Pf is the transverse flat tube pitch, mm; δf is the fin thickness, mm; ha is the airside heat transfer coefficient, W/(m2·K); Pra is the Prandtl number of air, ka is the air thermal conductivity, W/(m·K); va is the maximum air velocity, m/s; νa is the air viscosity, m2/s; Dh,a is the airside hydraulic diameter, mm; Rea is the airside Reynolds number.
For the LTS, there are mainly three flow patterns [43]: nuclear boiling, bubbly flow, and slug flow. Because there is no driving force, the refrigerant mass flow rate of the LTS is low, especially under partial server utilization. Inside the evaporator, the flow patterns are primarily nuclear boiling and bubbly flow. Thus, the Shah correlation [33] was chosen from four widely used boiling heat transfer correlations [33,44,45,46], which had a higher prediction accuracy for these flow patterns.

3.2. Condenser Module

In the condenser (plate heat exchanger) module, the Muley and Manglik correlation [32] was used to calculate the refrigerant side single-phase heat transfer coefficient and the water side heat transfer coefficient. Han et al.’s correlation [35] was chosen to predict the refrigerant two-phase heat transfer coefficient:
h c = G e 1 k r , l D h , c R e e q G e 2 P r 0.4 B o 0.3
G e 1 = 2.81 b D h , c 0.041 π 2 β c 2.83
G e 2 = 0.746 b D h , c 0.082 π 2 β c 0.61
where hc is the refrigerant side heat transfer coefficient of the condenser W/(m2·K); b is the corrugation amplitude, mm; Ge1 and Ge2 are the correlation factors, kr,l is the liquid refrigerant thermal conductivity, W/(m·K); Dh,c is the flow channel hydraulic diameter of the plate heat exchanger, mm; Reeq is the equivalent Reynolds number, the boiling number Bo = q(Gr1hlg)−1.

3.3. Connection Tube Module

In the connection tube module, the vapor pipe, liquid pipe, and collecting pipe in the LTS were considered adiabatic, so the refrigerant flows inside them were taken to be isoenthalpy flow. The pressure drop was calculated with Equations (9)–(13). Coleman’s correlation [37] was used to calculate the compact pressure drop at the collecting pipe.
Δ P f , r = ( λ f L l p + ξ f ) ρ r u r 2 2 g
Δ P g = ρ r g Δ H
C c = 1 1 σ c 2.08 1 σ c + 0.5371
Δ P c = ( 2.26 G r ) 2 2 ρ r 1 σ c 2 C c 2 2 C c ( 1 C c )
Δ P l p = Δ P f , r + Δ P g + Δ P c
where ΔPlp is the liquid pipe pressure drop, Pa; ΔPf,r is the frictional pressure drop, Pa; ΔPg is the gravitational pressure drop, Pa; ΔPc is the compact pressure drop, Pa; λf is the frictional resistance coefficient; ξf is the local resistance coefficient; ur is the refrigerant flow velocity, m/s; ΔH is the liquid pipe height difference, mm; σc is the ratio of the micro channel cross-sectional area to the collector cross-sectional area; Cc is the compact coefficient.

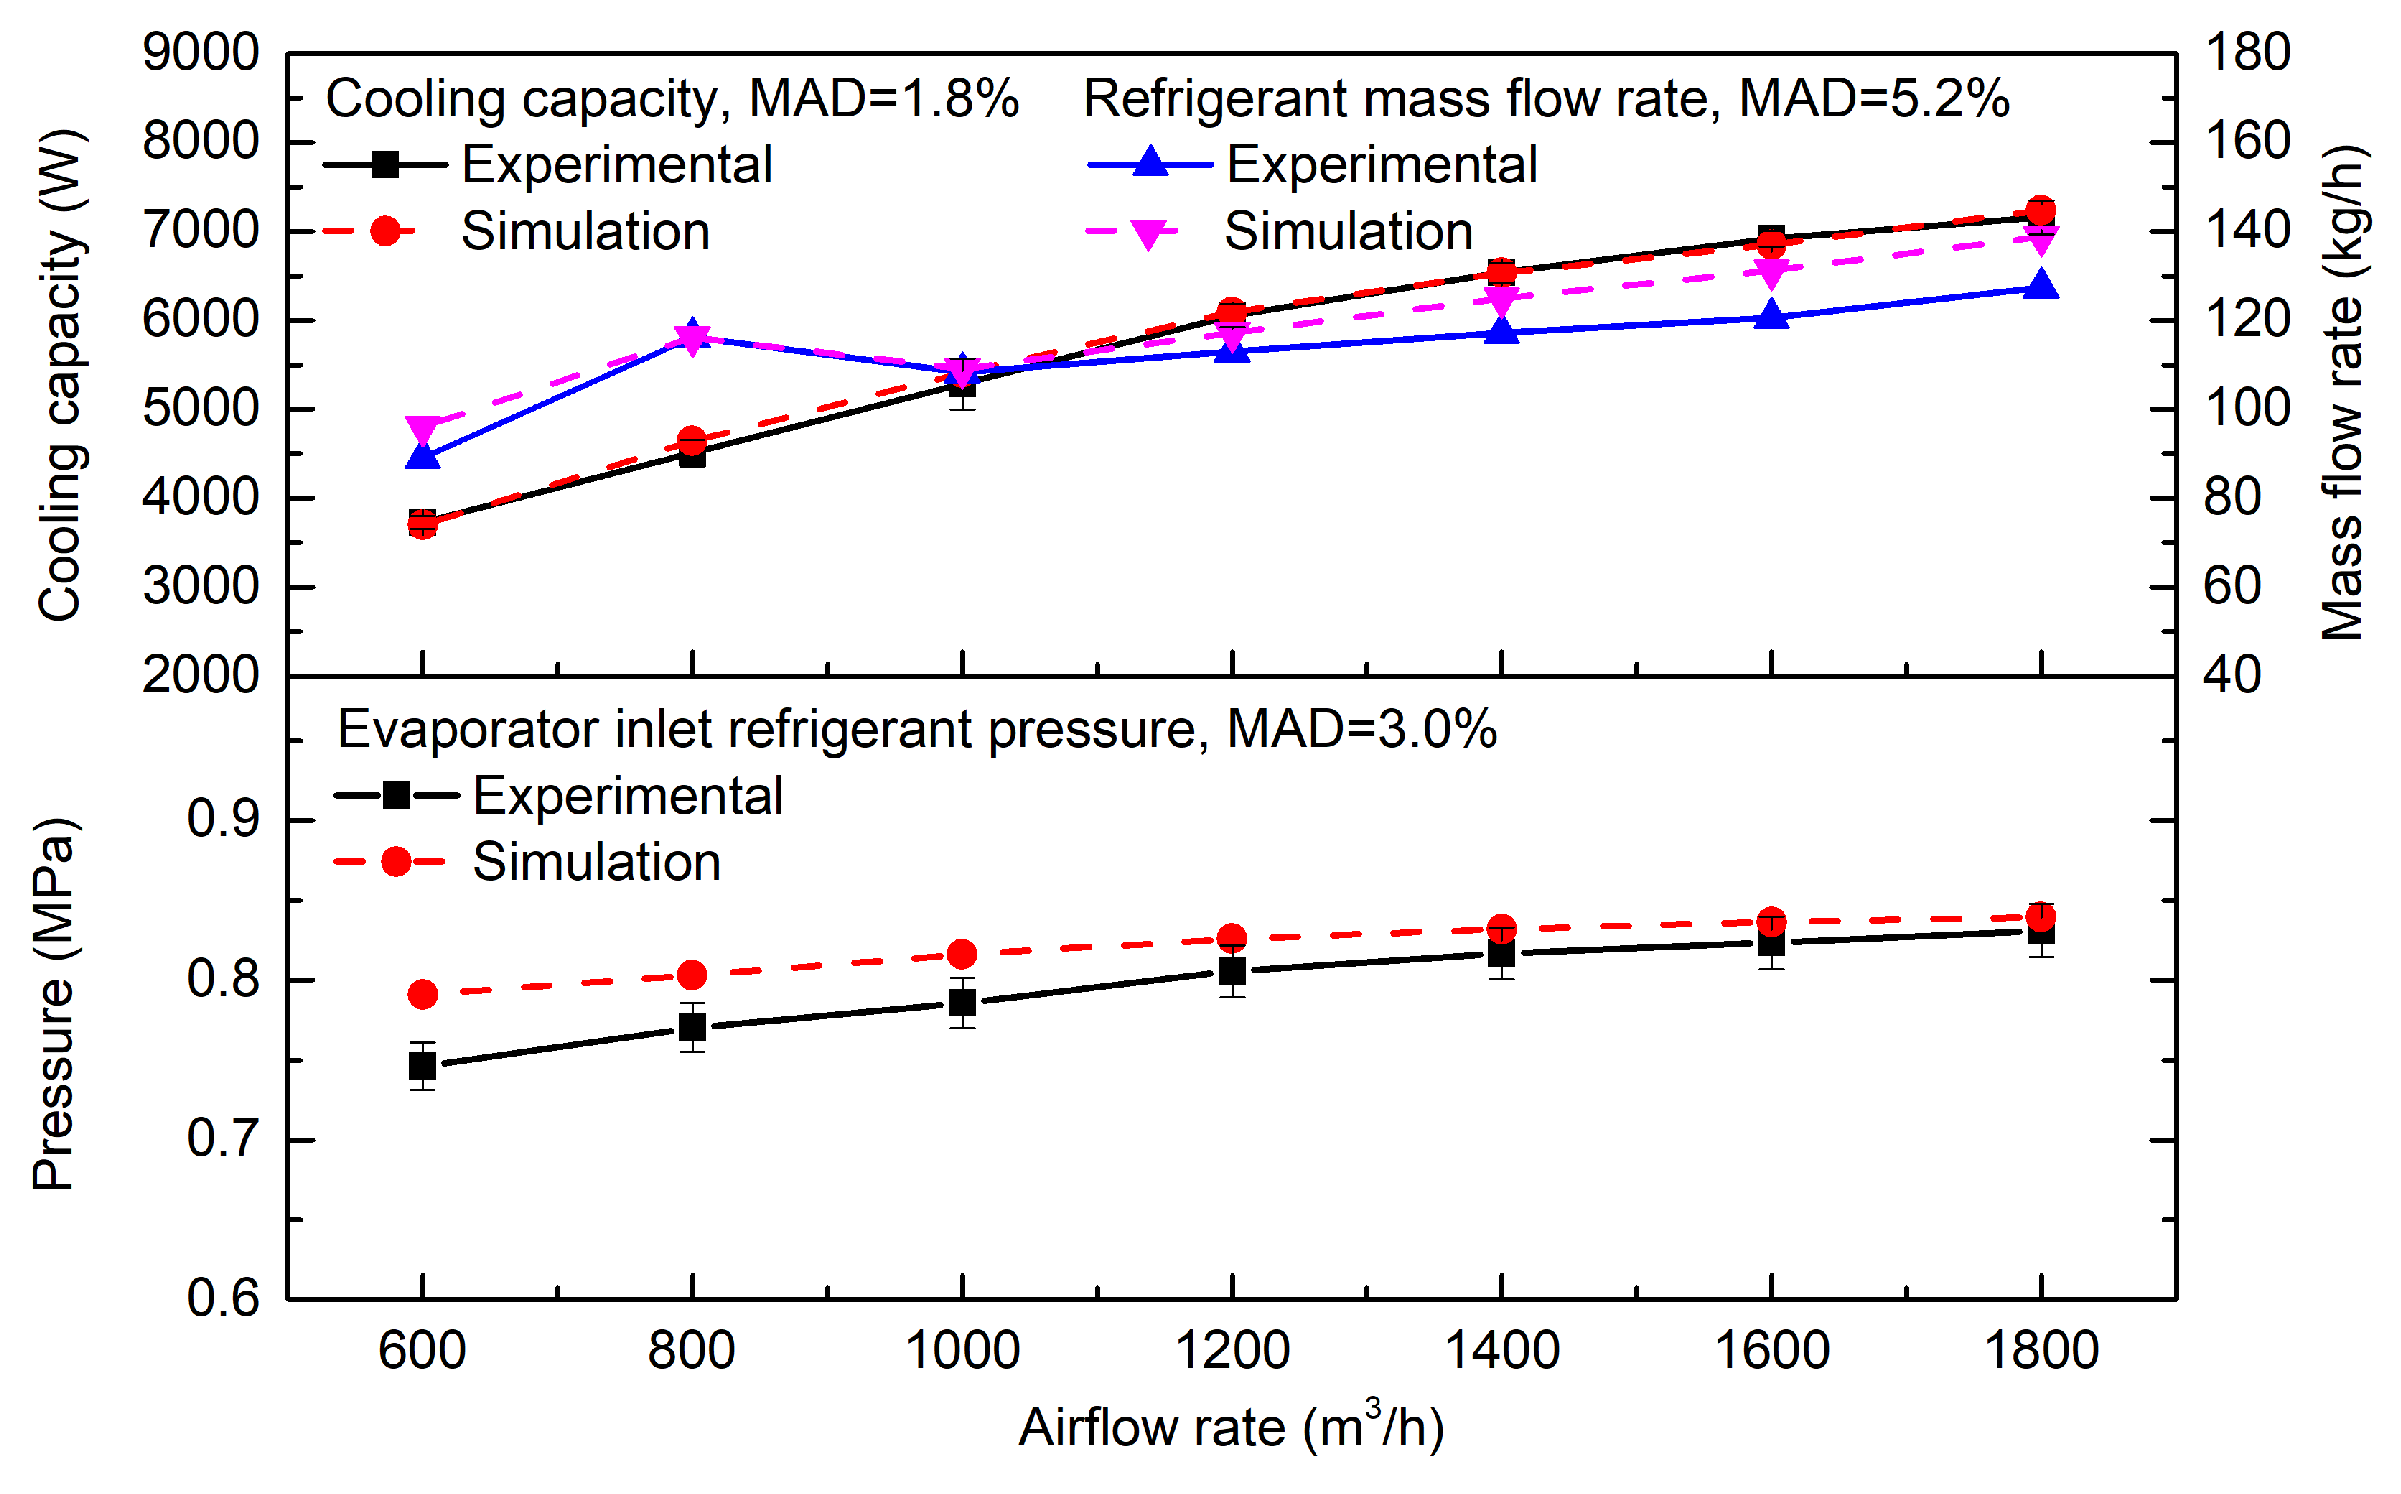
3.4. Model Verification

In practical application, the cooling capacity is the main parameter used to evaluate LTS performance followed by the refrigerant mass flow rate and pressure. The comparison results show that the prediction values agreed well with the experimental data, including the cooling capacity, refrigerant mass flow rate, and pressure, as shown in Figure 6. The mean absolute deviations (MADs) between the experimental and prediction results were less than 5.2% according to Equation (15).
M A D = 1 N i = 1 N y ( i ) p r e d y ( i ) e x p y ( i ) e x p
where y ( i ) p r e d is the prediction result of point i, y ( i ) e x p is the experimental data of point i, and N is the number of total data points.

4. Analysis and Discussion

4.1. Simulation Conditions

In an actual data center, the airflow distribution is a major impact factor for thermal safety. As shown in Figure 1, servers suck in cold air from the inlet aisle and exhaust hot air into the evaporator of the LTS inside the rack. The space inside a rack can be regarded as a hot aisle, the space outside the racks can be regarded as a cold aisle, and the hot aisle is enclosed by the racks’ walls. Therefore, the average outlet air temperature of the evaporator was assumed equal to the rack’s average outlet air temperature. In order to regulate the airflow, the rack seals well in applications, so the heat loss of the rack can be neglected in simulations.
During the simulation process, the total servers’ heating load of a rack under different server utilization can be calculated with Equations (16)–(18) [23]. A schematic diagram of a simulated LTS integrated with servers in a rack is shown in Figure 7. The server exhaust air temperature Ts,out can be regarded as the evaporator inlet air temperature Ta,in, which was calculated with Equation (19). The rack’s average outlet air temperature was calculated with Equation (20).
α i = 0.7848 + 0.02722 T s , i n 0.001353 T s , i n 2 + 0.00002381 T s , i n 3
η h = 0.01 α i u s 27.39 + 0.9027 u s 0.0017462704 u s 2
P s , i = η h P s , f u l l
T s , o u t = T r a c k , i n + P s V a ρ a C p a
T r a c k , o u t = T s , o u t Q e V a ρ a C p a
where us is the server utilization, %; αi is the heat generation increase factor; Ps is the total server heating load of a rack, W; Ps,full is the total rated heating load of servers in a rack, W; ηh is the server heat generation rate; ρa is the density of air, kg/m3; Cpa is the specific heat capacity of air; kJ/(kg·K). In this study, Ps,full was assumed as 7200 W; Track,in is the rack inlet air temperature, which can be regarded as the indoor air temperature, °C.
Since the exhaust air of each rack will be mixed in the exhaust aisle, the influence of a single rack on the indoor air temperature of the whole data center is ignored, and the indoor air temperature is regarded as constant. According to the Code for Design of Data Centers (GB50174-2017) [47], the reference ranges of indoor air for dry, relative humidity, and dew-point temperatures are 18–27 °C, <60%, and 5.5–15 °C, respectively. In order to improve the operating efficiency of the cooling system, the indoor air temperature is usually set close to the upper limit of the reference value. Thus, the indoor air dry and wet bulb temperature was set as 26 °C and 14 °C, respectively. The details of the simulation conditions are shown in Table 5.

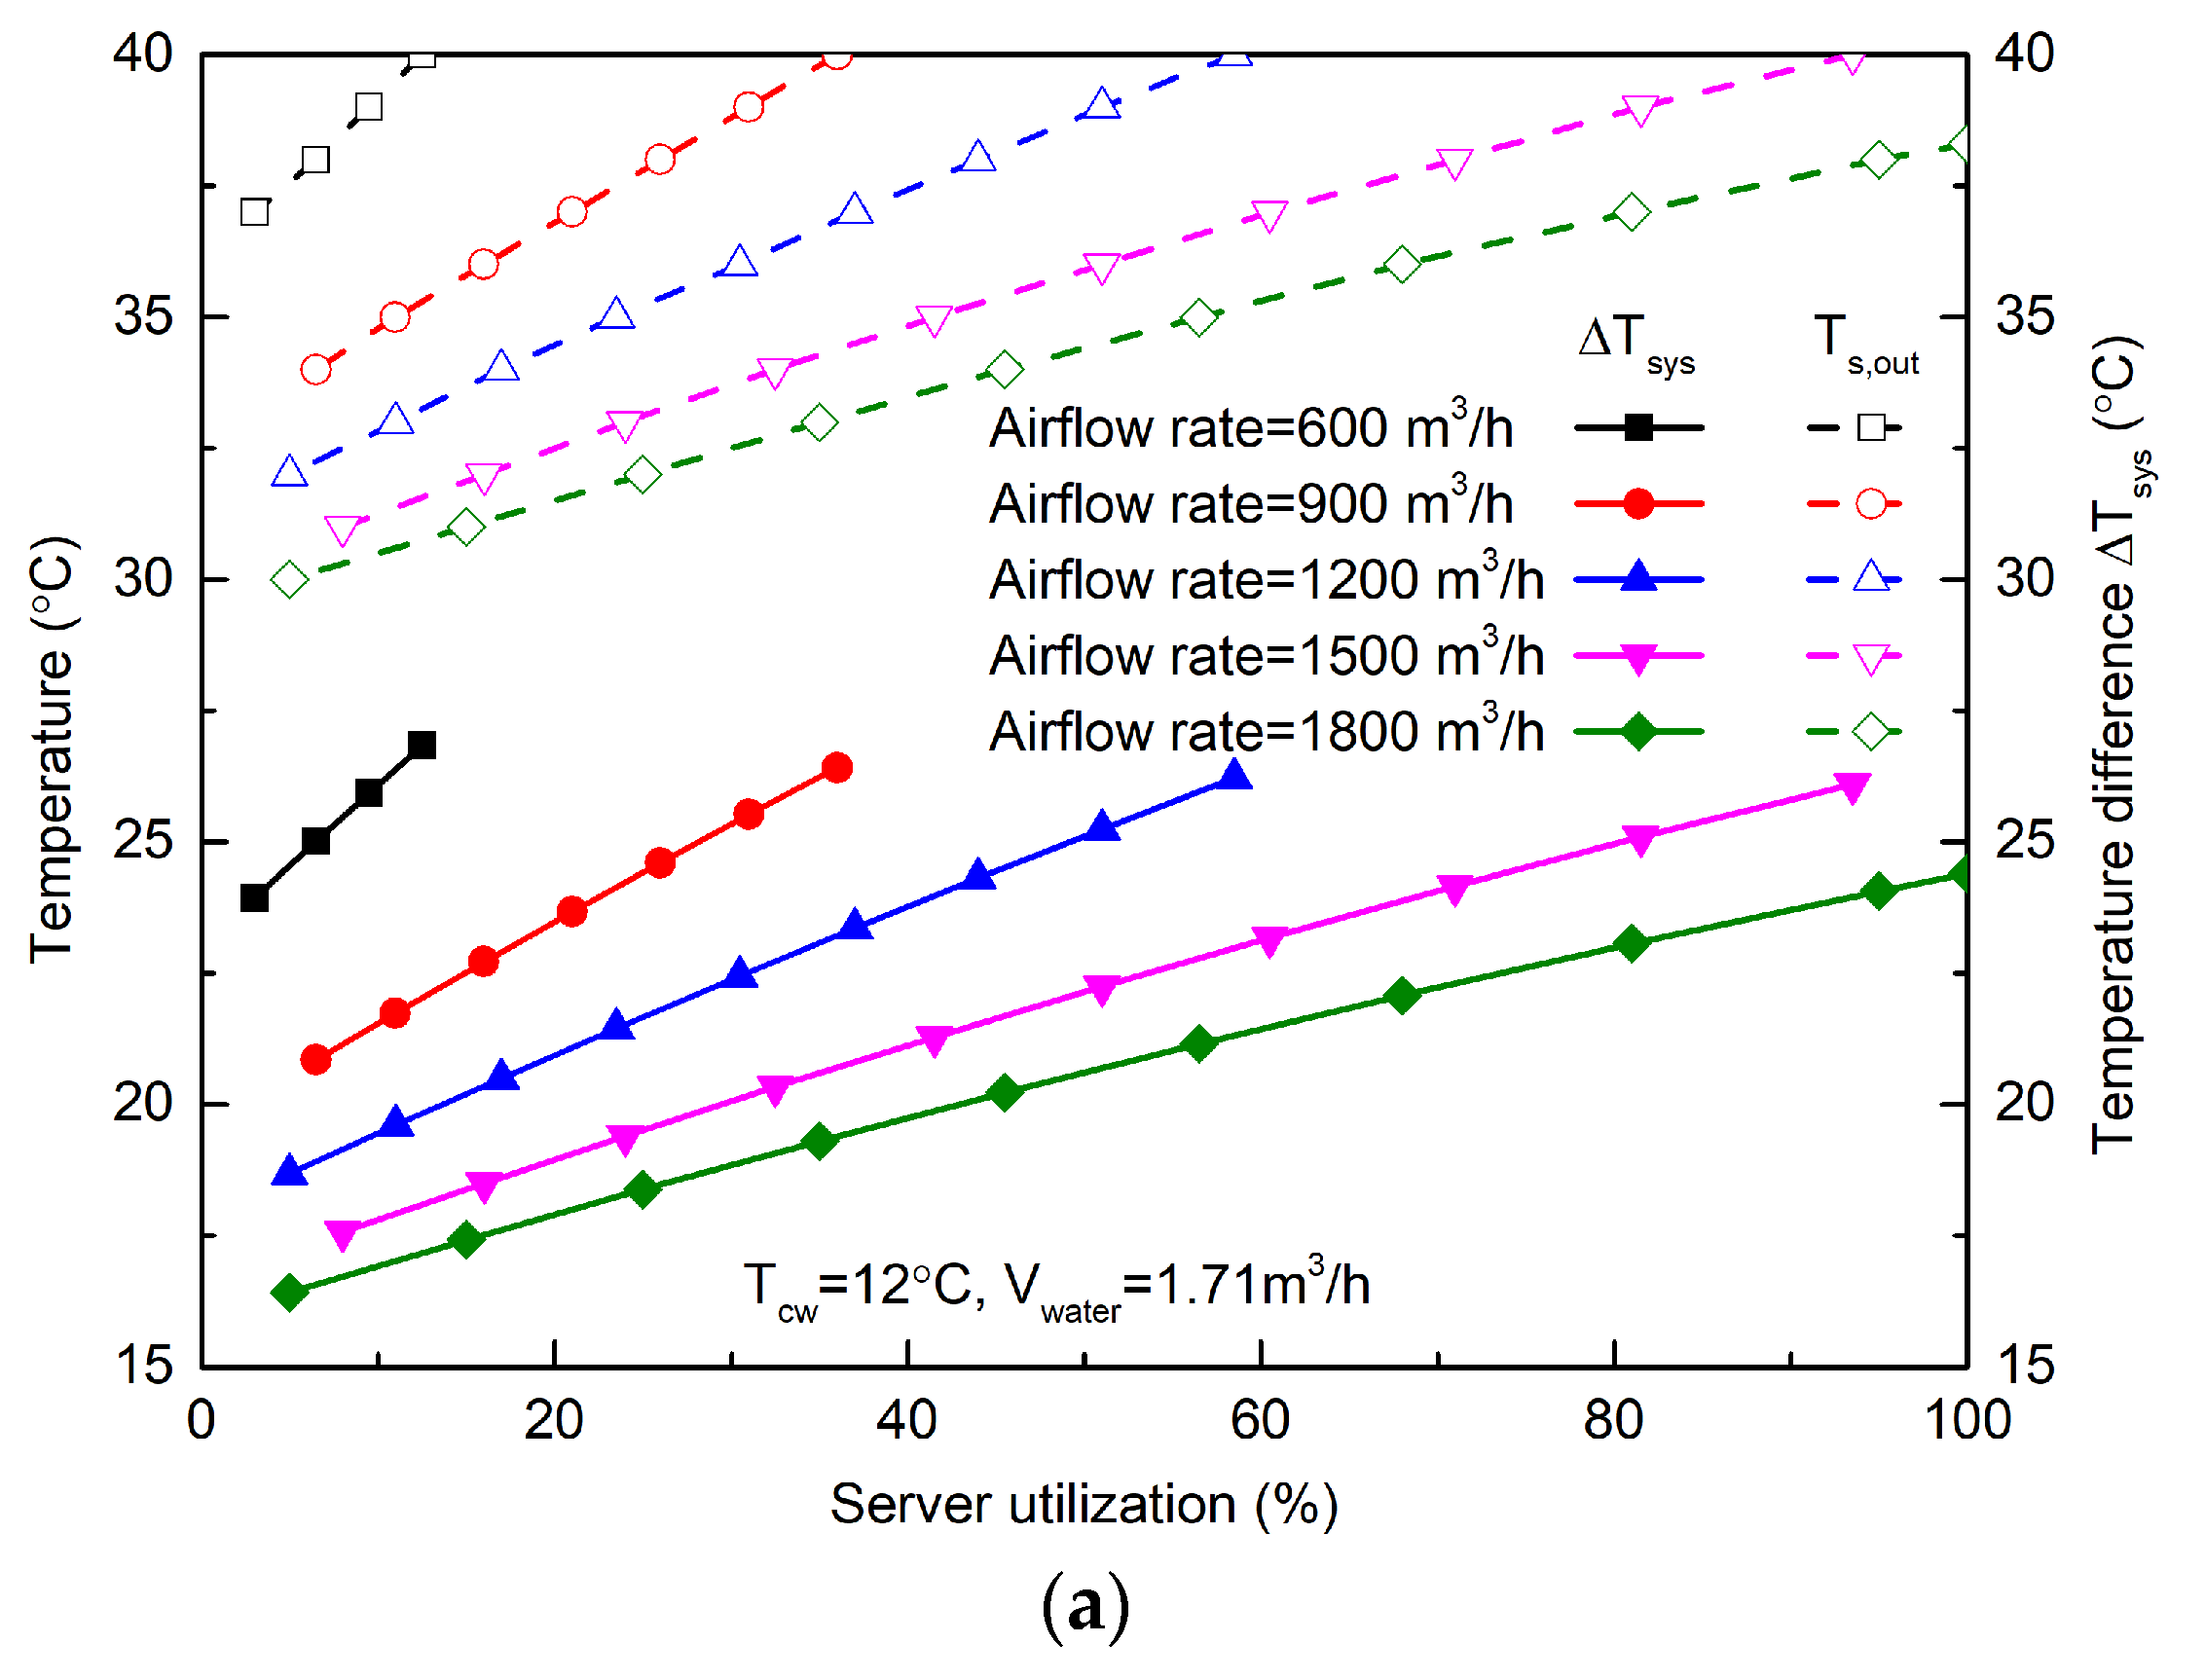
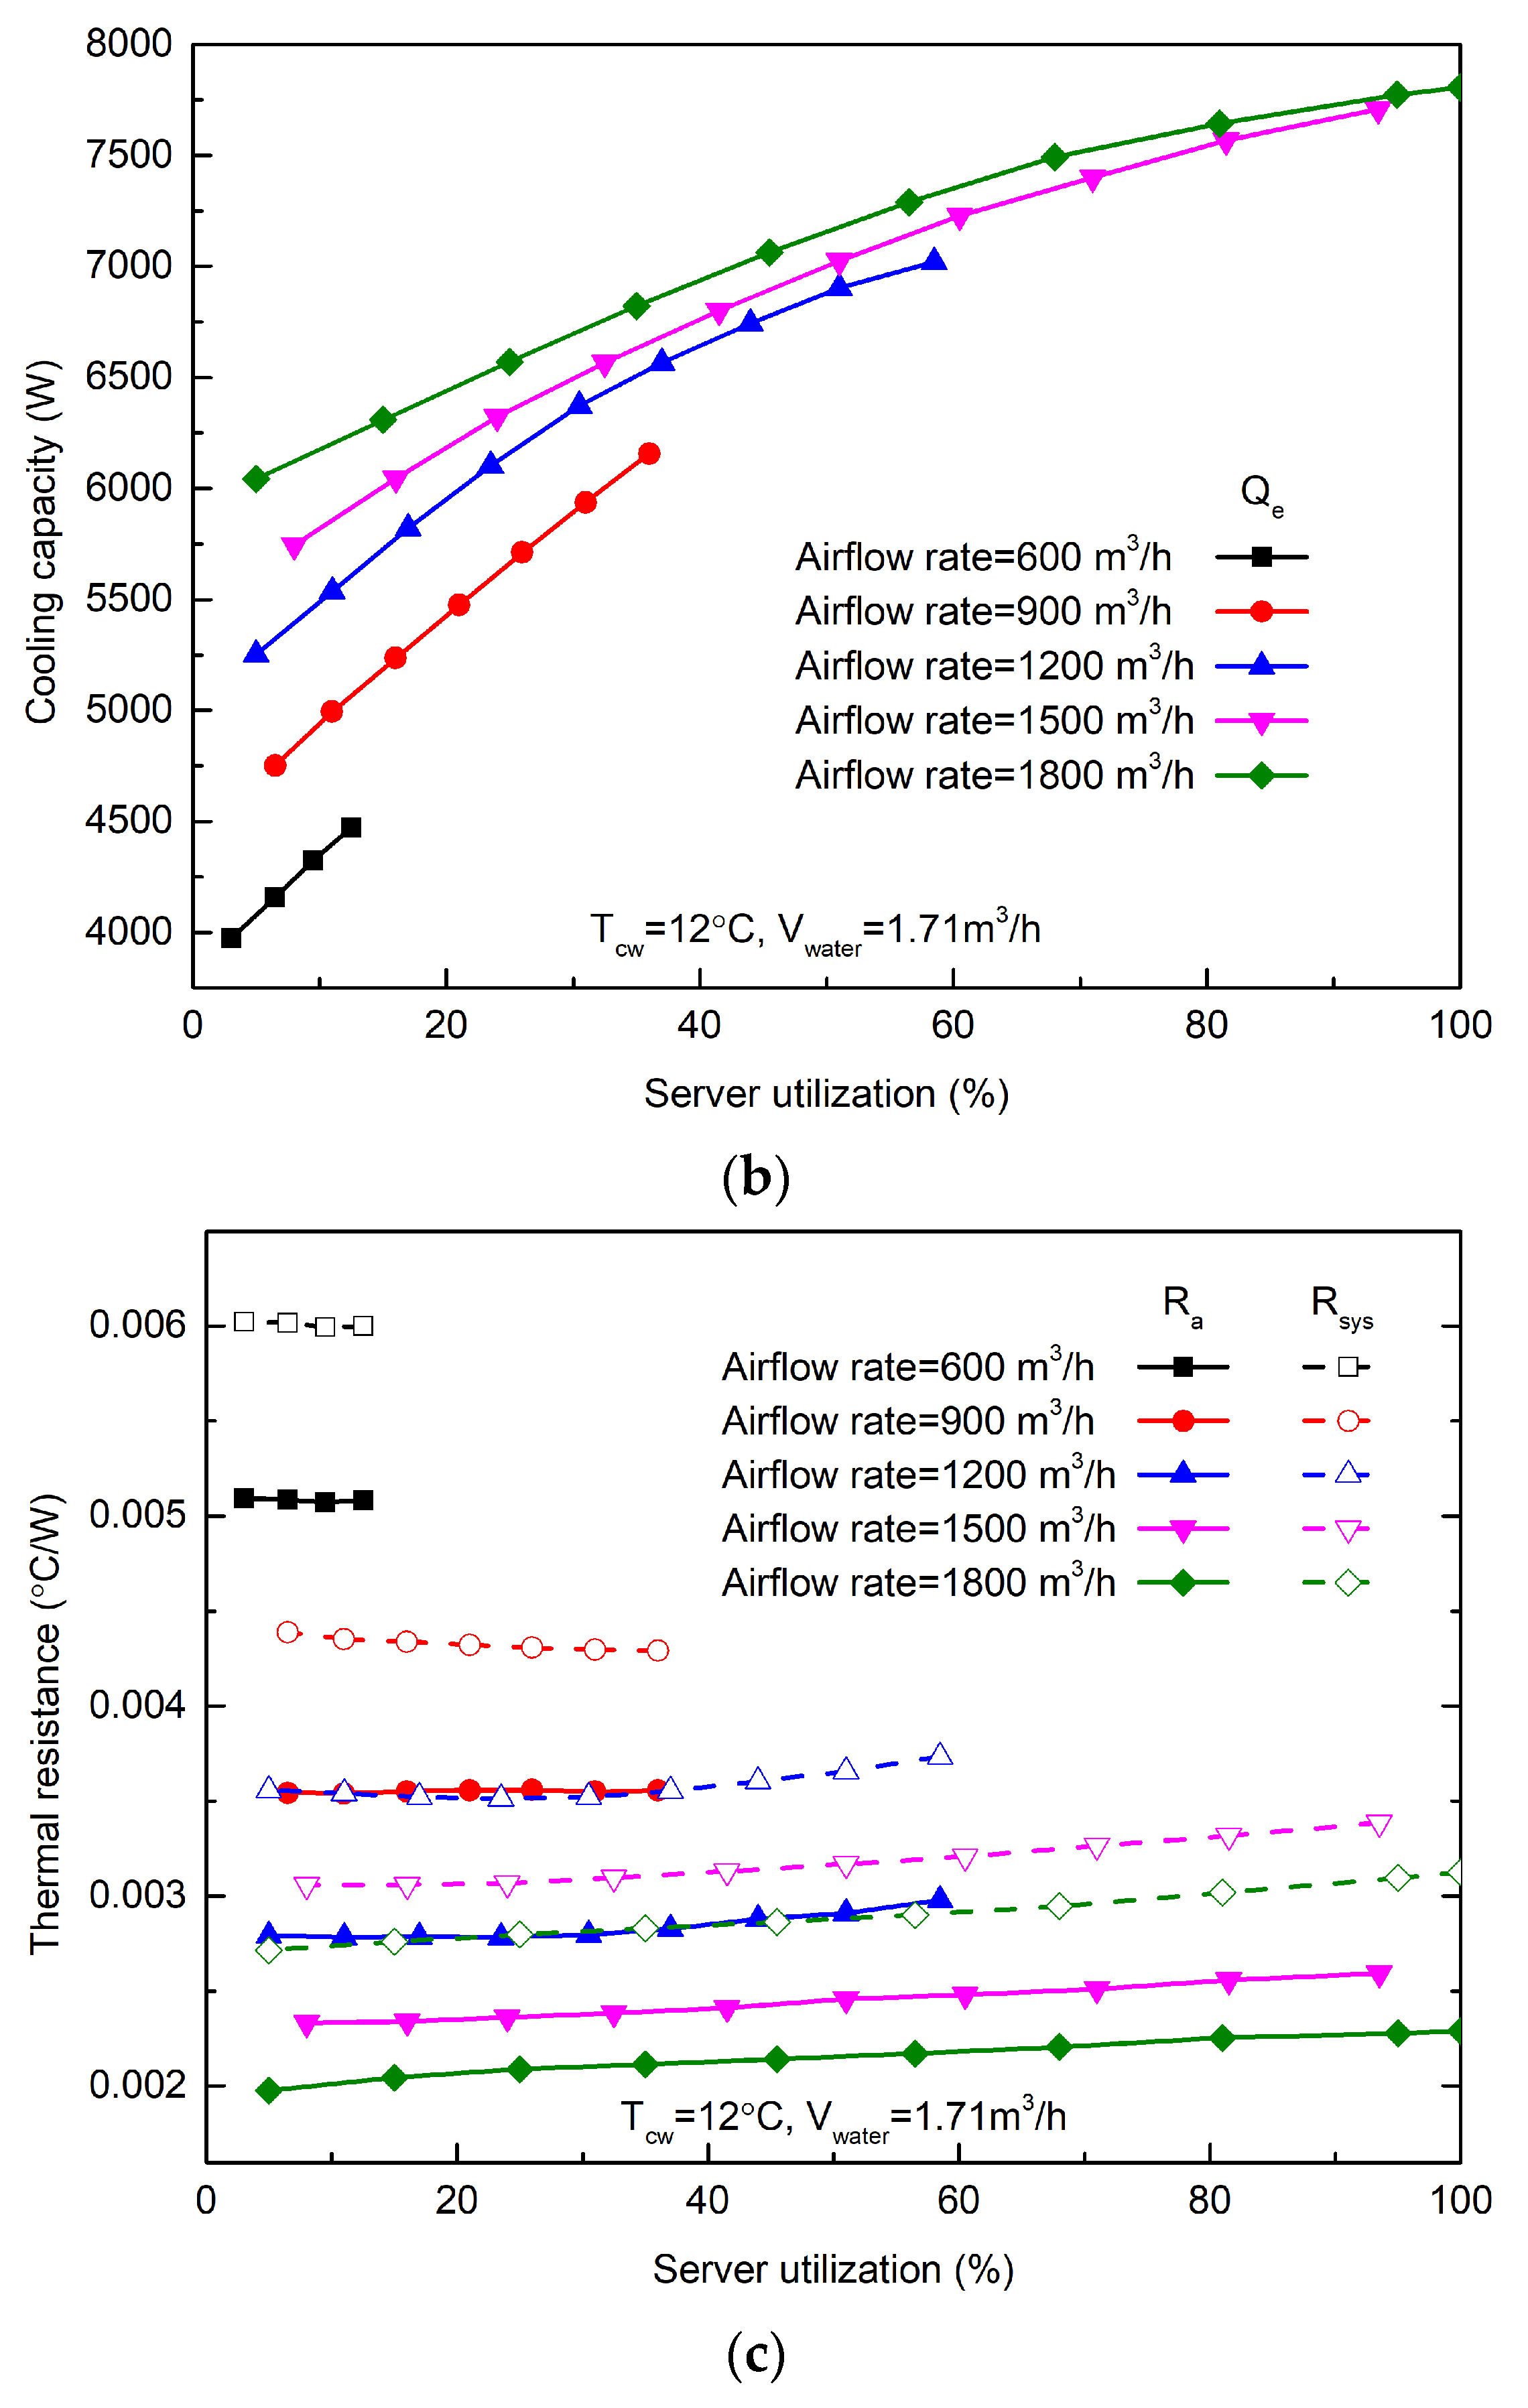
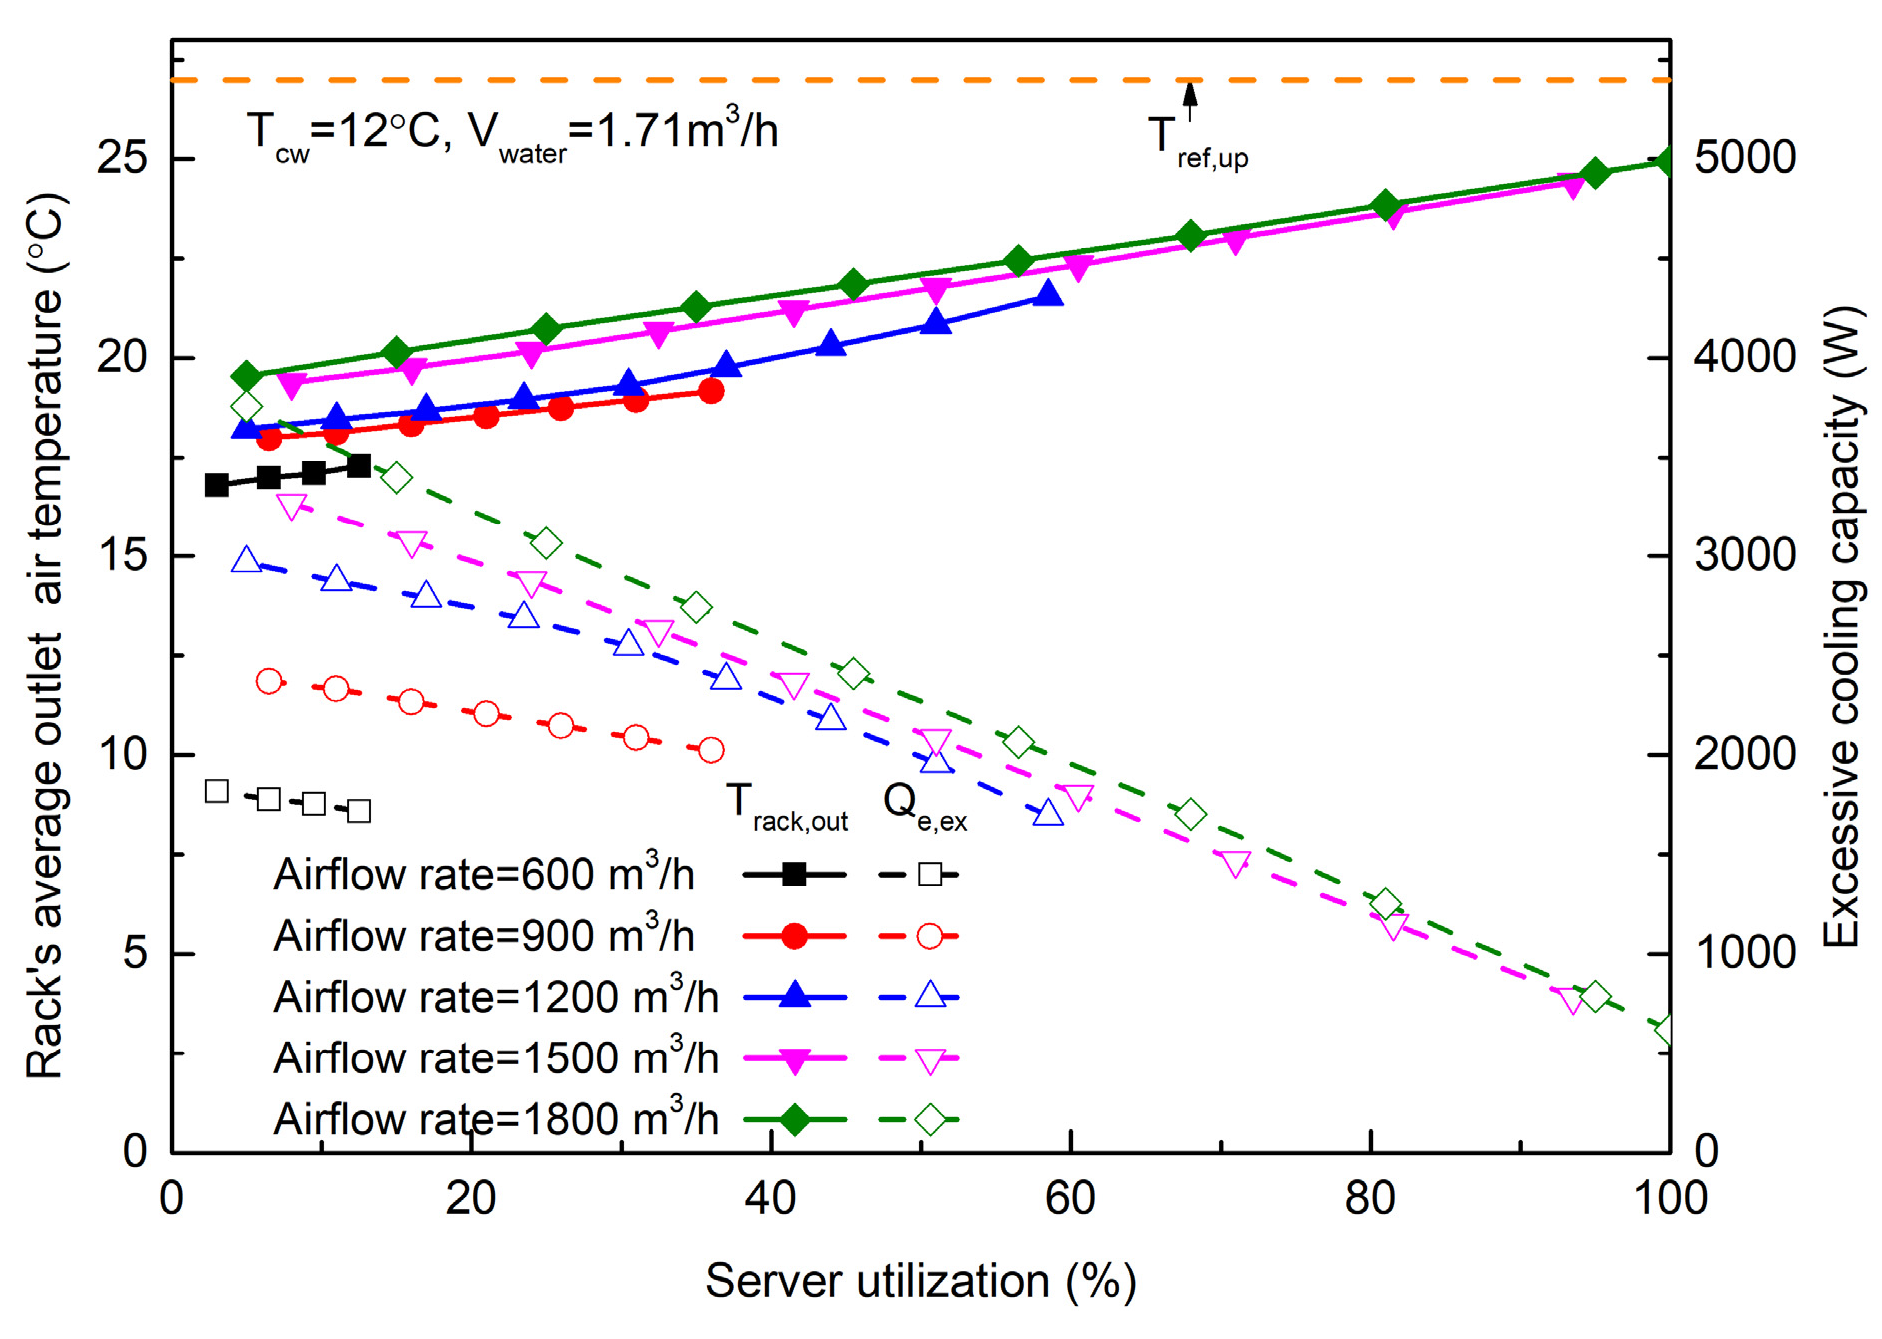
4.2. Effect of Airside Operating Parameter on Thermal Performance

Figure 8 shows the thermal performance under different airflow rates and server utilizations. The system temperature difference ΔTsys under 1800 m3/h and 5% server utilization was 8.6 °C lower than that under 600 m3/h and 6.5% server utilization, but the cooling capacity was more than 45.3% higher (Figure 8a,b). This is because the airside thermal resistance Ra was the dominant part of the total system thermal resistance Rsys, as shown in Figure 8c (the calculation equations of the thermal resistances are shown in Figure 7). When the airflow rate decreased from 1800 m3/h to 600 m3/h, the Ra increased by 157%, resulting in a 122% increase in the Rsys. Under 1800 m3/h, it was also found that the decrements of the Qe caused by server utilization variation were nonlinear (Figure 8b).
Figure 9 shows the rack’s average outlet air temperature and the excessive cooling capacity under different airflow rates and server utilizations. The excessive cooling capacity Qe,ex reflects the cooling capacity supplied by the LTS over the server cooling demand in the rack, which is calculated with:
Q e , e x = Q e P s
Under 5–12.5% server utilization, the Qe,ex reduced by about 52% with the airflow rate, which decreased from 1800 m3/h to 600 m3/h. As shown in Figure 9, the Track,out was below the upper limit reference temperature Tref,up of GB50174-2017 [47], but the Ts,out (Ta,in) reached 40 °C when the server utilization was 12.5% under a 600 m3/h airflow rate (Figure 8a). According to the lectures [25,26], the chip-to-air temperature differences need to be larger than 45 °C under maximum heating loads. Thus, the server exhaust air temperature Ts,out should not exceed 40 °C to keep a chip safe. If the control system further reduces the airflow rate, it increases the risk of server overheating even at a low server utilization. Therefore, the control system should reduce the airflow rate according to the upper limit of the server exhaust air temperature to reduce the excessive cooling capacity under partial server utilization. Keeping the Ts,out lower than 40 °C, the Qe,ex was decreased by 14.5–52.1% with the decrease in airflow rate under 5–56.5% server utilization. It can be found that the lower the server utilization, the greater the effects of decreasing the airflow rate on reducing the Qe,ex (Figure 9).
In summary, the control system can adjust the airflow rate of the LTS according to the upper limit of the server exhaust air temperature to reduce the excessive cooling capacity and help with energy saving. However, it is still difficult to eliminate the cooling capacity oversupply phenomenon by only adjusting the airflow rate under partial sever utilization (Figure 9). It is necessary to further investigate the effects of the water side operating parameters on the thermal performance to reduce the excessive cooling capacity.

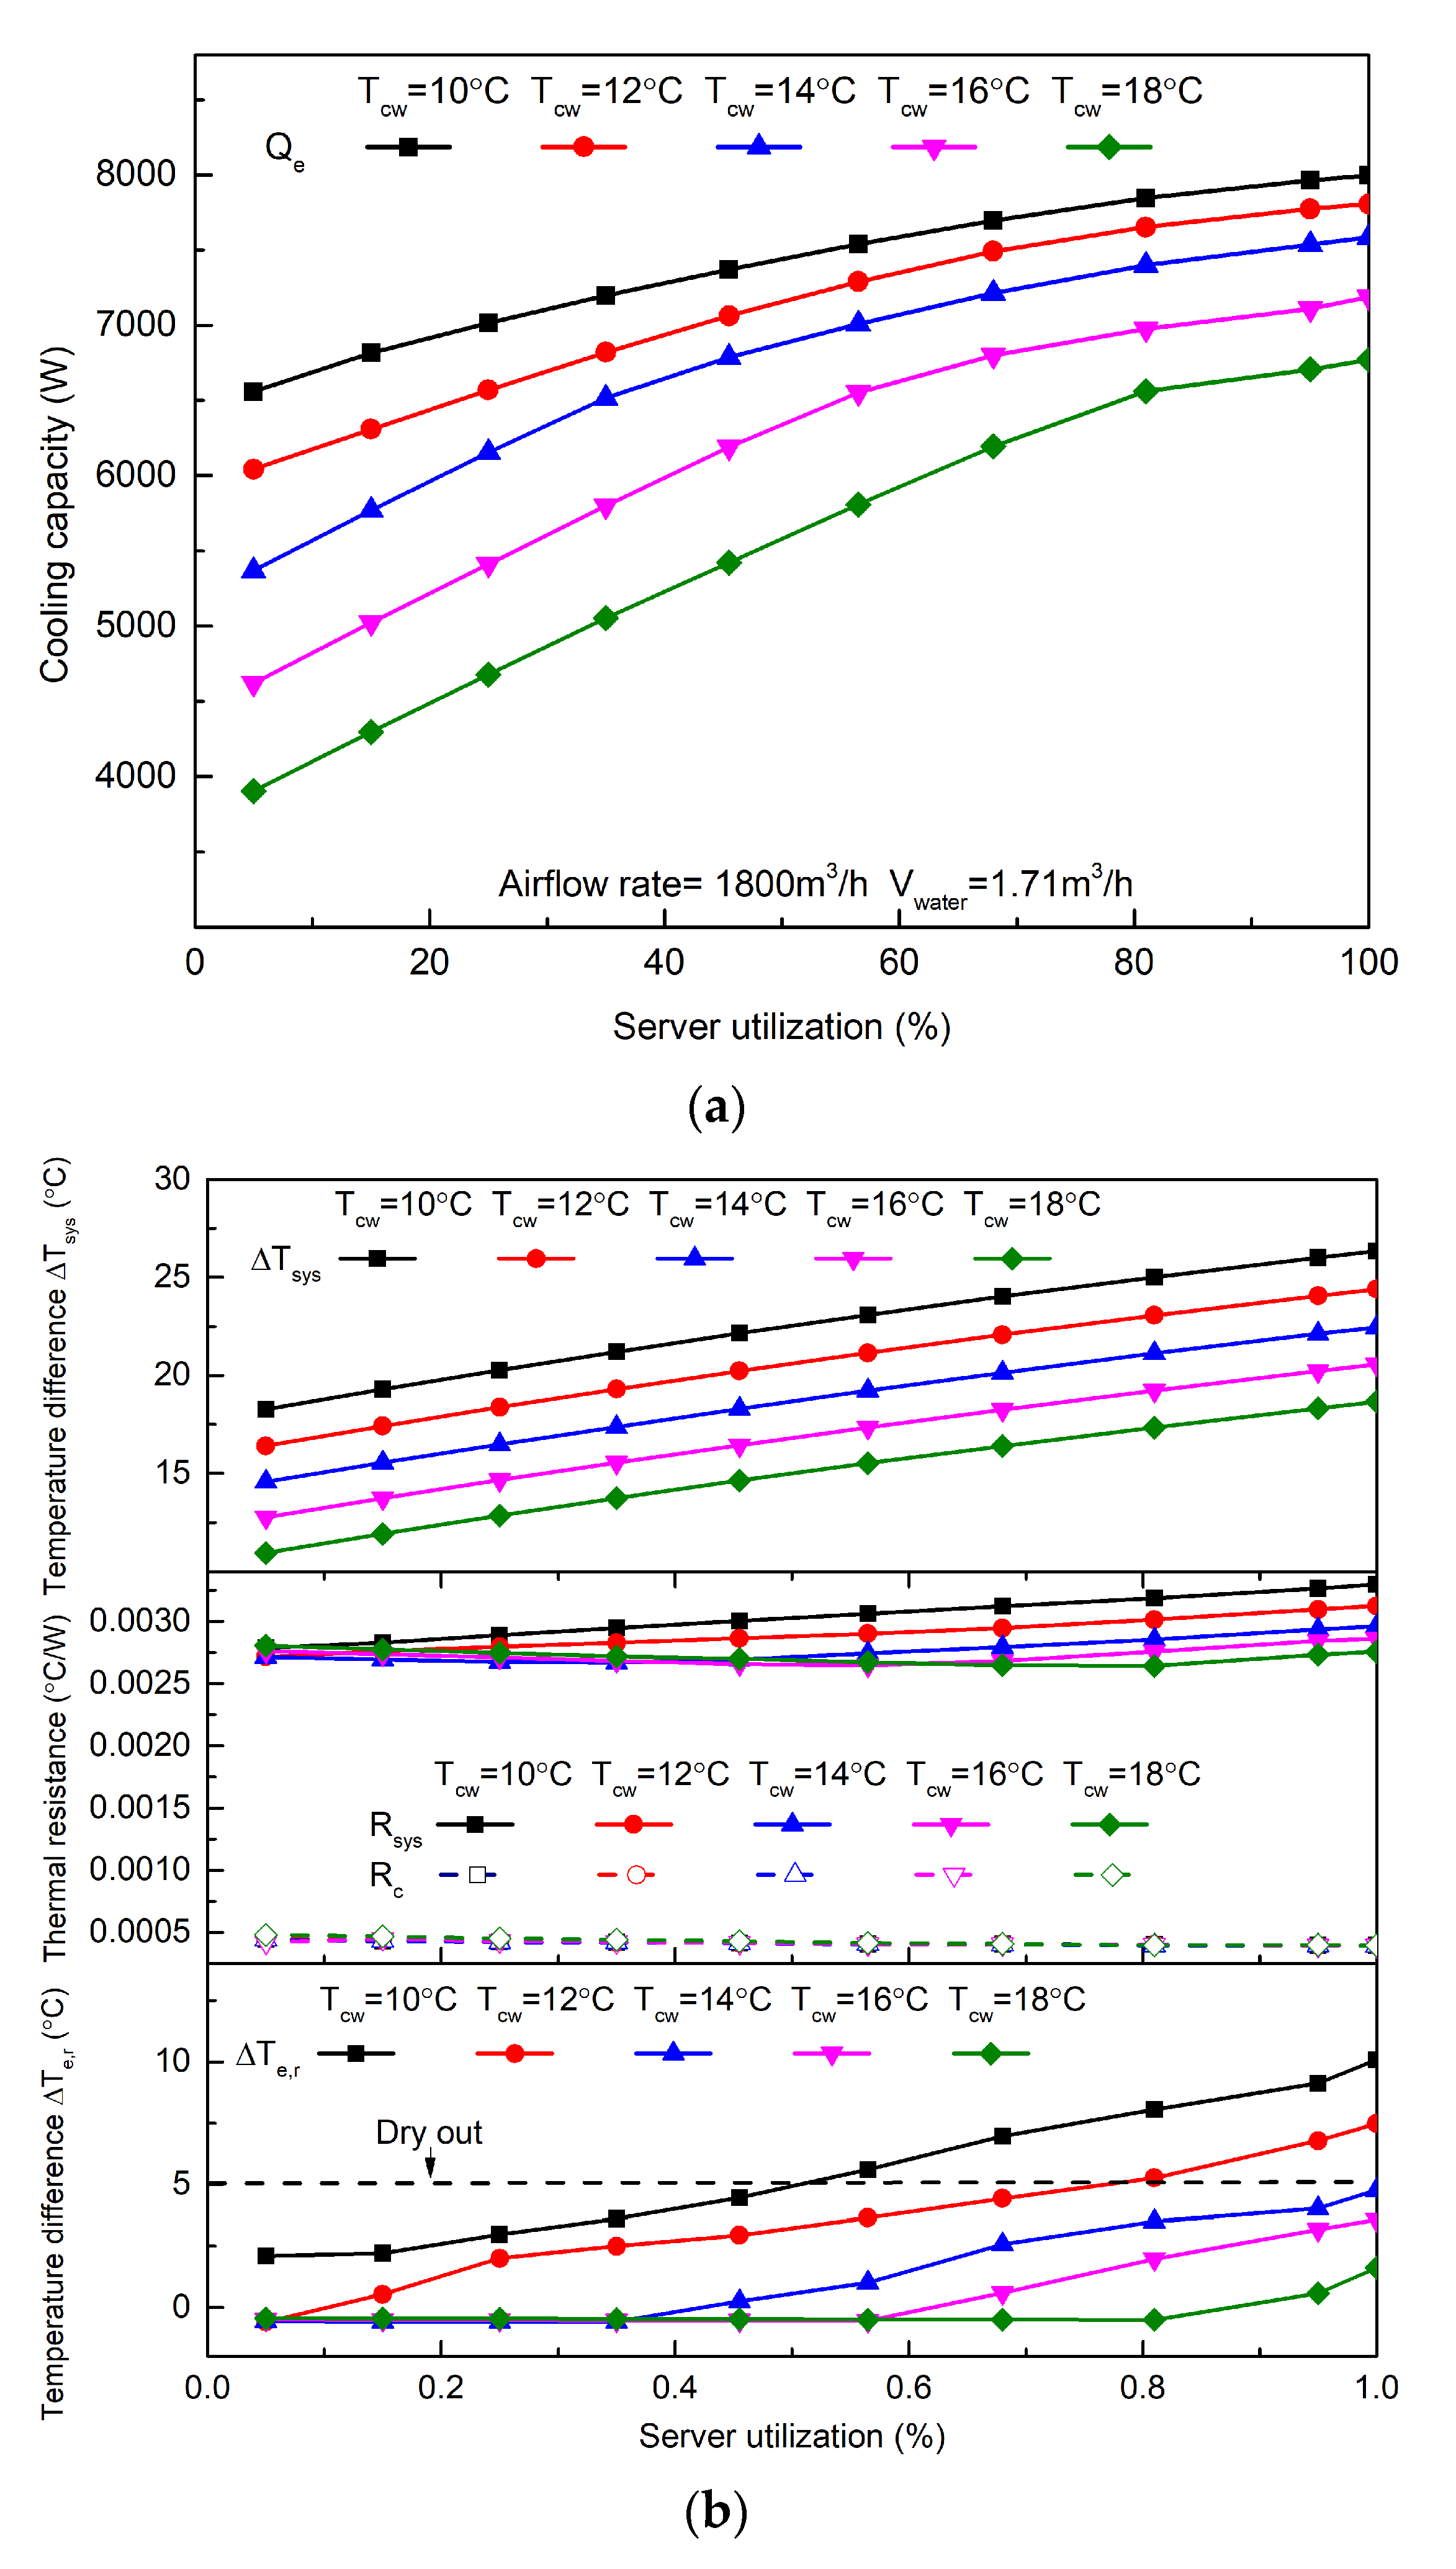
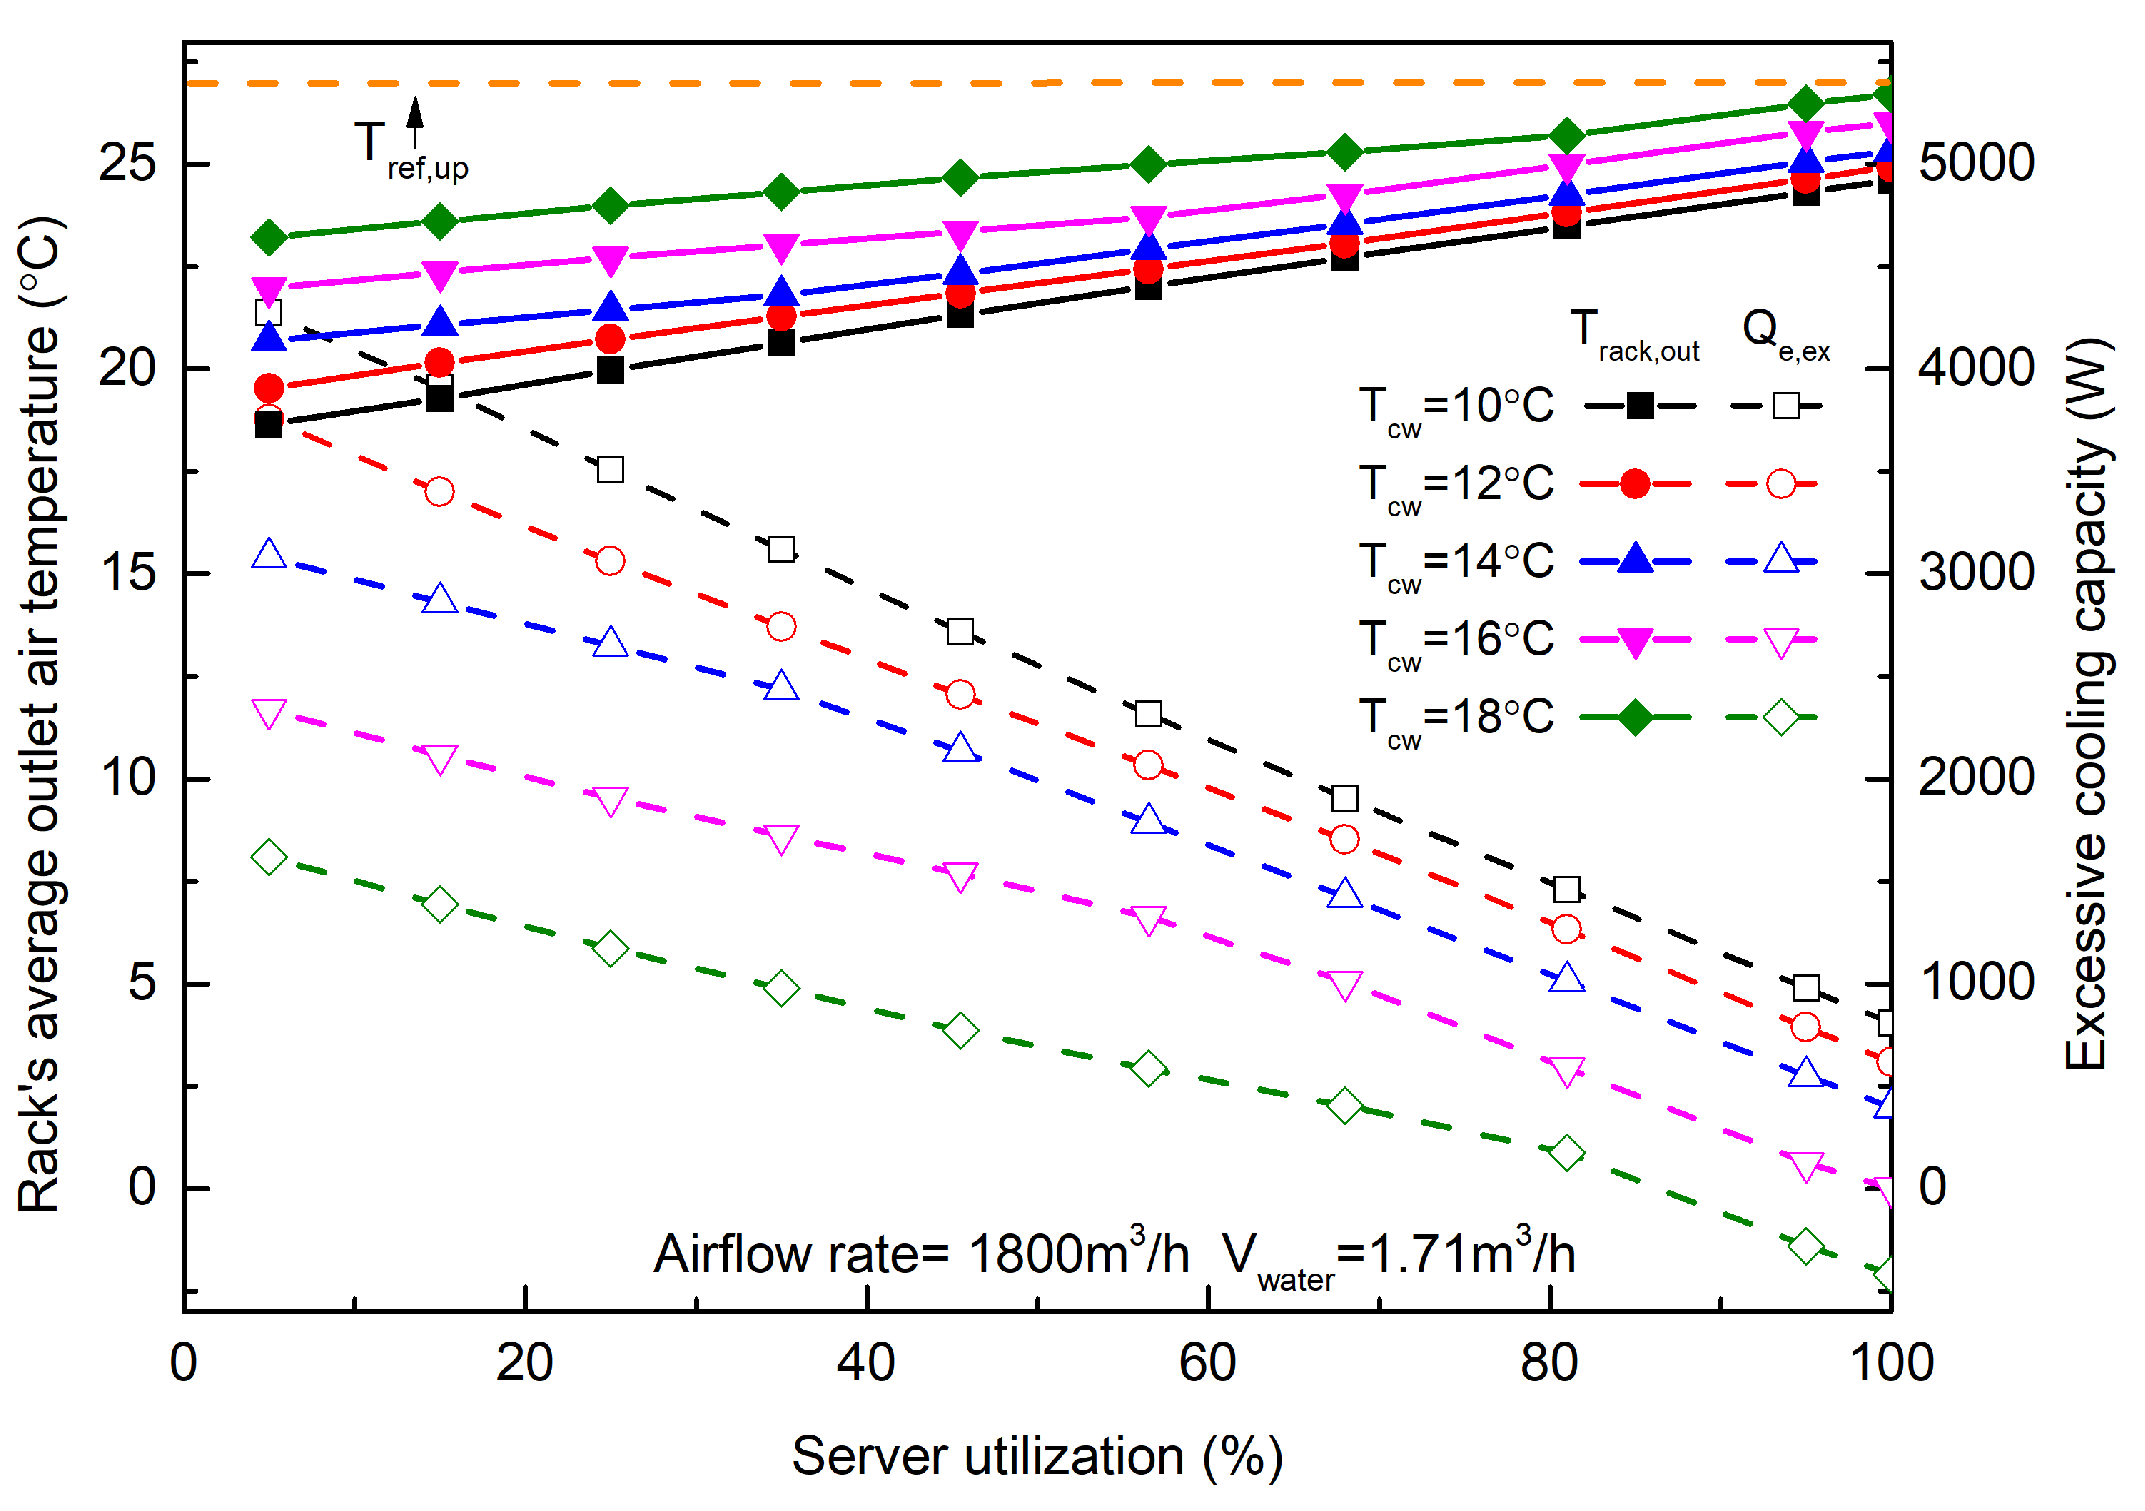
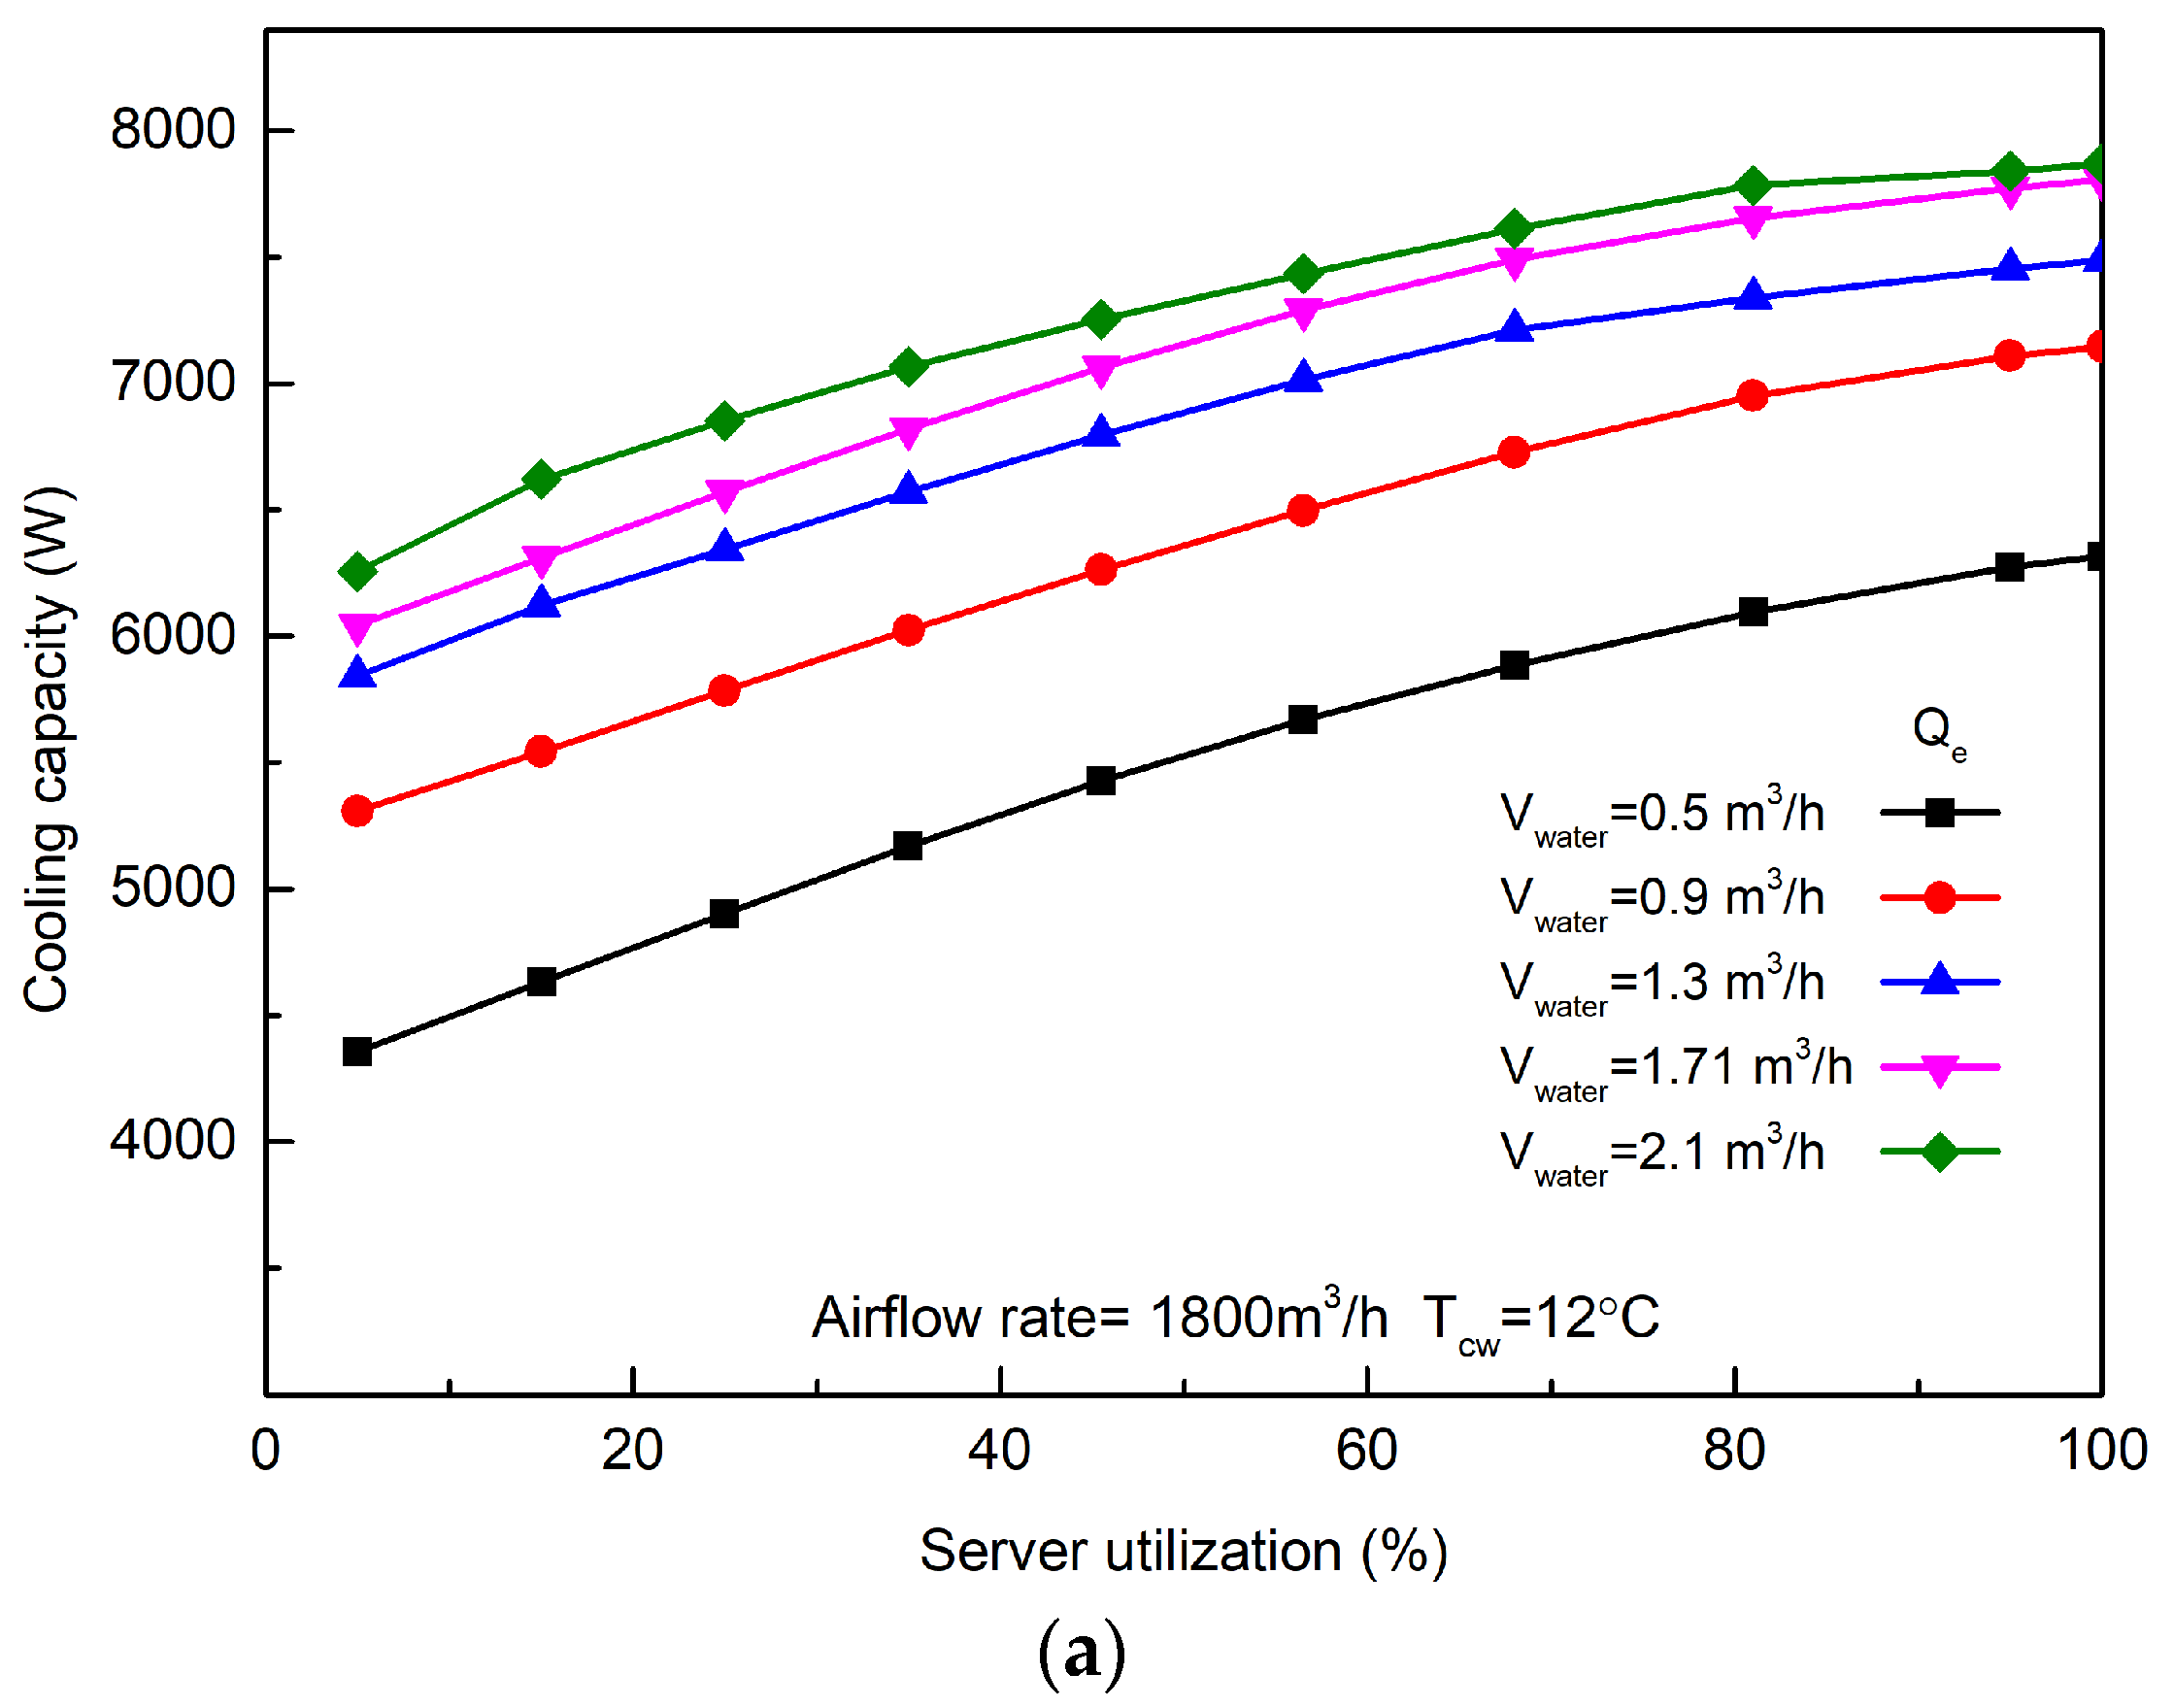
4.3. Effects of Water Side Operating Parameters on Thermal Performance

The energy consumption of chillers, which is the main component of the total energy consumption, is effectively reduced by increasing the temperature of the supply chilled water temperature Tcw. Therefore, the control system can reduce the supply of chilled water temperature to reduce the excessive cooling capacity and the energy consumption of the chillers.
Figure 10 shows the thermal performance under different supply chilled water temperatures and server utilizations. Due to the decrease in the ΔTsys, the cooling capacity decreased when the Tcw increased. Under 5% server utilization, the Qe was 6559 W under 10 °C Tcw, and it decreased by 40.4% when the Tcw increased to 18 °C (Figure 10a). It was also found that even the ΔTsys was similar, and the higher the server utilization, the lower the decrement of the Qe. When the Tcw increased from 10 °C to 18 °C under 100% server utilization, the decrement of Qe was only 15.3%. The influence of the Tcw on the thermal resistance is shown in Figure 10b. The Tcw had less effect on the thermal resistance of the condenser Rc, but the Rsys decreased with the Tcw increasing. The working state of the LTS can be judged with the overheating temperature ΔTe,r, that is, the refrigerant outlet temperature minus the refrigerant outlet saturation temperature in the evaporator. When the evaporator is working properly without overheating, the refrigerant inlet saturation temperature should be slightly higher than the outlet temperature due to the pressure drop, and the ΔTe,r ≤ 0. According to the Heat Pipe Qualification Requirements, if the ΔTe,r > 5 °C, the evaporator is considered dried out [48]. Dried out means the absence of a sufficient liquid refrigerant and only vapor-phase heat transfer at the overheating region. It has been pointed out that the optimal refrigerant filling ratio of the LTS should increase with the ΔTsys increasing to prevent the evaporator from overheating when other operating parameters are constant [16]. In this study, the optimal filling ratio was obtained from the experiments carried out under a 1800 m3/h airflow rate, 35 °C Ta,in, 12 °C Tcw, and ΔTsys of 21.2 °C. Since the indoor air temperature was set close to the upper limit of the reference value in the simulation cases, when the server utilization reached 56.5%, the Ta,in and ΔTsys were about 35 °C and 21.2 °C, respectively (Figure 10b). Under 100% server utilization and 10°C Tcw, the ΔTsys and ΔTe,r were 26.4 °C and 10.1 °C, respectively, which showed that the LTS was not operating at the optimal refrigerant filling ratio, and the evaporator was seriously dried out. There was a large vapor-phase region at the top of the evaporator, resulting in an increase in the Re. When the Tcw increased from 10 °C to 18 °C, the evaporation rate of the refrigerant decreased with the ΔTsys and Qe decreasing, and the LTS operated again at the optimal refrigerant filling ratio. More liquid refrigerants re-entered the overheating region, thus decreasing the ΔTe,r and Re. This explained why the decrements of the Qe decreased with the server utilization increasing when the Tcw increased.
Figure 11 shows the rack’s average outlet air temperature and the excessive cooling capacity under different supply chilled water temperatures and server utilizations. When the Tcw increased from 10 °C to 18 °C, the Qe,ex dropped by more than 62.1%, which indicates that the cooling efficiency improved. The lower the server utilization, the greater the effects of decreasing the supply chilled water temperature on reducing the excessive cooling capacity, and the Track,out was still lower than the upper limit reference temperature under 5–100% server utilization. It is worth noting that the Qe,ex < 0 when the Tcw increased to 18 °C under 95–100% server utilization. If the supply chilled water temperature is adjusted too high, the cooling capacity is less than the rack’s heat load; thus, it will cause a thermal risk to the data center. Therefore, the water flow rate needed to be adjusted according to the upper limit of the Track,out to maintain the thermal security of the data center.
In addition, the ΔTsys also can be reduced by decreasing the chilled water flow rates Vwater, as shown in Figure 12a. Under 5–100% server utilization, when the Vwater decreased from 2.1 m3/h to 0.5 m3/h, the ΔTsys decreased by 14.8–15.5%, but the Qe decreased by more than 19.2%. This is because the water side heat transfer coefficient decreased as the water flow rate decreased. Under 2.1 m3/h Vwater, the Rc remained in the range of 0.00037–0.00041 °C/W, and they increased by more than 134.7% when Vwater decreased by 1.6 m3/h (Figure 12b). In addition, the ΔTe,r decreased when Vwater decreased, which caused the increments of the Rsys to decrease with the increase in server utilization when the Vwater decreased.
Figure 13 shows the rack’s average outlet air temperature under different water flow rates and server utilizations. When the Vwater decreased from 2.1 m3/h to 0.9 m3/h, the Qe,ex reduced by more than 23.8% under partial server utilization, while the Track,out was lower than the upper limit reference temperature. It is worth noting that the Track,out exceeded the Tref,up under 0.5 m3/h Vwater and 95–100% server utilization, which will affect the thermal safety of the data center. In order to ensure thermal security, the water flow rate should be adjusted according to the upper limit of the Track,out.
In conclusion, the control system can adjust the water side operating parameters according to the upper limit of the rack’s average outlet air temperature to reduce the excessive cooling capacity of the LTS, which is difficult to deal with by only adjusting the airflow rate.

5. Conclusions

The operating parameters of the water-cooled LTS were designed according to the cooling demands of the rack under a full heating load, but most racks are operated under a low heating load for a long time, thus resulting in energy waste. In order to improve the cooling efficiency under partial server utilization while ensuring thermal safety, a water-cooled LTS was experimentally investigated under different airflow rates and heating loads. Then, a related steady-state distributed-parameter model was developed; the mean absolute deviations between the experimental and prediction results were less than 5.2%. Based on the developed model, the effects of the operating parameters (including the airflow rate, supply chilled water temperature, and chilled water flow rate) on the thermal safety and cooling efficiency were numerically investigated. The main results are concluded as follows:
  • When the airflow rate and heating load decreased, the effective refrigerant mass flow rate was significantly lower than the measured refrigerant mass flow rate. The additional liquid refrigerant reduced the heat transfer performance of the LTS and aggravated a drop in cooling capacity. However, the LTS can still ensure the thermal safety of the data center under low airflow rates and partial server heating loads.
  • The airflow rate of the LTS could be adjusted according to the upper limit of the server exhaust air temperature to accurately reduce the excessive cooling capacity under partial server utilization. The excessive cooling capacity was reduced by 14.5–52.1% with a decrease in the airflow rate under 5–56.5% server utilizations.
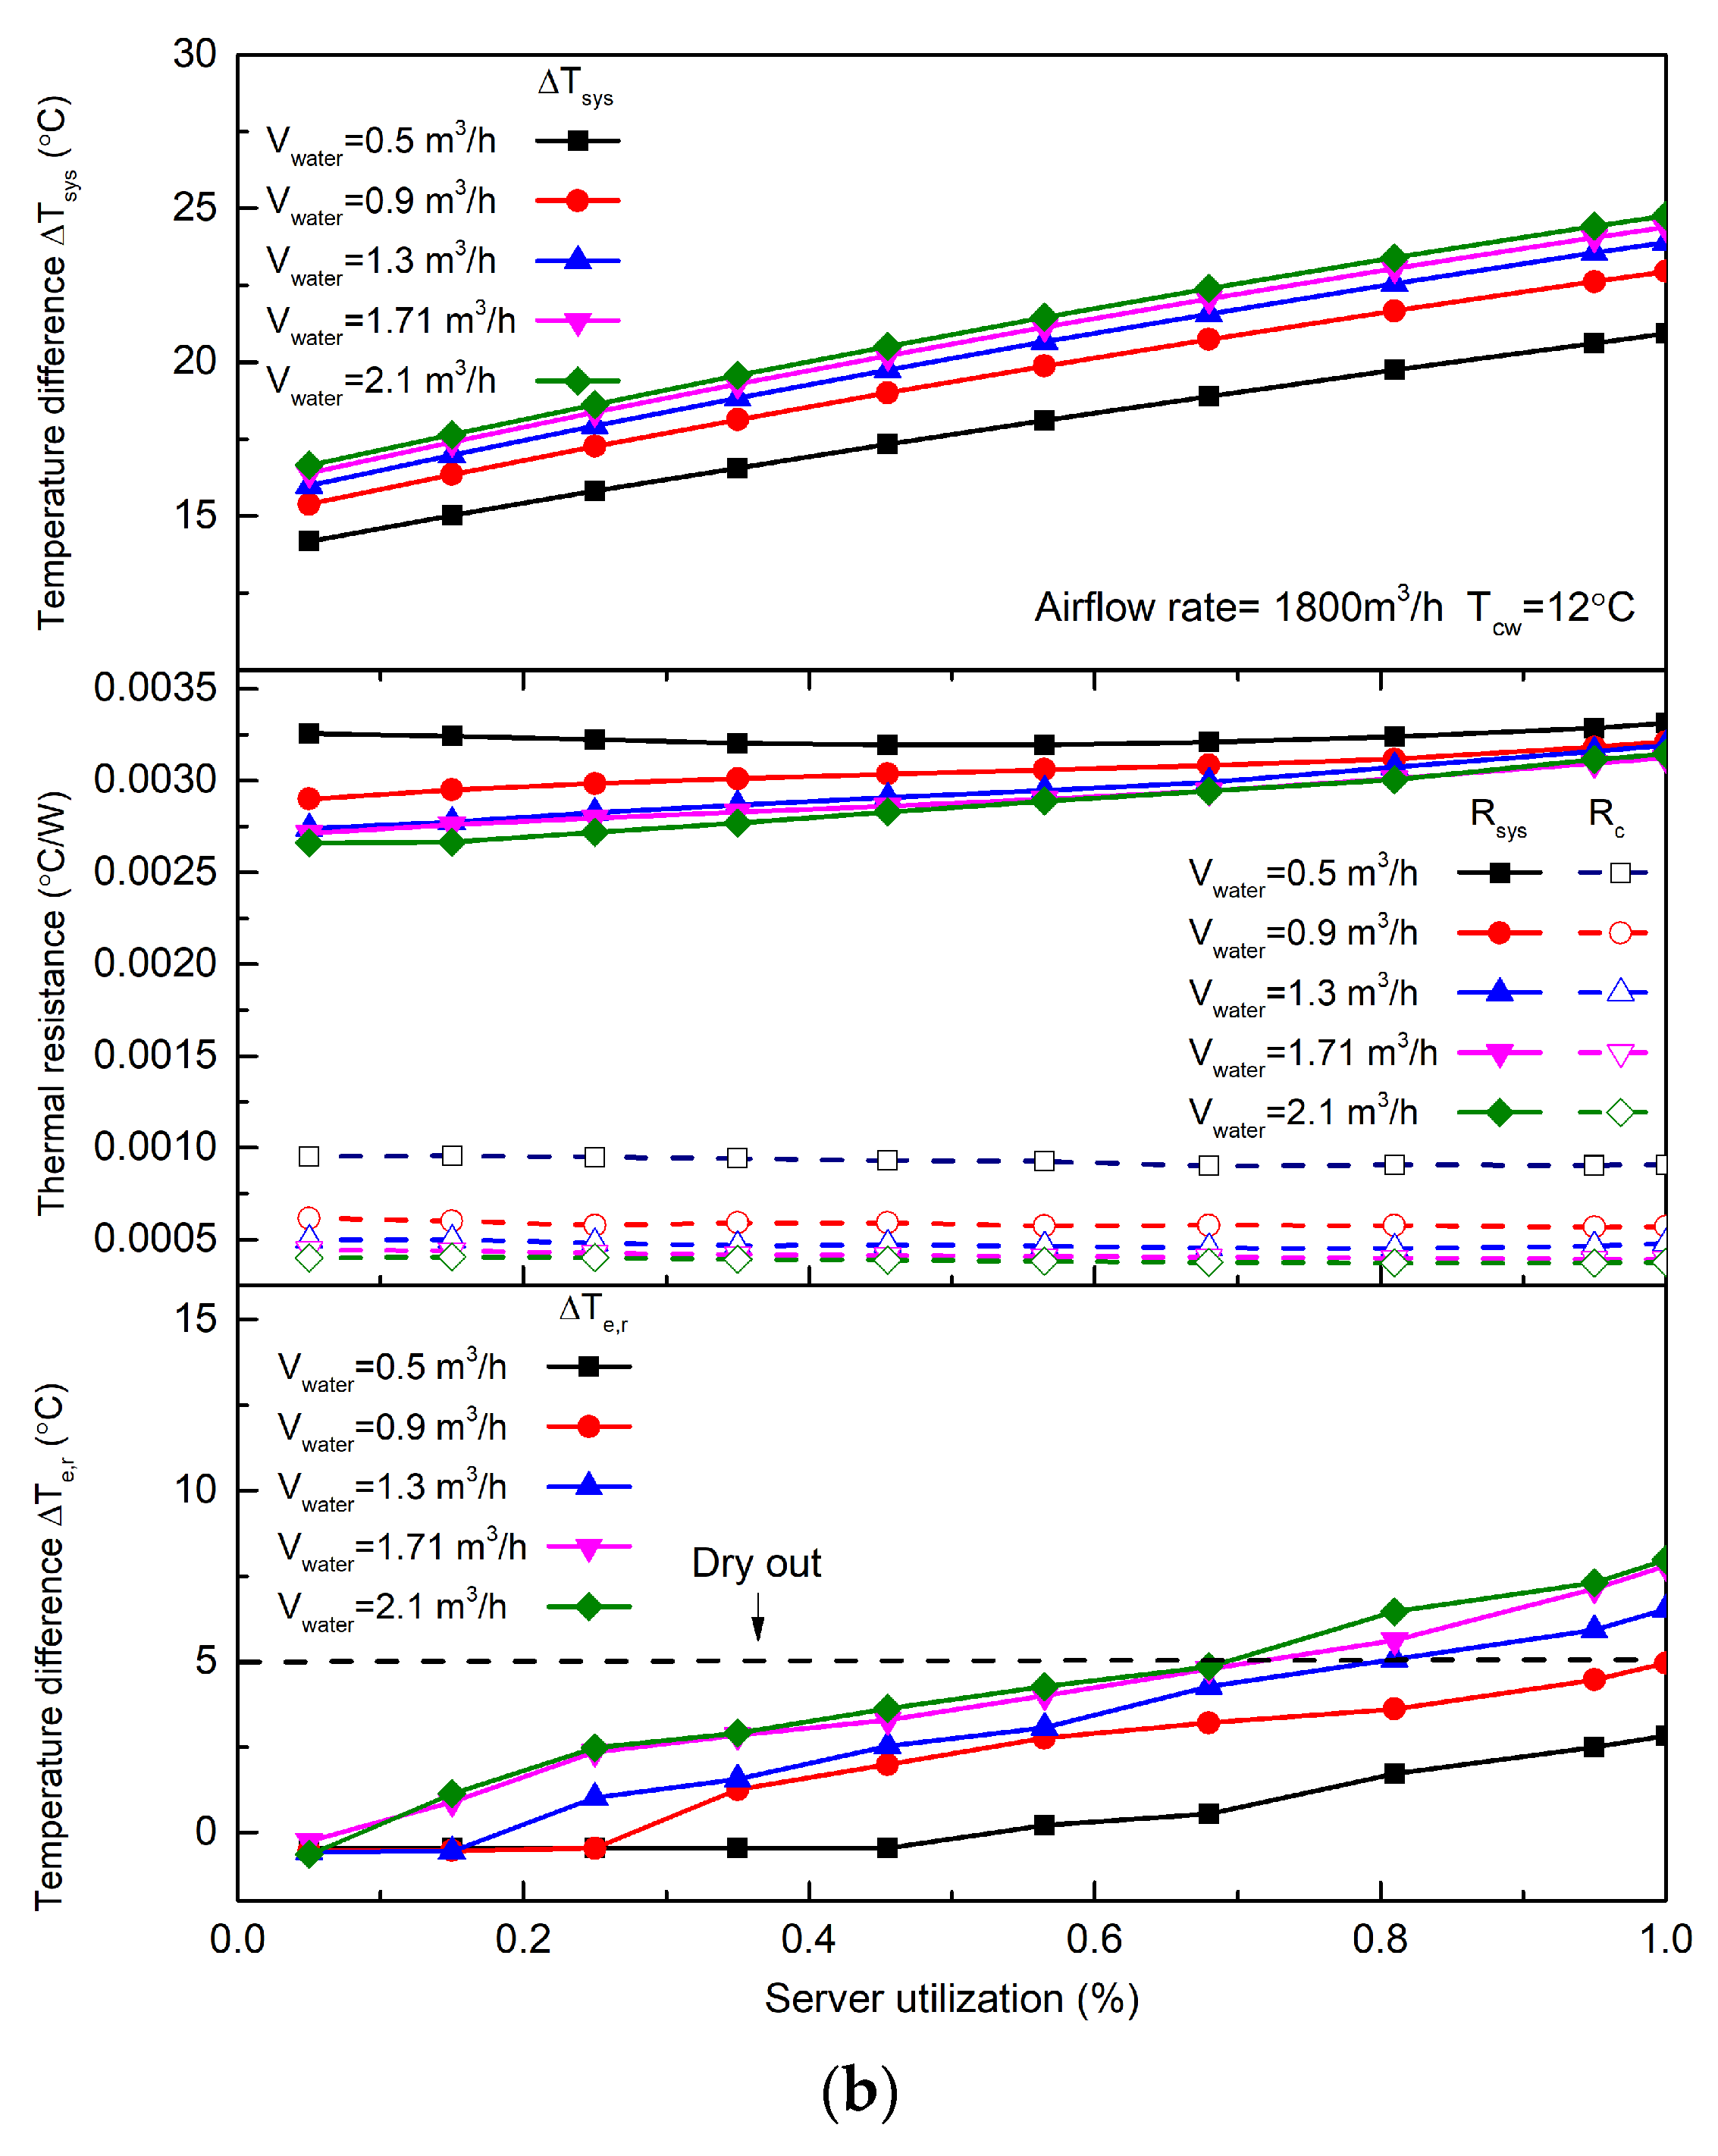
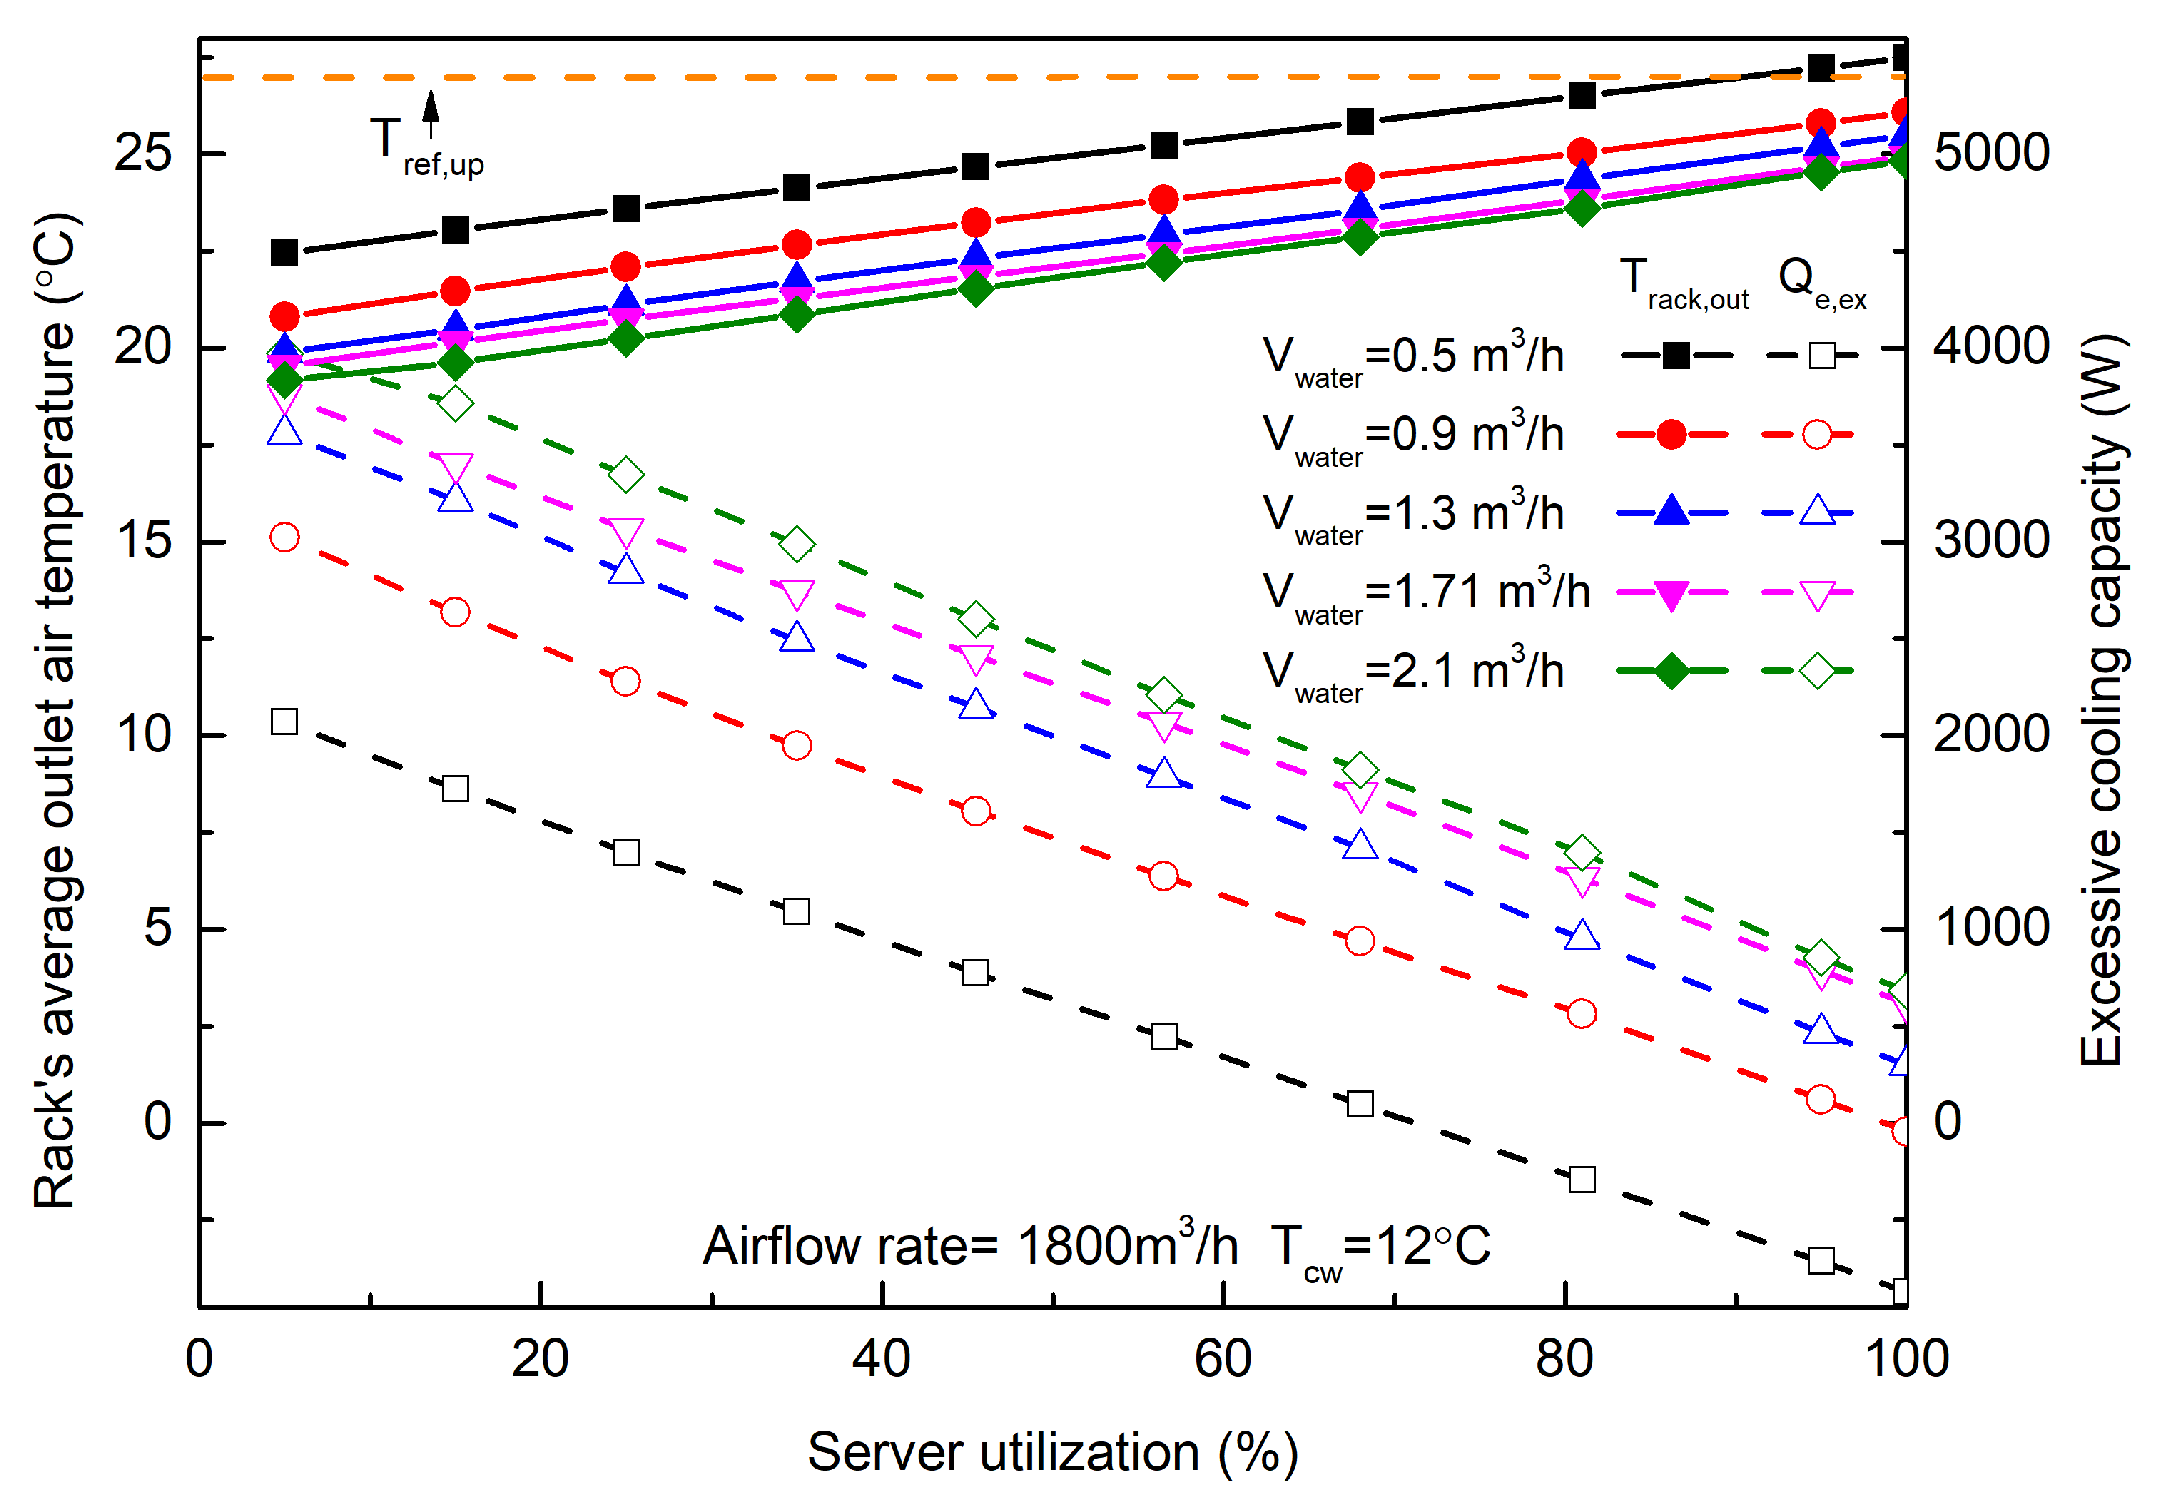
  • Under partial server utilization, the water side operating parameters could be adjusted according to the upper limit of the rack’s average outlet air temperature to reduce the excessive cooling capacity. Increasing the supply chilled water temperature from 10 °C to 18 °C or decreasing the water flow rate from 2.1 m3/h to 0.9 m3/h reduced more than 23.8% of the excessive cooling capacity.

Further Study

  • In this study, several suggestions for operating parameters optimization were put forward to reduce the excessive cooling capacity of the LTS and ensure thermal security of the data center. However, the specific energy-saving effects of these suggestions have not been studied, and further research is required.
  • To reduce the excessive cooling capacity and ensure thermal safety, multiple operating parameters need to be adjusted quickly and precisely by the control system, which involves a multi-objective multi-parameter optimization problem. Therefore, the use of artificial intelligence or machine learning methods to solve this problem quickly deserves further research.

Author Contributions

Conceptualization, S.Z. and C.Y.; methodology, S.Z.; software, C.Y.; validation, S.Z.; formal analysis, S.Z. and Y.W.; investigation, S.Z., T.X. and X.M.; resources, S.Z. and C.Y.; data curation, S.Z.; writing—original draft preparation, S.Z.; writing—review and editing, S.Z.; visualization, S.Z.; supervision, S.Z. and C.Y.; project administration, S.Z.; funding acquisition, S.Z. All authors have read and agreed to the published version of the manuscript.

Funding

This research was funded by the National Natural Science Found of China, grant number 52208136; Jiangxi Provincial Natural Science Foundation, grant number 20232BAB214070; the Science and Technology Research Project of Education Department of Jiangxi Province, grant number GJJ2200683.

Institutional Review Board Statement

Not applicable.

Informed Consent Statement

Not applicable.

Data Availability Statement

Data will be made available on request.

Conflicts of Interest

The authors declare no conflict of interest.

References

  1. Zhang, W.; Zhang, S.; Wang, X.; Qiao, J.; Zhang, J.; Kong, W. Lighting up the Green Cloud: A Study on Energy Consumption and Renewable Energy Usage Potential of Data Centers in China; North China Electric Power University: Beijing, China, 2019. [Google Scholar]
  2. Nadjahi, C.; Louahlia, H.; Lemasson, S. A review of thermal management and innovative cooling strategies for data center. Sustain. Comput. Inform. Syst. 2018, 19, 14–28. [Google Scholar] [CrossRef]
  3. Ham, S.-W.; Kim, M.-H.; Choi, B.-N.; Jeong, J.-W. Simplified server model to simulate data center cooling energy consumption. Energy Build. 2015, 86, 328–339. [Google Scholar] [CrossRef]
  4. Zhang, Y.; Zhao, Y.; Dai, S.; Nie, B.; Ma, H.; Li, J.; Miao, Q.; Jin, Y.; Tan, L.; Ding, Y. Cooling technologies for data centres and telecommunication base stations—A comprehensive review. J. Clean. Prod. 2022, 334, 130280. [Google Scholar] [CrossRef]
  5. Chen, Y.; Zhang, Y.; Meng, Q. Study of ventilation cooling technology for telecommunication base stations in Guangzhou. Energy Build. 2009, 41, 738–744. [Google Scholar] [CrossRef]
  6. Bao, L.; Wang, J.; Kang, L. The applied effect analysis of heat exchanger installed in a typical communication base station in Beijing of China. Energy Procedia 2012, 14, 620–625. [Google Scholar] [CrossRef]
  7. Clidaras, J.; Stiver, D.W. Water-Based Data Center. U.S. Patent 07525207B2, 28 April 2009. [Google Scholar]
  8. Habibi Khalaj, A.; Scherer, T.K.; Halgamuge, S. Energy, environmental and economical saving potential of data centers with various economizers across Australia. Appl. Energy 2016, 183, 1528–1549. [Google Scholar] [CrossRef]
  9. Díaz, A.J.; Cáceres, R.; Torres, R.; Cardemil, J.M.; Silva-Llanca, L. Effect of climate conditions on the thermodynamic performance of a data center cooling system under water-side economization. Energy Build. 2020, 208, 109634. [Google Scholar] [CrossRef]
  10. Lu, H.; Zhang, Z.; Yang, L. A review on airflow distribution and management in data center. Energy Build. 2018, 179, 264–277. [Google Scholar] [CrossRef]
  11. Tatchell-Evans, M.; Kapur, N.; Summers, J.; Thompson, H.; Oldham, D. An experimental and theoretical investigation of the extent of bypass air within data centres employing aisle containment, and its impact on power consumption. Appl. Energy 2017, 186, 457–469. [Google Scholar] [CrossRef]
  12. Jin, C.; Bai, X.; Yang, C. Effects of airflow on the thermal environment and energy efficiency in raised-floor data centers: A review. Sci. Total Environ. 2019, 695, 133801. [Google Scholar] [CrossRef]
  13. Zhang, H.; Shao, S.; Xu, H.; Zou, H.; Tang, M.; Tian, C. Simulation on the performance and free cooling potential of the thermosyphon mode in an integrated system of mechanical refrigeration and thermosyphon. Appl. Energy 2017, 185, 1604–1612. [Google Scholar] [CrossRef]
  14. Tian, H.; He, Z.; Li, Z. A combined cooling solution for high heat density data centers using multi-stage heat pipe loops. Energy Build. 2015, 94, 177–188. [Google Scholar] [CrossRef]
  15. Ding, T.; He, Z.G.; Hao, T.; Li, Z. Application of separated heat pipe system in data center cooling. Appl. Therm. Eng. 2016, 109, 207–216. [Google Scholar] [CrossRef]
  16. Ling, L.; Zhang, Q.; Yu, Y.; Liao, S.; Sha, Z. Experimental study on the thermal characteristics of micro channel separate heat pipe respect to different filling ratio. Appl. Therm. Eng. 2016, 102, 375–382. [Google Scholar] [CrossRef]
  17. Ding, T.; Cao, H.W.; He, Z.G.; Li, Z. Experiment research on influence factors of the separated heat pipe system, especially the filling ratio and Freon types. Appl. Therm. Eng. 2017, 118, 357–364. [Google Scholar] [CrossRef]
  18. Zhang, H.; Shi, Z.; Liu, K.; Shao, S.; Jin, T.; Tian, C. Experimental and numerical investigation on a CO2 loop thermosyphon for free cooling of data centers. Appl. Therm. Eng. 2017, 111, 1083–1090. [Google Scholar] [CrossRef]
  19. Tong, Z.; Zang, G. Effect of the diameter of riser and downcomer on an CO2 thermosyphon loop used in data center. Appl. Therm. Eng. 2021, 182, 116101. [Google Scholar] [CrossRef]
  20. Ding, T.; wen Cao, H.; guang He, Z.; da Wu, J.; Li, Z. Experimental study on a loop thermosyphon cooling system in data centers using CO2 as a working Fluid, especially thermal environment and energy-saving effect. Appl. Therm. Eng. 2020, 175, 115359. [Google Scholar] [CrossRef]
  21. Ling, L.; Zhang, Q.; Yu, Y.; Liao, S. Experimental investigation on the thermal performance of water cooled multi-split heat pipe system (MSHPS) for space cooling in modular data centers. Appl. Therm. Eng. 2016, 107, 591–601. [Google Scholar] [CrossRef]
  22. China Refrigeration Society Data Center Cooling Working Group. Annual Research Report on Cooling Technology Development 2017; China Architecture & Building Press: Beijing, China, 2018. [Google Scholar]
  23. Pelley, S.; Meisner, D.; Wenisch, T.F.; Vangilder, J.W.; Understanding and Abstracting Total Data Center Power. In Workshop on Energy-Efficient Design; 2009. Available online: https://citeseerx.ist.psu.edu/document?repid=rep1&type=pdf&doi=c9f3ff0a7c7c823ca3994144f33eb7ee1b31f396 (accessed on 7 March 2022).
  24. Zou, S.; Zhang, Q.; Yue, C.; Wang, J.; Du, S. Study on the performance and free cooling potential of a R32 loop thermosyphon system used in data center. Energy Build. 2022, 256, 111682. [Google Scholar] [CrossRef]
  25. Whelan, B.P.; Kempers, R.; Robinson, A.J. A liquid-based system for CPU cooling implementing a jet array impingement waterblock and a tube array remote heat exchanger. Appl. Therm. Eng. 2012, 39, 86–94. [Google Scholar] [CrossRef]
  26. Vilarrubí, M.; Riera, S.; Ibañez, M.; Omri, M.; Laguna, G.; Frechette, L.; Barrau, J. Experimental and numerical study of micro-pin-fin heat sinks with variable density for increased temperature uniformity. Int. J. Therm. Sci. 2018, 132, 424–434. [Google Scholar] [CrossRef]
  27. Moffat, R.J. Describing uncertainties in experimental results. Exp. Therm Fluid Sci. 1988, 1, 3–17. [Google Scholar] [CrossRef]
  28. Zou, S.; Zhang, Q.; Ling, L.; Wang, J.; Ma, X.; Du, S.; Yue, C. Experimental investigation on the thermal performance of a water-cooled loop thermosyphon system under fan failure conditions. Int. J. Refrig. 2021, 124, 85–95. [Google Scholar] [CrossRef]
  29. Yang, S.; Tao, W. Heat Transfer, 4th ed.; Higher Education Press: Beijing, China, 2006. [Google Scholar]
  30. Lemmon, E.W.; Huber, M.L.; Mclinden, M.O.; NIST Standard ReferenceDatabase 23. Reference Fluid Thermodynamic and Transport Properties-REFPROP. 9.0, 2010. Available online: https://www.techstreet.com/standards/nist-refprop-9-0?product_id=1772426 (accessed on 10 May 2022).
  31. Gnielinski, V. New Equations for Heat and Mass Transfer in Turbulent Pipe and Channel Flows. Int. J. Chem. Eng. 1976, 16, 359–367. [Google Scholar]
  32. Muley, A.; Manglik, R.M. Experimental Study of Turbulent Flow Heat Transfer and Pressure Drop in a Plate Heat Exchanger With Chevron Plates. Trans. ASME 1999, 121, 110–117. [Google Scholar] [CrossRef]
  33. Shah, M.M. Unified correlation for heat transfer during boiling in plain mini/micro and conventional channels. Int. J. Refrig. 2017, 74, 606–626. [Google Scholar] [CrossRef]
  34. Friedel, L. Improved Friction Pressure Drop Correlation for Horizontal and Vertical Two-Phase Pipe Flow. In Proceedings of the European Two-Phase Flow Group Meet, Ispra, Italy, 5–8 June 1979; Volume 18, pp. 485–491. [Google Scholar]
  35. Han, D.-H.; Lee, K.-J.L.; Kim, Y.-H.K. The Characteristics of Condensation in Brazed Plate Heat Exchangers with Different Chevron Angles. J. Korean Phys. Soc. 2003, 43, 66–73. [Google Scholar]
  36. Shah, R.K. Plate Heat Exchangers and Their Design Theory; Heat Transfer Equipment Design: Washington, DC, USA, 1988. [Google Scholar]
  37. Coleman, J.W. An Experimentally Validated Model for Two-Phase Sudden Contraction Pressure Drop in Microchannel Tube Headers. Heat Transf. Eng. 2004, 25, 69–77. [Google Scholar] [CrossRef]
  38. Kim, M.H.; Bullard, C.W. Air-side thermal hydraulic performance of multi-louvered fin aluminum heat exchangers. Int. J. Refrig 2002, 25, 390–400. [Google Scholar] [CrossRef]
  39. Chang, Y.J.; Wang, C.C. A generalized heat transfer correlation for Iouver fin geometry. Int. J. Heat Mass Transf. 1997, 40, 533–544. [Google Scholar] [CrossRef]
  40. Dong, J.; Chen, J.; Chen, Z.; Zhang, W.; Zhou, Y. Heat transfer and pressure drop correlations for the multi-louvered fin compact heat exchangers. Energy Convers. Manag. 2007, 48, 1506–1515. [Google Scholar]
  41. Kim, N.H.; Cho, J.P. Air-side performance of louver-finned flat aluminum heat exchangers at a low velocity region. Heat Mass Transf. 2008, 44, 1127–1139. [Google Scholar] [CrossRef]
  42. Zhang, Q.; Huang, X.; Zou, S. Numerical Investigation on Thermal Performance of Micro Channel Separate Heat Pipe under Low Airflow Rate. J. Hunan Univ. Nat. Sci. 2020, 47, 149–156. [Google Scholar]
  43. Yue, C.; Zhang, Q.; Zhai, Z.; Ling, L. CFD simulation on the heat transfer and flow characteristics of a microchannel separate heat pipe under different filling ratios. Appl. Therm. Eng. 2018, 139, 25–34. [Google Scholar] [CrossRef]
  44. Gungor, K.E.; Winterton, R. A general correlation for flow boiling in tubes and annuli. Int. J. Heat Mass Transf. 1986, 29, 351–358. [Google Scholar] [CrossRef]
  45. Li, W.; Wu, Z. A general criterion for evaporative heat transfer in micro/mini-channels. Int. J. Heat Mass Transf. 2010, 53, 1967–1976. [Google Scholar] [CrossRef]
  46. Kandlikar, S.G. A General Correlation for Saturated Two-Phase Flow Boiling Heat Transfer Inside Horizontal and Vertical Tubes. J. Heat Transf. 1990, 112, 219–228. [Google Scholar] [CrossRef]
  47. GB50174-2017; Code for Design of Data Centers. China Planning Publishing House: Beijing, China, 2017.
  48. European Space Research and Technology Centre (Noordwijk); Mechanical Systems Division, European Space Agency. Heat Pipe Qualification Requirements; ESA PSS-49 Issues 2; ESA Scientific and Technical Publications Branch: Paris, France, 1983. [Google Scholar]
Figure 1. Schematic diagram of a loop thermosyphon system. The red and orange arrows indicate the heated fluids, the blue arrows indicate the cooled fluids.
Sustainability 15 13100 g001
Figure 2. Schematic diagram of an LTS and testing facility. The red and orange arrows indicate the heated fluids, the blue arrows indicate the cooled fluids.
Sustainability 15 13100 g002
Figure 3. Cooling capacity under different refrigerant filling ratios.
Sustainability 15 13100 g003
Figure 4. Cooling capacity, rack outlet air temperature, and refrigerant mass flow rate under different airflow rates and partial servers’ heating loads.
Sustainability 15 13100 g004
Figure 5. Flow chart of the LTS modeling. Note: plp,out is the liquid pipe outlet refrigerant pressure, kPa; hc,out is the outlet refrigerant enthalpy of condenser, kJ/kg; mtotal is the total charge of refrigerant, kg.
Sustainability 15 13100 g005
Figure 6. Comparison of the simulation results and the experimental results.
Sustainability 15 13100 g006
Figure 7. The schematic diagram of simulated LTS integrated with servers. Note: Re,w and Rc,w are the wall thermal resistances of evaporator and condenser, °C/W; Te,wi and Tc,wo are the inner and outer wall temperatures of evaporator, °C; Tc,wi and Tc,wo are the inner and outer wall temperatures of condenser, °C. The red and orange arrows indicate the heated fluids, the blue arrows indicate the cooled fluids.
Sustainability 15 13100 g007
Figure 8. Thermal performance under different airflow rates and server utilizations (simulated): (a) temperature; (b) cooling capacity; (c) thermal resistance.
Sustainability 15 13100 g008aSustainability 15 13100 g008b
Figure 9. The rack’s average outlet air temperature and the excessive cooling capacity under different airflow rates and server utilizations.
Sustainability 15 13100 g009
Figure 10. Thermal performance under different supply chilled water temperatures and server utilizations (simulated): (a) cooling capacity; (b) thermal resistance; and temperature difference.
Sustainability 15 13100 g010
Figure 11. The rack’s average outlet air temperature and the excessive cooling capacity under different supply chilled water temperatures and server utilizations.
Sustainability 15 13100 g011
Figure 12. Thermal performance and under different chilled water flow rates and server utilizations (simulated): (a) cooling capacity; (b) thermal resistance; and temperature difference.
Sustainability 15 13100 g012aSustainability 15 13100 g012b
Figure 13. The rack’s average outlet air temperature and excessive cooling capacity under different chilled water flow rates and server utilizations.
Sustainability 15 13100 g013
Table 1. The structure parameters of LTS.
Structure ParametersValueStructure ParametersValue
Liquid/vapor collector diameter (mm)30Louver length Lle (mm)7
Liquid outlet diameter (mm)16Louver pitch Pl (mm)1
Liquid pipe length Llp (mm)4250Number of flat tubes 30
Liquid pipe height difference ΔH (mm)2200Number of rows 1
Vapor outlet diameter (mm)19Number of micro channels in flat tube19
Transverse flat tube pitch Pf (mm)8Plate length (mm)466
Micro channel pitch Pm (mm)0.4Plate width (mm)111
Flat tube height Ht (mm)2Area of the plate (m2)0.079
Flat tube width Fw (mm)25.4Plate thickness (mm)0.4
Flat Tube distance (mm)1580Angle of the corrugation, βc (°)30
Fin pitch Fp (mm)2Corrugation amplitude, b (mm)2.4
Fin thickness δf (mm)0.105Plate pitch, (mm)2.8
Fin width Bf (mm)25Number of plates20
Fin height Hf (mm)8Number of plates effective in heat transfer18
Louver angle θ (°)30
Table 2. Ranges and uncertainties of test equipment.
ParametersTest EquipmentRangeUncertainty
Temperature (°C)Enthalpy difference laboratory−20~80±0.1
PT100 platinum resistor−80~150±0.1
Relative humidityEnthalpy difference laboratory0~95%±1%
Pressure (kPa)AKS32 pressure transmitter−100~300±7.5
Refrigerant mass flow rate (kg/h)DMF-1-3B Coriolis mass flowmeter0~200±1
Airflow rate (m3/h)Enthalpy difference laboratory600~3100±0.3
Water flow rate (m3/h)Enthalpy difference laboratory0~3.20.5%
Table 3. Test conditions.
Range
Refrigerant filling charge (kg)0.6, 0.8, 1.0, 1.2, 1.4, 1.6, 1.8
Filling ratio (%)27.9, 37.2, 46.5, 55.8, 65.1, 74.4, 83.7
Indoor air dry/wet bulb temperature (°C)35/21
Supply chilled water temperature Tcw (°C)12
Chilled water flow rate Vw (m3/h)1.71
Airflow rate Va (m3/h)600, 800,1000, 1200, 1400, 1600, 1800
Working fluidR22
Table 4. Heat transfer and pressure drop correlations for simulation.
Working FluidItem Correlation
RefrigerantEvaporator single-phaseHeat transfer coefficientGnielinski [31]
Condenser single-phaseHeat transfer coefficientMuley and Manglik [32]
Single phasePressure dropGnielinski [31]
Evaporator two-phaseHeat transfer coefficientShah [33]
Pressure dropFriedel [34]
Condensation two-phaseHeat transfer coefficientHan et al. [35]
Pressure dropShah [36]
Connection tubesPressure dropColeman [37]
Airside Heat transfer coefficientKim and Bullard [38]
Pressure dropKim and Bullard [38]
Water side Heat transfer coefficientMuley and Manglik [32]
Table 5. Simulation conditions.
Range
Indoor air dry/wet bulb temperature (°C)26/14
Server utilization us (%)3–100
Server-rated heating load Ps,full (W)7200
Supply chilled water temperature Tcw (°C)10, 12, 14, 16, 18
Chilled water flow rate Vw (m3/h)0.5, 0.9, 1.3, 1.71, 2.1
Airflow rate Va (m3/h)600, 900, 1200, 1500, 1800
Disclaimer/Publisher’s Note: The statements, opinions and data contained in all publications are solely those of the individual author(s) and contributor(s) and not of MDPI and/or the editor(s). MDPI and/or the editor(s) disclaim responsibility for any injury to people or property resulting from any ideas, methods, instructions or products referred to in the content.

