Article

Selection of a Sustainable Structural Floor System for an Office Building Using the Analytic Hierarchy Process and the Multi-Attribute Utility Theory

by
Faris A. AlFaraidy
1,
Kishore Srinivasa Teegala
2 and
Gaurav Dwivedi
3,*
1
Department of Building Engineering, College of Architecture and Planning, Imam Abdulrahman Bin Faisal University, Dammam 34343, Saudi Arabia
2
Electrical & Electronics Engineering, GMRIT, Rajam 532127, India
3
Energy Centre, Maulana Azad National Institute of Technology, Bhopal 462003, India
*
Author to whom correspondence should be addressed.
Sustainability 2023, 15(17), 13087; https://doi.org/10.3390/su151713087
Submission received: 16 June 2023 / Revised: 16 August 2023 / Accepted: 25 August 2023 / Published: 30 August 2023
(This article belongs to the Special Issue The Sustainable Fuel Source for Future Development)

Abstract

:
The integration of green building technology is currently regarded as a critical step towards a sustainable future because it is a means of attaining sustainable development. It takes skill to combine a sustainable ecosystem with comfortable living areas to create eco-friendly building designs. The use of modern technologies can also enhance traditional methods for developing greener structures and thereby help maintain sustainable built environments. This research paper is intended to develop a selection framework to evaluate three different structural floor systems for a high-rise office building in Alhasa, the Kingdom of Saudi Arabia. The three structural floor systems are as follows: a two-way ribbed slab system, a post-tension slab system, and a hollow core slab system. The main selection criteria used for the investigation in this paper are as follows: initial cost, running costs (operating and maintenance costs), salvage value, self-structural weight, and the possibility of utilities passage. A questionnaire survey was designed to collect the opinions of experts (project managers) regarding the relative importance of the different selection criteria, and these were used to determine the most suitable structural system for the office building. The analytic hierarchy process (AHP) was the tool used to determine the weights of the different criteria, and it was applied in combination with an Eigenvector analysis. Another objective of the investigation was to determine the utility preference values of the selection criteria by employing the multi-attribute utility theory (MAUT) technique. The results showed that the most important criterion is utilities passage, which is followed by structural weight and then initial cost, salvage value, and running costs. From the results of this research, we conclude that the system with the highest total value is the post-tension slab system. The limitations of the study include the fact that it only investigated three concrete floor systems commonly used in office buildings in Saudi Arabia, and that it included only five selection criteria that were identified and evaluated by the experts.

1. Introduction

The technical inventions relating to the structures of the first towers and the resources used to build them are now subjects for historians. Though the inventions that have followed the first skyscrapers have not been as sociologically significant, they reflect similar levels of inspiration and creativity, and perhaps surpass earlier innovative breakthroughs. The supremacy of steel in the multi-story commercial sector stems from its capability to deliver large, column-free floor spaces, the incorporation of building amenities, and the and the ease with which it can be used in construction. For inner-city ventures, the need for speedy construction and the limited space to store materials on site have led to increasing levels of pre-fabrication for which steel-framed structures are well suited. There is a robust demand for excellent office space, particularly in city centers. The corporate headquarters of banks and similar businesses require that structures meet elevated architectural and environmental criteria. Investment ‘value’ is the key measure of optimal architecture. Many structures are curved or of convoluted architectural form, with glazed facades and foyers.
Residents wish to reside in buildings that provide a flexible, carefree, and economical way of life. Several cutting-edge design solutions have been developed to accomplish this goal, improve building efficiency, cater to a variety of human requirements, and ensure environmental sustainability [1]. AHP’s executive research objective over the past few years has also been to make use of its natural ability to deal with the different decision-making styles that have traditionally been used in its development [2].
In the field of construction management [3], the AHP method is utilized to choose certified parameters within green building systems by employing specific identification criteria [4]. A model is developed [5] to assess the environmental efficiency of buildings and identify key performance indicators for green building parameters. By considering various factors, such as property preferences [6], the AHP method can be employed to evaluate the life cycle performance of a structure. The use of artificial intelligence (AI) algorithms and technologies as well as information in decision support systems for urban planning and regeneration is recognized as having potential. However, there are concerns regarding the impact of regeneration efforts on the environment and local communities, and these necessitate careful planning and the consideration of potential challenges. Advancements in Internet technologies, AI techniques, and graphical automation have expanded the domain of spatial assessment and optimization, which is now a prominent area of research [7].
Office building floor system design and selection has an impact on structural stability, cost effectiveness, and tenant comfort. The multi-attribute utility theory (MAUT) facilitates the comparison of different floor system solutions. The use of the MAUT in the selection of office building structural floor systems is examined in this literature review. In this study, office floor systems were chosen using the MAUT. Aesthetics, cost, structural performance, and sustainability were assessed [8]. Using the MAUT, floor solutions were assessed according to their structural effectiveness, ease of construction, upkeep, and life cycle cost [9]. The MAUT was used to select high-rise office floor systems. Examinations of seismic performance, floor height, plan flexibility, and environmental effect were carried out [10]. The MAUT floor system selection framework now includes occupant comfort as a result of this study. Thermal comfort, noise, and vibration levels were assessed [11]. To enhance the process by which the office block floor system was chosen, the MAUT and BIM (building information modelling) were linked. Material optimization, conflict detection, and constructability were investigated [12]. An MAUT-based paradigm for choosing sustainable office floor systems was created in this work. Considerations included embodied energy, recyclable materials, carbon impact, and renewable resources [13]. To take into consideration the uncertainty surrounding floor system selection, the authors proposed a probabilistic MAUT technique. We looked at load-carrying capacity, fire resistance, and durability [14]. In this work, cost-effective office floor systems are analyzed using the MAUT. The expenses of construction, upkeep, and lifespan were investigated [15]. The authors created an MAUT-based decision support system for choosing office floor systems. Constructability, flexibility, and aesthetics were evaluated with reference to professional expertise and user preferences [16]. This study used the MAUT and the AHP to enhance the process of choosing an office block floor system. Assessments of sustainability, constructability, and structure were carried out [17]. In the reviewed literature, structural selection was generally carried out using MAUT.
Sustainable building practices are essential given the environmental impact of the construction industry. It is essential to choose environmentally friendly structural floor solutions for office buildings. Traditional methods frequently ignore sustainability, and thereby increase costs and footprints. Sustainable development requires a methodical strategy that takes into account factors including the initial cost, the ongoing costs, the salvage value, the self-structural weight, and the proposed system. Numerous studies [18,19,20,21] have assessed structural floor systems for office buildings based on sustainability criteria. Key factors have included the impact of initial costs on budgets, the degree to which ongoing costs reflect long-term sustainability, the impact of salvage value on environmental and economic feasibility, the effect of self-structural weight on construction resource consumption, and the proposed system’s alignment with sustainability goals.
Below are the various key features of office block design according to our literature survey. The most common need is adaptability. Forecasting should take into account corporate clubs, prefabricated offices, integrated offices, and business offices. The location must meet business needs. Offices are often complex. Architecture relies on structural efficiency. Articulated structures look elegant and realistic. A good countenance requires assembly and architectural harmony. Aesthetics can be enhanced by the use of light-weight materials and resource management can improve efficacy, dexterity, intricacy, and morality. Open offices foster collaboration, efficiency, and teamwork. Conservatism involves the inclusion of peripheral offices for qualified middle and higher management and support workers. Portable panels divide workstations.
Building projects involve goals that result in competition for limited resources and thus require decision making, just like many other projects. The decision-maker must concentrate on allocating resources in the way that will most effectively accomplish the project’s overall goals because most projects are unlikely to entirely fulfil each aim (either due to a lack of resources or because it would be technically impossible to do so).
In this study, three potential structural floor systems for a high-rise office building in Alhasa, the Kingdom of Saudi Arabia, are evaluated. The three structural types are as follows: a hollow core slab system, a post-tension slab system, and a two-way ribbed slab system. The study takes into account the following five selection criteria: the initial cost, ongoing costs, salvage value, self-structural weight, and the possibility of utilities passage. To obtain professional opinions on the relative significance of the various selection criteria, a questionnaire survey was administered. The weights for the various criteria were determined using the analytic hierarchy process (AHP), and the utility preference values for the selection criteria were determined using the multi-attribute utility theory (MAUT) technique.
Two decision-making processes are combined in order to solve this issue. The project’s primary goals can be compared using the analytical hierarchy process (AHP), and the multi-attribute utility theory (MAUT) is used to evaluate how well an alternative achieves each of its specific goals. With the help of this technique, the decision-maker will be better able to compare several design options side-by-side and conduct further comparisons between dissimilar parts. This suggested process enables the user to comprehend how effectively each choice satisfies specific and project-wide objectives.
The remainder of the paper is organized such that Section 2 explains the methodology used, Section 3 presents the results of the study along with a discussion of the results, and Section 4 outlines the conclusions drawn from this research.

2. Materials and Methods

2.1. AHP and MAUT

The analytic hierarchy process (AHP) is a tool for organizing, measuring, and synthesizing [22,23,24,25,26,27,28,29,30,31,32,33,34,35]. Numerous different problem situations have been addressed using the AHP, such as selecting among competing alternatives in a multi-objective environment and forecasting (Figure 1). The lifetime of a structure is generally in the region of 50–100 years. The preservation cost is a portion of the life cycle cost and is accounted for in the engineering cost. It is imperative to keep the maintenance cost as low as possible, but it can never be circumvented entirely. The AHP relies on a structured mathematical framework of consistent matrices and the capacity of their associated right-eigenvectors to determine accurate or approximate weights. The primary application of the AHP is to address decision-making challenges within a setting in which multiple criteria are involved.
In this mode, it uses a method that compares goals and options in a natural, pairwise way. Figure 2 exemplifies the most common flaws in diverse types of facades. With concrete, it is ideal to make the concrete impervious, thus the proposal for a rheostat.
The AHP transforms individual preferences into ratio-scale weights which are then combined to form linear additive weights for the corresponding alternatives. These resulting weights enable the ranking of alternatives and provide valuable assistance to the decision-maker in making choices or predicting outcomes.
The multi-attribute utility theory (MAUT) is an extension of the utility theory that aids decision-makers in assigning utility values to outcomes by considering their preferences and evaluating them based on multiple attributes. By combining these individual assignments, overall utility measures are obtained [38,39,40,41,42,43,44,45,46,47]. The utility theory is commonly used to establish a relationship between utility and the costs associated with a specific decision (Figure 3).

2.2. Study Area

Al-Hasa is around 70 to 80 km from the seacoast of eastern Saudi Arabia [48,49,50,51]. The key difficulty associated with the Al-Hasa province is that its subsoil comprises a dense layer of clay, with great discrepancies from place to place (inconstant width). Therefore, surface underpinning systems, such as traction or raft systems, may not be appropriate for the erection of heavy buildings in this province. In addition to this, no precise evidence exists concerning the geology and the subsoil of the province. This is particularly problematic because such evidence concerning the subsoil is obligatory when undertaking constructions that involve depths greater than 15 m. It is predicted that the conclusions drawn from this study could possibly lead to the introduction of comparative evaluations of structural floor systems for office buildings in this region using the AHP and the MAUT.

2.3. Structural Flooring Systems Studied

This paper will investigate three different structural flooring systems for an office building in Alhasa (Saudi Arabia): a two-way ribbed slab system, a post-tension slab system, and a hollow core slab system.
The ribbed or waffle slab is a type of structural slab consisting of a series of parallel reinforced concrete T beams that are framed by reinforced concrete girders (Figure 4). According to this design, the slab acts as the flange of the beam, the expanded part serves as the web, and the stretched portions form the ribs [52,53,54,55]. The spacing between the ribs typically ranges from 20 to 30 inches. One of the main advantages of this type of slab is that it eliminates tension stress on the tension side of the slab. Since concrete has low tensile strength, the removal of tension concrete using pan forms is beneficial. This construction method is economically favorable for structures with relatively light live loads, such as apartment buildings and hotels. However, it may not be suitable for areas with heavy live loads, such as industrial buildings and warehouses. Additionally, the thickness of the slabs needs to be carefully considered so that they meet fire resistance requirements and control formwork costs.
Figure 5 shows the post-tension slab system, which is a mixture of conventional slab reinforcement and further protruding high-strength steel tendons which are subjected to tension after the concrete has set. This hybridization helps accomplish the formation of a much thinner slab with a longer lifespan and removes the need for columns [45,46,47]. Post-tensioned concrete is tougher and more flexible than conventional steel-reinforced concrete. Post-tensioning helps lessen cracking from shrinkage as the concrete is held together as it dries. However, there are disadvantages, e.g., the numerous tendons and wires arranged inside the post-tension slab can rust. Because of the intricacy of the work required, poor workmanship can lead to catastrophes.
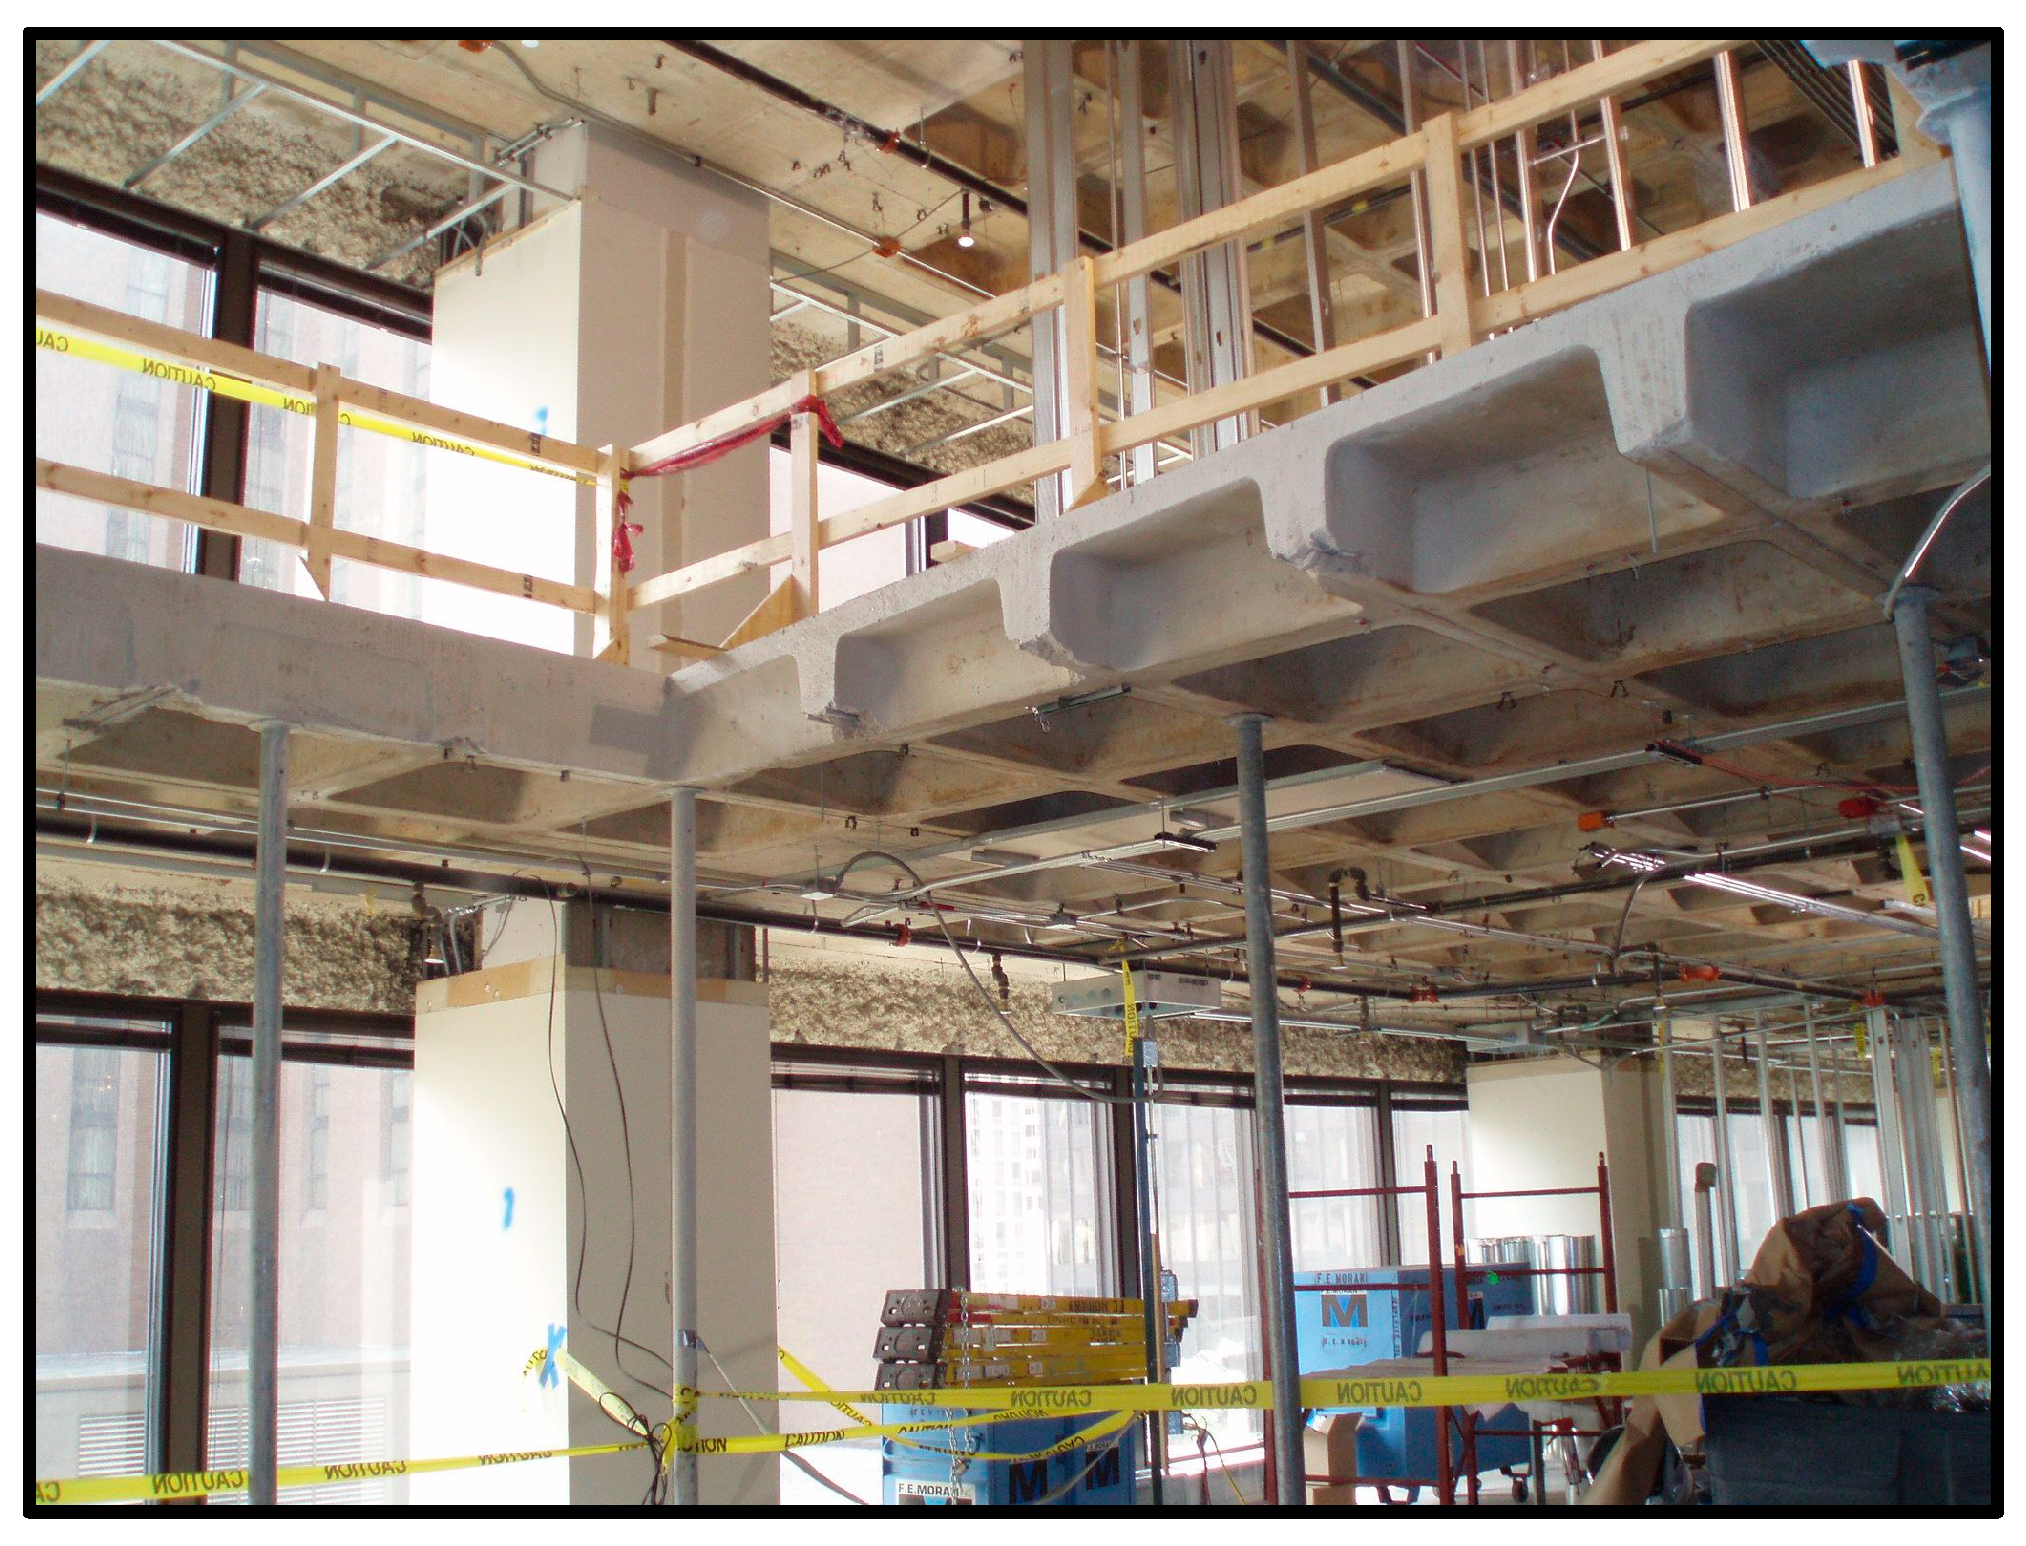
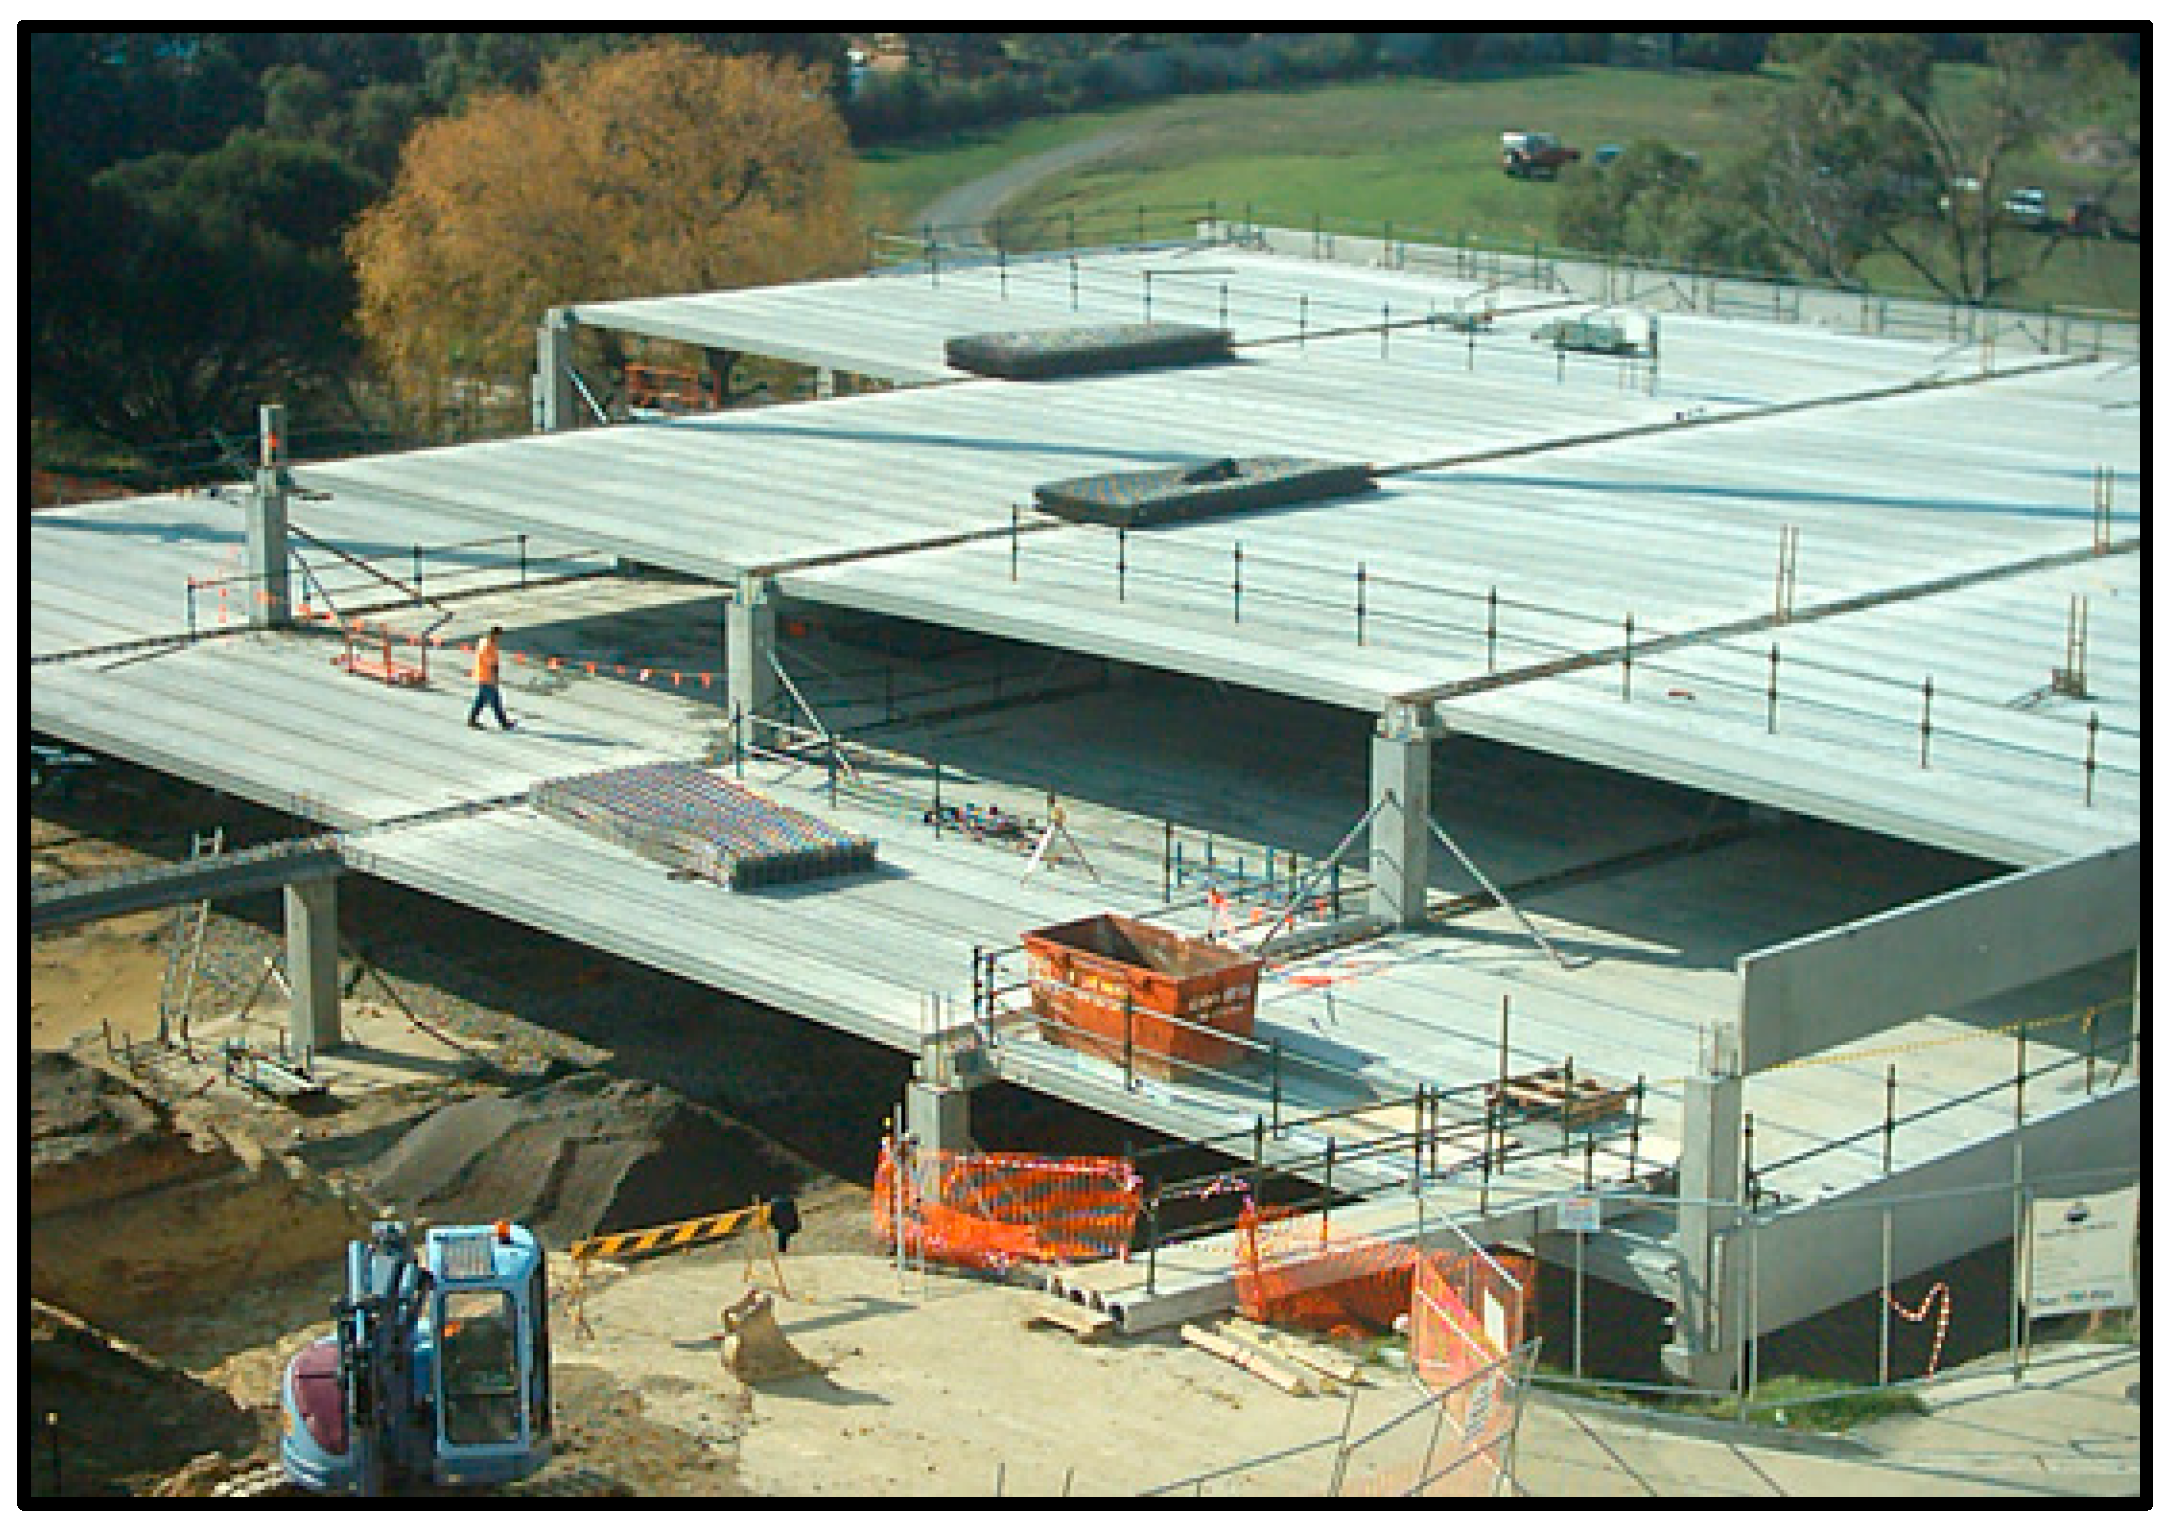
Hollow core slabs are precast, pre-stressed concrete elements commonly used for flooring in both industrial and residential structures (Figure 6). These slabs offer various advantages, including a long lifespan, the elimination of the need for propping during construction, flexible design options [56,57,58,59,60], and rapid installation.
The criteria used to develop the AHP–MAUT-based framework were initial cost, running costs, salvage value, structural weight, and the possibility of utilities passage. This was achieved by using the AHP to determine the weights of the different criteria, while the preference utility values were determined using the MAUT. This research complements the existing body of knowledge by showing that the most important criterion is utilities passage, followed by structural weight, initial cost, salvage value, and running costs.

2.4. Proposed Selection Framework

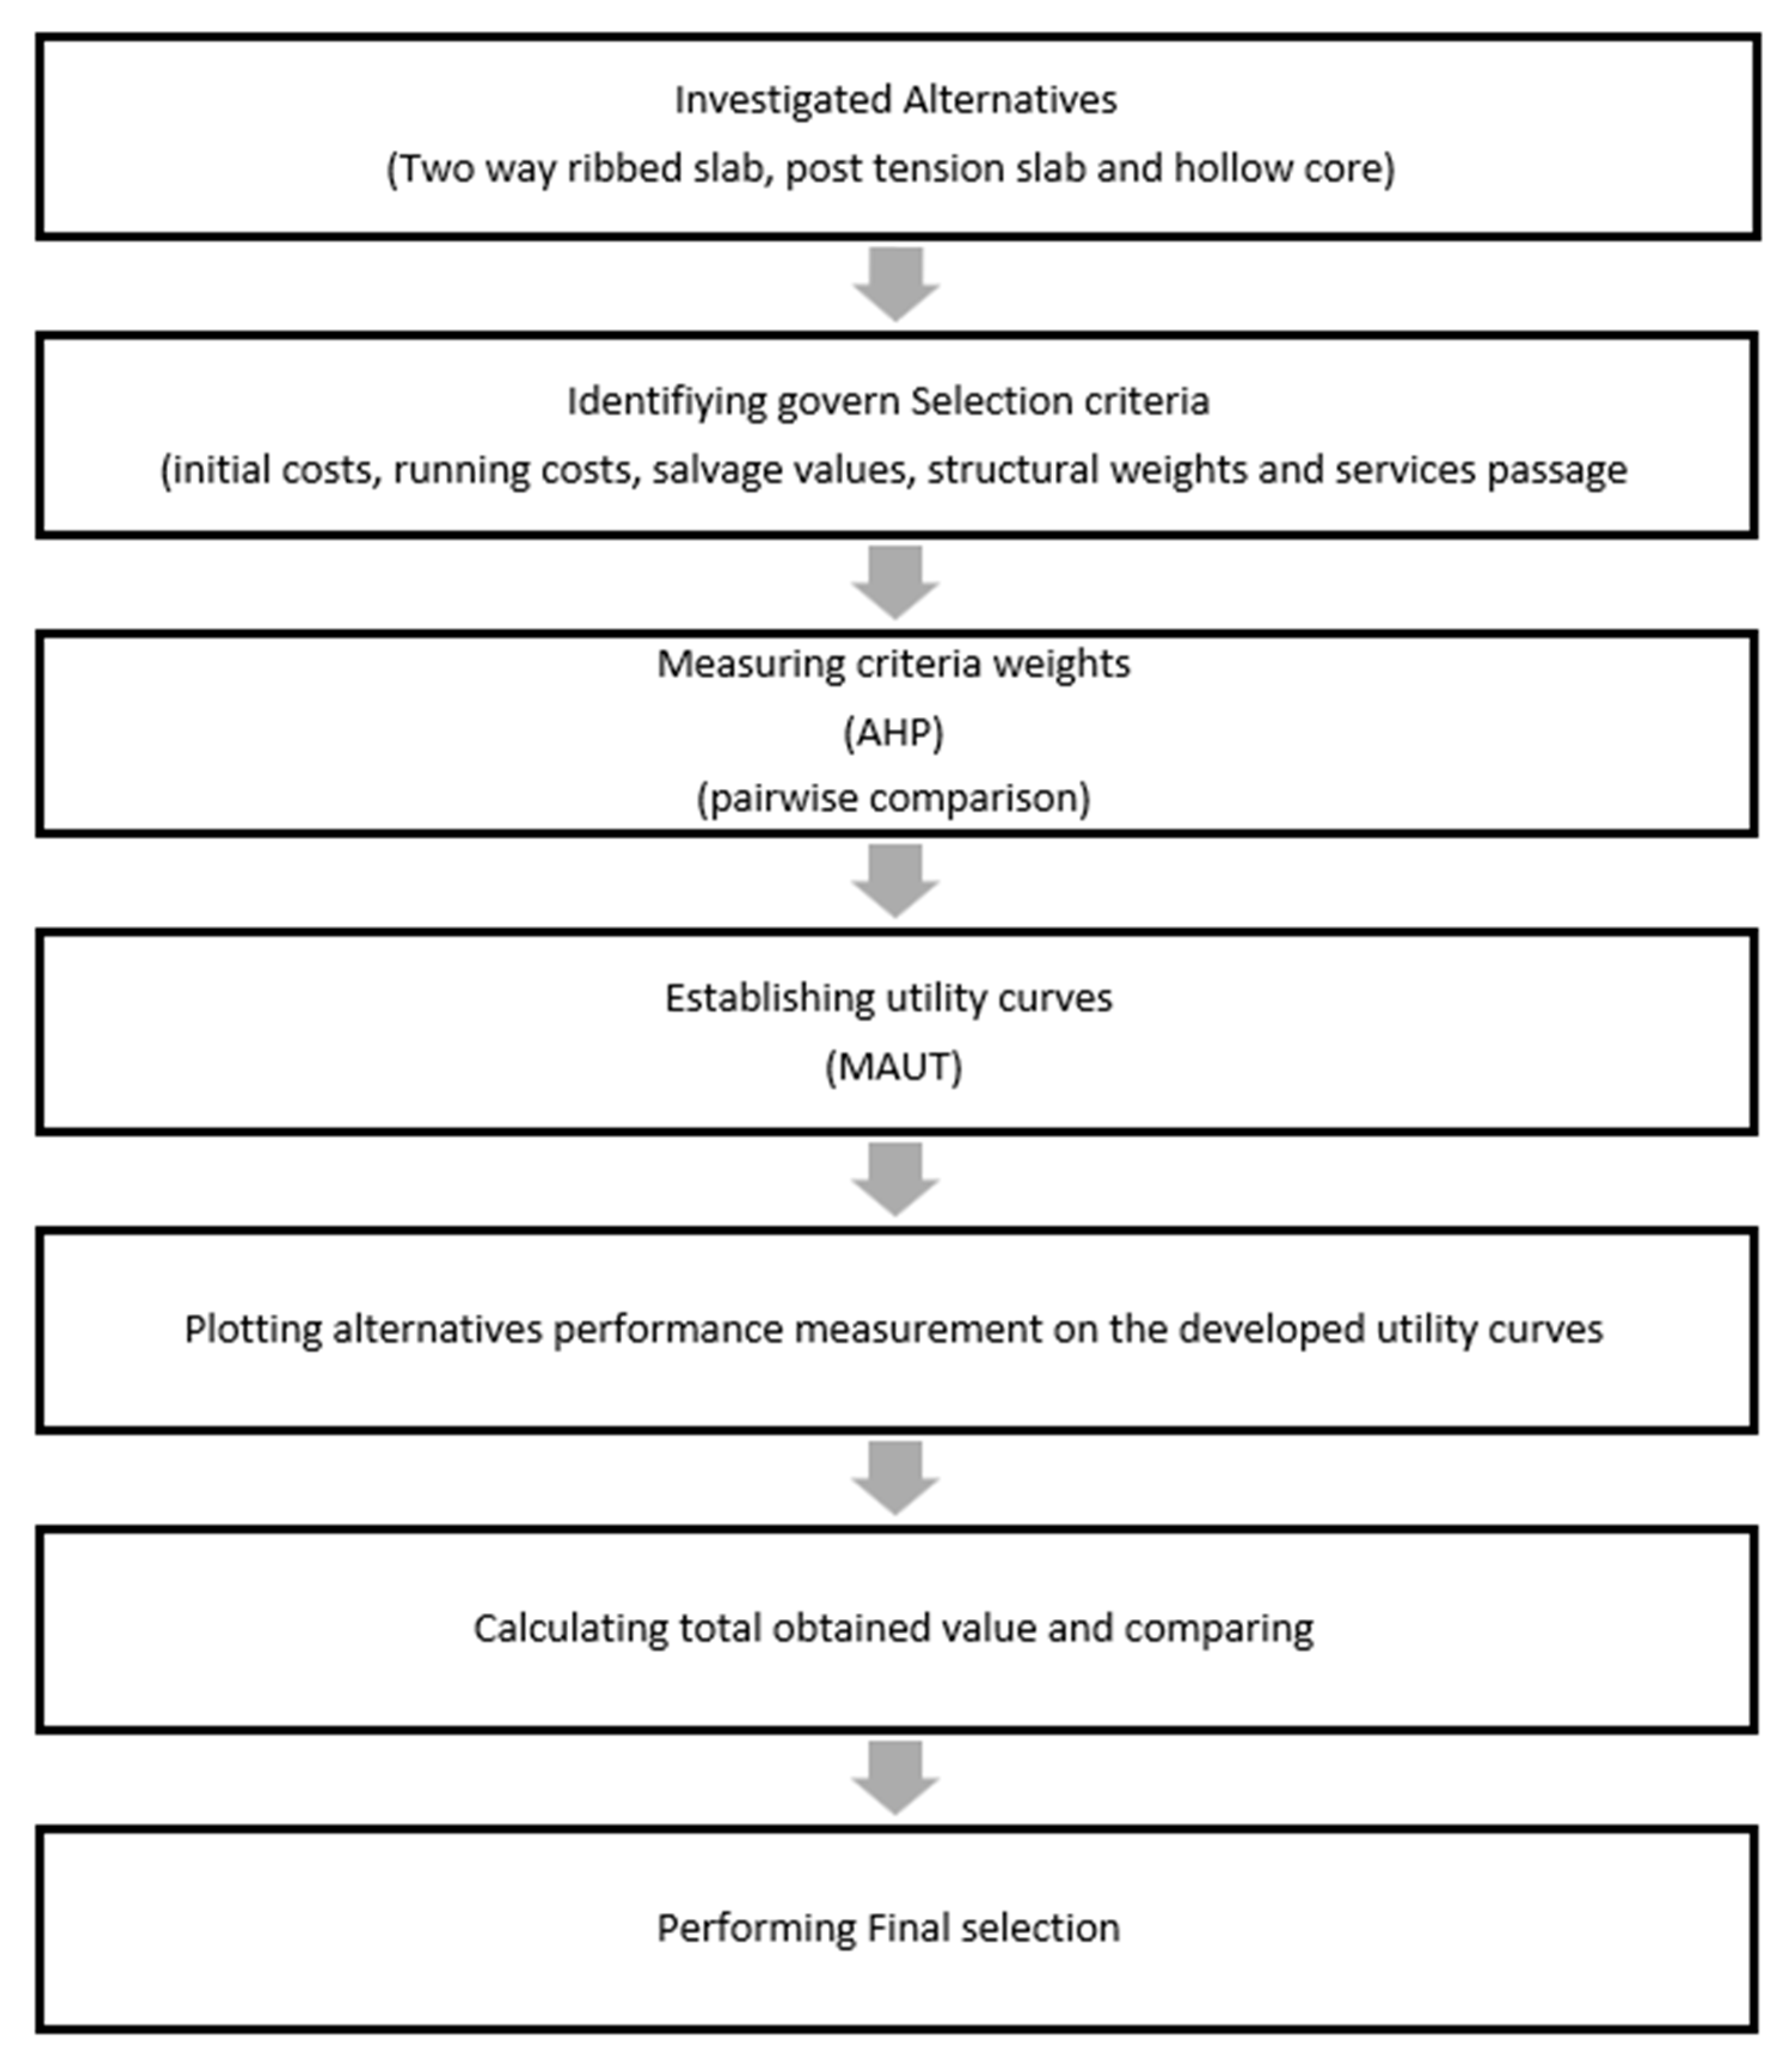
The selection framework used in this study was developed by applying the multi-attribute utility theory (MAUT) and the analytical hierarchy process (AHP). These smart techniques ware employed by distributing a questionnaire to collect the opinions of experts (project managers) in order to determine the importance weights (relative weights) of the different selection criteria. The development process of the selection framework is shown in Figure 7.
There are six major steps in the evaluation and selection framework. The first step is to identify the selection criteria and the nominated floor system alternatives. The second step is to measure the importance weights of all the selection criteria (initial construction costs, operating and maintenance costs, salvage value, structural weight, and utilities passage); these criteria are given weights by experts by means of pairwise comparisons and AHP techniques.
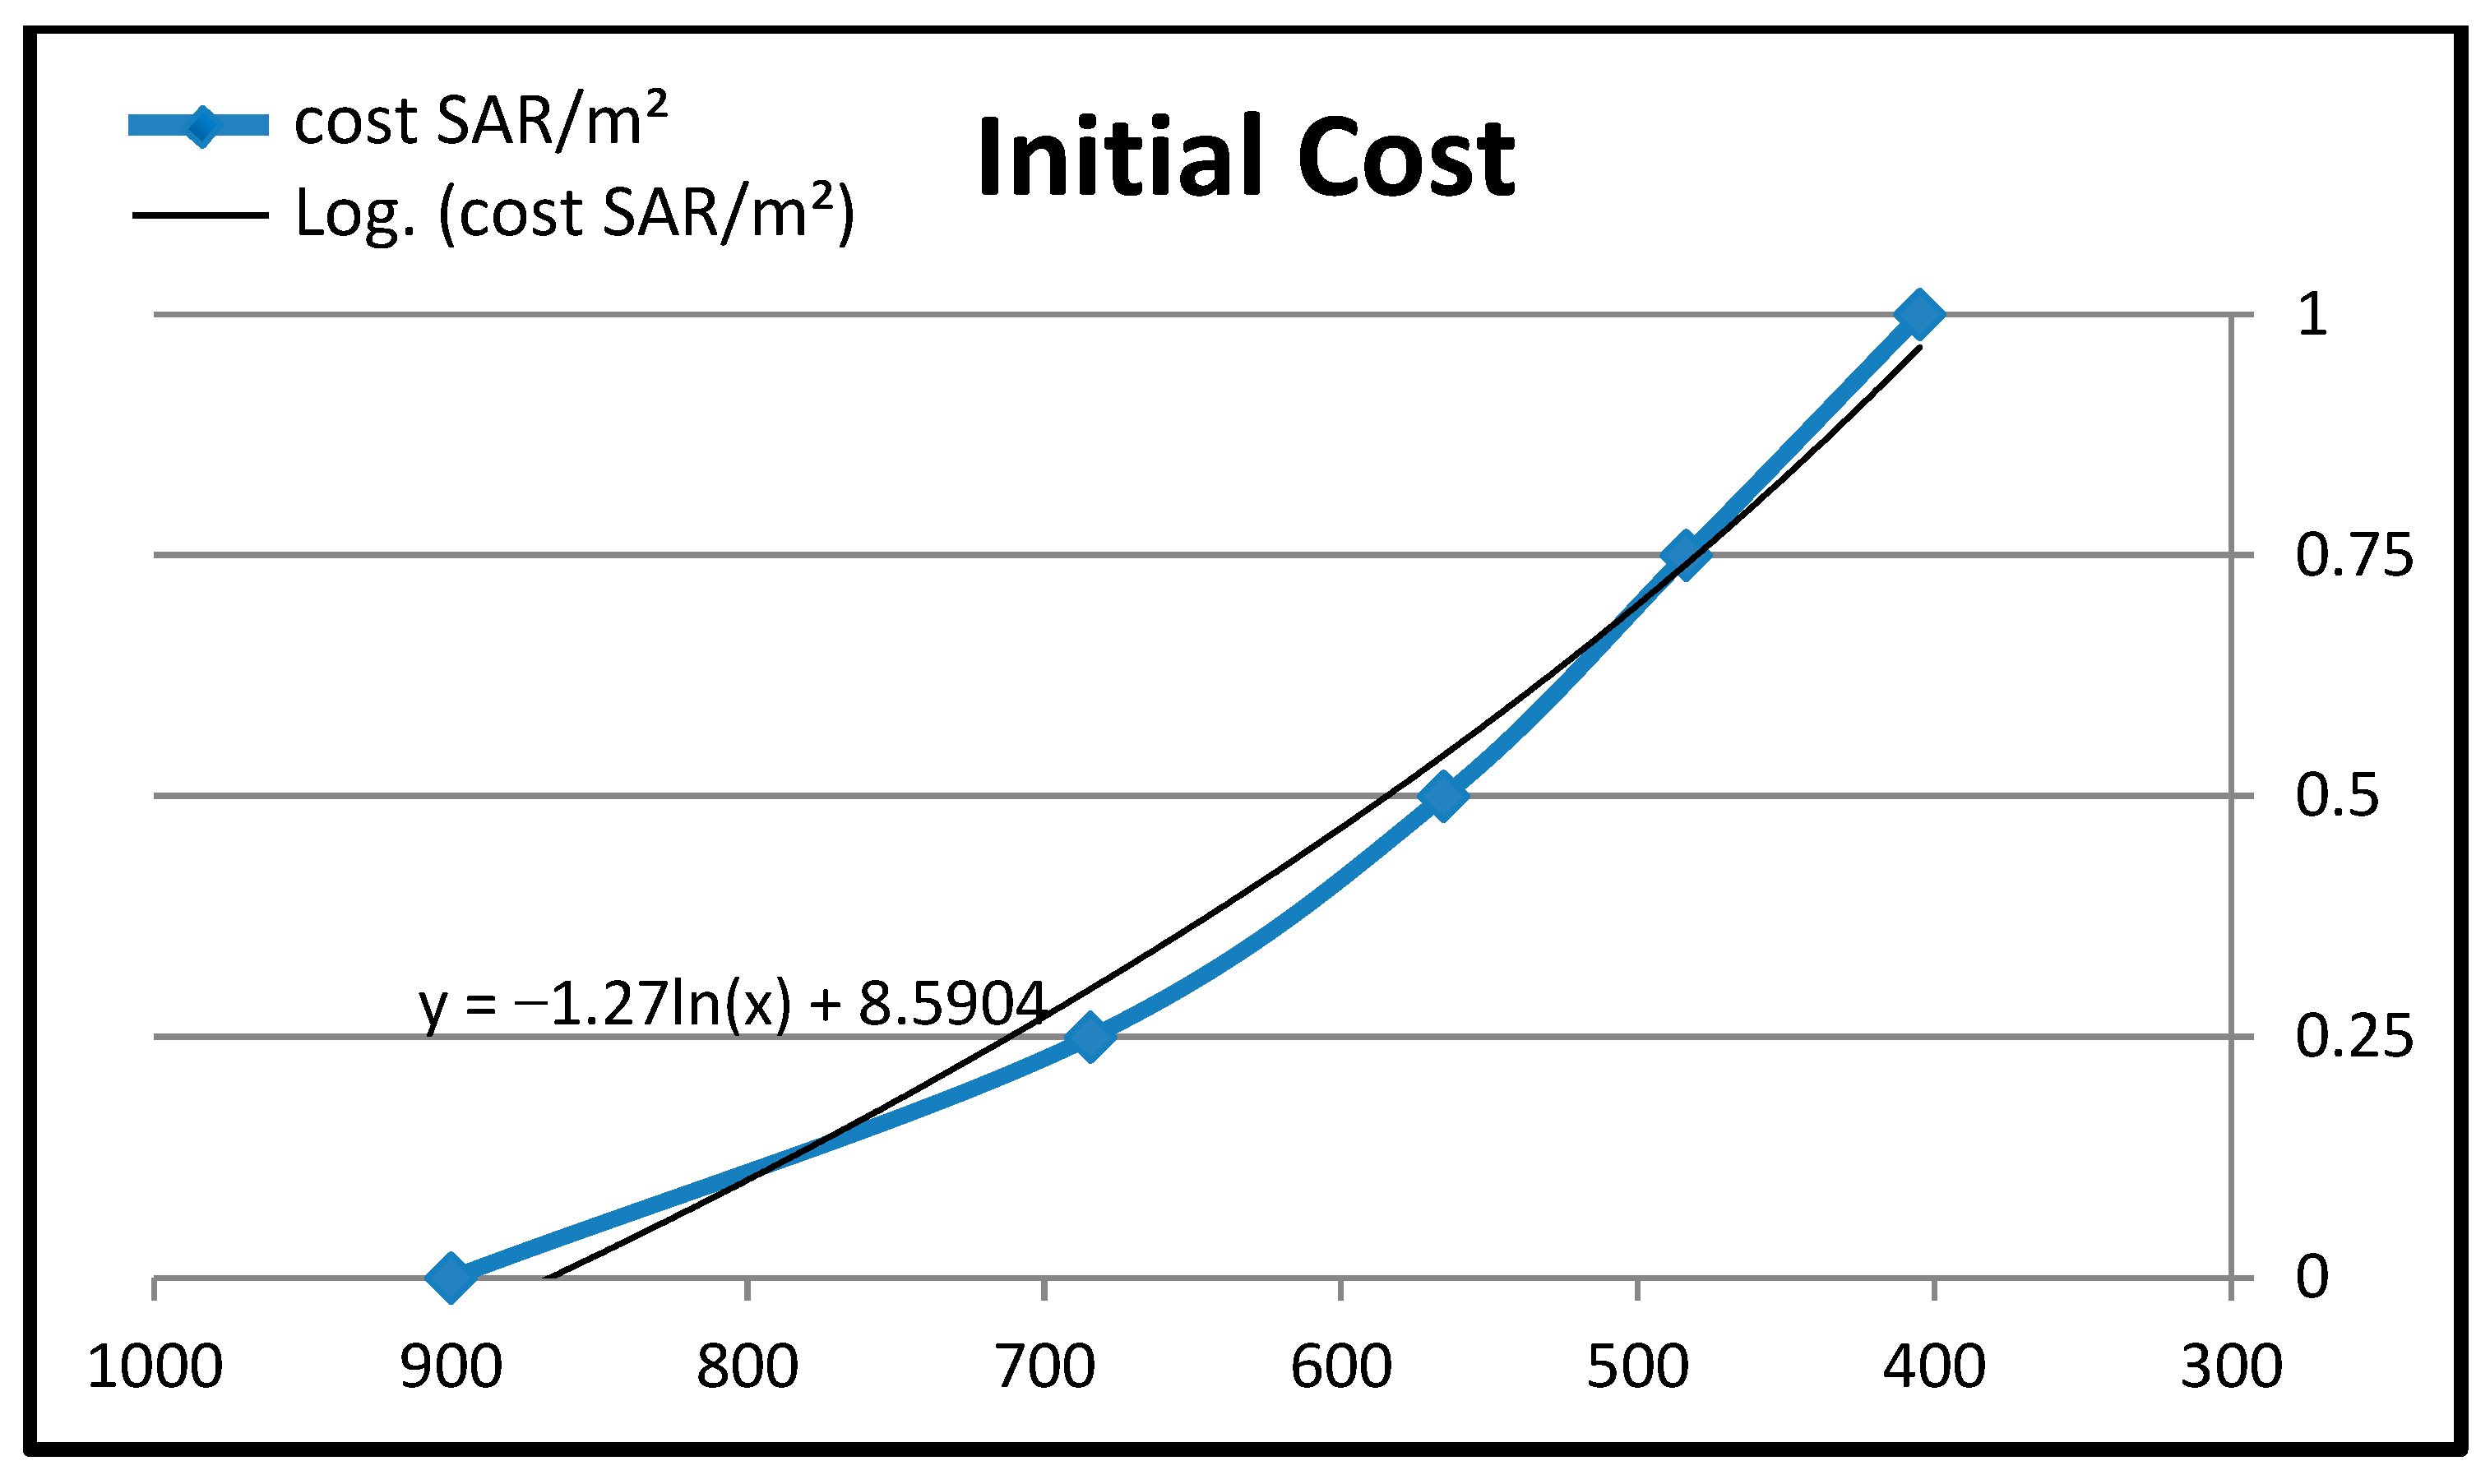
The third step is creating utility curves for the criteria using expert opinions concerning the performance of each different alternative, and by applying the multi-attribute utility theory (MAUT) in this step, the different utility score measurements can be converted into a linear scale.
The fourth step is plotting the performance measure of each investigated alternative in each criterion utility curve. The utility score obtained is then multiplied by the importance criterion weight.
The fifth step is calculating the total score for each alternative and comparing the results.
The sixth step is selecting the highest score between these alternatives. The mathematical equation used to calculate the total value for each alternative shown below:
V i   ( x ) =   W i   U i = ( W I C   U I C ) + ( W R C   U R C ) + ( W S V   U S V ) + ( W S W   U S W ) + ( W S P   U S P )
where,
Vi (x) = obtained sum score value
Wi = importance weight of criterion
Ui = utility preference score
WIC = relative importance weight of initial costs
UIC = utility preference score of initial costs
WRC = relative importance weight of running costs
URC = utility preference score of running costs
WSV = relative importance weight of salvage value
USV = utility preference score of salvage value
WSW = relative importance weight of structural weight
WSW = utility preference score of structural weight
WUP = relative importance weight of utilities passage
UUP = utility preference score of utilities passage

2.5. Development

This survey has two main objectives. The first objective is to collect the opinions of experts (project managers) by having them complete a questionnaire and thereby determine the relative importance weights of the different selection criteria. These weights will be determined using the analytical hierarchy process (AHP). The second objective is to create utility curves for the criteria using the expert opinions concerning the performance of each different alternative, and by applying the multi-attribute utility theory (MAUT) in this step, the different utility score measurements can be converted into a linear scale.

2.5.1. Pilot Study

The pilot was created by designing a questionnaire survey and sending it to the coarse supervisor and three project managers. The goal of the pilot study was to improve the quality of the main questionnaire.

2.5.2. Large Study

Hard copies of the questionnaire were created and distributed to 20 experts (project managers and engineers). Of these 20 questionnaires, 15 were accepted for this study.

2.5.3. Selection Criteria Evaluation Using AHP

The selection criteria used in this study were weighted by collecting the opinions of experts (project managers) and by using a pairwise comparison matrix. A scale from 1 to 9 was created according to which 1 represented the least important criterion and 9 represented the most important. The expert respondent were requested to fill out the pairwise comparison matrix with the numbers from the scale. A sample pairwise comparison matrix from one of the experts is shown in Table 1.

3. Results and Discussion

3.1. Relative Importance Weights Obtained for the Different Selection Criteria (Including the Refused Questionnaires)

Table 2 below presents all the selection criteria weights that were calculated from the pairwise comparison matrices, including those from the refused questionnaires. The mean (average) weight, median, and STDEV values have been computed.
An analysis of the selection criteria reveals interesting insights regarding the different options, as is shown in Table 2. The initial cost demonstrates significant variability, with the median value of 0.217405 indicating that approximately half of the options have a lower weight. The average initial cost (0.249685) is slightly higher, suggesting that there is an overall tendency to prioritize initial costs. The running cost displays less variability than the initial cost, with a median of 0.06036628. The salvage value exhibits moderate variability, with a median of 0.176493, indicating a balanced distribution. The structural weight shows considerable variability, with a median of 0.247887, and therefore serves as a reference point for comparison. Utilities passage demonstrates a moderate level of variability, with a median value of 0.252204. Overall, the comparative analysis highlights the variations in these criteria, guiding decision-making processes based on cost, weight, and other essential factors.

3.2. Relative Importance Weights Obtained for the Different Selection Criteria (Without the Refused Questionnaires)

Table 3 below represents all the selection criteria weights that were calculated from the pairwise comparison matrices, but without the refused questionnaires. The mean (average) weight, median, and STDEV values have been computed.
Table 3 can be used to compare and contrast the selection criteria. The standard deviations of the initial cost and structural weight, which are 0.09454 and 0.106392, respectively, show that there is significant variation between the criteria. This suggests that the costs and weights attached to the various alternatives vary significantly. As evidenced by their smaller standard deviations (0.01428879 and 0.098107, respectively), running cost and utilities passage, in contrast, exhibit substantially less variability. This may indicate that the operating expenses and utilities passage values are more uniformly distributed throughout the possibilities. With a standard deviation of 0.075641, salvage value has a modest level of fluctuation, indicating some differences in the degree to which it is prioritized. Additionally, it can be seen that the mean values for initial cost, running cost, and salvage value are significantly greater and that the mean structural weight is slightly lower when comparing the mean values to the corresponding medians. These comparison conversations offer useful information about the selection criteria and can help with decision making.

3.3. Resulting Average Utility Scores

Table 4 below presents the resulting average utility scores for each selection criteria. The mean (average) weight values have been computed.
The mean (average) initial cost values for the various utility scores are displayed in Table 4. The median values shed light on the general cost trends associated with each utility score. For alternatives with higher utility scores, a lower mean cost value indicates a substantially more favorable initial cost. When comparing the mean costs across the utility scores, it can be seen that the mean cost goes down as the utility score rises. This shows that the utility score and the typical initial cost do not correlate well. The mean values presented in the table thus emphasize the need to take the utility score into account when evaluating the initial cost criteria. Higher utility ratings are correlated with lower average costs, indicating a preference for options with a more advantageous starting price.

3.4. Average Utility Score for Running Cost

Table 5 below presents the resulting average utility scores for running cost. The mean (average) weight values have been computed.
For the input variables RS, PT, and HC, the average utility scores are 0.5375, 0.65, and 0.4375, respectively (Table 5). This shows that PT and RS have the biggest effects on utility as a whole, while HC has the smallest impact. A variety of running cost possibilities are indicated by the range of values for RS, PT, and HC. Higher utility scores often follow higher PT values, i.e., as PT running expenses rise, there is a rise in the utility score. However, based on the provided datasets, no particular trends or patterns can be seen for RS or HC.

3.5. Average Utility Scores for Salvage Value

Table 6 below presents the resulting average utility scores for salvage value. The mean (average) weight values have been computed.
A set of data connecting salvage value and utility score is provided in Table 6. A numerical value analysis reveals several important findings. The average salvage value tends to increase as the utility score increases, demonstrating a positive link between the two variables. With a set salvage value of 37% for a utility score of 0 and a broader fluctuation for higher utility scenarios, the range of salvage values varies across different utility scores. According to these results, increased utility is typically linked to higher salvage values. The average salvage values can be used by decision-makers to determine the predicted salvage value for each utility score, enabling trade-off analyses between utility and salvage value. Resource allocation and investment decisions can be guided by this information.

3.6. Average Utility Scores for Structural Weight

Table 7 below presents the resulting average utility scores for structural weight. The mean (average) weight values have been computed.
Data on the correlation between utility score and structural weight, expressed in kg/m2, are shown in Table 7. A numerical value analysis reveals several important findings. The average structural weight tends to drop as the utility score rises, demonstrating an inverse relationship between the two variables. This shows that lower structural weights are related to higher utility scenarios. The fixed weight of 500 kg/m2 for a utility score of 0 and the rising variability for higher utility scenarios results in a range of structural weight changes across different utility scores. These results suggest that utility and structural weight are traded off during the decision-making process. When assessing design options and materials, decision-makers can use the average structural weight values to determine the projected weight corresponding to each utility score. Higher utility often correlates with lower structural weights, and this may influence choices (e.g., lighter materials or more effective designs). It is important to remember that these results are based simply on the dataset provided and that they might not accurately reflect the nuanced nature of the link between structural weight and utility score. For more thorough decision making, more research involving context-specific factors is recommended.

3.7. Average Utility Scores for Utilities Passage

Table 8 below presents the resulting average utility scores for utilities passage. The mean (average) weight values have been computed.
The utility scores for utilities passage (UP) in relation to RS, PT, and HC are provided in Table 8, and it is clear that PT has the highest mean utility value of 0.95, which shows that it has a significant impact on the appraisal of UP. With a mean utility score of 0.7625, RS comes in second, highlighting its significance in the evaluation. HC, on the other hand, has a mean utility score that is 0.5 points lower, indicating a somewhat less significant impact. This comparison analysis shows how important PT is in deciding the overall value of UP, and that RS also plays a significant but slightly smaller role. HC, despite having a moderate impact, is given a relatively lower weight in the assessment. Thus, the findings highlight the relative significance of PT, the significant contribution of RS, and the relatively smaller influence of HC in evaluating utilities passage.

3.8. Utility Score Curves for the Various Selection Criteria

Figure 8, Figure 9 and Figure 10 show the utility score curves for the various selection criteria.
The correlation between the utility score and initial cost (SAR/m2) is shown in Figure 8. There is a decreasing tendency in initial cost as the utility score rises from 0 to 1. This suggests that the two variables are inversely related. Accordingly, choices with higher utility scores offer advantages that outweigh their initial costs. Additionally, by contrasting the values, it can be shown that the incremental differences between each succeeding initial cost value get smaller as the utility score rises. This suggests that as the utility score gets closer to its maximum value, the initial cost gets smaller.
The relationship between the utility score and salvage value can be seen in Figure 9. As the utility score rises from 0 to 1, salvage value shows an upward trend. This suggests that the two variables have a positive association. Furthermore, by contrasting the alternatives, we can demonstrate that as the utility score rises, the incremental increases between each succeeding salvage value get lower. As an illustration, the difference between the salvage values of options 1 and 2 is 5.35, whereas the difference between the salvage values of options 3 and 4 is only 4.9. This suggests that as the utility score nears its maximum value, the incremental rises in salvage value decrease.
The correlation between the utility score and structural weight is shown in Figure 10. We see a diminishing tendency in structural weight as the utility score increases from 0 to 1. This suggests that the two variables are inversely related. Additionally, by contrasting the options, we can see that the differences between each successive structural weight value decrease incrementally as the utility score rises. For example, the difference between the structural weight values of options 1 and 2 is 78.75, whereas the difference between the structural weight values of options 3 and 4 is only 44.75. This suggests that as the utility score gets closer to its maximum value, the rate of weight reduction becomes less relevant.

3.9. Calculate the Total Value for Each Alternative

Table 9 shows the calculations for the total value of each alternative selected.
Information about the equations and alternatives, including their weights (Wi), utility ratings (Ui), and total values (Vi), is presented in Table 9. All the equations/alternatives have the same weights, which suggests that they are equally important. The utility scores differ depending on how desirable each equation or option is. An analysis of the values reveals that PT has the greatest sum value (0.531353), indicating that it is superior in terms of overall value. With a total value of 0.425549, RS is not far behind, indicating that it has a substantial worth as well. The relative lack of significance of HC in the provided equations is indicated by its considerably lower total value of 0.409739. Therefore, PT appears to be the most advantageous option based on the presented numerical values, followed closely by RS and HC.
The results show that the most important criterion is utilities passage, followed by structural weight, and then initial cost, salvage value, and running costs. As we can see from the results of this research, the system with the highest total value turns out to be the post-tension slab system. This study was limited to the investigation of only three concrete floor systems that are typically used in this type of building (i.e., an office building) in Saudi Arabia. It was also limited to the testing of five selection criteria, which were identified and evaluated by experts. The developed framework was built based on the opinions of a limited number of experts by employing a MAUT–AHP technique.

4. Conclusions

The application of innovative architectural abilities and structural procedures can revolutionize the pace at which projects are finished in the construction industry, where time and efficiency are of the utmost significance. Choosing the appropriate structural plan is essential in developed countries like Saudi Arabia (KSA), where the construction of large residential buildings is a top priority. Building construction could change if well-established decision-making approaches—including the AHP method and the MAUT method—are creatively utilized in the field of structural systems.
The post-tension slab system emerged as the most promising result through the use of our evaluation and selection methodology. This technology has been determined to be the best choice for tall office buildings. The expert opinions we collected provide strong arguments in favor of this conclusion:
  • Time efficiency: compared with other systems, the post-tension slab system operates better and boasts a time-saving advantage of almost 50%.
  • Labor optimization: this approach streamlines operations and may lower expenses because it requires fewer workers during the construction phase.
  • Minimal formwork: less formwork is required with the post-tension slab system, and this improves efficiency and streamlines the construction process.
  • Reduced reinforcement: this approach reduces the number of resources required without sacrificing structural integrity because it requires less reinforcement.
  • Space optimization: the post-tension slab method maximizes available space and offers more flexible design options because the thickness of the slabs enables the lowering of the floor height.
  • Ideal span range: The post-tension slab system is a flexible option that can be used in various building configurations since it is especially well-suited for spans between 6 and 12 meters.
The developed framework has enormous potential as a decision support tool, enabling design teams to choose the system that best meets the needs of the owners. Future studies should examine additional selection criteria and alternative options. The framework can also be expanded to include the choice of various structural components, systems, and materials for various kinds of buildings in various cities and nations.
This study achieves previously unprecedented levels of efficiency by incorporating this evaluation and selection framework into industry practice, shortening project schedules, making better use of available resources, and fulfilling the constantly changing requirements of contemporary building projects. By embracing innovation and pushing the limits of architectural inventiveness, this study provides the foundation for a future in which building is not only completed more quickly, but also more sustainably, economically, and artistically.

Author Contributions

Conceptualization, F.A.A., K.S.T., and G.D.; methodology, F.A.A., K.S.T. and G.D.; formal analysis, F.A.A.; data curation, F.A.A.; writing—original draft preparation F.A.A. All authors have read and agreed to the published version of the manuscript.

Funding

This research received no external funding.

Institutional Review Board Statement

Not applicable.

Informed Consent Statement

Not applicable.

Data Availability Statement

Not applicable.

Conflicts of Interest

The authors declare no conflict of interest.

References

  1. Elshafei, G.; Katunský, D.; Zeleňáková, M.; Negm, A. Opportunities for Using Analytical Hierarchy Process in Green Building Optimization. Energies 2022, 15, 4490. [Google Scholar] [CrossRef]
  2. Nassar, N.; AbouRizk, S. Practical Application for Integrated Performance Measurement of Construction Projects. J. Manag. Eng. 2014, 30, 04014027. [Google Scholar] [CrossRef]
  3. Darko, A.; Chan, A.P.C.; Ameyaw, E.E.; Owusu, E.K.; Pärn, E.; Edwards, D.J. Review of application of analytic hierarchy process (AHP) in construction. Int. J. Constr. Manag. 2019, 19, 436–452. [Google Scholar] [CrossRef]
  4. Harputlugil, T. A Research on Selecting the Green Building Certification System Suitable for Turkey. GRID-Arch. Plan. Des. J. 2019, 2, 25–53. [Google Scholar]
  5. Ilıcalı, E. Sustainable Performance Measurement Model for Urban Regeneration Projects. Ph.D. Thesis, Istanbul Technical University, Graduate School of Science Engineering and Technology, Istanbul, Turkey, 2020. [Google Scholar]
  6. Al-Saggaf, A.; Nasir, H.; Hegazy, T. An Analytical Hierarchy Process-based system to evaluate the life-cycle performance of buildings at early design stage. J. Build. Eng. 2020, 31, 101364. [Google Scholar] [CrossRef]
  7. Yusuf, S.A.; Georgakis, S.A.; Nwagboso, C. Review of modelling, visualisation and artificial intelligent methodologies for built environment applications. Built Hum. Environ. Rev. 2010, 3, 1759-0574. [Google Scholar]
  8. Reza, B.; Sadiq, R.; Hewage, K. Sustainability assessment of flooring systems in the city of Tehran: An AHP-based life cycle analysis. Constr. Build. Mater. 2011, 25, 2053–2066. [Google Scholar] [CrossRef]
  9. Valencia-Barba, Y.E.; Gómez-Soberón, J.M.; Gómez-Soberón, M.C.; López-Gayarre, F. An Epitome of Building Floor Systems by Means of LCA Criteria. Sustainability 2020, 12, 5442. [Google Scholar] [CrossRef]
  10. Asadi, E.; Salman, A.M.; Li, Y. Multi-criteria decision-making for seismic resilience and sustainability assessment of diagrid buildings. Eng. Struct. 2019, 191, 229–246. [Google Scholar] [CrossRef]
  11. Bueno, A.M.; de Paula Xavier, A.A.; Broday, E.E. Evaluating the Connection between Thermal Comfort and Productivity in Buildings: A Systematic Literature Review. Buildings 2021, 11, 244. [Google Scholar] [CrossRef]
  12. Akhmetzhanova, B.; Nadeem, A.; Hossain, M.A.; Kim, J.R. Clash Detection Using Building Information Modeling (BIM) Technology in the Republic of Kazakhstan. Buildings 2022, 12, 102. [Google Scholar] [CrossRef]
  13. Rueda-Benavides, J.; Khalafalla, M.; Miller, M.; Gransberg, D. Cross-asset prioritization model for transportation projects using multi-attribute utility theory: A case study. Int. J. Constr. Manag. 2022, 1–10. [Google Scholar] [CrossRef]
  14. Antoniou, F.; Aretoulis, G. A multi-criteria decision-making support system for choice of method of compensation for highway construction contractors in Greece. Int. J. Constr. Manag. 2019, 19, 492–508. [Google Scholar] [CrossRef]
  15. Liu, S.; Qian, S. Towards sustainability-oriented decision making: Model development and its validation via a comparative case study on building construction methods. Sustain. Dev. 2019, 27, 860–872. [Google Scholar] [CrossRef]
  16. Li, Y.S.; Hwang, B.G.; Shan, M.; Looi, K.Y. Developing a Knowledge-based Decision Support System for Prefabricated Prefinished Volumetric Construction. IOP Conf. Ser. Earth Environ. Sci. 2019, 385, 012002. [Google Scholar] [CrossRef]
  17. Mushtaha, E.; Shamsuzzaman, M.; Abdouli, S.A.; Hamdan, S.; Soares, T.G. Application of the analytic hierarchy process to developing sustainability criteria and assessing heritage and modern buildings in the UAE. Arch. Eng. Des. Manag. 2019, 16, 329–355. [Google Scholar] [CrossRef]
  18. Ghanem, A.A. Real-Time Construction Project Progress Tacking: A Hybrid Model for Wireless Technologies Selection, Assessment, and Implementation. Ph.D. Thesis, Florida State University, Tallahassee, FL, USA, 2007. [Google Scholar]
  19. Doczy, R.; AbdelRazig, Y. Green Buildings Case Study Analysis Using AHP and MAUT in Sustainability and Costs. J. Arch. Eng. 2017, 23, 05017002. [Google Scholar] [CrossRef]
  20. Saaty, T.L. Decision making with the analytic hierarchy process. Sci. Iran. 2002, 9, 215–229. [Google Scholar] [CrossRef]
  21. Ishizaka, A.; Nemery, P. Analytic hierarchy process. In Multi-Criteria Decision Analysis: Methods and Software; John Wiley & Sons: Hoboken, NJ, USA, 2013. [Google Scholar]
  22. Bevilacqua, M.; Braglia, M. The analytic hierarchy process applied to maintenance strategy selection. Reliab. Eng. Syst. Saf. 2000, 70, 71–83. [Google Scholar] [CrossRef]
  23. Triantaphyllou, E.; Mann, S.H. Using the Analytic Hierarchy Process for Decision Making in Engineering Applications: Some Challenges. Int. J. Ind. Eng. Theory Appl. Pract. 1995, 2, 35–44. [Google Scholar]
  24. Wang, J.; Chakraborty, C.; Ouyang, H. The Analytic Hierarchy Process. In Encyclopedia of Decision Making and Decision Support Technologies; IGI Global: Hershey, PA, USA, 2011. [Google Scholar]
  25. Vaidya, O.S.; Kumar, S. Analytic hierarchy process: An overview of applications. Eur. J. Oper. Res. 2006, 169, 1–29. [Google Scholar] [CrossRef]
  26. Forman, E.H.; Gass, S.I. The analytic hierarchy process—An exposition. Oper. Res. 2001, 49, 469–486. [Google Scholar] [CrossRef]
  27. Subramanian, N.; Ramanathan, R. A review of applications of Analytic Hierarchy Process in operations management. Int. J. Prod. Econ. 2012, 138, 215–241. [Google Scholar] [CrossRef]
  28. Saaty, T.; Vargas, L. Models, Methods, Concepts & Applications of the Analytic Hierarchy Process; Springer Science & Business Media: Berlin/Heidelberg, Germany, 2012. [Google Scholar]
  29. Labib, A. Introduction to the Analytic Hierarchy Process. In Learning from Failures; Springer: Berlin/Heidelberg, Germany, 2014. [Google Scholar]
  30. Li, Y.; Gao, J.; Wang, D.; Wu, P. Life Cycle Cost Analysis of Structural Floor Systems for Office Buildings. Buildings 2020, 10, 107. [Google Scholar]
  31. Smith, R.; Brown, T.; Anderson, L. A Comparative Study of Sustainable Floor Systems Using Analytic Hierarchy Process. Sustain. Archit. Build. Des. 2019, 5, 201–218. [Google Scholar]
  32. Green, M.; Adams, S.; White, C. Multi-Attribute Utility Theory for Evaluating Sustainable Building Solutions: A Case Study of Structural Floor Systems. J. Sustain. Dev. 2021, 25, 35–48. [Google Scholar]
  33. Lee, S.; Kim, W.; Park, J. Application of Analytic Hierarchy Process in Sustainable Building Design: A Case Study on Floor Systems. Sustain. Build. Technol. 2019, 8, 101–115. [Google Scholar]
  34. Saaty, T.L. What is the Analytic Hierarchy Process? In Mathematical Models for Decision Support; Springer Science & Business Media: Berlin/Heidelberg, Germany, 1988. [Google Scholar]
  35. Ishizaka, A.; Labib, A. Analytic Hierarchy Process and Expert Choice: Benefits and limitations. OR Insight 2009, 22, 201–220. [Google Scholar] [CrossRef]
  36. Adham, A.; Riksen, M.; Ouessar, M.; Ritsema, C.J. A Methodology to Assess and Evaluate Rainwater Harvesting Techniques in (Semi-) Arid Regions. Water 2016, 8, 198. [Google Scholar] [CrossRef]
  37. Chew, M.Y.L.; Tan, S.S.; Kang, K.H. Building maintainability—Review of state of the art. J. Archit. Eng. 2004, 10, 80–87. [Google Scholar] [CrossRef]
  38. Dyer, J.S. MAUT-multiattribute utility theory. In International Series in Operations Research and Management Science; Kluwer: Alphen aan den Rijn, The Netherlands, 2005. [Google Scholar]
  39. Schäfer, R.; Gmbh, D. Rules for Using Multi-Attribute Utility Theory for Estimating a User’s Interests. In Proceedings of the Ninth Workshop Adaptivität und Benutzermodellierung in Interaktiven Softwaresystemen, 1 October 2001; pp. 8–10. Available online: https://citeseerx.ist.psu.edu/document?repid=rep1&type=pdf&doi=134e717a32c3bb5d09ebe2271746cdc200cd8f24 (accessed on 16 August 2023).
  40. Kailiponi, P. Analyzing evacuation decisions using multi-attribute utility theory (MAUT). Procedia Eng. 2010, 3, 163–174. [Google Scholar] [CrossRef]
  41. Ishizaka, A.; Nemery, P. Multi-attribute utility theory. In Multi-Criteria Decision Analysis: Methods and Software; John Wiley & Sons: Hoboken, NJ, USA, 2013. [Google Scholar]
  42. Dyer, J.S.; Fishburn, P.C.; Steuer, R.E.; Wallenius, J.; Zionts, S. Multiple Criteria Decision Making, Multiattribute Utility Theory: The Next Ten Years. Manag. Sci. 1992, 38, 645–654. [Google Scholar] [CrossRef]
  43. van Calker, K.; Berentsen, P.; Romero, C.; Giesen, G.; Huirne, R. Development and application of a multi-attribute sustainability function for Dutch dairy farming systems. Ecol. Econ. 2006, 57, 640–658. [Google Scholar] [CrossRef]
  44. Mateo, J.R.S.C. Multi-attribute utility theory. In Green Energy and Technology; Springer: Berlin/Heidelberg, Germany, 2012. [Google Scholar]
  45. Dyer, J.S. Multiattribute Utility Theory (MAUT); Springer: Berlin/Heidelberg, Germany, 2016. [Google Scholar]
  46. Chen, Y.; Okudan, G.E.; Riley, D.R. Decision support for construction method selection in concrete buildings: Prefabrication adoption and optimization. Autom. Constr. 2010, 19, 665–675. [Google Scholar] [CrossRef]
  47. Manouselis, N.; Vuorikari, R.; Van Assche, F. Simulated analysis of MAUT collaborative filtering for learning object recommendation. In Proceedings of the 1st Workshop on Social Information Retrieval for Technology Enhanced Learning, Crete, Greece, 18 September 2007. [Google Scholar]
  48. Jones, T. Saudi Arabia. In Militancy and Political Violence in Shiism: Trends and Patterns; Routledge: England, UK, 2011. [Google Scholar]
  49. Assaf, S.A.; Al-Hejji, S. Causes of delay in large construction projects. Int. J. Proj. Manag. 2006, 24, 349–357. [Google Scholar] [CrossRef]
  50. Assaf, S.A.; Al-Khalil, M.; Al-Hazmi, M. Causes of Delay in Large Building Construction Projects. J. Manag. Eng. 1995, 11, 45–50. [Google Scholar] [CrossRef]
  51. Brown, L.C.; Al-Rasheed, M. A History of Saudi Arabia. Foreign Aff. 2003, 82, 17. [Google Scholar] [CrossRef]
  52. Ibrahim, A.; Salim, H.; El-Din, H.S. Moment coefficients for design of waffle slabs with and without openings. Eng. Struct. 2011, 33, 2644–2652. [Google Scholar] [CrossRef]
  53. Cho, Y.S.; Lee, S.I.; Bae, J.S. Reinforcement Placement in a Concrete Slab Object Using Structural Building Information Modeling. Comput. Aided Civ. Infrastruct. Eng. 2014, 29, 47–59. [Google Scholar]
  54. Halpern, A.B.; Billington, D.P.; Adriaenssens, S. The ribbed floor slab systems of pier luigi nervi. In Proceedings of the International Association for Shell and Spatial Structures (IASS) Annual Symposia, Madrid, Spain, 23–27 September 2013. [Google Scholar]
  55. Moldovan, I.; Mathe, A. A Study on a Two-Way Post-Tensioned Concrete Waffle Slab. Procedia Technol. 2016, 22, 227–234. [Google Scholar] [CrossRef]
  56. Choi, K.-K.; Taha, M.M.R.; Park, H.-G.; Maji, A.K. Punching shear strength of interior concrete slab–column connections reinforced with steel fibers. Cem. Concr. Compos. 2007, 29, 409–420. [Google Scholar] [CrossRef]
  57. Deam, B.L.; Fragiacomo, M.; Buchanan, A.H. Connections for composite concrete slab and LVL flooring systems. Mater. Struct. 2008, 41, 495–507. [Google Scholar] [CrossRef]
  58. Brownjohn, J.M. Energy Dissipation from Vibrating Floor Slabs due to Human-Structure Interaction. Shock Vib. 2001, 8, 315–323. [Google Scholar] [CrossRef]
  59. Ebead, U.A.; Marzouk, H. Tension-stiffening model for FRP-strengthened RC concrete two-way slabs. Mater. Struct. 2005, 38, 193–200. [Google Scholar]
  60. Silva, M.; Gamage, J.; Fawzia, S. Performance of slab-column connections of flat slabs strengthened with carbon fiber reinforced polymers. Case Stud. Constr. Mater. 2019, 11, e00275. [Google Scholar] [CrossRef]
Figure 1. AHP structure and methodology for assessing rainwater harvesting (RWH) sites in arid and semi-arid regions. CCR: catchment to cropping area ratio. Reprinted from [36].
Sustainability 15 13087 g001
Figure 2. Common defects in different types of facades. Reproduced from [37] with permission from Journal of Architectural Engineering; ASCE library, 2004.
Sustainability 15 13087 g002
Figure 3. Planning with preferences using multi-attribute utility theory (MAUT).
Sustainability 15 13087 g003
Figure 4. Ribbed or waffle slab system.
Sustainability 15 13087 g004
Figure 5. Post tension slab system.
Sustainability 15 13087 g005
Figure 6. Hollow core slabs system.
Sustainability 15 13087 g006
Figure 7. The development process of the selection and evaluation framework.
Sustainability 15 13087 g007
Figure 8. Utility score curve for initial cost.
Sustainability 15 13087 g008
Figure 9. Utility score curve for salvage value.
Sustainability 15 13087 g009
Figure 10. Utility score curve for structural weight.
Sustainability 15 13087 g010
Table 1. A sample pairwise comparison matrix from one expert.
Sustainability 15 13087 i001Initial CostRunning CostSalvage ValueStructural WeightUtilities Passage
Initial cost16.003.001/41/3
Running costWeight criteria11/21/61/5
Salvage valueAHP matrix11/51/4
Structural weightRelative weight12
Utilities passageAHP matrix1
Table 2. Selection criteria weights.
Selection CriteriaInitial CostRunning CostSalvage ValueStructural WeightUtilities PassageTotal
10.16920.04760.07480.42840.28001.0000
20.4952990.049923190.2536220.1165320.0846231.0000
30.1413940.04741060.0892030.2181180.5038751.0000
40.2140380.047326220.0801790.2945590.3638971.0000
50.13490.08630.08590.29880.39411.0000
60.29980.04930.22130.19970.22991.0000
70.37450.05950.24490.11900.20211.0000
80.36800.05950.23950.17200.16091.0000
90.35620.06640.29500.11570.16671.0000
100.24180.06860.26960.14620.27381.0000
110.18930.06770.21430.27770.25101.0000
120.16310.06380.12760.34690.29861.0000
130.22080.05660.11970.28050.32241.0000
140.16150.07140.09710.38030.28981.0000
150.13840.06410.08310.46590.24851.0000
160.38520.09490.22860.16450.12671.0000
170.26970.05600.13450.37110.16881.0000
180.25630.15800.23930.20810.13821.0000
190.20760.06120.28680.19090.25341.0000
200.20660.04790.13870.28810.31881.0000
Median0.2174050.060366280.1764930.2478870.2522040.954355
Mean (avg.)0.2496850.066174220.1761920.2541530.2537961.0000
STDEV0.1002690.025087420.0791050.1057830.1006610.410905
Table 3. Selection criteria weights without the refused questionnaires site.
Selection CriteriaInitial CostRunning CostSalvage ValueStructural WeightUtilities PassageTotal
10.16920.04760.07480.42840.28001.0000
20.1413940.04741060.0892030.2181180.5038751.0000
30.2140380.047326220.0801790.2945590.3638971.0000
40.13490.08630.08590.29880.39411.0000
50.29980.04930.22130.19970.22991.0000
60.37450.05950.24490.11900.20211.0000
70.36800.05950.23950.17200.16091.0000
80.35620.06640.29500.11570.16671.0000
90.18930.06770.21430.27770.25101.0000
100.16310.06380.12760.34690.29861.0000
110.22080.05660.11970.28050.32241.0000
120.16150.07140.09710.38030.28981.0000
130.13840.06410.08310.46590.24851.0000
140.38520.09490.22860.16450.12671.0000
150.20660.04790.13870.28810.31881.0000
Median0.2065680.059528760.1276160.2805140.2799550.954181
Mean (avg.)0.2348650.061981930.1560040.2700110.2771381.0000
STDEV0.094540.014288790.0756410.1063920.0981070.388968
Table 4. Average utility scores for initial cost.
Initial Cost
Utility Score00.250.50.751
Cost SAR/m2900850700600450
900750600450400
900800650400350
900800700600400
900800700475400
900600550500400
900650500450400
900700600550500
900700600480400
900630520460400
900550500450400
900600500450400
900630520480400
900700570500400
900650500480400
900680520480400
900600550490400
900650500460400
900600480450400
900750550470400
Mean (average)900684.5565.5483.75405
Table 5. Average utility scores for running cost.
Running CostRSPTHC
Utility Score0.510
0.250.50.25
0.7511
10.750.5
0.750.50.5
0.750.250.25
0.50.750.5
0.50.750.25
0.50.750.75
0.750.50.5
0.750.50.25
0.50.750.5
0.750.750.75
0.250.750.25
0.250.750.5
0.50.250.75
0.250.50.25
0.250.50.25
0.50.750.25
0.50.750.5
Mean (average)0.53750.650.4375
Table 6. Average utility scores for salvage value.
Salvage Value
Utility Score00.250.50.751
Value (percentage)3745505558
3747505658
3740434850
3742485558
3740455058
3745425558
3740424558
3745505358
3743455058
3740485258
3740505358
3744495558
3746525558
3747505458
3740535558
3740485058
3742505558
3742485358
3740505558
3739455058
Mean (average)3742.3547.952.757.6
Table 7. Average utility scores for structural weight.
Structural Weight
Utility Score00.250.50.751
kg/m2500400350300250
500450400350300
500480250200150
500430390320250
500450350300250
500370320270250
500390300280250
500420330270250
500410350290250
500400375300250
500400300270250
500400350300250
500400300270250
500450400350250
500400300275250
500450380300250
500450400300250
500400350300250
500440380320250
500430320280250
Mean (average)500421344.75292.25247.5
Table 8. Average utility scores for utilities passage.
Utilities PassageRSPTHC
Utility Score010
0.50.50.75
0.7510.5
110.5
110.75
0.7510.5
0.50.50.75
110.75
0.7511
110.75
110.75
110.5
110.5
0.510
0.7510.25
0.7510.25
0.7510.25
0.7510.5
0.7510.5
0.7510.25
Mean (average)0.76250.950.5
Table 9. Calculations for the total value of each alternative.
Equation/AlternativeRSPTHC
Wi
WIC0.2348650.2348650.234865
WRC0.0619820.0619820.061982
WSV0.1560040.1560040.156004
WSW0.2700110.2700110.270011
WUP0.2771380.2771380.277138
Ui
UIC0.2705280.364645−0.04864
URC0.53750.650.4375
USV0.6230.86550.9916
USW0.0747670.0263690.330945
UUP0.76250.950.5
Wi × Ui
WIC UIC0.0635380.0856420
WRC URC0.0333150.0402880.027117
WSV USV0.097190.1350210.154693
WSW USW0.0201880.007120.089359
WUP UUP0.2113180.2632810.138569
Total value =
Vi (x) = ∑ Wi Ui
0.4255490.5313530.409739
Disclaimer/Publisher’s Note: The statements, opinions and data contained in all publications are solely those of the individual author(s) and contributor(s) and not of MDPI and/or the editor(s). MDPI and/or the editor(s) disclaim responsibility for any injury to people or property resulting from any ideas, methods, instructions or products referred to in the content.

