Article

Pore Scale Simulation of Rheology Properties on Residence Time of Polymer Hydrogel and Hydraulic Conductivity of Bentonite Polymer Composite Geosynthetic Clay Liners

1
School of Mechanics and Engineering Science, Shanghai University, Shanghai 200444, China
2
School of Civil Engineering, Qinghai University, Xining 810016, China
3
School of Engineering, University of Virginia, Charlottesville, VA 22904, USA
*
Author to whom correspondence should be addressed.
Sustainability 2023, 15(17), 13052; https://doi.org/10.3390/su151713052
Submission received: 14 July 2023 / Revised: 18 August 2023 / Accepted: 26 August 2023 / Published: 30 August 2023
(This article belongs to the Special Issue Sustainable Management and Remediation of Landfills)

Abstract

:
Flow in an idealized bentonite polymer composite geosynthetic clay liner (BPC-GCL) containing bentonite comprising two idealized circular granules was simulated using a COMSOL hydrodynamic model. The effect of the polymer rheology properties, including viscosity, surface tension, and contact angle, on the hydraulic conductivity of BPC-GCLs was investigated. The results showed that the hydraulic conductivity of BPC-GCLs significantly decreased by 2–4 orders of magnitude with polymer loadings of 3.3%, 6.5%, and 9.8% compared to conventional geosynthetic clay liners (GCLs). The polymer rheology properties are critical to the residence time and the hydraulic conductivity of BPC-GCLs. The residence time increases with the viscosity, surface tension, and contact angle of polymer hydrogel. In the overall study, the hydraulic conductivities increased significantly from 2.80 × 10⁻⁹ m/s to 1.40 × 10⁻⁷ m/s when the residence time was insufficient. When the viscosity of the polymer hydrogel is 5000 Pa∙s, 1 × 10⁴ Pa∙s, and 1 × 10⁵ Pa∙s, the residence time of the polymer hydrogel in the domain of BPC-GCLs is 14 min, 23 min, and 169 min, respectively. When the surface tension of the polymer hydrogel is 0 N/m, 0.01 N/m, and 0.02 N/m, the residence time of the polymer hydrogel in the domain of BPC-GCLs is 9 min, 17 min, and 23 min, respectively. When the contact angle between the polymer hydrogel and the NaB granules is 30° to 60°, the residence time of the polymer hydrogel in the domain of BPC-GCLs is 9 min and 33 min. These few minutes can approximate the actual passage of several days in physical time. When the viscosity, the surface tension, and the contact angle are higher than 1 × 10⁶ Pa∙s, 0.03 N/m, and 60°, the residence time of the polymer hydrogel in the domain of BPC-GCLs tends to be very long, which means that a very low hydraulic conductivity of BPC-GCLs can be maintained in the very long term. This research unveils a nuanced and profound correlation between the rheological properties of the polymer hydrogel and the resulting hydraulic conductivity. This discovery enhances the understanding of the potential to tailor hydrogel characteristics for BPC-GCLs. The advanced model developed in this study also lays the groundwork for constructing a more realistic model that considers irregular geometries, interconnected pores, and diverse polymer distributions within the pore spaces.

1. Introduction

Geosynthetic clay liners (GCLs) are employed widely in various environmental and geotechnical applications, such as landfill barrier liners, owing to their low hydraulic conductivity and cost-effectiveness [1,2,3,4,5,6]. Meanwhile, integrating GCLs in environmental projects showcases a dedication to sustainable development, encompassing economic advancement and societal welfare. By replacing conventional materials, GCLs help conserve resources, mitigating waste and associated risks. Their efficient installation, capacity for pollutant containment, and adherence to regulations all contribute to ecological conservation and the reinforcement of climate resilience [7,8,9,10,11,12,13,14]. However, when bentonite swelling is highly suppressed under aggressive liquid, the hydraulic conductivity can approach hydraulic conductivities like silty sand (~10−6 m/s) [10,14,15,16,17,18,19]. The bentonite polymer composite geosynthetic clay liner (BPC-GCL) showed low hydraulic conductivity (10−11~10−8 m/s) under aggressive liquid with high ionic strength, polyvalent cations, and extreme pH solution [19,20,21,22,23,24,25,26,27,28,29]. A few experimental results have found that the hydraulic conductivity of BPC-GCLs increased as the polymer hydrogels gradually eluted [19,22,24,30,31,32,33,34,35]. However, conventional testing methods, spanning years and even post-equilibrium, might inadequately predict long-term behavior. Meanwhile, the hydraulic mechanism of polymer hydrogel in BPC-GCLs is not precise, and the effect of polymer rheology properties such as viscosity, surface tension, and contact angle on the hydraulic conductivity of BPC-GCLs has not been quantitatively evaluated. To tackle this, a simple two-dimensional hydrodynamic numerical model was developed in this paper to simulate polymer movement within BPC-GCLs, quantitatively assessing the effect of polymer rheology properties on the intergranular flow and hydraulic conductivity of BPC-GCLs and aligning with empirical findings. The model was implemented using COMSOL Multiphysics 5.4, a flexible software package for solving partial differential equations using the finite element method. The hydraulic conductivity of the idealized BPC-GCL was computed from the velocity of the permeating solution at the effluent boundary of the domain. The simulation results provide quantitative evidence regarding the qualitative concept of polymer clogging and elution mechanism for the BPC-GCL. These numerical models also offer a foundational step toward more intricate hydraulic conductivity and service life predictions, addressing the BPC-GCL longevity over extended periods.

2. Hydraulic Model

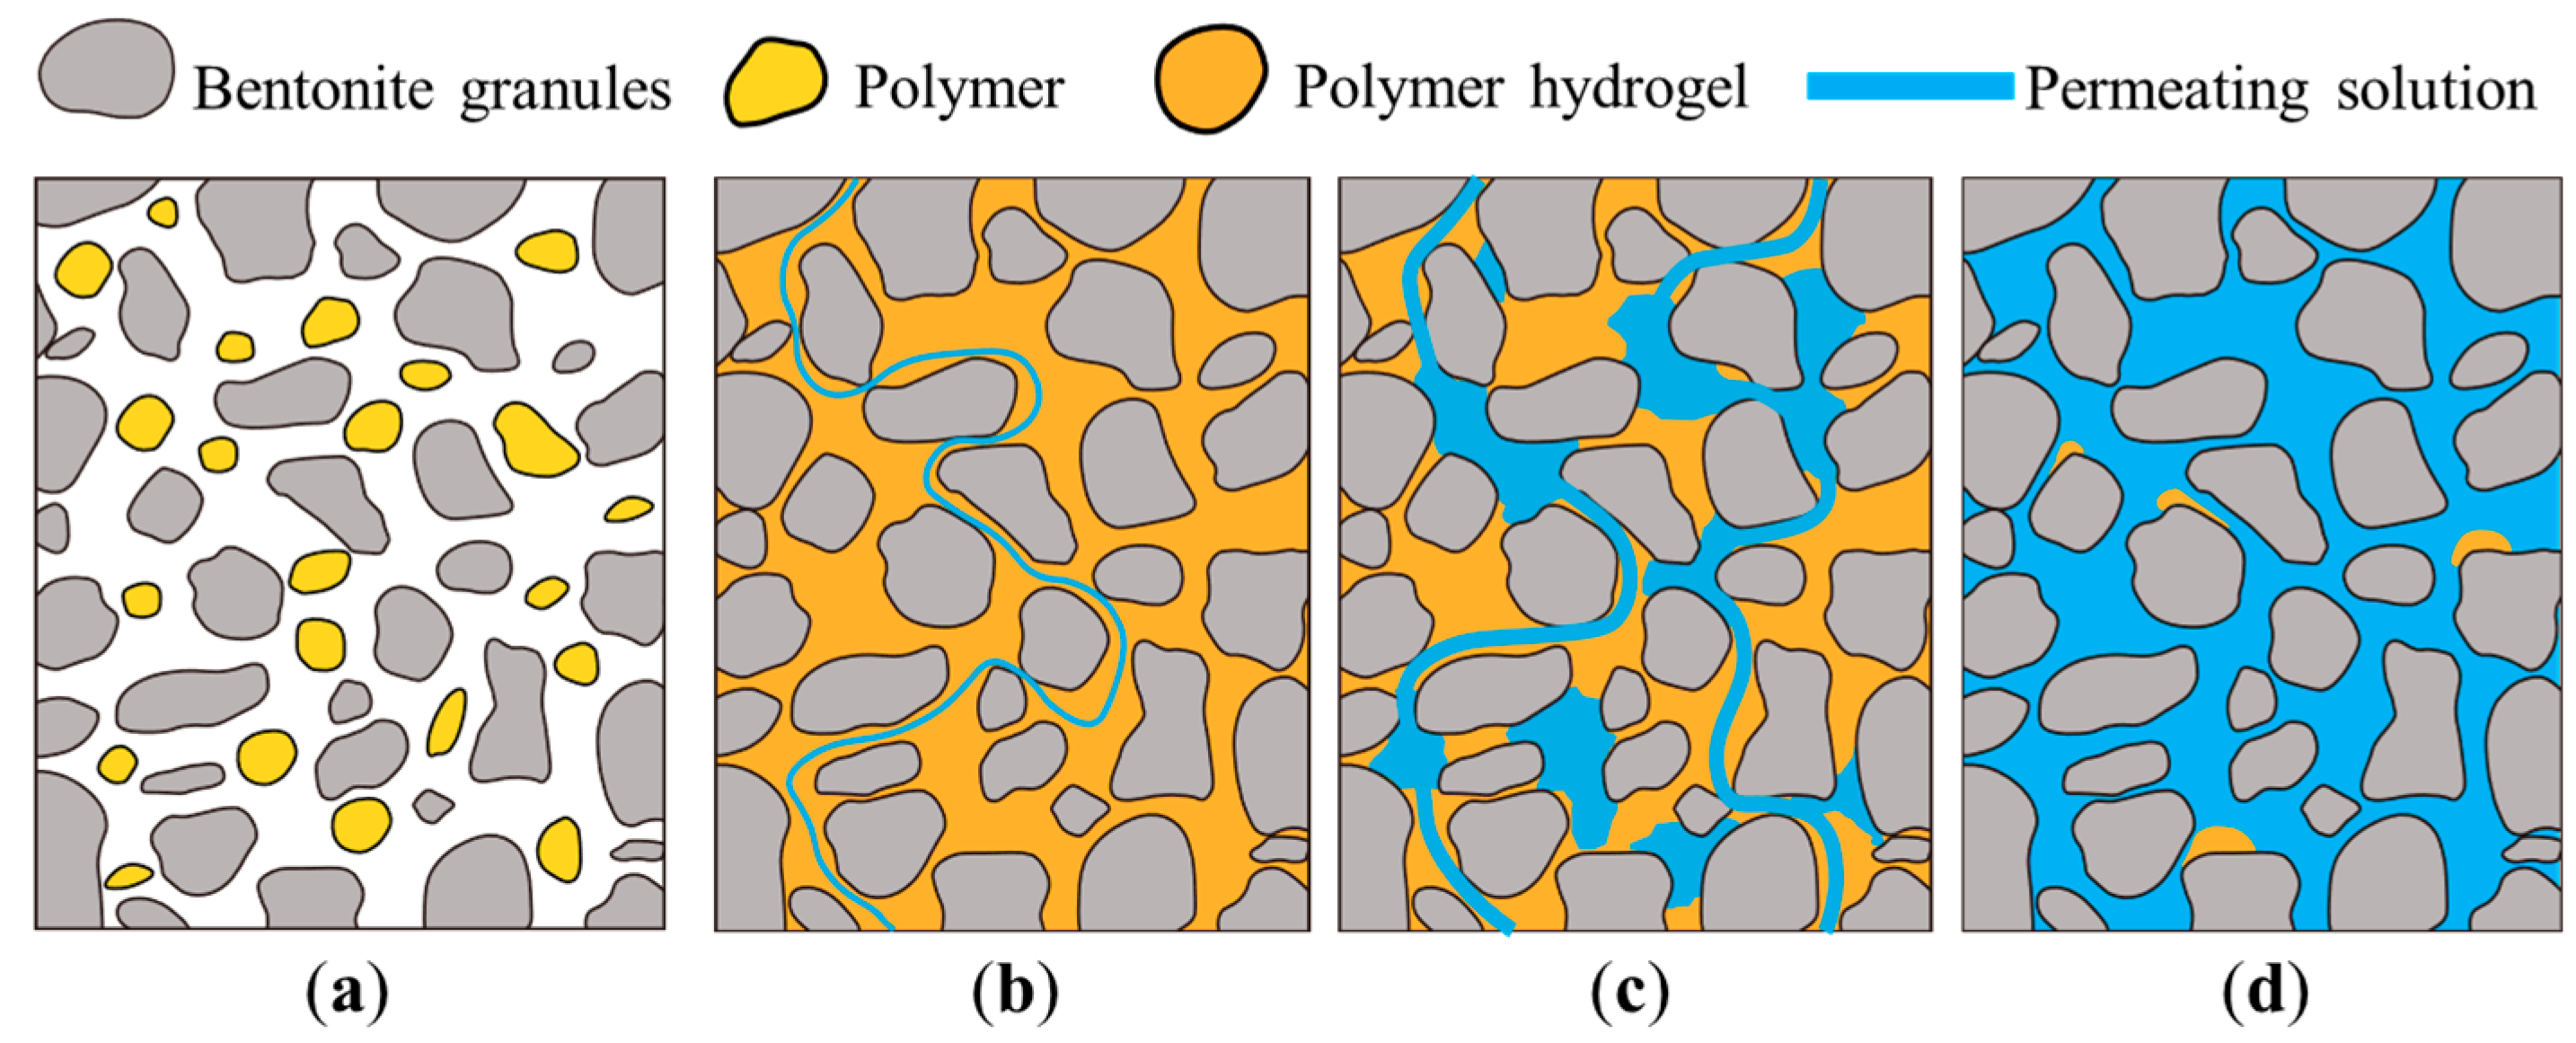
2.1. Conceptual Model

The conceptual model provides a simplified yet insightful framework for understanding the hydraulic behavior of BPC-GCLs. Building upon this conceptual model, a more streamlined conceptual hydraulic model can be formulated. This advancement aims to enhance both the understanding and depiction of the hydraulic behavior of BPC-GCLs, while also spotlighting the impact of the polymer hydrogel on the hydraulic conductivity of BPC-GCLs. Figure 1 illustrates the concept of the BPC-GCL and its hydraulic mechanism. Figure 1a shows the unhydrated BPC-GCL consisting of a control volume of NaB granules, polymers, and intergranular pore spaces. It should be noted that the swelling of the NaB granules during hydration and permeation is highly suppressed and, therefore, needs to be addressed. The intergranular flow is hypothesized to be predominant, and the polymer hydrogels clog almost all the intergranular pore space, resulting in a very tortuous flow path and low hydraulic conductivity (Figure 1b). When the polymer hydrogel began to elute out, part of the intergranular pore spaces initially clogged with polymer hydrogel were reopened, resulting in a broader and less tourist flow path and increased hydraulic conductivity accordingly (Figure 1c). As the permeating process continued, the polymer hydrogel continued to be eluted out by the permeating solution. Therefore, almost all intergranular pore spaces initially clogged with polymer hydrogel were reopened, with flow occurring almost exclusively in the intergranular pore spaces between two adjacent NaB granules (Figure 1d).

2.2. Methodology

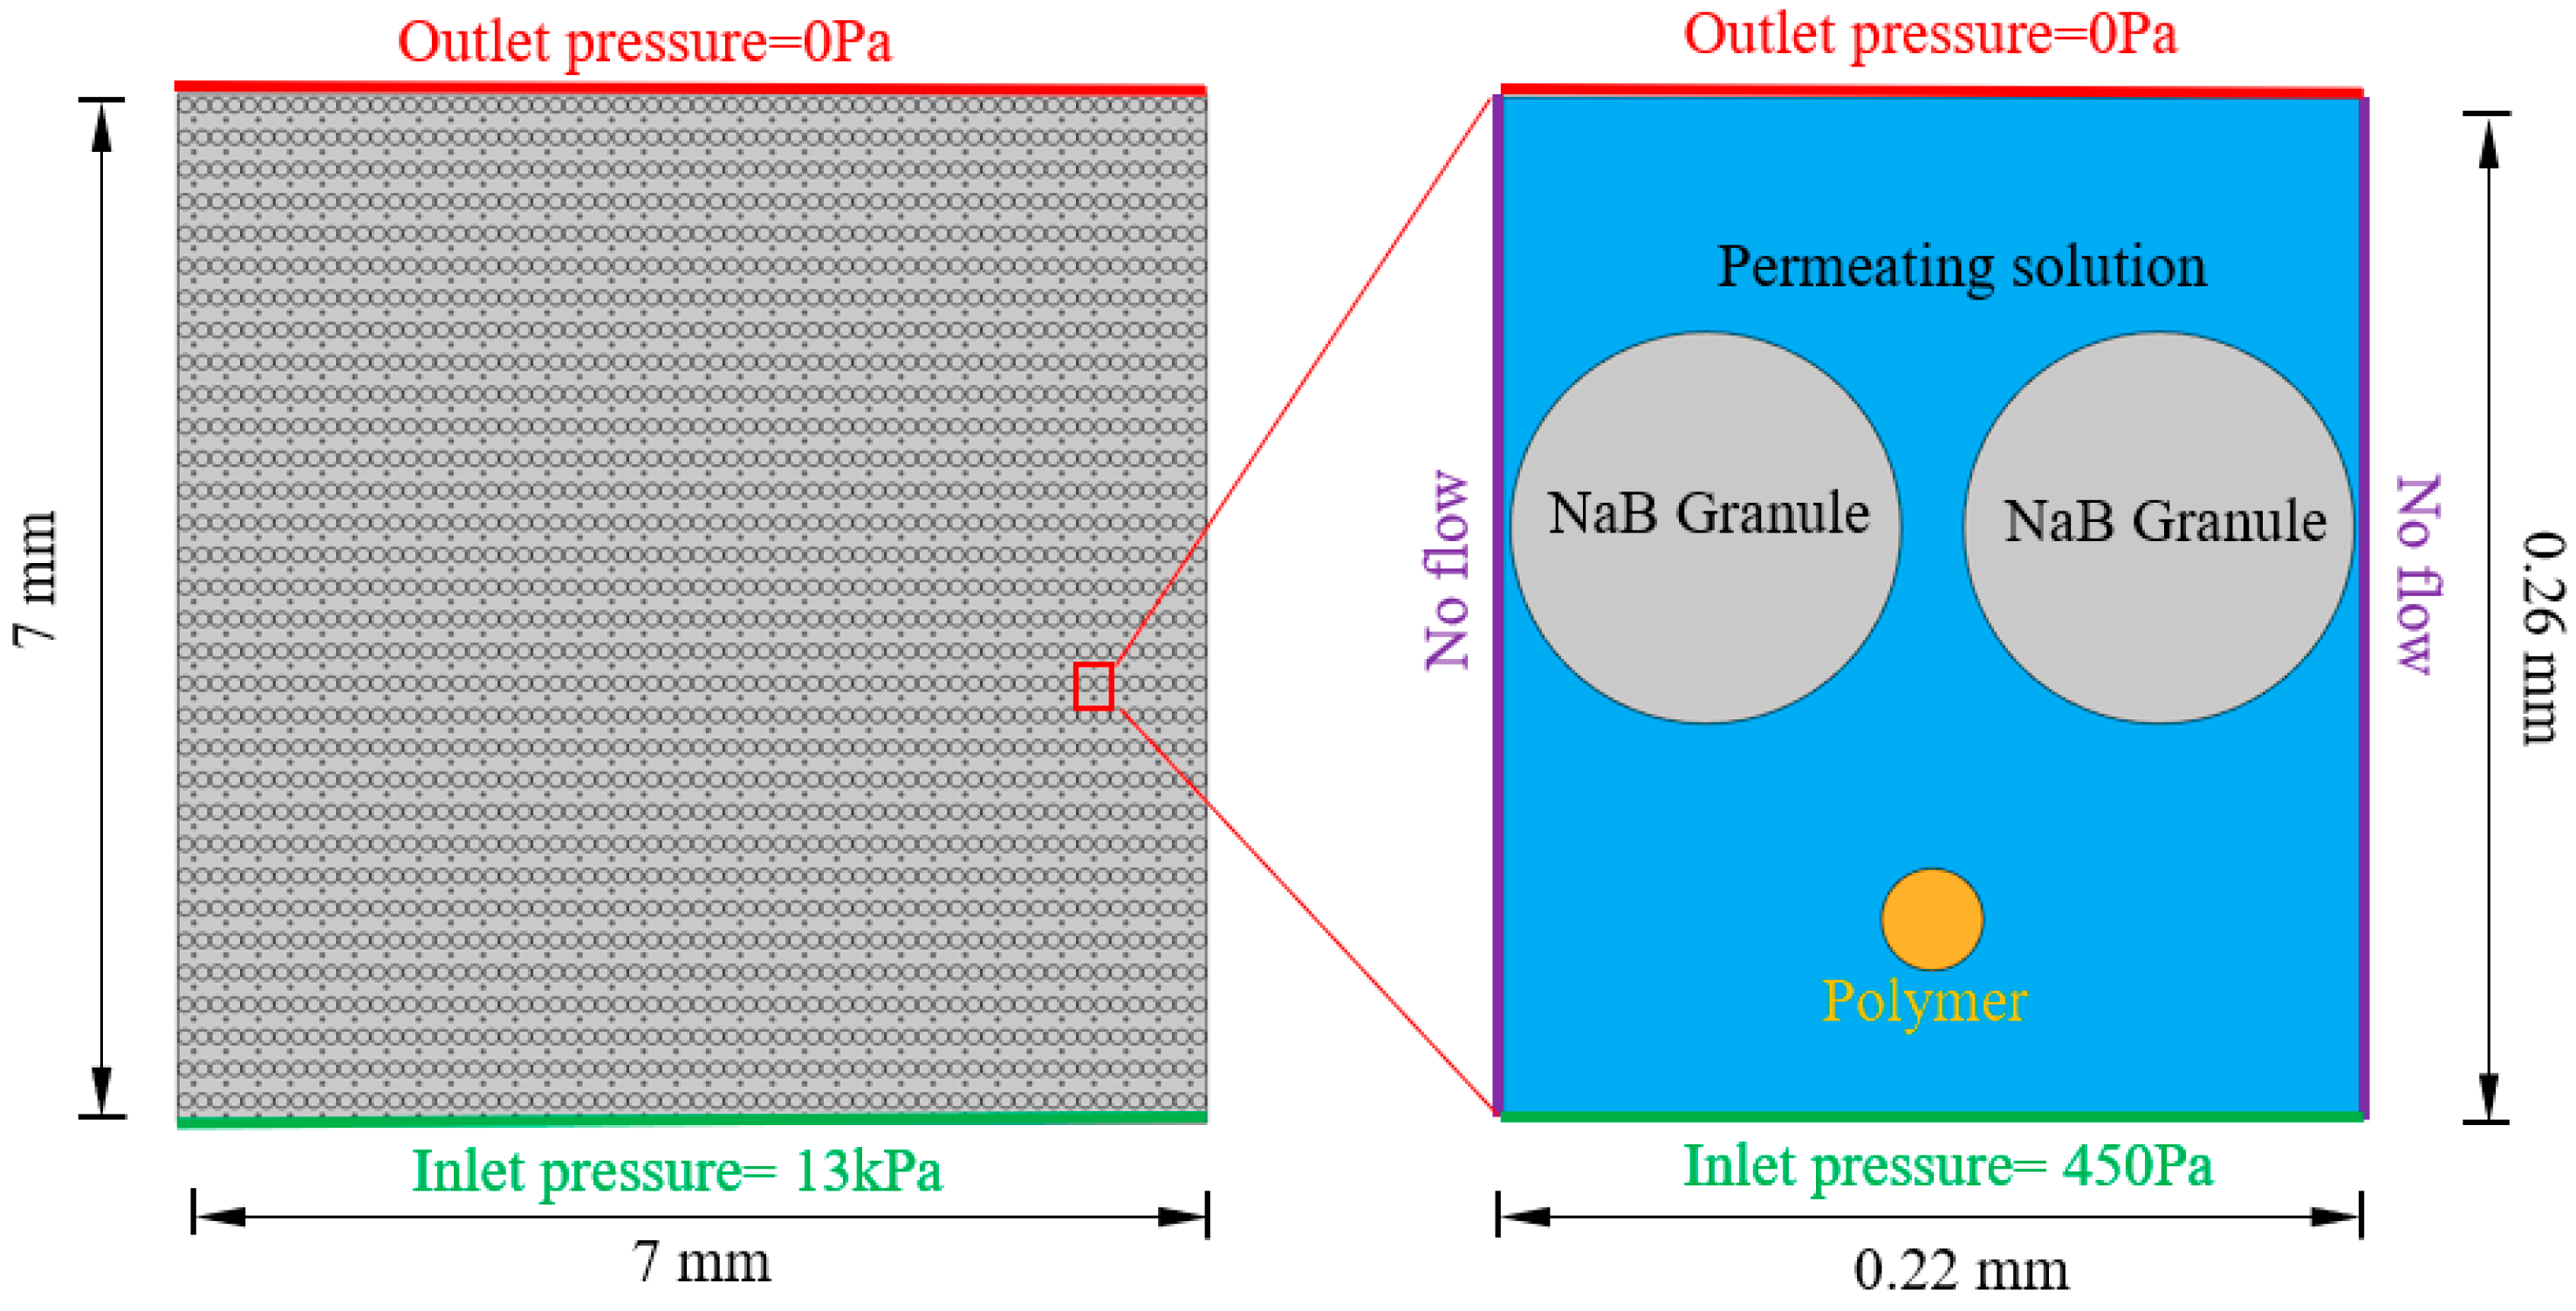
2.2.1. Geometry and Boundary of the Hydraulic Model Domain

The typical thickness of GCLs is usually 7 mm, with granular diameters ranging from 0.002 mm to 1.5 mm [36]. After hydration, the intergranular pores between bentonite granules typically range from 0.001 mm to 0.1 mm [37,38,39,40]. Therefore, based on the typical GCL experiments, a square domain with a 7 mm × 7 mm geometry containing the same simple circular NaB granules and polymer hydrogel was assumed (see Figure 2a). The domain with a 0.22 mm × 0.26 mm geometry, which contains two NaB granules (gray circles, 0.1 mm in diameter) and a polymer hydrogel (yellow circle, 0.026 mm in diameter), was chosen to develop a simple two-dimensional hydrodynamic model (see Figure 2b) using the COMSOL.
The pore width between the NaB granules and the boundary is 0.004 mm. The polymer hydrogel diameter is 0.026 mm, slightly larger than the typical intergranular pores between two NaB granules. The effectiveness and accuracy of this simplified method have been evidenced in previous studies [38,41]. Meanwhile, the water head is approximately 13 kPa in the permeation tests of a GCL with a 7 mm height [42]. Because the developed COMSOL sample is 0.26 mm in height, the inlet pressure can be calculated linearly based on the height ratio of the numerical and experimental sample as follows:
13   kPa ÷ 7   mm × 0.26   mm 0.48   kPa 480   Pa
This is a rough estimation based on a linear relationship calculation. Therefore, a rough value of 450 Pa was selected as the boundary inlet pressure, and the inlet (bottom) and outlet (top) pressure were set to 450 Pa and 0 Pa (Figure 2b), respectively. The remaining two boundaries were considered walls, with no flow occurring.

2.2.2. Fluid Dynamics in the Domain

The polymer hydrogel and permeating solution were developed in the COMAOL hydraulic model using the two-phase flow method. This means that the polymer hydrogel (flow 1) and the permeating solution (flow 2) are treated as two liquid phases. Because the Reynold number (Re) is far smaller than 1 in GCLs and BPC-GCLs [38], the viscous forces drive the primary fluid mechanics and can be calculated by the following simplified Navier–Stokes equations:
u = 0
0 = p + η   ( u + u T )
where u is the fluid velocity field; ∇·u is the divergence of the velocity field; p is the pressure; ∇p is the pressure gradient; η is the viscosity; ∇u is the velocity gradient; and superscript “T” stands for transpose in matrix operations.
To effectively track and describe the interface between the two flows of the polymer hydrogel and permeating solution changing with time, the level set method (LSM) was employed, which can be calculated by the level set function Φ as follows [43,44]:
Φ t + u Φ = γ   ε   Φ Φ ( 1 Φ ) Φ Φ
γ is the reinitialization parameter used to maintain the stability of the interface and is often set to the maximum flow velocity in the domain of the BPC-GCL; ε is the interface thickness controlling parameter and is often set to be half of the maximum mesh size.
Initially, the Φ of the polymer hydrogel (flow 1) and the permeating solution (flow 2) are set to 0 and 1, respectively, and the function Φ transited from 0 to 1 across the interface. Therefore, by combining the LSM method to track the interface change between the polymer hydrogel and the permeation solution with the process of time, the simplified Navier–Stokes equations in the two-phase flow can be expressed as follows:
0 = p + η ( Φ )   ( u + u T )
In which
η ( Φ ) = η 1 + ( η 2 η 1 ) Φ
where η1 and η2 are the constant viscosity of the polymer hydrogel and permeating solution; the COMSOL Multiphysics delivers a solution for Equations (2) and (5), which comprises the transient distribution of flow velocity and two-phase flow boundary (Φ = 0.5 for each time step) within the domain.
The velocity distribution along the top surface (outflow boundary) was integrated and subsequently normalized by the total area of the outflow boundary to derive the Darcy flux, denoted as q. Following this, the hydraulic conductivity of the domain (K) can be calculated as follows:
K = q / i
where i is the hydraulic gradient.

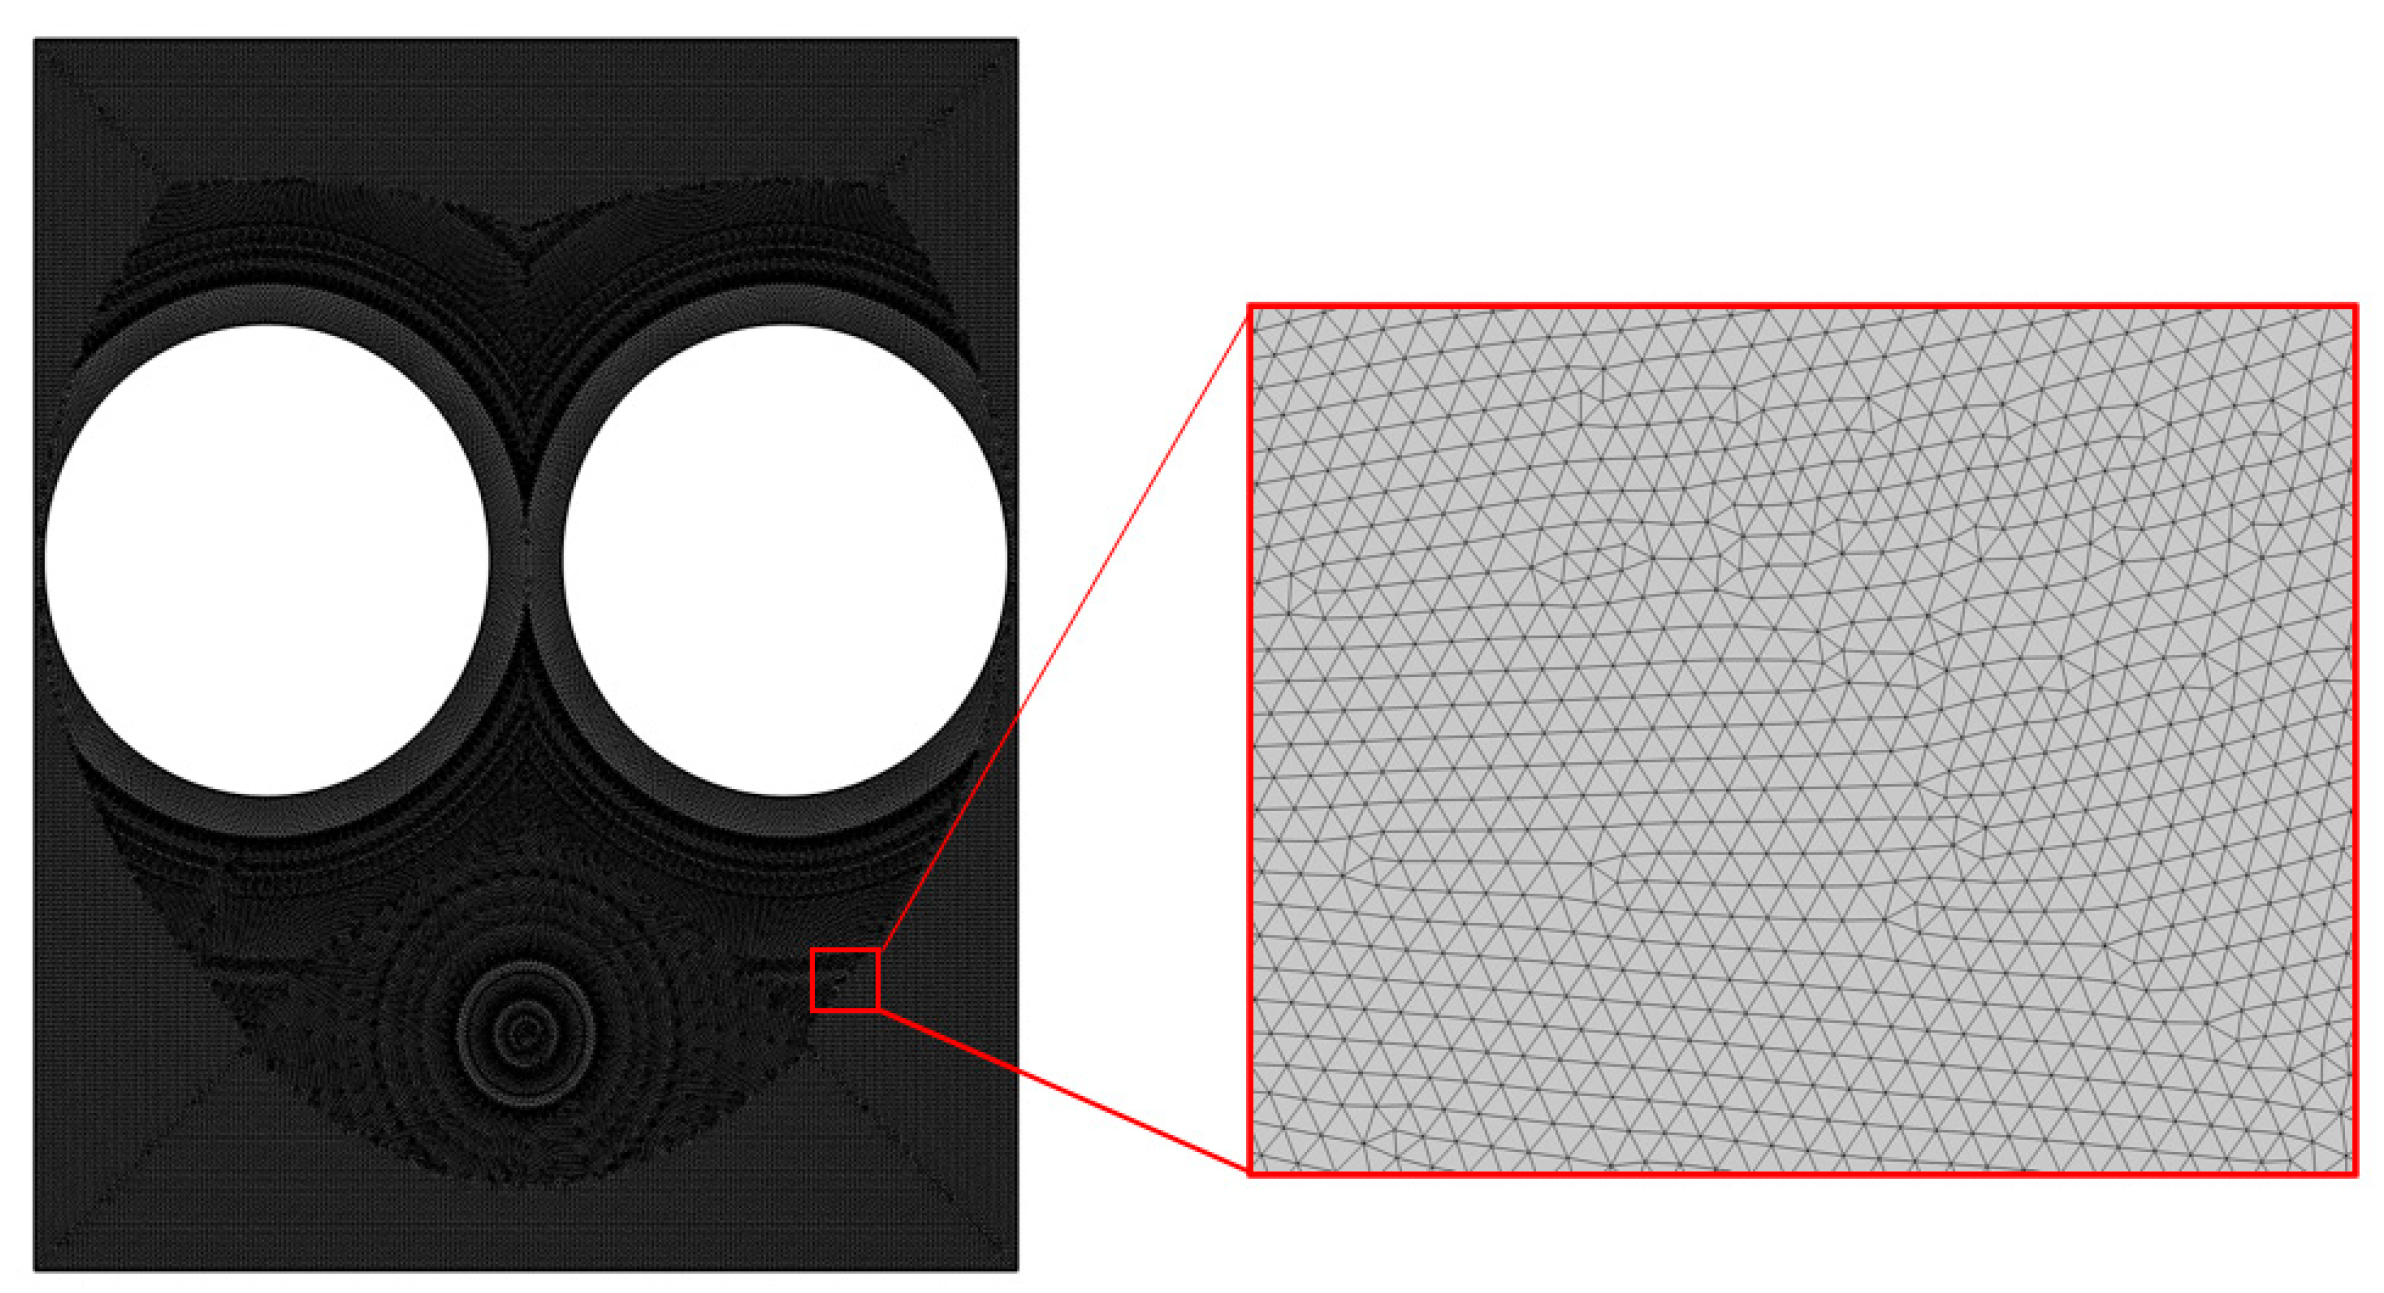
2.2.3. The Mesh and Time Step

It is essential to have a thin interface in a two-phase flow method to achieve an accurate transition. Therefore, a fine mesh is needed to calculate the interface region adequately, whose requirements, known as model and mesh convergence, have been extensively discussed by Zhou et al. [45]. Referring to the investigation of Zhou et al. [45], a highly refined, free triangular mesh was used, as depicted in Figure 3. The mesh consists of 111,776 volume elements and 1638 boundary elements.
The numerical solver controls the time step during the computations, using backward differentiation formulas (BDFs) in COMSOL Multiphysics. The initial time step should be small enough to avoid singularities. Considering the computational accuracy, efficiency, and convergence, the time step is set to 1 s or 1 min, depending on the residence time (tr) of the polymer hydrogel in each model and the purpose of the simulation. The simulation is finished when there is no change in two continuous time steps or the data are enough to illustrate the discussed phenomenon. The tr for different COMSOL models range from 10 to 240 min in this study. Although the tr does not acutely represent the actual physical time (tp), the tp can be roughly calculated using a linear ratio that combines the simulated height and exact height based on the tr in the COMSOL model as follows:
7   mm ÷ 0.26   mm × 10   min 269   min 1.5   h
7   mm ÷ 0.26   mm × 240   min 6462   min 4.5   day
From Equations (8) and (9), it can be calculated that the residence time (tr) ranges from 10 min to 240 min in the COMSOL model and can roughly represent the actual physical time of around 2 h to 5 days, which can be used to mirror the relationship between the rheology properties of the polymer hydrogels and the hydraulic conductivity of BPC-GCLs in actual engineering.

3. Results and Discussion

To address concerns related to sample sizes and statistical considerations, two additional repeated simulations of the model using a viscosity of 5000 Pa·s, a surface tension coefficient of 0.02 N/m, and a contact angle of 30°, all under consistent conditions, were conducted for every repetition. The outcomes of these simulations are presented in Appendix A. The three repeated simulations of an identical model, characterized by uniform parameter settings and boundary conditions, generated curves that demonstrated substantial consistency. This observation underscores the dependability and representativeness of the results obtained from a single numerical simulation. Consequently, a solitary measurement can effectively serve as a representative of average measurements. This principle can be employed to enhance the understanding of tackling issues regarding sample sizes and statistical considerations. Therefore, a single measure can effectively encompass average measurements. As a consequence, all the models are executed only once in the subsequent sections, and there is no presence of standard error in the figures.

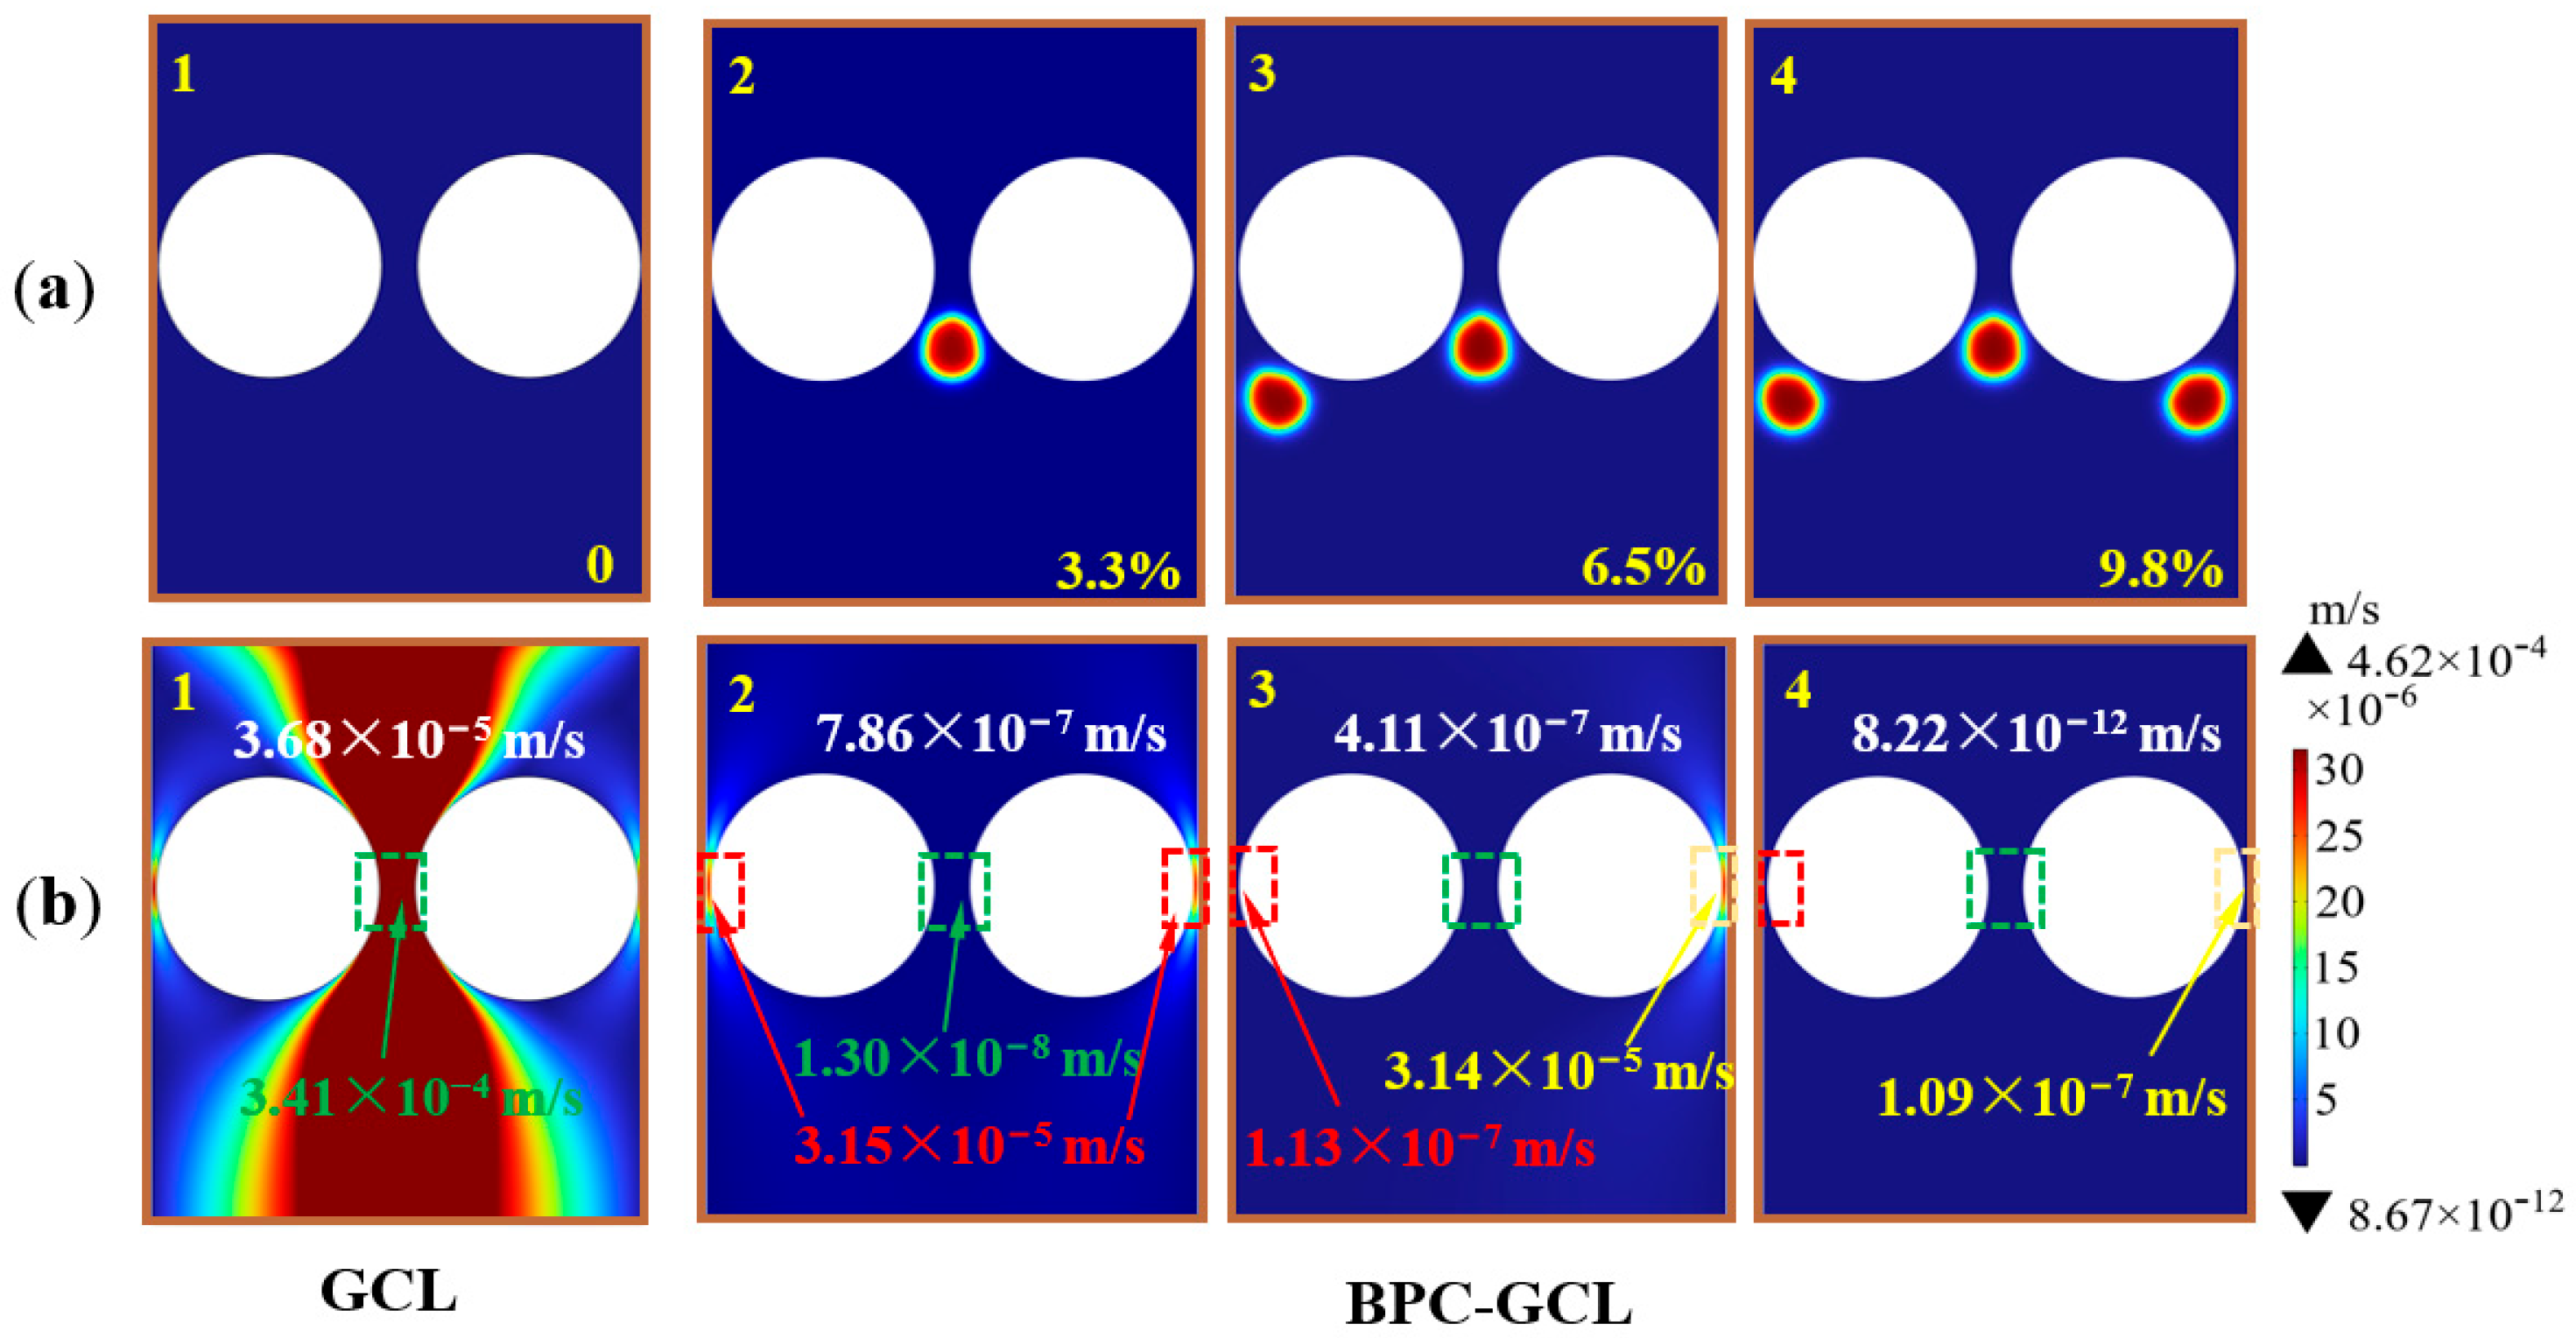
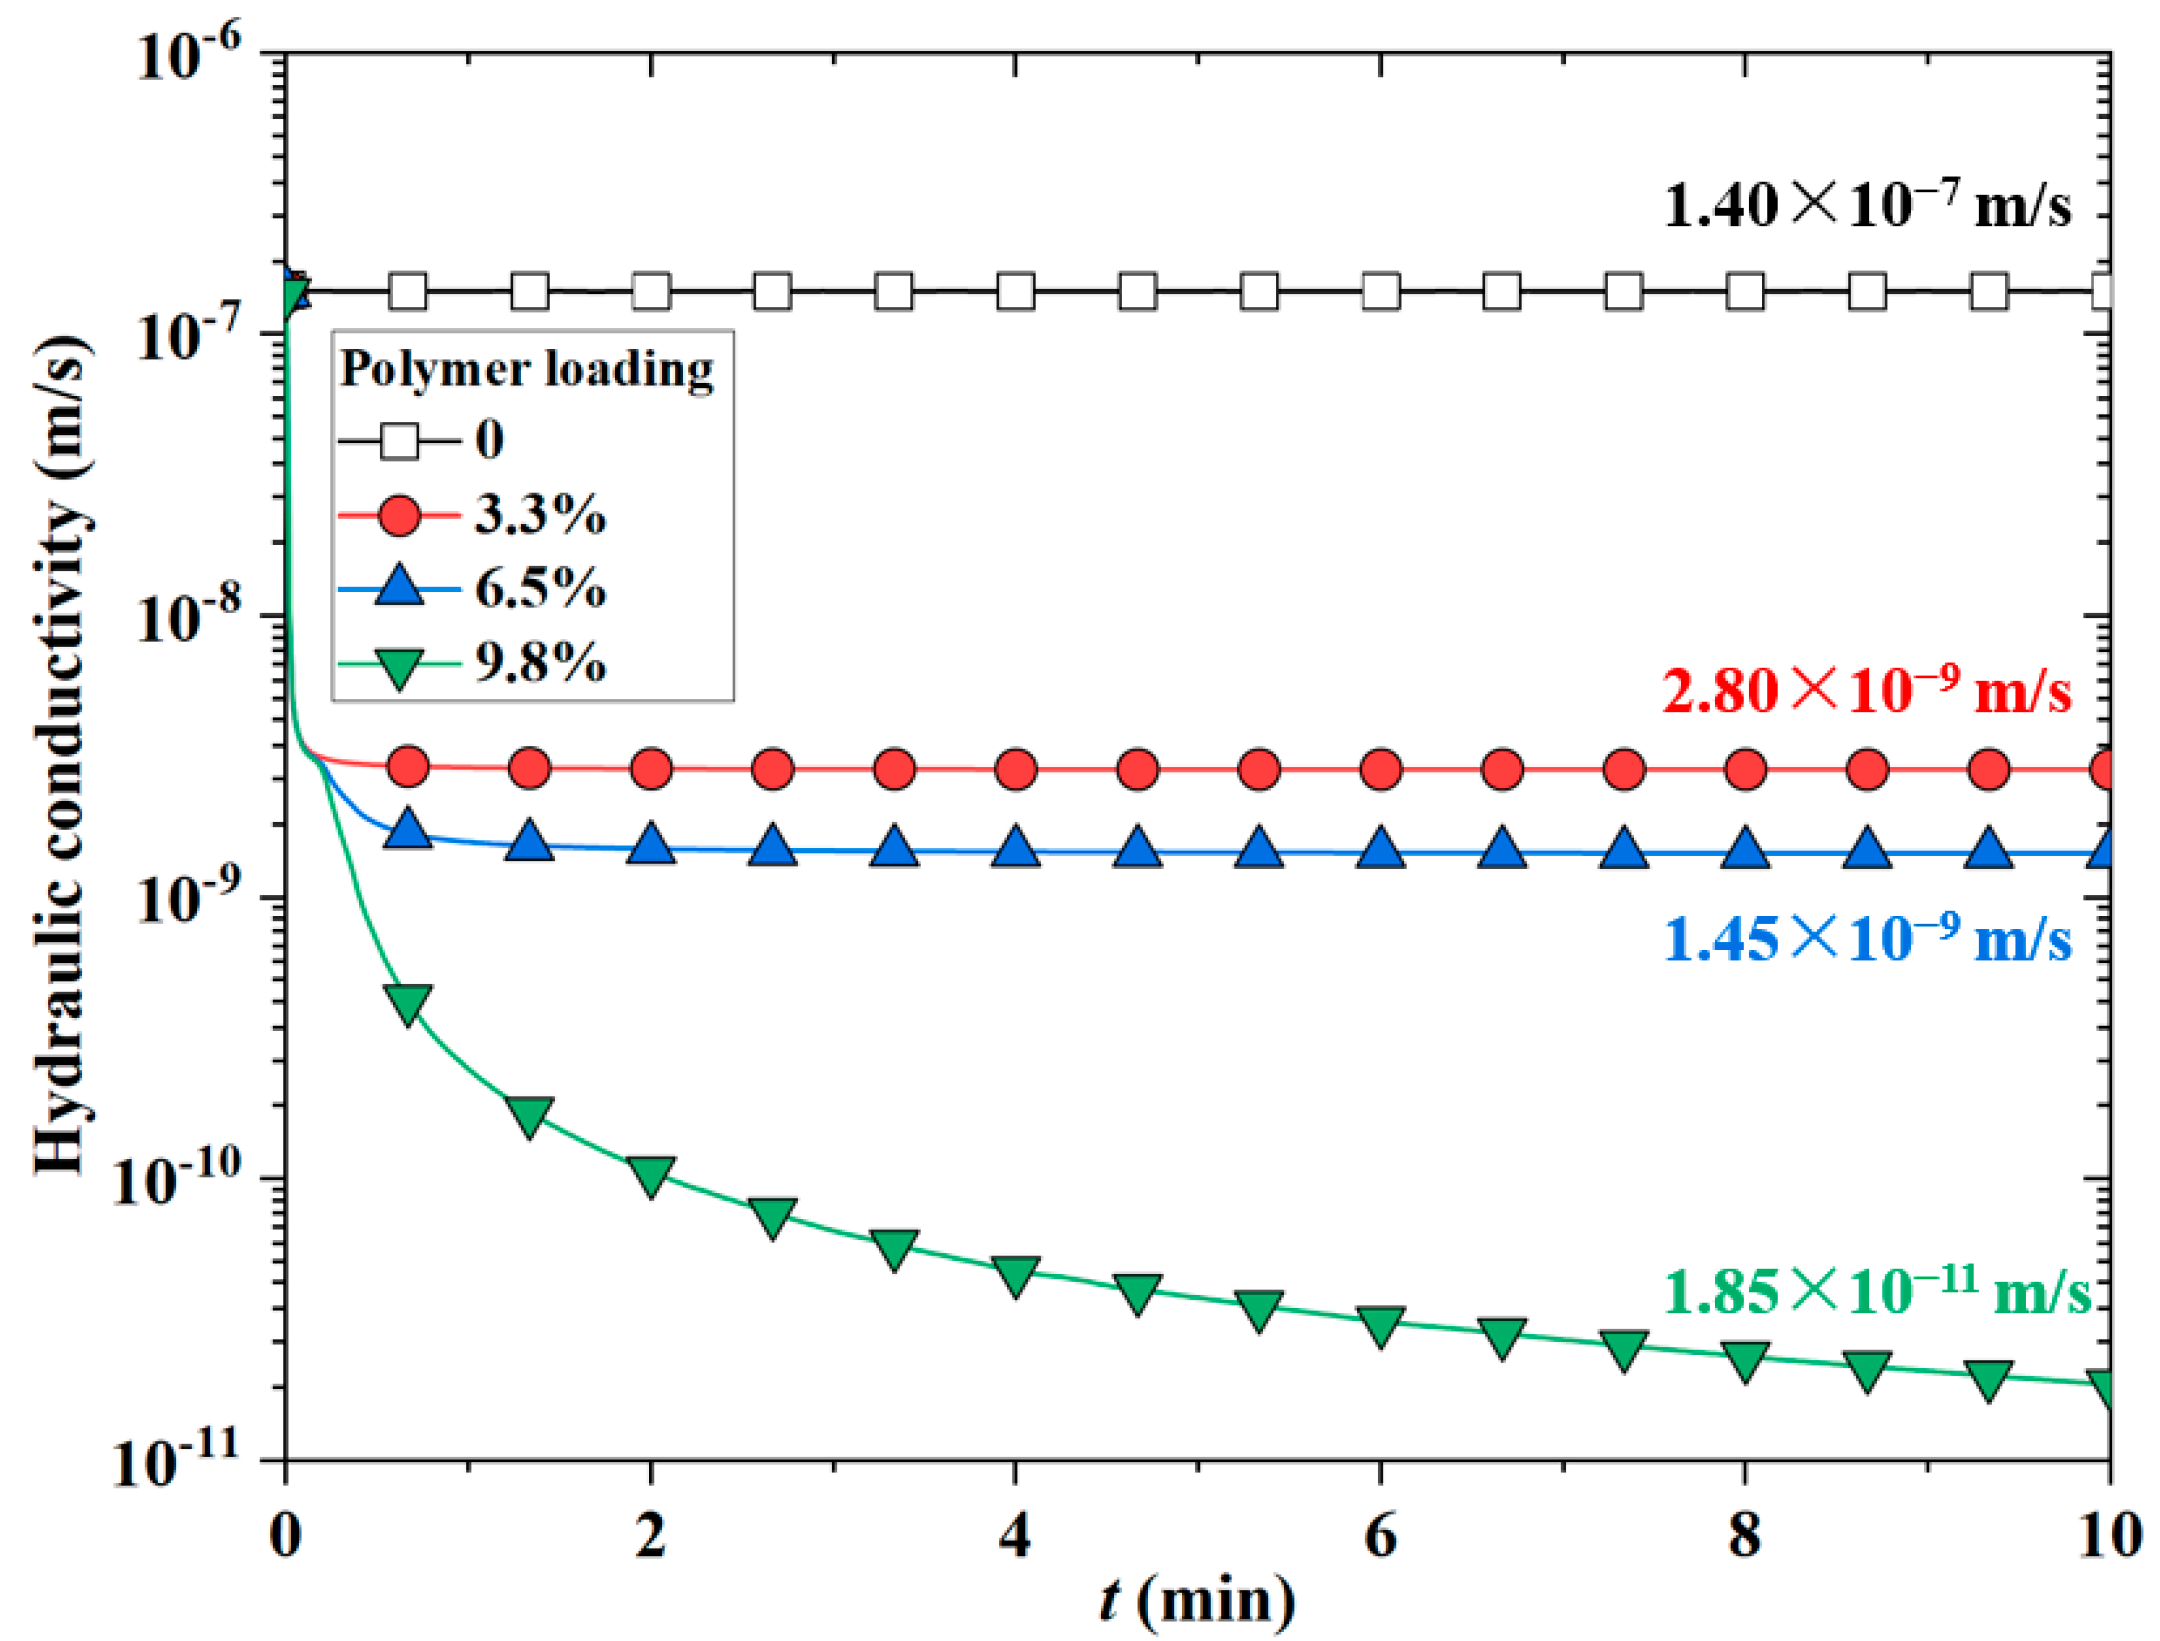
3.1. Effect of Polymer Loading on the Hydraulic Conductivities of BPC-GCLs

Figure 4a illustrates the difference in the polymer loading (0, 3.3%, 6.5%, and 9.8%), which can be calculated by the proportion of polymer hydrogel area over the total NaB granules and polymer hydrogel area [41]. Figure 4(a1) illustrates the conventional GCL with a polymer loading of 0. Figure 4(a2,a3,a4) represent the polymer loadings of 3.3%, 6.5%, and 9.8% with one, two, and three polymer hydrogels, respectively. Figure 4b demonstrates the snapshots of velocity profiles at tr = 10 min corresponding to the different polymer loading, as shown in Figure 4a. The domain of the GCL depicted in Figure 4(b1) shows higher flow velocity (see the larger area of the red region in Figure 4(b1)) compared to the lower flow velocity (see the larger area of the blue region in Figure 4(b2,b3,b4)) in the domain of the BPC-GCL shown in Figure 4(b2,b3,b4). For example, Figure 4(b1) shows that the maximum flow velocity predominantly through the intergranular pore is 3.41 × 10⁻⁴ m/s (see the green dashed box in Figure 4(b1)), and the average velocity in the domain is 3.68 × 10⁻⁵ m/s in the conventional GCL. However, when the polymer loading is 3.3%, Figure 4(b2) shows that the maximum flow velocity predominantly through both narrower pore spaces is 3.15 × 10⁻⁵ m/s (see the red dashed boxes in Figure 4(b2)). The flow velocity through the intergranular pore space is 1.30 × 10⁻⁸ m/s (see the green dashed box in Figure 4(b2)), and the average velocity in the domain of the BPC-GCL is 7.86 × 10⁻⁷ m/s, which is four and two orders of magnitude lower than those in the domain of the conventional GCL, respectively. This significant decrease in flow velocity is because the polymer hydrogel clogs the intergranular pore space and forces the flow through narrower pore spaces at two boundaries. With further increasing polymer loading from 3.3% to 6.5%, Figure 4(b3) shows that the maximum flow velocity predominantly through the right narrower pore spaces is 3.14 × 10⁻⁵ m/s (see the yellow dashed box in Figure 4(b3)). The flow velocity through the left more limited pore space is 1.13 × 10⁻⁷ m/s, which is two orders of magnitude lower than that in the BPC-GCL with a polymer loading of 3.3%. The average velocity in the domain of the BPC-GCL with a polymer loading of 6.5% is 4.11 × 10⁻⁷ m/s, which is less than half of that in the BPC-GCL with a 3.3% polymer loading. This is because when the polymer hydrogel already clogs the intergranular pore space, the newly added polymer hydrogel clogs the other narrower pore spaces, resulting in a limited decrease in average velocity in the domain of the BPC-GCL. When the polymer loading further increases from 6.5% to 9.8%, Figure 4(b3) shows that the flow velocity through the right narrower pore space is 1.09 × 10⁻⁷ m/s (see the yellow dashed box in Figure 4(b4)), and the average velocity in the domain is 8.22 × 10⁻¹² m/s, which is two and five orders of magnitude lower than those in the BPC-GCL with 6.5% polymer loading, respectively (Figure 4(b3)). This significant decrease in flow velocity is because the polymer hydrogel clogs all the pore spaces, and no flow pore can be found in the domain of the BPC-GCL.
Figure 5 illustrates the hydraulic conductivities of four cases with different polymer loading corresponding to Figure 4. When the tr = 10 min, the hydraulic conductivity is 1.40 × 10⁻⁷ m/s (see the black curve in Figure 5) in the conventional GCL, which is very close to the experimental data under aggressive solution with suppressed swelling of the bentonite granules [1,10,36]. However, the hydraulic conductivity with a 3.3% polymer loading is 2.80 × 10⁻⁹ m/s (see the red curve in Figure 5), two orders of magnitude lower than that of the conventional GCL. When the polymer loading increases to 6.5% (see the blue curve in Figure 5), the hydraulic conductivity decreases slightly to 1.45 × 10⁻⁹ m/s, which is only half the decrease compared to those with the polymer loading of 3.3%. However, when the polymer loading further increases to 9.8%, the hydraulic conductivity decreases to 1.85 × 10⁻¹¹ m/s, two orders of magnitude lower than at the polymer loading of 3.3% and 6.5%. This phenomenon indicates that with the increase in polymer loading, the hydraulic conductivity of the BPC-GCL decreases, which has been confirmed in experimental studies [19,46]. However, it should be noted that the polymer distribution is essential to the hydraulic conductivity of the BPC-GCL, combining Figure 4 and Figure 5. Only when the polymer hydrogel clogged the predominant intergranular pore space (compare Figure 4(b1) to Figure 4(b2)) or was distributed uniformly and clogged almost all flow pores (compare Figure 4(b2,b3) to Figure 4(b4)), the hydraulic conductivity of the BPC-GCL decreased significantly. Otherwise, the hydraulic conductivity of the BPC-GCL was very limited when it clogged the unnecessary pores (compare Figure 4(b2) to Figure 4(b3)). This also explains why the newly added polymer hydrogel clogs the right narrower pore space (see the yellow dashed box in Figure 4(b4)), leading to a decrease in the average velocity in the domain of the BPC-GCL by five orders of magnitude compared to those in Figure 4(b3) (~4.11 × 10⁻⁷ m/s), while no significant decrease happened in the average velocity when the newly added polymer hydrogel clogged the left narrower pore space, compare Figure 4(b2) to Figure 4(b3) and red circle and blue triangle curves in Figure 5.

3.2. Effect of Polymer Rheology Properties on the Hydraulic Conductivities of BPC-GCLs
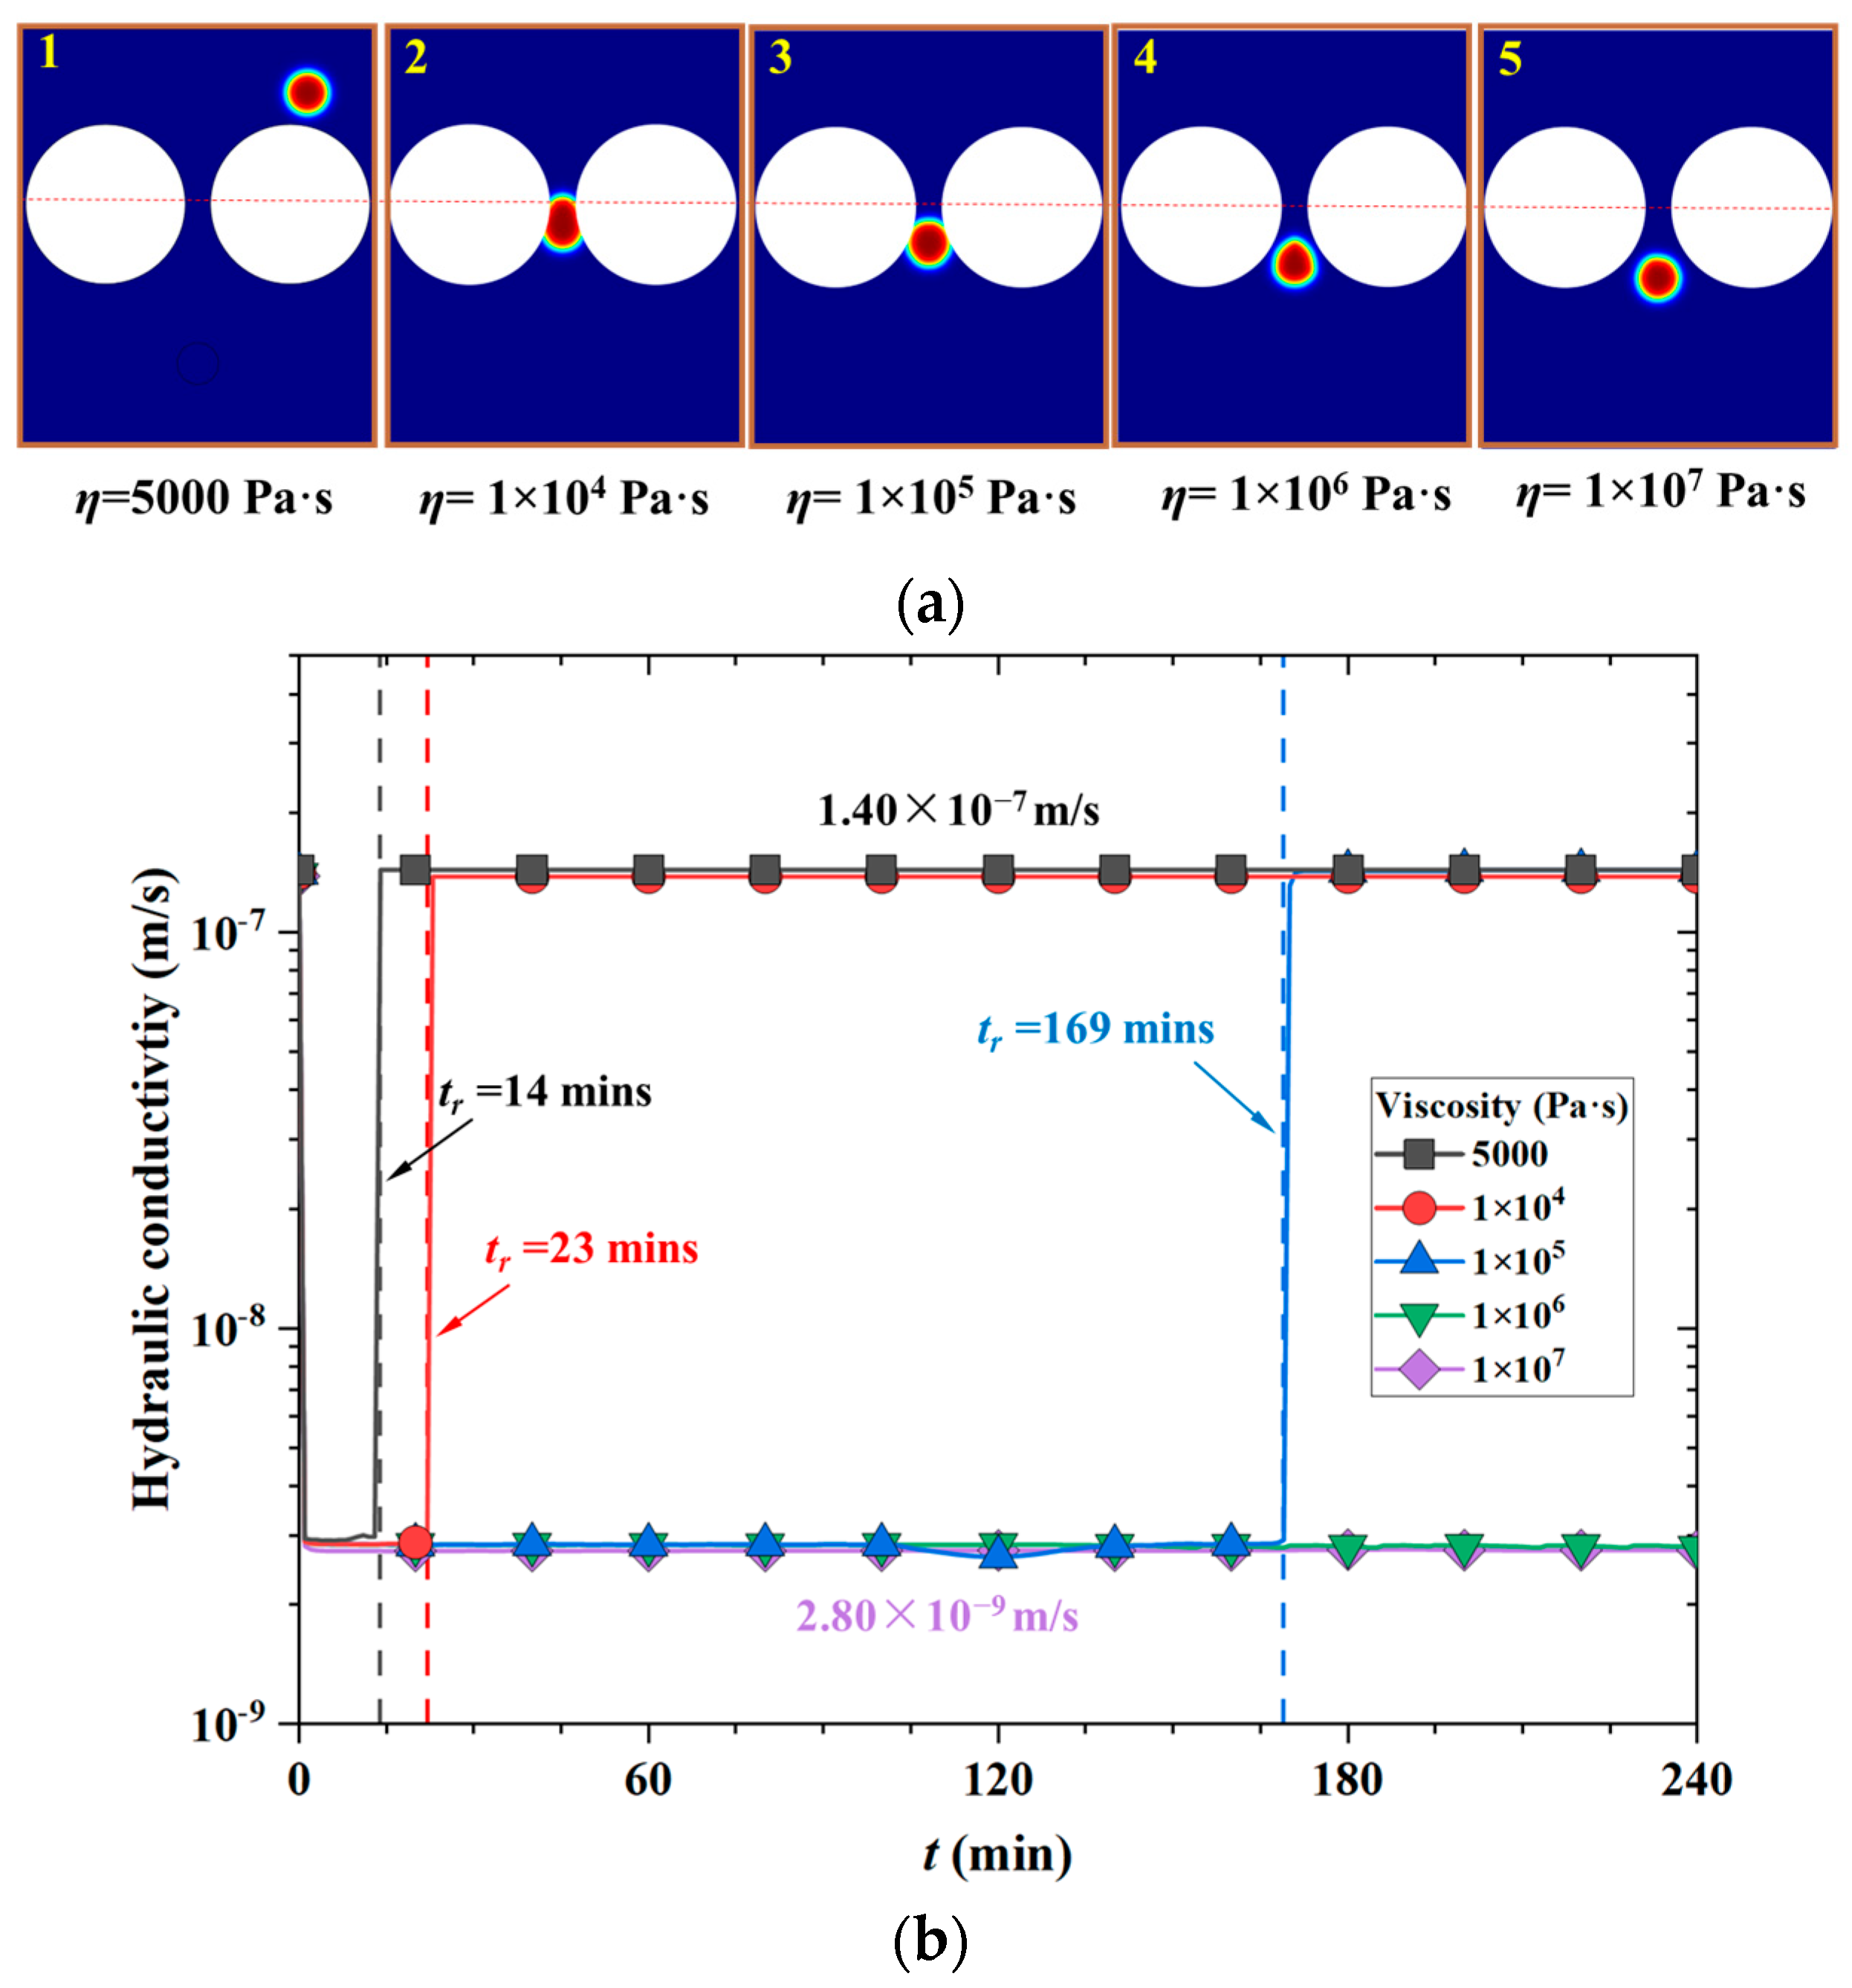
3.2.1. Viscosity

The polymer hydrogels with different viscosities correspond to varying polymer hydrolysis [22,23,47]. Drawing upon previous experiments [35,48,49,50,51,52], it was observed that rheological properties such as viscosity, surface tension coefficient, and contact angle of the polymer materials were determined through experimental methods, encompassing ranges from 1 Pa·s to 1 × 10⁶ Pa·s [35,48], 0.025 N/m to 0.075 N/m [49,50], and 10° to 120° degrees [50,51,52], respectively. However, to further explore the impact of rheological properties, the viscosity range was extended from 5000 Pa·s to 1 × 10⁷ Pa·s in this study [35,48].
Figure 6 illustrates the influence of the viscosity of polymer hydrogel on the hydraulic conductivity of BPC-GCLs. Figure 6a shows the snapshots of the position distribution of polymer hydrogels with different viscosities when tr = 14 min. It can be seen in Figure 6(a1) that the polymer hydrogel eluted out from the intergranular pore space when the viscosity was 5000 Pa·s. However, when the viscosity increased to 1 × 10⁴ Pa∙s and 1 × 10⁵ Pa∙s, the polymer hydrogel clogged the intergranular pore space (see Figure 6(a2,a3)), which means the tr was longer than 14 min. Further, after increasing the viscosity to 1 × 10⁶ Pa∙s and 1 × 10⁷ Pa∙s, the polymer hydrogel did not clog the intergranular pore space (see Figure 6(a4,a5)), which indicates that a longer tr is needed than that in Figure 6(a2,a3).
Figure 6b illustrates the hydraulic conductivities of the BPC-GCLs with various viscosities of polymer hydrogels. The tr of the polymer hydrogel in the domain of BPC-GCLs increases with viscosity. For example, the tr of polymer hydrogels in the domain are 14 min, 23 min, and 169 min when the viscosities are 5000 Pa·s, 1 × 10⁴ Pa·s, and 1 × 10⁵ Pa·s, respectively. These few minutes can approximate the actual passage of several hours or days in physical time. The tendency of the hydraulic conductivities of BPC-GCLs first decreased to 2.80 × 10⁻⁹ m/s and then increased to 1.40 × 10⁻⁷ m/s because the polymer hydrogel clogs the intergranular pore space first, and then when the polymer hydrogel elution happens, the hydraulic conductivity increases (see the black, red, and blue curves in Figure 6b). However, for BPC-GCLs with viscosities of 1 × 10⁶ Pa·s and 1 × 10⁷ Pa·s, although the polymer hydrogels did not clog the intergranular pore spaces yet, the hydraulic conductivities remained consistent at around 2.80 × 10⁻⁹ m/s without any increase through all 240 min, which indicates that the polymer hydrogel can reduce the hydraulic conductivity when it remains in a specific region close to the pore spaces.

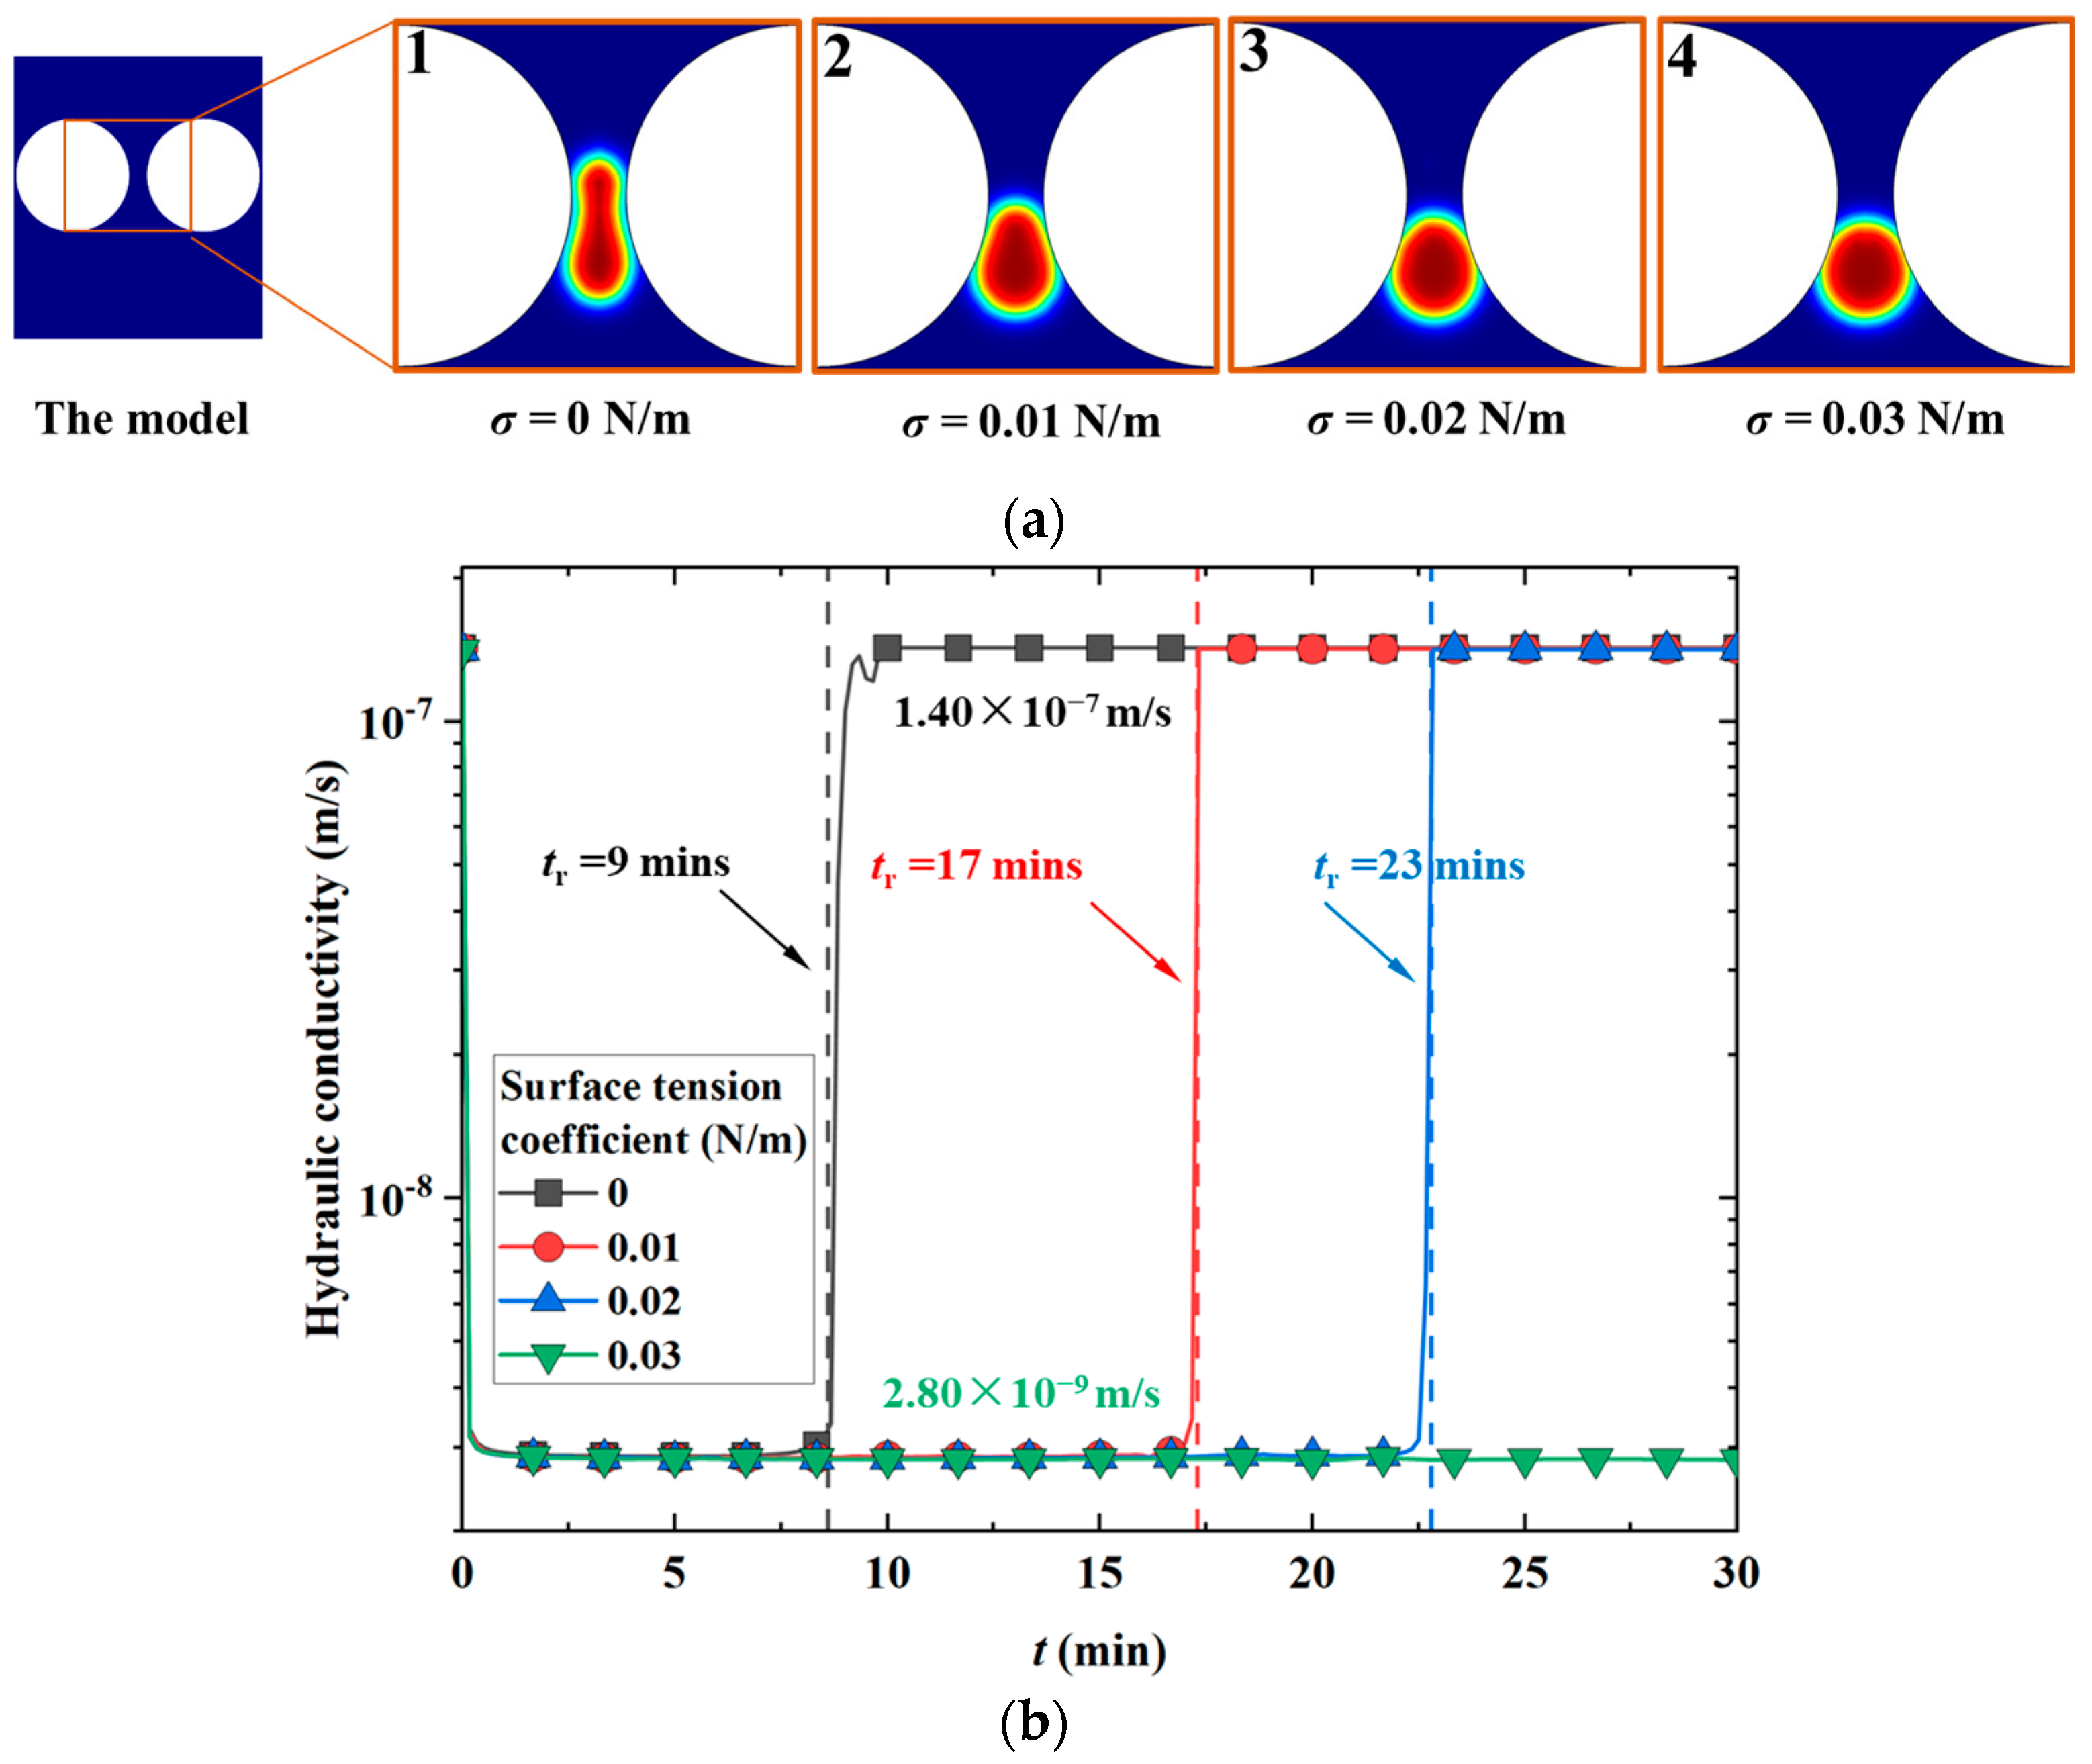
3.2.2. Surface Tension

Figure 7 illustrates the influence of the surface tension of polymer hydrogel on the hydraulic conductivity of the BPC-GCL, and the range of surface tension coefficients was extended from 0 Pa·s to 0.03 Pa·s in this study [49,50]. Figure 7a shows the snapshots of the position distribution of polymer hydrogels with different surface tension coefficients when tr = 2 min (all polymer hydrogels are approximately in the same position). When the surface tension coefficient is 0 N/m, the polymer is easy to deform (see Figure 7(a1)). However, when the polymer surface tension coefficient increases to 0.01 N/m and 0.02 N/m, the deformation of the polymer hydrogel is restricted, and the curvature of the polymer hydrogel decreases as the radius of the curvature increases (see Figure 7(a2,a3)). As the surface tension coefficient of the polymer hydrogel increases to 0.03 N/m, the polymer hydrogel becomes more stable and maintains a nearly circular shape (see Figure 7(a4)), which indicates that the morphological stability of polymer hydrogels improves with the surface tension coefficient. This phenomenon occurs because polymer hydrogels with higher surface tension can more effectively maintain their shape, which is more challenging to elute out from the pore spaces.
Figure 7b illustrates the hydraulic conductivities of the BPC-GCLs with various surface tension coefficients of polymer hydrogels. The tr of the polymer hydrogel in the domain of BPC-GCLs increases with the surface tension coefficient. For example, the tr of polymer hydrogels in the domain is 9 min, 17 min, and 23 min when the surface tension coefficients are 0 N/m, 0.01 N/m, and 0.02 N/m, respectively. These few minutes can approximate the actual passage of several hours in physical time. The tendency of the hydraulic conductivities of BPC-GCLs with different surface tension coefficients also first decreased to 2.80 × 10⁻⁹ m/s and then increased to 1.40 × 10⁻⁷ m/s with the same reasons as described in Figure 6b (see the black, red, and blue curves in Figure 7b). However, for the BPC-GCL with a surface tension coefficient of 0.03 N/m, the polymer hydrogel clogged the intergranular pore space, and the hydraulic conductivity remained consistent at around 2.8 × 10⁻⁹ m/s without any increase for 30 min. This indicated that a higher surface tension coefficient resulted in a longer tr in the BPC-GCL, which resulted in longer low hydraulic conductivities.

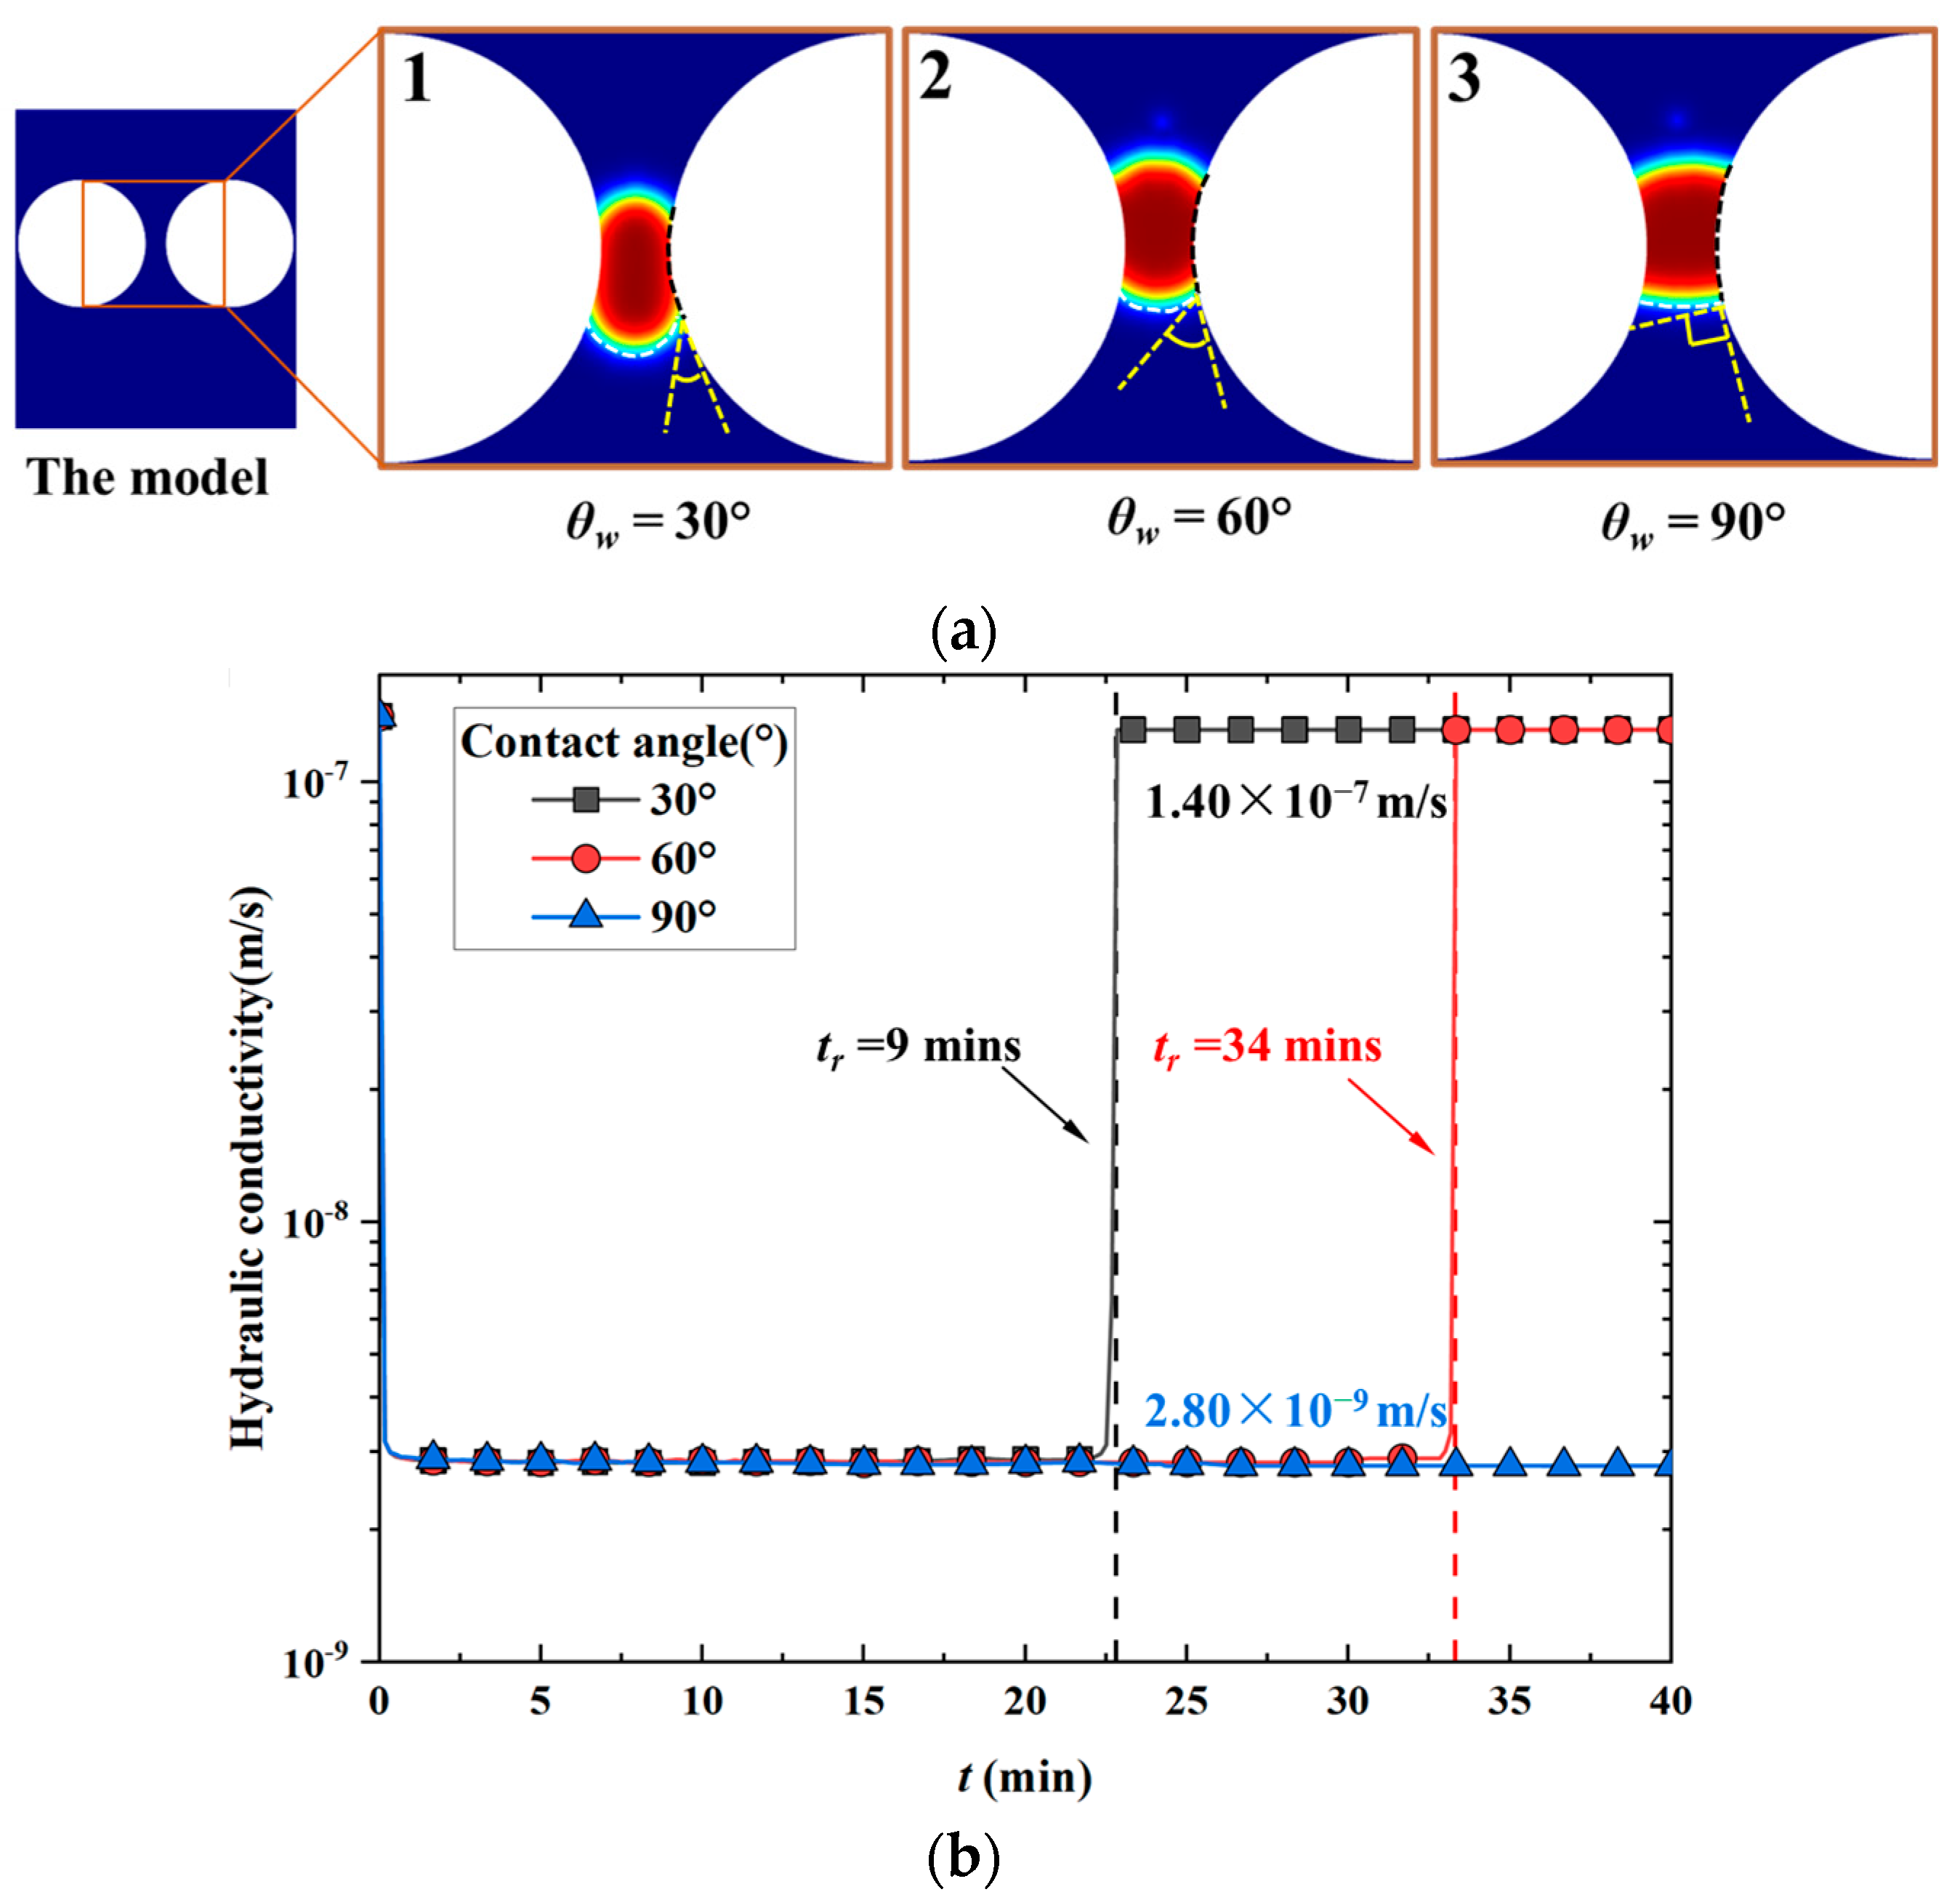
3.2.3. Contact Angle

Figure 8 illustrates the influence of the contact angle of the polymer hydrogel and permeating solution on the hydraulic conductivity of the BPC-GCL, and the range of the contact angle was extended from 30° to 90° in this study [50,51,52]. Figure 8a shows the snapshots of the position distribution of polymer hydrogels with different contact angles between the polymer hydrogel and permeating solution at the boundaries of NaB granules when tr = 10 min (all polymer hydrogels are approximately in the same position). When the contact angle is 30° (see the yellow dashed line in Figure 8(a1)), the boundary curvature of the polymer hydrogel is significant (see the white dashed curve in Figure 8(a1)). Therefore, there is a small contact area between the polymer hydrogel and permeating solution at the boundaries of NaB granules (see the black dashed curve in Figure 8(a1)). When the contact angle increases to 60° (see the yellow dashed angle in Figure 8(a2)), the curvature of the boundary of the polymer hydrogel becomes flat (see the white dashed curve in Figure 8(a2)), which results in a medium contact area between the polymer hydrogel and permeating solution at the boundaries of NaB granules (see the black dashed curve in Figure 8(a2)). However, when the contact angle is further increased to 90° (see the yellow dashed angle in Figure 8(a3)), the interface between the polymer hydrogel and the permeating solution approximately tends to a straight line (see the white dashed curve in Figure 8(a3)), which results in a large contact area between the polymer hydrogel and permeating solution at the boundaries of NaB granules (see the black dashed curve in Figure 8(a3)). This phenomenon indicates that a higher contact angle leads to a larger contact area between the polymer hydrogel and the permeating solution within the intergranular pore spaces. The increased spreading area of the polymer hydrogel results in increased resistance, making it more challenging to elute out from the pore space.
Figure 8b illustrates the hydraulic conductivities of the BPC-GCLs with various contact angles of polymer hydrogels. The tr of the polymer hydrogel in the domain of BPC-GCLs increases with contact angle. When the contact angles are 30° and 60°, the tr of polymer hydrogel in the domain is 9 min and 34 min, respectively. These few minutes can approximate the actual passage of several hours in physical time. The tendency of the hydraulic conductivities of BPC-GCLs with different contact angles first decreased to 2.80 × 10⁻⁹ m/s and then increased to 1.40 × 10⁻⁷ m/s (see the black and red curves in Figure 8b). However, for the BPC-GCL with a contact angle of 90°, the polymer hydrogel clogged the intergranular pore space, and the hydraulic conductivity remained consistent at around 2.8 × 10⁻⁹ m/s without any increase for 40 min. This indicated that a higher contact angle resulted in a longer tr in the BPC-GCL, which resulted in longer low hydraulic conductivities.

4. Conclusions

This study developed an advanced series of two-dimensional fluid dynamics numerical models to meticulously explore the intricate influence of key polymer hydrogel properties, including viscosity, surface tension, and contact angle, on the hydraulic conductivity of BPC-GCLs. The mechanisms elucidated in these models align coherently with empirical evidence of polymer elution observed in experimental settings. The research unveils a nuanced and profound correlation between polymer hydrogel rheology properties and resulting hydraulic conductivity, significantly enhancing the understanding of the potential for tailoring hydrogel attributes to BPC-GCLs. Specifically, the hydraulic conductivity of BPC-GCLs exhibits a gradual decline of approximately four orders of magnitude as polymer loading increases from 0% to 10% relative to traditional GCLs. This phenomenon is most pronounced when polymer hydrogels obstruct the dominant intergranular pore or exhibit uniform distribution, leading to extensive congestion of the flow pore space. Furthermore, the interaction between polymer rheology properties and hydraulic conductivity is mirrored through the residence time of the polymer hydrogel within the domain. This comprehensive analysis uncovers a substantial surge in hydraulic conductivities as the residence time exceeds a critical threshold, typically extending over several days. Notably, this trend becomes evident with increasing viscosity, surface tension, and contact angle of the polymer hydrogel. When these values surpass 1 × 10⁶ Pa∙s, 0.03 N/m, and 60°, respectively, the residence time of the polymer hydrogel within the BPC-GCL domain experiences significant prolongation, implying the potential for sustained maintenance of extremely low hydraulic conductivity. In a broader context, the findings carry profound implications for advancing hydrogel technology and its application. The in-depth exploration of the intricate interplay between polymer rheology properties and hydraulic conductivity presents a promising avenue for fine-tuning hydrogel properties to optimize geotechnical solutions. This advancement has the potential to significantly enhance the efficiency and sustainability of environmental engineering practices, offering a promising trajectory for addressing contemporary challenges. However, it is essential to acknowledge that a single pore path between circular NaB granules constitutes a simplification in the current models. A more realistic model should encompass irregular geometries, linked pores, and diverse polymer placements throughout the pore spaces. Such an advanced model could provide valuable insights into the emergence of preferential flow paths, mirroring observations from experimental investigations of BPC-GCLs. This avenue of research holds promise for further expanding the comprehension of hydrogel behavior in complex geotechnical systems, paving the way for innovative solutions in the future.

Author Contributions

Methodology, J.H.; software, H.L. and J.Z.; formal analysis, H.L. and J.H.; data curation, H.L. and J.Z.; writing—original draft, H.L. and J.H.; writing—review and editing, J.H.; supervision, J.H. All authors have read and agreed to the published version of the manuscript.

Funding

Financial support for Hou’s contributions to this study was provided by the National Natural Science Foundation of China (NSFC) (Nos. 51978390, 51778353), 2023 Basic Research Program of Qinghai Province (2023-ZJ-756), and the China Scholarship Council (CSC 201906895014).

Institutional Review Board Statement

Not applicable.

Informed Consent Statement

Not applicable.

Data Availability Statement

The data presented in this study are available on request from the corresponding author.

Conflicts of Interest

The authors declare no conflict of interest.

Appendix A

Figure A1. The results of hydraulic conductivities repeated simulations for the model (viscosity = 5000 Pa·s, surface tension coefficient = 0.02N/m, contact angle = 30°).
Sustainability 15 13052 g0a1

References

  1. Benson, C.H.; Thorstad, P.A.; Jo, H.-Y.; Rock, S.A. Hydraulic Performance of Geosynthetic Clay Liners in a Landfill Final Cover. J. Geotech. Geoenviron. Eng. 2007, 133, 814–827. [Google Scholar] [CrossRef]
  2. Guyonnet, D.; Touze-Foltz, N.; Norotte, V.; Pothier, C.; Didier, G.; Gailhanou, H.; Blanc, P.; Warmont, F. Performance-Based Indicators for Controlling Geosynthetic Clay Liners in Landfill Applications. Geotext. Geomembr. 2009, 27, 321–331. [Google Scholar] [CrossRef]
  3. LaGatta, M.D.; Boardman, B.T.; Cooley, B.H.; David, D.E. Geosynthetic Clay Liners Subjected to Differential Settlement. J. Geotech. Geoenviron. Eng. 1997, 123, 402–410. [Google Scholar] [CrossRef]
  4. Kumar, R.; Kumari, S. Geotechnical Properties of Materials Used in Landfill Clay Liner: A Critical Review. Sādhanā 2023, 48, 64. [Google Scholar] [CrossRef]
  5. Bouazza, A.; Gates, W.P. Overview of Performance Compatibility Issues of GCLs with Respect to Leachates of Extreme Chemistry. Geosynth. Int. 2014, 21, 151–167. [Google Scholar] [CrossRef]
  6. Bradshaw, S.L.; Benson, C.H.; Rauen, T.L. Hydraulic Conductivity of Geosynthetic Clay Liners to Recirculated Municipal Solid Waste Leachates. J. Geotech. Geoenviron. Eng. 2016, 142, 4015074. [Google Scholar] [CrossRef]
  7. Zhang, Y.; Liu, Y.; Min, X.; Jiang, Q.; Su, W. Selection of Landfill Cover Materials Based on Data Envelopment Analysis (DEA)-A Case Study on Four Typical Covering Materials. Sustainability 2022, 14, 10888. [Google Scholar] [CrossRef]
  8. Razakamanantsoa, A.R.; Djeran-Maigre, I. Long Term Chemo-Hydro-Mechanical Behavior of Compacted Soil Bentonite Polymer Complex Submitted to Synthetic Leachate. Waste Manag. 2016, 53, 92–104. [Google Scholar] [CrossRef]
  9. Yadav, H.; Tadikonda, B.V. The Influence of Mechanical Granulation Process and Granular Bentonite Plasticity on Self-Sealing and Volume Change Behavior. J. Hazard. Toxic Radioact. Waste 2022, 26, 04022003. [Google Scholar] [CrossRef]
  10. Jo, H.Y.; Katsumi, T.; Benson, C.H.; Edil, T.B. Hydraulic Conductivity and Swelling of Nonprehydrated GCLs Permeated with Single-Species Salt Solutions. J. Geotech. Geoenviron. Eng. 2001, 127, 557–567. [Google Scholar] [CrossRef]
  11. Ravindranath, Z.M.; Shrihari, S. Potential Use of Geosynthetic Clay Liners (GCL) in Waste Management. In Geotechnical Engineering for Disaster Mitigation and Rehabilitation; Chu, J., Phoon, K.K., Yong, K.Y., Eds.; World Scientific Publ Co Pte Ltd.: Singapore, 2005; pp. 504–511. [Google Scholar]
  12. Rowe, R.K.; Hamdan, S. Performance of GCLs after Long-Term Wet-Dry Cycles under a Defect in GMB in a Landfill. Geosynth. Int. 2022, 30, 225–246. [Google Scholar] [CrossRef]
  13. Rowe, R.K.; Jabin, F. Factors Affecting Multicomponent GCL-Geomembrane Interface Transmissivity for Landfills. Geosynth. Int. 2022, 29, 476–494. [Google Scholar] [CrossRef]
  14. Benson, C.H.; Ören, A.H.; Gates, W.P. Hydraulic Conductivity of Two Geosynthetic Clay Liners Permeated with a Hyperalkaline Solution. Geotext. Geomembr. 2010, 28, 206–218. [Google Scholar] [CrossRef]
  15. Jo, H.Y.; Benson, C.H.; Shackelford, C.D.; Lee, J.-M.; Edil, T.B. Long-Term Hydraulic Conductivity of a Geosynthetic Clay Liner Permeated with Inorganic Salt Solutions. J. Geotech. Geoenviron. Eng. 2005, 131, 405–417. [Google Scholar] [CrossRef]
  16. Petrov, R.J.; Rowe, R.K. Geosynthetic Clay Liner (GCL)—Chemical Compatibility by Hydraulic Conductivity Testing and Factors Impacting Its Performance. Can. Geotech. J. 1997, 34, 863–885. [Google Scholar] [CrossRef]
  17. Ruhl, J.L.; Daniel, D.E. Geosynthetic Clay Liners Permeated with Chemical Solutions and Leachates. J. Geotech. Geoenviron. Eng. 1997, 123, 369–381. [Google Scholar] [CrossRef]
  18. Scalia, J.; Benson, C.H.; Edil, T.B. Bentonite-Polyacrylate Nanocomposites for Containment of Aggressive Liquids. In Proceedings of the 5th International Young Geotechnical Engineers’ Conference (IYGE 2013), Marne-la-Vallée, France, 31 August–1 September 2013; Cui, Y.J., Emeriault, F., Cuira, F., Ghabezloo, S., Pereira, J.M., Reboul, M., Ravel, H., Tang, A.M., Eds.; Ios Press: Amsterdam, The Netherlands, 2013; Volume 2, pp. 63–66. [Google Scholar]
  19. Zainab, B.; Wireko, C.; Li, D.; Tian, K.; Abichou, T. Hydraulic Conductivity of Bentonite-Polymer Geosynthetic Clay Liners to Coal Combustion Product Leachates. Geotext. Geomembr. 2021, 49, 1129–1138. [Google Scholar] [CrossRef]
  20. De Camillis, M.; Di Emidio, G.; Bezuijen, A.; Verástegui-Flores, R.D. Hydraulic Conductivity and Swelling Ability of a Polymer Modified Bentonite Subjected to Wet–Dry Cycles in Seawater. Geotext. Geomembr. 2016, 44, 739–747. [Google Scholar] [CrossRef]
  21. Katsumi, T.; Ishimori, H.; Onikata, M.; Fukagawa, R. Long-Term Barrier Performance of Modified Bentonite Materials against Sodium and Calcium Permeant Solutions. Geotext. Geomembr. 2008, 26, 14–30. [Google Scholar] [CrossRef]
  22. Norris, A.; Aghazamani, N.; Scalia, J.; Shackelford, C.D. Hydraulic Performance of Geosynthetic Clay Liners Comprising Anionic Polymer–Enhanced Bentonites. J. Geotech. Geoenviron. Eng. 2022, 148, 04022039. [Google Scholar] [CrossRef]
  23. Ozhan, H.O. Hydraulic Capability of Polymer-Treated GCLs in Saline Solutions at Elevated Temperatures. Appl. Clay Sci. 2018, 161, 364–373. [Google Scholar] [CrossRef]
  24. Scalia, J.; Benson, C.H.; Bohnhoff, G.L.; Edil, T.B.; Shackelford, C.D. Long-Term Hydraulic Conductivity of a Bentonite-Polymer Composite Permeated with Aggressive Inorganic Solutions. J. Geotech. Geoenviron. Eng. 2014, 140, 04013025. [Google Scholar] [CrossRef]
  25. Tian, K.; Benson, C.H.; Likos, W.J. Effect of an Anion Ratio on the Hydraulic Conductivity of a Bentonite-Polymer Geosynthetic Clay Liner. In Proceedings of the Geotechnical Frontiers 2017, Orlando, FL, USA, 12–15 March 2017; American Society of Civil Engineers: Orlando, FL, USA, 2017; pp. 180–189. [Google Scholar]
  26. Khan, M.K.; Di Emidio, G.; Bezuijen, A. Water Retention Curves of Untreated and Hyper Clay Geosynthetic Clay Liners. Environ. Geotech. 2022. Ahead of Print. [Google Scholar] [CrossRef]
  27. Geng, W.; Salihoglu, H.; Likos, W.J.; Benson, C.H. Alternative Index Tests for Geosynthetic Clay Liners Containing Bentonite-Polymer Composites. Environ. Geotech. 2022. Ahead of Print. [Google Scholar] [CrossRef]
  28. Mazzieri, F.; Bernardo, D. Permeability and Solute Sorption of Unamended and Polymer-Enhanced Geosynthetic Clay Liners. Environ. Geotech. 2022. Ahead of Print. [Google Scholar] [CrossRef]
  29. Wireko, C.; Abichou, T.; Tian, K.; Zainab, B.; Zhang, Z. Effect of Incineration Ash Leachates on the Hydraulic Conductivity of Bentonite-Polymer Composite Geosynthetic Clay Liners. Waste Manag. 2022, 139, 25–38. [Google Scholar] [CrossRef]
  30. Chen, J.; Salihoglu, H.; Benson, C.H.; Likos, W.J.; Edil, T.B. Hydraulic Conductivity of Bentonite–Polymer Composite Geosynthetic Clay Liners Permeated with Coal Combustion Product Leachates. J. Geotech. Geoenviron. Eng. 2019, 145, 04019038. [Google Scholar] [CrossRef]
  31. Tian, K.; Likos, W.J.; Benson, C.H. Polymer Elution and Hydraulic Conductivity of Bentonite–Polymer Composite Geosynthetic Clay Liners. J. Geotech. Geoenviron. Eng. 2019, 145, 04019071. [Google Scholar] [CrossRef]
  32. Wireko, C.; Abichou, T. Investigating Factors Influencing Polymer Elution and the Mechanism Controlling the Chemical Compatibility of GCLs Containing Linear Polymers. Geotext. Geomembr. 2021, 49, 1004–1018. [Google Scholar] [CrossRef]
  33. Tian, K.; Likos, W.J.; Benson, C.H. Pore-Scale Imaging of Polymer-Modified Bentonite in Saline Solutions. In Proceedings of the Geo-Chicago 2016, Chicago, IL, USA, 14–18 August 2016; pp. 468–477. [Google Scholar]
  34. Tong, S.; Sample-Lord, K.M.; Bohnhoff, G.L. Diffusion through Sodium and Polymer Enhanced Bentonites Exposed to Dilute and Aggressive Solutions. Can. Geotech. J. 2021, 58, 603–618. [Google Scholar] [CrossRef]
  35. Gustitus, S.A. Mechanisms Controlling Hydraulic Conductivity and Service Life of Bentonite-Polymer Composite Geosynthetic Clay Liners Permeated with Aggressive Solutions. Ph.D. Thesis, University of Virginia, Charlottesville, VA, USA, 2020. [Google Scholar]
  36. Kolstad, D.C.; Benson, C.H.; Edil, T.B.; Jo, H.Y. Hydraulic Conductivity of a Dense Prehydrated GCL Permeated with Aggressive Inorganic Solutions. Geosynth. Int. 2004, 11, 233–241. [Google Scholar] [CrossRef]
  37. Bian, X.; Cui, Y.-J.; Li, X.-Z. Voids Effect on the Swelling Behaviour of Compacted Bentonite. Géotechnique 2019, 69, 593–605. [Google Scholar] [CrossRef]
  38. Hou, J.; Sun, R.; Benson, C.H. Hydrodynamic Assessment of Bentonite Granule Size and Granule Swelling on Hydraulic Conductivity of Geosynthetic Clay Liners. Geotext. Geomembr. 2023, 51, 93–103. [Google Scholar] [CrossRef]
  39. Keller, L.M.; Holzer, L.; Gasser, P.; Erni, R.; Rossell, M.D. Intergranular Pore Space Evolution in MX80 Bentonite during a Long-Term Experiment. Appl. Clay Sci. 2015, 104, 150–159. [Google Scholar] [CrossRef]
  40. Lubelli, B.; De Winter, D.A.M.; Post, J.A.; Van Hees, R.P.J.; Drury, M.R. Cryo-FIB–SEM and MIP Study of Porosity and Pore Size Distribution of Bentonite and Kaolin at Different Moisture Contents. Appl. Clay Sci. 2013, 80–81, 358–365. [Google Scholar] [CrossRef]
  41. Hou, J.; Li, H.; Gustitus, S.; Benson, C.H. Pore-Scale Modeling of Polymer Clogging in Bentonite-Polymer Composite Geosynthetic Clay Liners. In Proceedings of the Geo-Congress 2022, Charlotte, NC, USA, 20–23 March 2022; American Society of Civil Engineers: Charlotte, NC, USA, 2022; pp. 597–604. [Google Scholar]
  42. ASTM. Test Method for Evaluation of Hydraulic Properties of Geosynthetic Clay Liners Permeated with Potentially Incompatible Aqueous Solutions; ASTM International: West Conshohocken, PA, USA, 2012. [Google Scholar]
  43. Olsson, E.; Kreiss, G.; Zahedi, S. A Conservative Level Set Method for Two Phase Flow II. J. Comput. Phys. 2007, 225, 785–807. [Google Scholar] [CrossRef]
  44. Olsson, E.; Kreiss, G. A Conservative Level Set Method for Two Phase Flow. J. Comput. Phys. 2005, 210, 225–246. [Google Scholar] [CrossRef]
  45. Zhou, C.; Yue, P.; Feng, J.J.; Ollivier-Gooch, C.F.; Hu, H.H. 3D Phase-Field Simulations of Interfacial Dynamics in Newtonian and Viscoelastic Fluids. J. Comput. Phys. 2010, 229, 498–511. [Google Scholar] [CrossRef]
  46. Salemi, N.; Abtahi, S.M.; Rowshanzamir, M.A.; Hejazi, S.M. Improving Hydraulic Performance and Durability of Sandwich Clay Liner Using Super-Absorbent Polymer. J. Sandw. Struct. Mater. 2019, 21, 1055–1071. [Google Scholar] [CrossRef]
  47. Malviya, R.; Jha, S.; Fuloria, N.K.; Subramaniyan, V.; Chakravarthi, S.; Sathasivam, K.; Kumari, U.; Meenakshi, D.U.; Porwal, O.; Sharma, A.; et al. Determination of Temperature-Dependent Coefficients of Viscosity and Surface Tension of Tamarind Seeds (Tamarindus indica L.) Polymer. Polymers 2021, 13, 610. [Google Scholar] [CrossRef]
  48. Dunstan, D.E. The Viscosity-Radius Relationship for Concentrated Polymer Solutions. Sci. Rep. 2019, 9, 543. [Google Scholar] [CrossRef] [PubMed]
  49. Thompson, R.B.; MacDonald, J.R.; Chen, P. Origin of Change in Molecular-Weight Dependence for Polymer Surface Tension. Phys. Rev. E 2008, 78, 030801. [Google Scholar] [CrossRef] [PubMed]
  50. Szymczyk, K.; Zdziennicka, A.; Krawczyk, J.; Janczuk, B. Wettability, Adhesion, Adsorption and Interface Tension in the Polymer/Surfactant Aqueous Solution System. I. Critical Surface Tension of Polymer Wetting and Its Surface Tension. Colloids Surf. A Physicochem. Eng. Asp. 2012, 402, 132–138. [Google Scholar] [CrossRef]
  51. Corredor, L.M.; Husein, M.M.; Maini, B.B. Impact of PAM-Grafted Nanoparticles on the Performance of Hydrolyzed Polyacrylamide Solutions for Heavy Oil Recovery at Different Salinities. Ind. Eng. Chem. Res. 2019, 58, 9888–9899. [Google Scholar] [CrossRef]
  52. Wu, S.H.; Shanks, R.A. Solubility Study of Polyacrylamide in Polar Solvents. J. Appl. Polym. Sci. 2004, 93, 1493–1499. [Google Scholar] [CrossRef]
Figure 1. Conceptual model of bentonite granules, polymer, polymer hydrogels, intergranular pore spaces, and flow paths for different states in BPC-GCL: (a) unhydrated granules and polymer with large intergranular pore spaces; (b) hydrated polymer hydrogels clogged all large intergranular pore spaces with an almost constrained and very tortuous flow path through intergranular pore spaces; (c) few polymer hydrogels eluted out with relatively modest constrained and tortuous flow path through intergranular pore spaces; (d) almost all polymer hydrogels eluted out with unconstrained flow through and almost straight flow path through large intergranular pore spaces.
Sustainability 15 13052 g001
Figure 2. Domain simulated in COMSOL showing boundary conditions, permeating solution, impermeable NaB granules, and polymer hydrogel: (a) simplified model of the BPC-GCL; (b) a simple two-dimensional hydrodynamic model using COMSOL Multiphysics 5.4.
Sustainability 15 13052 g002
Figure 3. Model diagram with free triangular mesh partitioning.
Sustainability 15 13052 g003
Figure 4. Polymer loading distribution and velocity profiles at tr = 10 min: (a) different polymer loading (0, 3.3%, 6.5%, and 9.8%); (b) velocity profiles with different polymer loading (0, 3.3%, 6.5%, and 9.8%).
Sustainability 15 13052 g004
Figure 5. Hydraulic conductivities of GCL and BPC-GCL with different polymer loading.
Sustainability 15 13052 g005
Figure 6. The different viscosities of polymer hydrogels: (a) the snapshots of positions of polymer hydrogels with different viscosities at tr = 14 min; (b) hydraulic conductivities of BPC-GCLs with different viscosities.
Sustainability 15 13052 g006
Figure 7. The different surface tension of polymer hydrogel: (a) the snapshots of positions of polymer hydrogels with different surface tension coefficients at tr = 2 min; (b) hydraulic conductivities of BPC-GCLs with different surface tension coefficient.
Sustainability 15 13052 g007
Figure 8. The different contact angles of polymer hydrogels: (a) the snapshots of positions of polymer hydrogels with different contact angles at tr = 10 min; (b) hydraulic conductivities of BPC-GCLs with different contact angles.
Sustainability 15 13052 g008
Disclaimer/Publisher’s Note: The statements, opinions and data contained in all publications are solely those of the individual author(s) and contributor(s) and not of MDPI and/or the editor(s). MDPI and/or the editor(s) disclaim responsibility for any injury to people or property resulting from any ideas, methods, instructions or products referred to in the content.

