1. Introduction
Fine dust and microplastics contribute to climate change [
1] and marine pollution [
2], which are important environmental issues that are gaining increasing attention worldwide. The European Union announced the European Green Deal policy to achieve net-zero greenhouse gas emissions by 2050 to overcome the serious issues of climate change and environmental destruction caused by atmospheric fine dust and marine microplastics. Additionally, the Environmental Protection Agency of the United States and the State of California announced emission standards for automobiles and exhaust systems, including emission standards for greenhouse gases.
Generally, based on the particle size, fine dust can be divided into particulate matter with a diameter of 10 µm or less (PM
10) and fine particulate matter with a diameter of 2.5 µm or less (PM
2.5). Most of these are generated by fuel combustion, whereas some are generated by the exhaust and non-exhaust systems of different transportation modes. Microplastics can be defined as solid synthetic polymer particles with a particle size of 5 mm or less. Products that intentionally contain microplastics can be classified as primary microplastics and those that unintentionally generate microplastics during use can be classified as secondary microplastics [
3].
Vehicular traffic unintentionally generates tire and road wear particles (TRWPs) in the form of a mixture of tire wear particles (TWPs), road wear particles (RWPs), and minerals on the road, owing to the constant friction between tires and road pavements. Depending on the size of the wear particles, they are either dispersed into the atmosphere and included in fine dust or dispersed along roadsides and transferred to the soil and ocean by wind and rainwater where they form microplastics [
4]. According to previous studies on the movement path of TRWPs, approximately 2% of the generated TRWPs are scattered into the atmosphere and included in fine dust [
5,
6], whereas the majority are transferred to the marine environment after being deposited on roadsides and transported to nearby soil or surface water. Generally, compared to polymers, TRWPs are expected to have less influence on the environment due to their high specific weight. However, they can significantly influence surface water. Moreover, through the marine food chain, TRWPs may exhibit both direct and indirect impacts on human health via the consumption of aquatic organisms that ingest TRWPs [
7].
The annual amount of TRWPs generated by vehicular traffic is related to the use of automobiles. As shown in
Figure 1, the number of registered vehicles per year in Korea has been increasing by 2–3%. Thus, if the annual traffic volume of vehicles increases, the amount of TRWPs generated will also increase. TRWPs are generated through a complex process. Generally, the friction and slip between the vehicle tires and road pavements result in fine cuts and cracks on tires and roads, and continuous motion causes wear and damage to tires and road pavements. Consequently, TRWPs are generated in the form of microplastics, which is a mixture of TWPs and RWPs (50:50 ratio) [
8]. Additionally, the amount of generated TRWPs may vary depending on the driver’s habit, transportation modes, tires, road environment, and climate and temperature conditions [
9].
TRWPs exists in various environments and causes environmental pollution. In particular, TRWPs flowing into water pathways may affect drinking water for humans, and TRWPs flowing into rivers and seas due to the flow of water may have another negative impact on the ecosystem and humans. Under these circumstances, we recognized the need to develop practical technologies to reduce the generation of TRWPs, to ensure a healthy life for all, and to ensure the availability and sustainable management of water and sanitation. So, among the various conditions affecting the generation of TRWPs, we paid attention to the road environment, and we tried to understand the accurate situation through sampling and analysis of the roadside environment before developing a road technology for TRWPs’ reduction. In addition, in order to select the location of the general road environment in Korea, we selected and studied a place where only buses and passenger cars move without industrial vehicle movement, which are representative means of transportation.
This study aimed to understand the variation in concentration of TRWPs according to temperature changes. So, we were collected dust samples from roadsides during summer and winter. TRWPs from the collected dust samples were separated and quantified based on particle size and density [
10], and the characteristics of the separated samples were analyzed using a scanning electron microscope (SEM) and a thermogravimetric analyzer (TGA) [
11,
12,
13]. Based on the analysis results, the concentration of TRWPs in roadside dust and the ratio of TWPs and RWPs of TRWPs were quantified, respectively.
2. Materials and Methods
In this study, in order to confirm the amount of TRWPs generated according to the temperature change in the road environment and to find out the difference in the concentration of TRWPs along the roadside according to the difference in the road environment and according to the seasonal temperature change, the experimental methods were conducted in three steps: (1) collected roadside dust, (2) separated only TRWPs from the dust, and (3) quantified and analyzed TRWPs.
2.1. Roadside Dust Sampling
In this study, we considered the vehicle traffic volume and environments during the sampling period to be important in order to check only the effect of temperature difference. Therefore, the dust sampling location was selected at the roadside of the express bus terminal in Cheonan city, Chungcheongnam-do, Korea (
Figure 2), and the sampling locations were set at distance intervals of 150 m and collected from six roadside locations in summer (July, 27 ± 1 °C) and winter (January, −4 ± 1 °C). In addition, the sampling locations have only commercial facilities within the section, and it is not related to the commute of workers and students, so the summer and winter vehicular traffic volume was similar at 1300 vehicles per hour, and the section can only be driven at a limited speed of 50 km/h. The sampling duration was set at two-day intervals for a month, and 1000 g (100 g/day) of dust samples were collected using a vacuum cleaner (Dyson V8, suction power: 115 AW) at 0, 1, and 4 m points from the roadside. The collected samples were then pre-treated at 100 °C in an oven for 48 h to remove moisture.
2.2. Experimental Materials and Analysis Systems
Test sieves were used to separate the collected roadside dust samples by particle size, and a standard solution mixture of dibromomethane (Cas no: 74-95-3; Sigma-Aldrich, St. Louis, MO, USA) and Trans-1,2-dichloroethylene (Cas no: 156-60-5; Sigma-Aldrich) was used as a pretreatment reagent to separate TRWPs from dust. Additionally, the characteristics of the separated samples were analyzed using SEM and TGA.
2.3. Separation of Roadside Dust Samples by Particle Size
The distribution of TRWPs is largest in the particle size range of 75–150 µm [
14,
15]. Therefore, in this study, only dust samples in this size range were separated from dried roadside dust samples in a 100 °C oven for 48 h (
Figure 3a) using 75 and 150 μm test sieves (
Figure 3b), and the weight of each sample was measured (
Figure 3c).
2.4. Separation of the Dust Samples by Particle Density
The dust samples separated in the 75–150 µm range consist of inorganic materials, including stones, soil, road debris, and glass components, with a density of 2.2 g/cm
3 or higher, and TRWPs with a density of 1.2–1.6 g/cm
3 [
15,
16,
17,
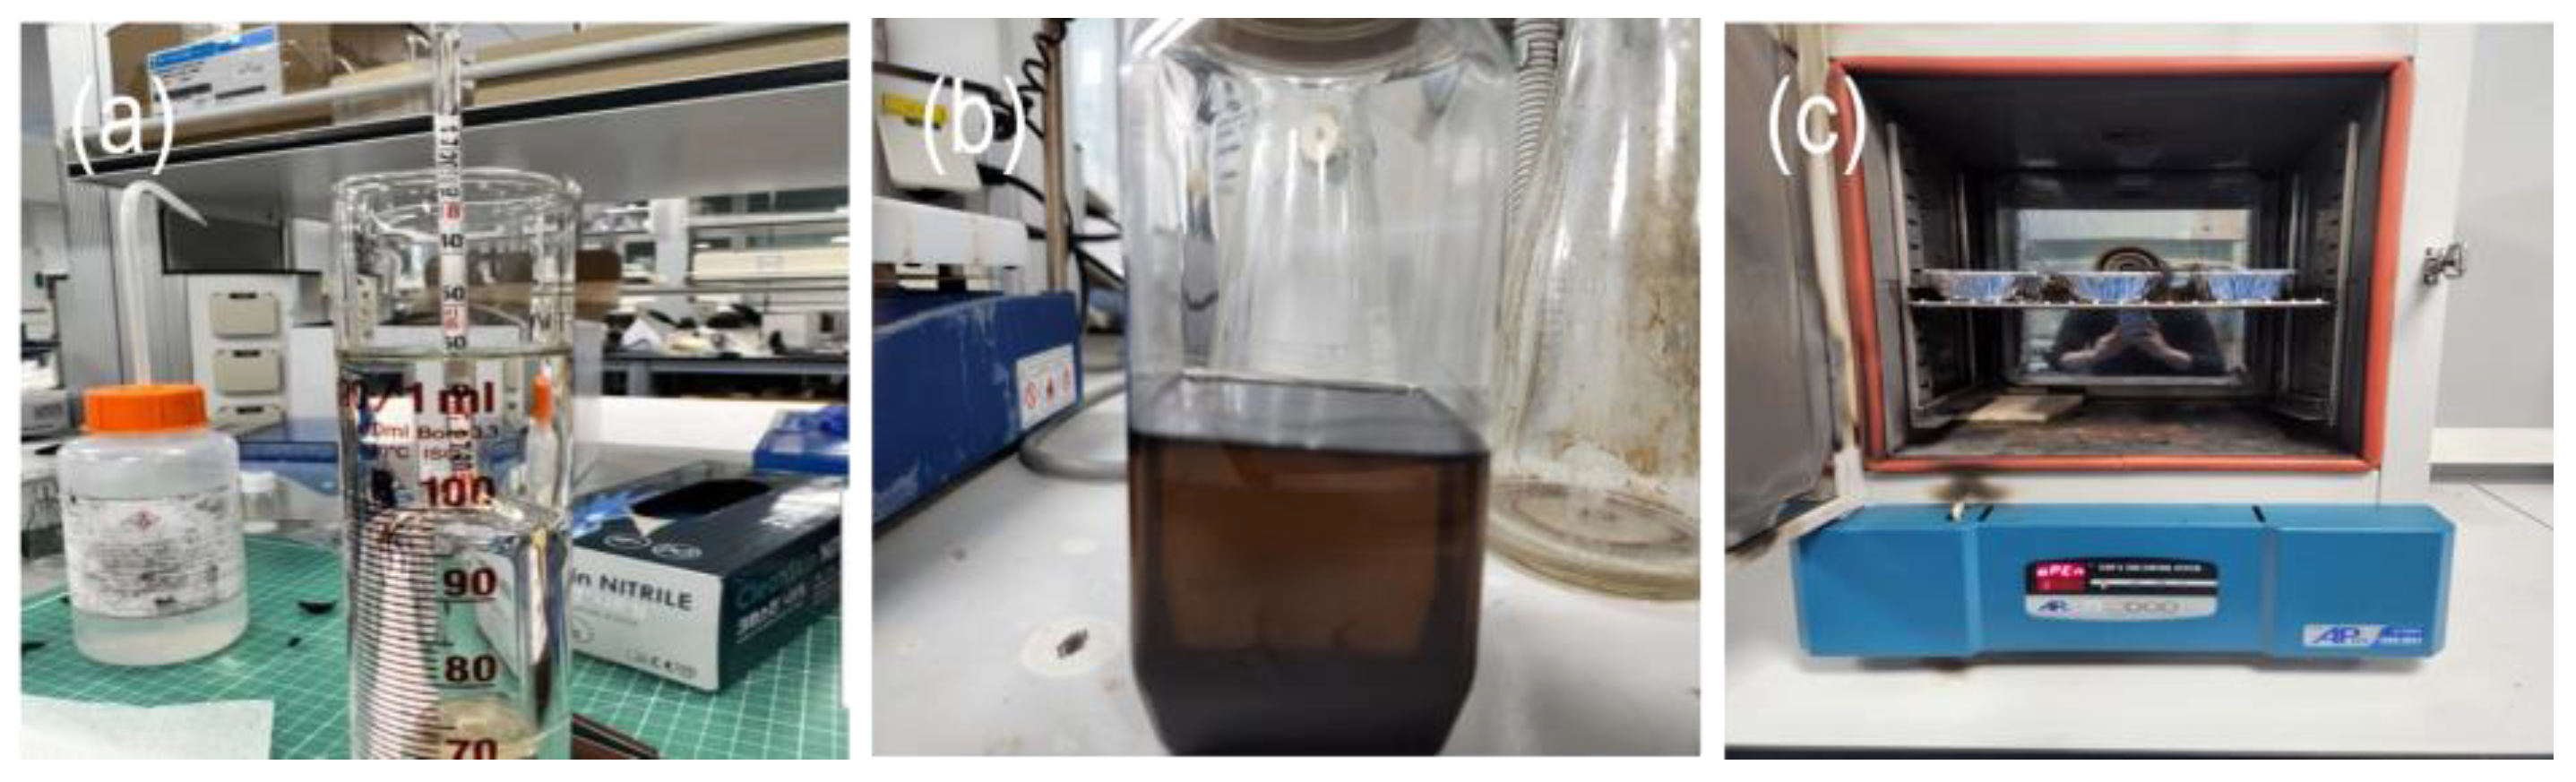
18]. A standard solution (density: 1.8 g/cm
3) was prepared by mixing 43.5% dibromomethane and 56.5% Trans-1,2-dichloroethylene using Equation (1) and was subsequently used to separate only TRWPs from the samples.
where A
density and A
ratio are the densities of dibromomethane (2.497 g/cm
3) and its mixing ratio, respectively, B
density and B
ratio are the densities of Trans-1,2-dichloroethylene (1.256 g/cm
3) and its mixing ratio, respectively, and 0.997 are the densities of water. The density of the prepared solution was determined as 1.8 g/cm
3 using a hydrometer as shown in
Figure 4a. Further, 100 mL of the solution was added to 10 g of the sample, and after 24 h, only the upper part of the mixture was separated (
Figure 4b), which was then heated in an oven at 100 °C for 24 h to completely eliminate the liquid component and moisture and isolate only TRWPs (
Figure 4c). The weight of the secured TRWPs samples was measured for further quantification.
2.5. Analysis of the TRWPs Characterization and Quantification
The geometry of the separated TRWPs was observed using SEM (JSM-6390LV SEM; JEOL, Tokyo, Japan). Additionally, the contents of TWPs, RWPs, and minerals were analyzed using TGA (TGA/DSC; Mettler Toledo, Greifensee, Switzerland). For the analysis conditions, each sample was heated from 50 to 900 °C, while the temperature was increased at a rate of 20 °C/min. Moreover, N2 gas was injected in the 50–700 °C temperature range, and air was supplied at a rate of 50 mL/min in the 700–900 °C temperature range.
3. Results
In this study, in order to find out the difference in TRWPs’ concentration along the roadside according to the difference in the road environment and according to the seasonal temperature change, the results of analysis of the TRWPs’ quantification through experimental methods are indicated. In addition, the TRWPs’ characteristics and component ratios are confirmed through the analysis results of separation, respectively, in order to identify the main causes of TRWPs.
3.1. Particle Size Separation for Roadside Dust Samples
Roadside dust samples (1000 g) in the 75–150 µm size range, which includes TRWPs, were separated using the test sieves, and the results are shown in
Table 1. Dust particles could be separated into 25.157, 22.397, and 13.878 g on average for 0, 1, and 4 m distance points from the roadside, respectively. Dust in roads, mainly generated by different transportation modes, is dispersed into the atmosphere or the roadside environment. Our results indicated that the amount of dust samples decreased as the distance from the roadside increased, owing to the reduction in the mechanical and environmental action caused by the transportation modes. Additionally, the dust particles indicated similar amounts at each location, respectively, and their amounts at 0 m from the roadside was 3.55% higher in summer (25.611 g) than in winter (24.703 g). The amount of dust particles at 1 m from the roadside was 5.72% higher in summer (23.025 g) than in winter (21.707 g), whereas that at 4 m from the roadside was 6.77% higher in summer (14.364 g) than in winter (13.392 g).
3.2. Density Separation for Separated Dust Samples
Table 1 shows the density separation results for the separated dust samples. TRWPs could be separated into 0.473, 0.423, and 0.145 g on average for 0, 1, and 4 m points from the roadside, respectively. Additionally, the amount of TRWPs at 0 m from the roadside was 24.2% higher in summer (0.539 g) than in winter (0.408 g). The TRWPs’ amount at 1 m from the roadside was 24.1% higher in summer (0.474 g) than in winter (0.373 g), whereas that at 4 m from the roadside was 7.6% higher in summer (0.151 g) than in winter (0.139 g). If it is assumed that the vehicle type and load conditions are similar, these results indicate that the amount of TRWPs increased with increasing external temperatures. Although some small loss errors could occur during the density separation process, TRWPs accounted for less than 2% of the roadside dust samples in the 75–150 µm size range.
3.3. TRWPs Characteristics
The geometry of the TRWPs, which were separated based on the particle size and density, acquired using SEM, is shown in
Figure 5. The dust samples in the 75–150 µm size range subjected to particle size separation exhibited irregular geometry, while the TRWPs samples in the same size range subjected to density separation were observed in the form of microparticles. This was because TWPs and RWPs were mixed and rolled due to the friction between tires and roads during vehicular traffic [
14,
15]. In addition, these results mean that only TRWPs are well separated from roadside dust, and it was confirmed that the density of TRWPs was 1.8 g/cm
3 or less.
3.4. TRWPs Component Ratios
TGA was conducted to estimate the contents of TWPs, RWPs, and minerals in the TRWPs separated from roadside dust samples. First, standard samples of tire rubber and road compositions were prepared to estimate the contents of tire and road components in TRWPs, respectively. The standard sample of tire rubber compositions was prepared by separating the tread rubber parts of tires for passenger cars (PCR), small trucks (LTR), and trucks/buses (TBR), which are commonly used in Korea. The samples were powdered (CMTT: cryo-milled tire tread) through liquid nitrogen cryogenic grinding and mixed using a ball mixer at the same ratio (7:1:2) as the registration status of vehicle types and tire sales in Korea. As a high-level overview, the procedure consists of removing strips of tread compound from new tires that have not been mounted on vehicles, being mindful not to contaminate them with surrounding compound components, cutting the strips of tread into 1 cm
3 pieces using a water jet machine, and cryo-milling the cut tread materials into particles based on defined ball mill machine set-up specifications.
Table 2 shows the tire brands used for preparing the standard sample of road compositions using the hot asphalt mixture (SPS-KA10002-F2349-5689), which is the road pavement specification used in Korea. Compositions were prepared using a ball mixer after mixing 92.9% aggregate, 5% fine aggregate, 2% asphalt, and 0.1% filler. According to the TGA results for the prepared standard samples, 80.36% of the tire rubber composition sample comprised organic materials, polymers, and carbon black, whereas 93.92% of the road sample comprised ash that was composed of inorganic materials.
Table 3 shows the component analysis results for the TRWPs separated in this study. Based on the analysis results for the standard samples, the tire and road contents in the separated TRWPs were estimated using Equations (2) and (3). The corresponding results are shown in
Table 4 and
Table 5.
where
Tr is the estimated content of tire components in TRWPs,
Rr is the estimated content of road components and minerals (dust),
CRt is the value of the corresponding component of the tire rubber composition standard sample in
Table 3,
CRr is the value of the corresponding component of the road standard sample in
Table 3,
TRWPt is the content of tire components in TRWPs,
TRWPr is the content of road components in TRWPs, and
CRTRWP is the value of the corresponding component for separated TRWPs samples with respect to fine dust samples in
Table 3. Based on the TGA results and the results of calculations of Equations (2) and (3), we found that the tire and road (including minerals) components represented approximately 30% and 70% of the TRWPs dispersed in roadside fine dust, respectively, regardless of the collection period and location.
4. Discussion
Using dust samples collected from six roadsides near the Cheonan city express bus terminal in Korea during summer and winter, the amount of TRWPs generated by the difference in temperature change was confirmed and the results were indicated. The results indicate that the amount of TRWPs increases as the external temperature increases. In addition, we confirmed that the component ratio of TRWPs consisted of 30% TWPs and 70% RWPs. This means that the road pavement environment has a larger influence than tires on the generation of TRWPs.
Based on these results, we need to research development and application of new road pavements for the reduction in TRWPs generated in Korea, and it must be applied to continuously reduce the temperature despite vehicular traffic. However, the scope of this study is limited to Korea; because the road environment may be different in each region, the vehicle and tire conditions are different. This means that the amount of TRWPs generated in the road environment may be different, and the mixture consisting of TWPs and RWPs of TRWPs may be different. Through the results of this study, we confirm that the methods of the lower external temperature of the road environment can contribute to reducing TRWPs’ generation.
5. Conclusions
TRWPs, which are unintentionally generated during vehicular traffic, and their amount varies depending on several factors, such as transportation modes and environmental conditions. They may be scattered into the atmosphere or dispersed to roads, soil, and oceans depending on their particle size. Scattered TRWPs exist in a variety of environments and can cause to environmental contamination. In this study, dust samples were collected from roadside locations near the express bus terminal of Cheonan city, Korea, in summer and winter to measure the TRWPs’ contents in the roadside environment in order to understand the changes in the TRWPs’ concentration according to the difference in road environment caused by seasonal changes in temperature. Only TRWPs were separated from the collected dust samples and analyzed and quantified using SEM and TGA. We found that TRWPs accounted for less than 2% of the dust samples collected from roadsides, and with increasing temperatures, their content increased by approximately 7.6–24.2% in summer more than in winter. Additionally, the TGA results confirmed that the tire components accounted for approximately 30%, and the road components and minerals accounted for approximately 70% of the TRWPs from the roadside environment.
In the future, the amount of TRWPs generated in Korea will increase because the number of registered vehicles has increased annually by 2–3%. Thus, the TRWPs’ content in various environments, including roadsides, is expected to increase. So, we need to consider how to reduce the amount of TRWPs generated during vehicular traffic. As a result of this study, we were able to confirm that existing TRWPs in the roadside are mostly composed of road pavement particles, and the amount of generated TRWPs increases depending on the temperature rise in the road environment. This means that the road environment has more influence than the tires on the amount of TRWPs’ generated. So, we need to research the development and application of excellent road pavements in regard to heat resistance and durability, as well as technology to lower the road surface temperature for reducing the occurrence of TRWPs in Korea. However, the scope of this study is limited to Cheonan city and can be expanded to various regions in Korea in future research to enhance the validity of our proposed methods. We also plan to conduct further studies to determine the difference in the amount of generated TRWPs under various road condition such as road surface roughness, concrete, and asphalt roads.
In addition, these research results may be limited to the Korean environment. Although it cannot be mentioned in detail as the industry is confidential, depending on climatic factors in each region, the composition ratio of tires and roads differs, resulting in different performance. For this reason, the contribution of the main factors of TRWPs generated in the road environment may differ from region to region. This study was conducted with the support of the Ministry of Land, Infrastructure and Transport, Republic of Korea, to ensure availability and sustainable management of water and sanitation and healthy lives for all in the road environment.
Author Contributions
Conceptualization, T.K. and H.K.; methodology, T.K.; investigation, H.K.; field sampling, T.K.; analysis, T.K.; data curation, H.K.; writing—original draft preparation, T.K.; writing—review and editing, H.K. All authors have read and agreed to the published version of the manuscript.
Funding
This work was supported by the Ministry of Land, Infrastructure and Transport, Republic of Korea (RS-2019-KA152342).
Data Availability Statement
The data presented in this study are available on request from the corresponding author.
Acknowledgments
We thank the Ministry of Land, Infrastructure and Transport, Republic of Korea, for their support.
Conflicts of Interest
The authors declare no conflict of interest.
References
- Manisalidis, I.; Stavropoulou, E.; Stavropoulos, A.; Bezirtzoglou, E. Environmental and health impacts of air pollution: A review. Front. Public Health 2020, 8, 14. [Google Scholar] [CrossRef] [PubMed]
- Galloway, T.S.; Cole, M.; Lewis, C. Interactions of microplastic debris throughout the marine ecosystem. Nat. Ecol. Evol. 2017, 5, 116. [Google Scholar] [CrossRef] [PubMed]
- Kang, T.-W.; Kim, H. A basic study on the generation of tire & road wear particles by differences in tire wear performance. J. Korean Recycl. Constr. Resour. Inst. 2021, 4, 561–568. [Google Scholar]
- Baensch-Baltruschat, B.; Kocher, B.; Kochleus, C.; Stock, F.; Reifferscheid, G. Tyre and road wear particles—A calculation of generation, transport and release to water and soil with special regard to German roads. Sci. Total Environ. 2021, 752, 15. [Google Scholar] [CrossRef]
- Panko, J.M.; Chu, J.; Kreider, M.L.; Unice, K.M. Measurement of airborne concentrations of tire and road wear particles in urban and rural areas of France, Japan, and the United States. Atmos. Environ. 2013, 72, 192–199. [Google Scholar] [CrossRef]
- Panko, J.M.; Hitchcock, K.M.; Fuller, G.W.; Green, D. Evaluation of tire wear contribution to PM2.5 in urban environments. Atmosphere 2019, 10, 99. [Google Scholar] [CrossRef]
- O’Connor, J.D.; Mahon, A.M.; Ramsperger, A.F.R.M.; Trotter, B.; Redondo-Hasselerharm, P.E.; Koelmans, A.A.; Lally, H.T.; Murphy, S. Microplastics in freshwater biota: A critical review of isolation, characterization, and assessment methods. Glob. Chall. 2020, 4, 6. [Google Scholar] [CrossRef] [PubMed]
- Hesse, D.; Feißel, T.; Kunze, M.; Bachmann, E.; Bachmann, T.; Gramstat, S. Comparison of methods for sampling particulate emissions from tires under different test environments. Atmosphere 2022, 13, 1262. [Google Scholar] [CrossRef]
- Lee, S.; Kwak, J.; Kim, H.; Lee, J. Properties of roadway particles from interaction between the tire and road pavement. Int. J. Automot. Technol. 2013, 14, 163–173. [Google Scholar] [CrossRef]
- Kovochich, M.; Liong, M.; Parker, J.A.; Oh, S.C.; Lee, J.P.; Xi, L.; Kreider, M.L.; Unice, K.M. Chemical mapping of tire and road wear particles for single particle analysis. Sci. Total Environ. 2021, 757, 25. [Google Scholar] [CrossRef] [PubMed]
- Klöckner, P.; Reemtsma, T.; Eisentraut, P.; Braun, U.; Ruhl, A.S.; Wagner, S. Tire and road wear particles in road environment—Quantification and assessment of particle dynamics by Zn determination after density separation. Chemosphere 2019, 222, 714–721. [Google Scholar] [CrossRef] [PubMed]
- More, S.L.; Miller, J.V.; Thornton, S.A.; Chan, K.; Barber, T.R.; Unice, K.M. Refinement of a microfurnace pyrolysis-GC–MS method for quantification of tire and road wear particles (TRWP) in sediment and solid matrices. Sci. Total Environ. 2023, 874, 20. [Google Scholar] [CrossRef] [PubMed]
- Unice, K.M.; Kreider, M.L.; Panko, J.M. Use of a deuterated internal standard with pyrolysis-GC/MS dimeric marker analysis to quantify tire tread particles in the environment. Int. J. Environ. Res. Public Health 2012, 9, 4033–4055. [Google Scholar] [CrossRef] [PubMed]
- Klöckner, P.; Seiwert, B.; Weyrauch, S.; Escher, B.I.; Reemtsma, T.; Wagner, S. Comprehensive characterization of tire and road wear particles in highway tunnel road dust by use of size and density fractionation. Chemosphere 2021, 279, 130530. [Google Scholar] [CrossRef] [PubMed]
- Jung, U.; Choi, S.-S. Classification and characterization of tire-road wear particles in road dust by density. Polymer 2022, 145, 1005. [Google Scholar] [CrossRef] [PubMed]
- Rasmussen, L.A.; Lykkemark, J.; Andersen, T.R.; Vollertsen, J. Permeable pavements: A possible sink for tyre wear particles and other microplastics? Sci. Total Environ. 2023, 869, 161770. [Google Scholar] [CrossRef] [PubMed]
- Harrison, R.M.; Jones, A.M.; Gietl, J.; Yin, J.; Green, D.C. Estimation of the contributions of brake dust, tire wear, and resuspension to nonexhaust traffic particles derived from atmospheric measurements. Environ. Sci. Technol. 2012, 46, 6523–6529. [Google Scholar] [CrossRef] [PubMed]
- Wåhlin, P.; Berkowicz, R.; Palmgren, F. Characterization of traffic-generated particulate matter in Copenhagen. Atmos. Environ. 2006, 40, 2151–2159. [Google Scholar] [CrossRef]
| Disclaimer/Publisher’s Note: The statements, opinions and data contained in all publications are solely those of the individual author(s) and contributor(s) and not of MDPI and/or the editor(s). MDPI and/or the editor(s) disclaim responsibility for any injury to people or property resulting from any ideas, methods, instructions or products referred to in the content. |
© 2023 by the authors. Licensee MDPI, Basel, Switzerland. This article is an open access article distributed under the terms and conditions of the Creative Commons Attribution (CC BY) license (https://creativecommons.org/licenses/by/4.0/).


