Article

Evaluation of Electroosmotic Permeability Using Different Models and Investigation of Its Effect on Chromium Removal

School of Civil Engineering, Wuhan University, Wuhan 430072, China
*
Author to whom correspondence should be addressed.
Sustainability 2023, 15(17), 12706; https://doi.org/10.3390/su151712706
Submission received: 29 June 2023 / Revised: 19 August 2023 / Accepted: 20 August 2023 / Published: 22 August 2023
(This article belongs to the Special Issue Sustainable Management and Remediation of Contaminated Sites)

Abstract

:
Electroosmotic permeability is an important parameter in the electrokinetic remediation (EKR) of heavy-metal-contaminated soil. This study focuses on the applicability of electroosmotic permeability models and the relationship between electroosmotic permeability and heavy metal removal efficiency. The electroosmotic permeability models of ion hydration and the ion hydration–friction model were developed and investigated. Moreover, 11 EKR experiments were conducted in the laboratory to remediate Cr6+-contaminated soil. The results showed that the electroosmotic permeability calculated by the H-S model was 3–7 times larger than the measured value, and it was 65–90% of the measured value as calculated by the ion hydration model. However, the ion hydration–friction model, which combined the ion hydration and Spiegler friction theories, predicted the electroosmotic permeability more accurately compared to the H-S and ion hydration models. In addition, the parameters in the ion hydration–friction model were determined easily, meaning that the ion hydration–friction model is of good applicability. The experimental results showed that the soil properties changed and the electroosmotic flow rate decreased when acid was added to the soil, and the Cr6+ removal efficiency improved.

1. Introduction

The heavy metal pollution of soil has caused global concern recently [1]. Heavy metals in soil can easily enter into the groundwater system via rainfall or absorption by plants, which threatens human health. In particular, chromium pollution has drawn attention recently. Chromium exists mainly in trivalent or hexavalent compounds in nature. Both Cr3+ and Cr6+ are toxic, but Cr6+ is much more toxic than Cr3+ [2]. Cr6+ is carcinogenic and exists as anions of CrO42−, HCrO4, and Cr2O72− in nature [3]. Cr6+ is soluble in water and can easily penetrate the groundwater system by rain, subsequently polluting the ecosystem and threatening human health. Electrokinetic remediation (EKR) is a reliable method developed in recent years to remediate heavy-metal-contaminated soil [4,5]. During EKR, an electric field is applied to the contaminated soil through electrodes connected to a power supply. The contaminants are removed from the soil using the electrokinetic functions of electroosmotic flow, electromigration, electrophoresis, and diffusion [3,5,6,7]. The EKR method has been proven to be environmentally friendly and is especially suitable for soils with low hydraulic permeability [8,9]. Electromigration is the phenomenon of anions or cations migrating towards the opposite polarity in an electric field, and the electromigration velocity of ions is mainly related to ion species, pore solution concentration, soil porosity, and soil tortuosity [10]. Electroosmotic flow is the result of the surface charge properties of soil particles; it usually flows towards the cathode [11]. The soil particle surface is generally negatively charged, and pore water near soil particles provides more cations than anions [12]. Parts of cations in pore water combine with water molecules to form hydrated ions, and the positively charged hydrated ions migrate towards the cathode in the electric field. Therefore, the electroosmotic flow usually flows from the anode to the cathode. The EKR method has been proven to be effective in the remediation of heavy-metal-contaminated soil. For instance, EKR was combined with polyaniline auxiliary electrodes to remediate Cr6+-contaminated soil, and the removal efficiency was 60.11% [13]. EKR combined with the third electrode of iron-treated activated carbon was used to remediate Cr6+-contaminated soil, and the removal efficiency was 80.20% (2 v/cm, 10 days, 5% dose of electrode particles) [14]. A novel three-dimensional EKR system (FeOx/granular activated carbon (GAC) composite constituting a third electrode) was used to remediate Cr6+-contaminated soil, and the Cr6+-leaching removal efficiency reached 88.90% [15].
During EKR, anions in pore water migrate towards the anode under the electromigration function, and the electroosmotic flow may carry some anions towards the cathode [16]. Therefore, a smaller or reversed electroosmotic flow was expected when using the EKR method to remove anionic contaminants from soil [3]. Moreover, the electroosmotic flow rate is closely related to the electroosmotic permeability of soil. The theory of electroosmotic permeability used in most practical and theoretical research is the Helmholtz–Smoluchowski model (H-S model) [17,18,19,20]. The electroosmotic permeability in the H-S model is determined by the porosity and zeta potential of soil. The zeta potential of soil is closely related to the electrochemical properties of pore water and the mineralogy of soil particles [21,22,23,24]. The electroosmotic permeability is hard to estimate using the H-S model because the zeta potential cannot be easily determined [10,25,26]. Moreover, the hypothesis that anions and cations are unevenly distributed in pore water is made in the H-S model. Therefore, the H-S model is only suitable for macropores (diameter larger than 1000 A) [12,21,27]. The estimation of electroosmotic permeability by the H-S model is not very accurate for fine-grade soil such as clays [27]. It has been proven that the electroosmotic permeability calculated by the H-S model was an order of magnitude larger than the practical value [28,29,30].
In addition to the H-S model, the Schmid model and Gan–Zhou model are often used to calculate electroosmotic permeability [10]. In the Schmid model, electroosmotic permeability is expressed as k e = A o F r 2 n 8 η . The Schmid model is suitable for micropores (diameter smaller than 1000 A), but it is not suitable for soils with a high salt content [10]. In the Gan–Zhou model, electroosmotic permeability is expressed as k e = σ δ C i ( x ) U i * η 1 F z i I c A · E f , which explains the optimal soil salinity when calculating electroosmotic permeability [10].
Although some research has been conducted on electroosmotic permeability, few studies exist on the relationship between soil physicochemical properties, electroosmotic flow, and heavy metal removal efficiency. Moreover, previous research mostly focused on the relationship between electroosmotic permeability and a certain parameter, such as saturation, salinity, etc. [17,31,32]. This research included 11 EKR experiments to study the effect of electroosmotic permeability on Cr6+ removal efficiency. Then, theoretical models were established to calculate the electroosmotic permeability. Cr6+ was selected as the pollutant in soil for its nonreactive and stable characteristics [33]. The objectives of this research were to (1) establish ion hydration and ion hydration–friction models based on the theories of ion hydration and ion friction. Subsequently, we aimed to compare the electroosmotic permeability calculated by ion hydration, ion hydration–friction, and H-S models with the measured values. To determine the applicability of these models, we also (2) studied the relationship between electroosmotic permeability and heavy metal removal efficiency.

2. Materials and Methods

2.1. Materials and Preparation of Cr6+-Contaminated Soil

The 717 anion exchange resin was obtained from Shanghai Magic Speed Scientific Equipment Co., Ltd. in Shanghai of China. Citric acid C 6 H 8 O 7 ,   purity 99 . 5 % , nitric acid (HNO3), hydrochloric acid (HCl), potassium dichromate K 2 Cr 2 O 7 , purity 99 . 9 % , sodium hydroxide (NaOH), and acetic acid (CH3COOH) were obtained from Wuhan Xinshen Chemical Technology Co., Ltd. in Wuhan of China. All the chemicals used were of analytical grade. Deionized water was used in all experiments.
The contaminated soil used was kaolin soil from Yuchuan Mining Co., Ltd. in Zhengzhou of China. Kaolin provides the characteristics of low hydraulic permeability, low ion exchange capacity, and no organic matter. The chromium-contaminated soil was prepared by adding potassium dichromate (K2Cr2O7) solution in a certain proportion to kaolin. Then, the chromium-contaminated soil was poured into a model box layer-by-layer and left to stand for one day before the EKR experiment operation. The main properties and concentration of Cr6+-contaminated soil are listed in Table 1. The target Cr6+ concentration and water content were 500 mg/kg and 30%, respectively. Before EKR, the Cr6+ concentration of soil was 498.5 mg/kg and the water content was 29.8%.

2.2. Experimental Setup

The experimental setup is shown in Figure 1. The setup was made from plexiglass and consisted of three chambers: soil chamber 30   cm   ×   10   cm   ×   10   cm , exchange resin chamber 2   cm   ×   10   cm   ×   10   cm , and electrode chamber 3   cm   ×   10   cm   ×   10   cm . The exchange resin chamber had 6 ×   6 perforated holes (diameter 8 mm) on both sides and could be pulled out through a slot. Filter papers were placed inside the chamber on both sides to prevent resin leakage. The cathode electrode chambers had drainage holes to drain the overflowing solution from the electrode chamber. There were two cylindrical electrodes made from graphite (diameter 1.2 cm; length 12 cm) placed in the anode and cathode chambers. They were connected to the anode and cathode of the power supply. The power supply (AB-F instrument, SS-6010KD, Shanghai, China) offered a direct voltage output ranging from 0 to 60 V.

2.3. Experimental Procedures

Eleven EKR experiments were performed in the laboratory, as listed in Table 2. The potential gradient was 2 V/cm and the EKR lasted for 5 days in each of the experiments. The electrolytes in the anode and the cathode sides were 0.5   m o l / L citric acid in all the experiments, and the exchange resin chambers were filled with 717 anion exchange resin. The Cr6+ in soil exists as anions of CrO42−, HCrO4, and Cr2O72− and migrates towards the anode in the electric field [3]. Moreover, the citric acid was capable of reducing Cr6+ to Cr3+, subsequently forming less toxic and negative Cr3+-cit complexes which moved to the anode [34]. The potential gradient (2 V/cm), duration of EKR (5 days), and the electrolyte concentration (0.5 mol/L citric acid) were selected based on our previous research. The EKR method showed a higher Cr6+ removal efficiency as the experimental conditions used in that previous study were the same as those used in this study [35]. The 717 anion exchange resin showed a good adsorption capacity in the acid environment, and citric acid in the cathode worked as a buffer solution during EKR, meaning that the citric acid in the anode provided an acid environment for the anion exchange resin. All the experiments were carried out at room temperature.
The pH of pore solution affects the number of charges on the surface of soil particles. The zeta potential and CEC are closely related to the surface charge property of soil particles. We changed the CEC and zeta potential of soil by changing the pH of the pore solution. Experiment EK1 was the control experiment, and the pore solution was deionized water. The pore solutions for experiments EK2–EK7 were 0.1–1.0 mol/L acetic acid and 0.1–1.0 mol/L citric acid for experiments EK8–EK11. The corresponding zeta potential and CEC of the soils are listed in Table 2.
In every experiment, 6.18 g solid K2Cr2O7 was added to a different concentration of pore solution (956 mL). Then, dry kaolin soil was mixed with this prepared solution. The contaminated soil was then covered with plastic wrap and left to stand for one week. Subsequently, about 4.371 kg contaminated soil filled the soil chamber layer-by-layer. Approximately 400 mL citric acid solution was injected into both the anode and cathode chambers. For every experiment, the soil chamber was divided into five parts (S1–S5) from the anode to cathode equally for sampling and numbering. Soil from sections S1–S5 was sampled using a spoon every day to measure the pH and Cr6+ concentration. The soil samples (about 8 g for every soil section) were taken from 2 to 4 cm below the surface. The volume of the cathode electrolyte increased during EKR as the electroosmotic flow flowed from the anode to the cathode. Moreover, the volume of the anode electrolyte decreased with time due to electroosmotic flow and electrolysis. The anode electrolyte was refilled with 0.5 mol/L citric acid solution every 8 h. The volume of electroosmotic flow was recorded every 30 min. The exchange resin in the anode and cathode sides was collected after EKR and desorbed with 1 M NaOH. Subsequently, the negative complexes of Cr adsorbed by exchange resin were determined by measuring the Cr6+ in NaOH solution.

2.4. Analytical Methods

The Cr6+ concentration of soil was measured using a flame atomic absorption spectrophotometer (ZA3000, Hitachi High-Tech Global, Tokyo, Japan) according to the standard HJ 1082-2019 [36]. The zeta potential of soil was measured using a nano particle size and zeta potential analyzer (Malvern Zetasizer Nano ZS90, Malvern Instruments Ltd., Malvern, UK). The CEC of the soil was measured using a visible spectrophotometer (V-5100, Shanghai Metash Instruments Co., Ltd., Shanghai, China) according to the standard HJ 889-2017 [37]. The physical properties of the soil were tested according to the standard for the geotechnical testing method [38]. The water content of soil was measured using an oven-drying method. The density and grain density of soil were tested using the cutting-ring method and pycnometer method, respectively. In addition, the porosity, saturation, and dry density were calculated using the parameters mentioned above.

3. Results and Discussion

3.1. Electroosmotic Permeability Determination with Different Models and Experiments

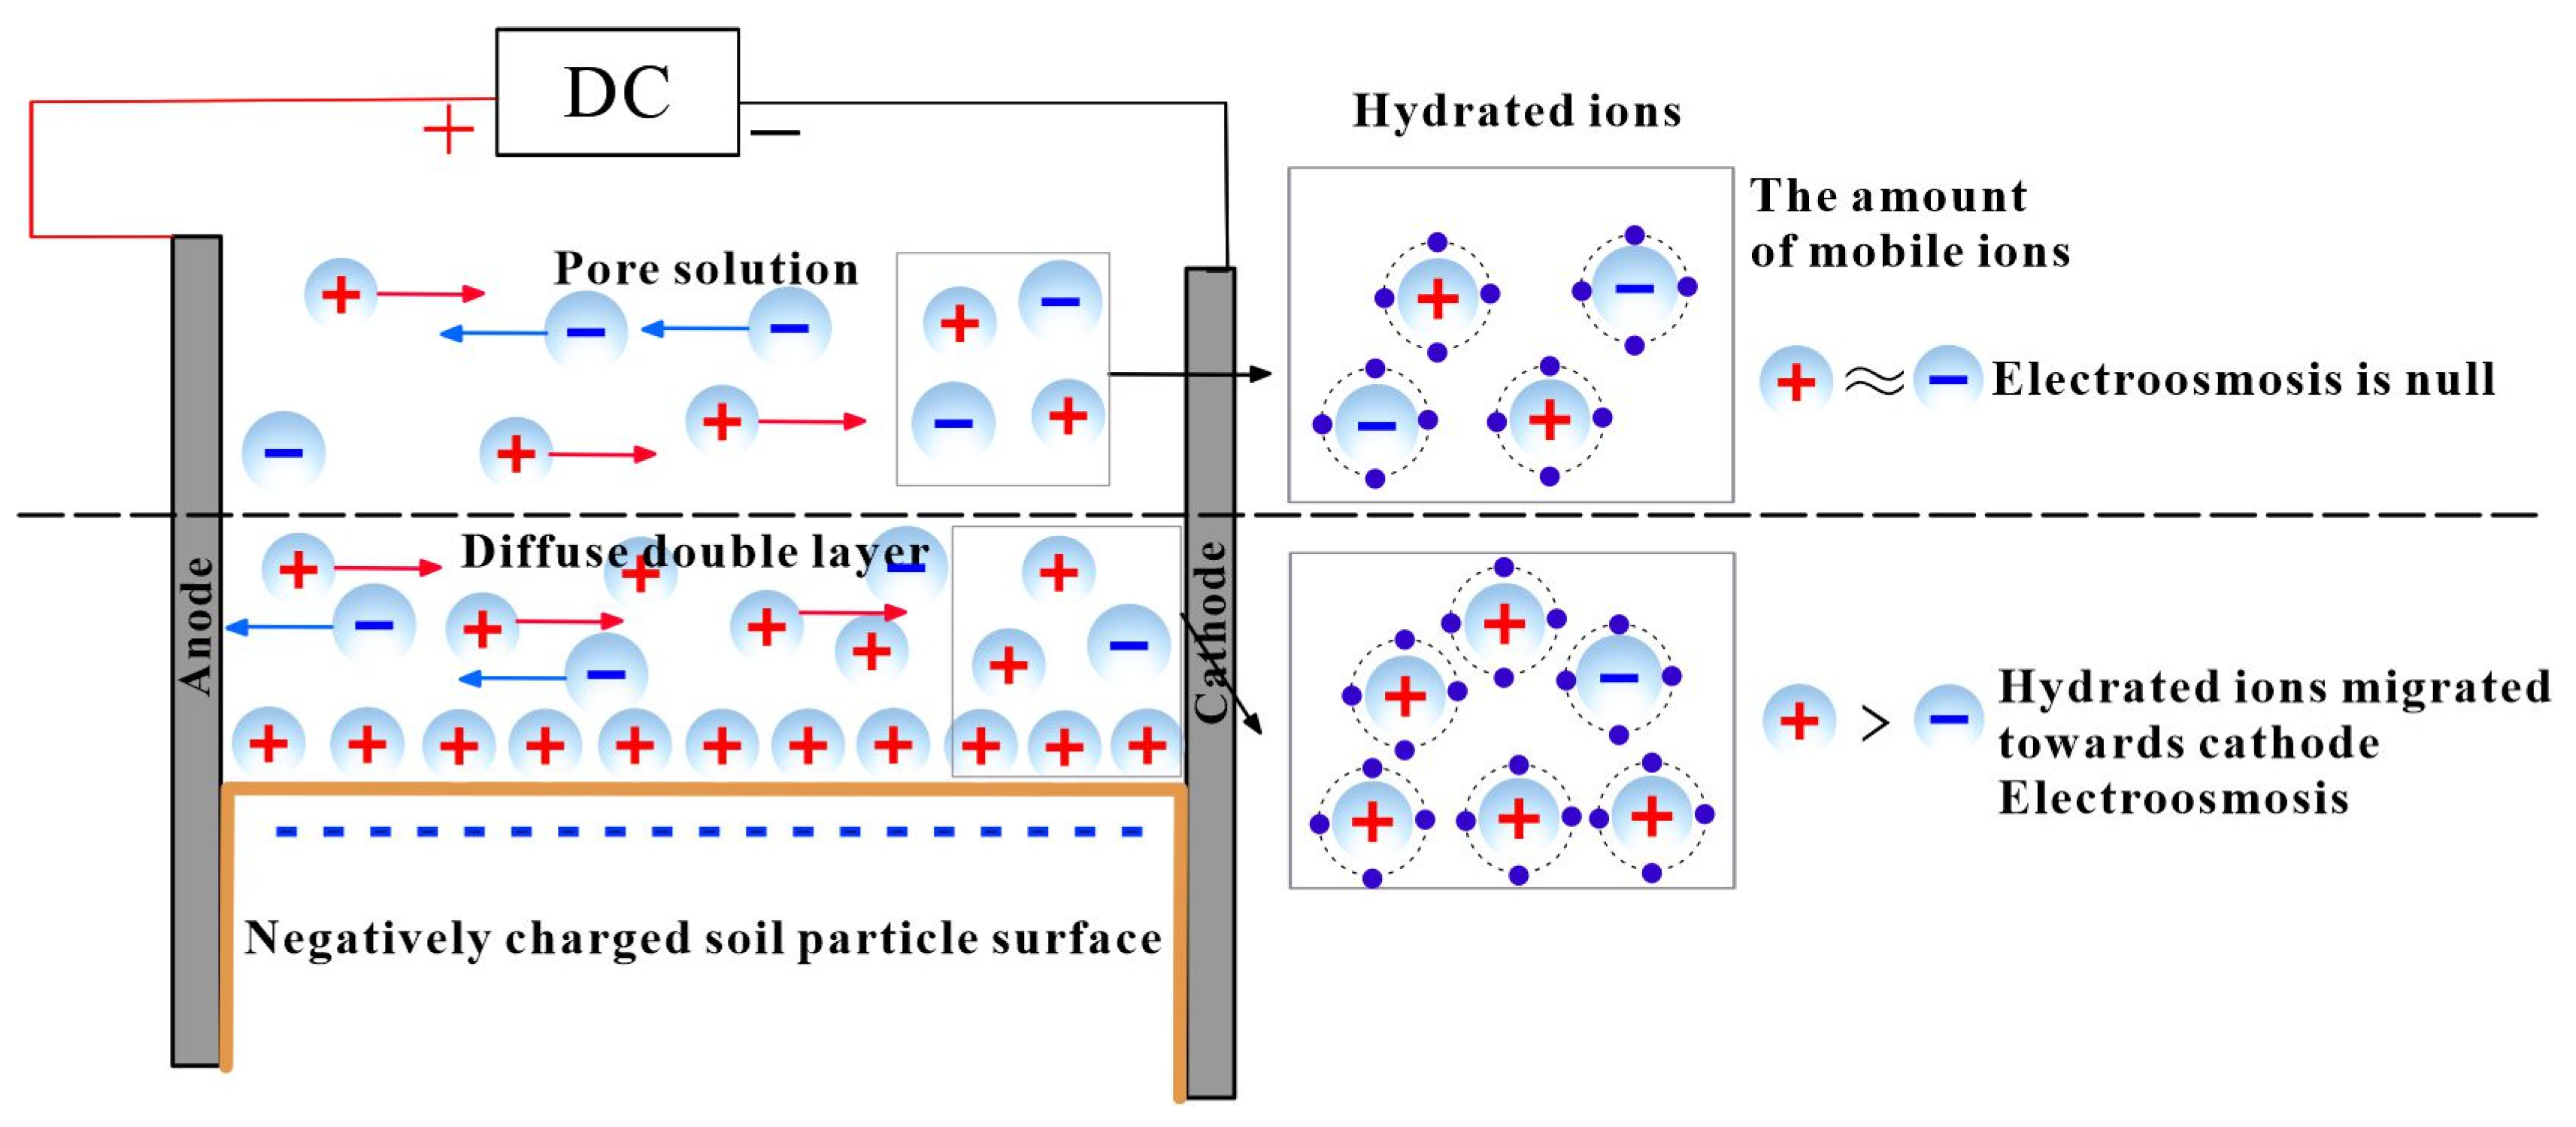
3.1.1. Ion Hydration Model

The electroosmosis mechanism of ion hydration is illustrated in Figure 2. In the diffuse double layer, the concentration of cations (counterions) is much higher than that of anions (co-ions) as the soil particles are negatively charged. The cations and anions hydrate and migrate towards the cathode and anode in an electric field, respectively. More water molecules migrate towards the cathode than towards the anode. Therefore, electroosmosis flows from the anode to the cathode. However, the concentrations of counterions and co-ions in pore solution beyond the diffuse double layer are approximately equal, meaning that electroosmosis is counteracted [29,39].
The ion hydration model assumes the flux of water molecules J w m o l m 2 s 1 carried by hydrated ions under an electric field, which is calculated via Equation (1) [12].
J w = i = 1 n N i J i
where N i is the number of water molecules hydrated by the i-th ion (dimensionless) and J i is the flux of the i-th ion m o l m 2 s 1 . However, there is only one form of water transport in the diffuse double layer, and the accumulated flux of the i-th ion can be expressed by the flux difference between counterions and co-ions in the diffuse double layer, as shown in Equation (2) [24]. The migration of ions in an electric field is determined by the electrokinetic functions of electromigration and electroosmosis. However, electroosmosis during EKR is the result of the electromigration of hydrated ions in an electric field. Therefore, the flux of electroosmosis is decided by the electromigration flux of hydrated ions, as shown in Equation (2) [12].
1 n J i = u e , ct C c t u e , co C c o Δ E
where u e , ct and u e , co are the effective ionic mobility of counterions and co-ions, respectively m 2 V 1 s 1 ; C c t   and   C c o are the concentrations of counterions and co-ions, respectively m o l m 3 ; and Δ E is the potential gradient V m 1 . The electric neutrality should be fulfilled in the diffuse double layer via Equation (3) [12].
z ct C c t + z co C c o A 0 = 0
where z c t   and   z c o are the valence of counterions and co-ions, respectively dimensionless , and A 0 is the charge per unit volume of soil m o l m 3 . The charge per unit volume of soil is closely related to the soil cation exchange capacity and can be calculated using Equation (4) [10].
A 0 = ρ d CEC
where ρ d is the dry density of soil k g m 3 and CEC is the cation exchange capacity of soil c m o l k g 1 . The concentration of counterions is much higher than that of co-ions in the diffuse double layer. Therefore, we assume the ions in the diffuse double layer are all counterions, namely C c o = 0 . The cations in the pore water are mainly Na+, K+, H+, Ca2+, Mg2+, and Al3+, and the anions in pore water are mainly Cl, OH, CO32−, SO42−, and PO43− and the polluted Cr2O72− and HCrO4. According to the assumptions in Zhou’s research, the counterions and co-ions in the diffuse double layer can be treated as in the same valence [10]. Then, the total flux in the diffuse double layer can be simplified to Equation (5) [12].
1 n N i J i = u e , c t N i ρ d CEC z c t Δ E
The effective ionic mobility is related to its effective diffusion coefficient and can be calculated using the Nernst–Einstein equation, as expressed in Equation (6) [10].
u i * = z i F R T D i
where z i is the charge of ion I (dimensionless); F is Faraday’s constant 96 , 485.3   Cmol 1 ; R is the universal gas constant, 8.314   J / m o l · K ; and T is the absolute temperature K . The effective diffusion coefficient can be calculated by the porosity, saturation, soil tortuosity, and its diffusion coefficient in infinite dilution solution according to Equation (7) [40].
D e = nS r τ D o
where S r is the saturation of soil dimensionless ; τ is the tortuosity of soil dimensionless ; D o is the diffusion coefficient in infinite dilution solution m 2 s 1 ; and n is the porosity of soil. Then, the effective ionic mobility of counterions can be expressed by Equation (8) [10].
u c t = nS r τ D o , c t z c t F R T
where D o , c t is the diffusion coefficient of counterions in infinite dilution solution m 2 s 1 and F is the Faraday constant 96 , 485.3   Cmol 1 .
Similar to Darcy’s law, electroosmotic flow can be calculated by Equation (9) [9].
Q e = k e A Δ E
where Q e is the flux of electroosmotic flow m 3 / s , k e is the electroosmotic permeability m 2 / V · s , A is the cross-sectional area m 2 , and Δ E is the applied potential gradient V / m .
According to Equations (5), (8) and (9), the electroosmotic permeability caused by ion hydration (ion hydration model) can be calculated using Equation (10).
k e , h y d = 10 6 M w F N i n · S r · τ · D o , c t R T ρ d CEC
where M w is the molar mass of water 18.0   g m o l 1 . As illustrated in Equation (10), the electroosmotic permeability calculated by the ion hydration model is related to the porosity, saturation, dry density, cation exchange capacity, and the number of hydrated water molecules.
Similar to the H-S model, the electroosmotic permeability calculated by the ion hydration model is related to the soil porosity. Moreover, the electroosmotic permeability is proportional to the soil saturation, which is consistent with Xie et al. [17]. The saturated soil is beneficial to the formation of continuous flow channels. The electroosmotic permeability is also proportional to the cation exchange capacity of soil particles. This result is similar to Gray and Mitchell’s study (deduced from Donnan theory) [41]. The electroosmotic permeability is also proportional to the number of hydrated water molecules, which relates to the ion species of the pore solution. In other words, the type of salt solution in pore water affects the electroosmotic permeability of soil.

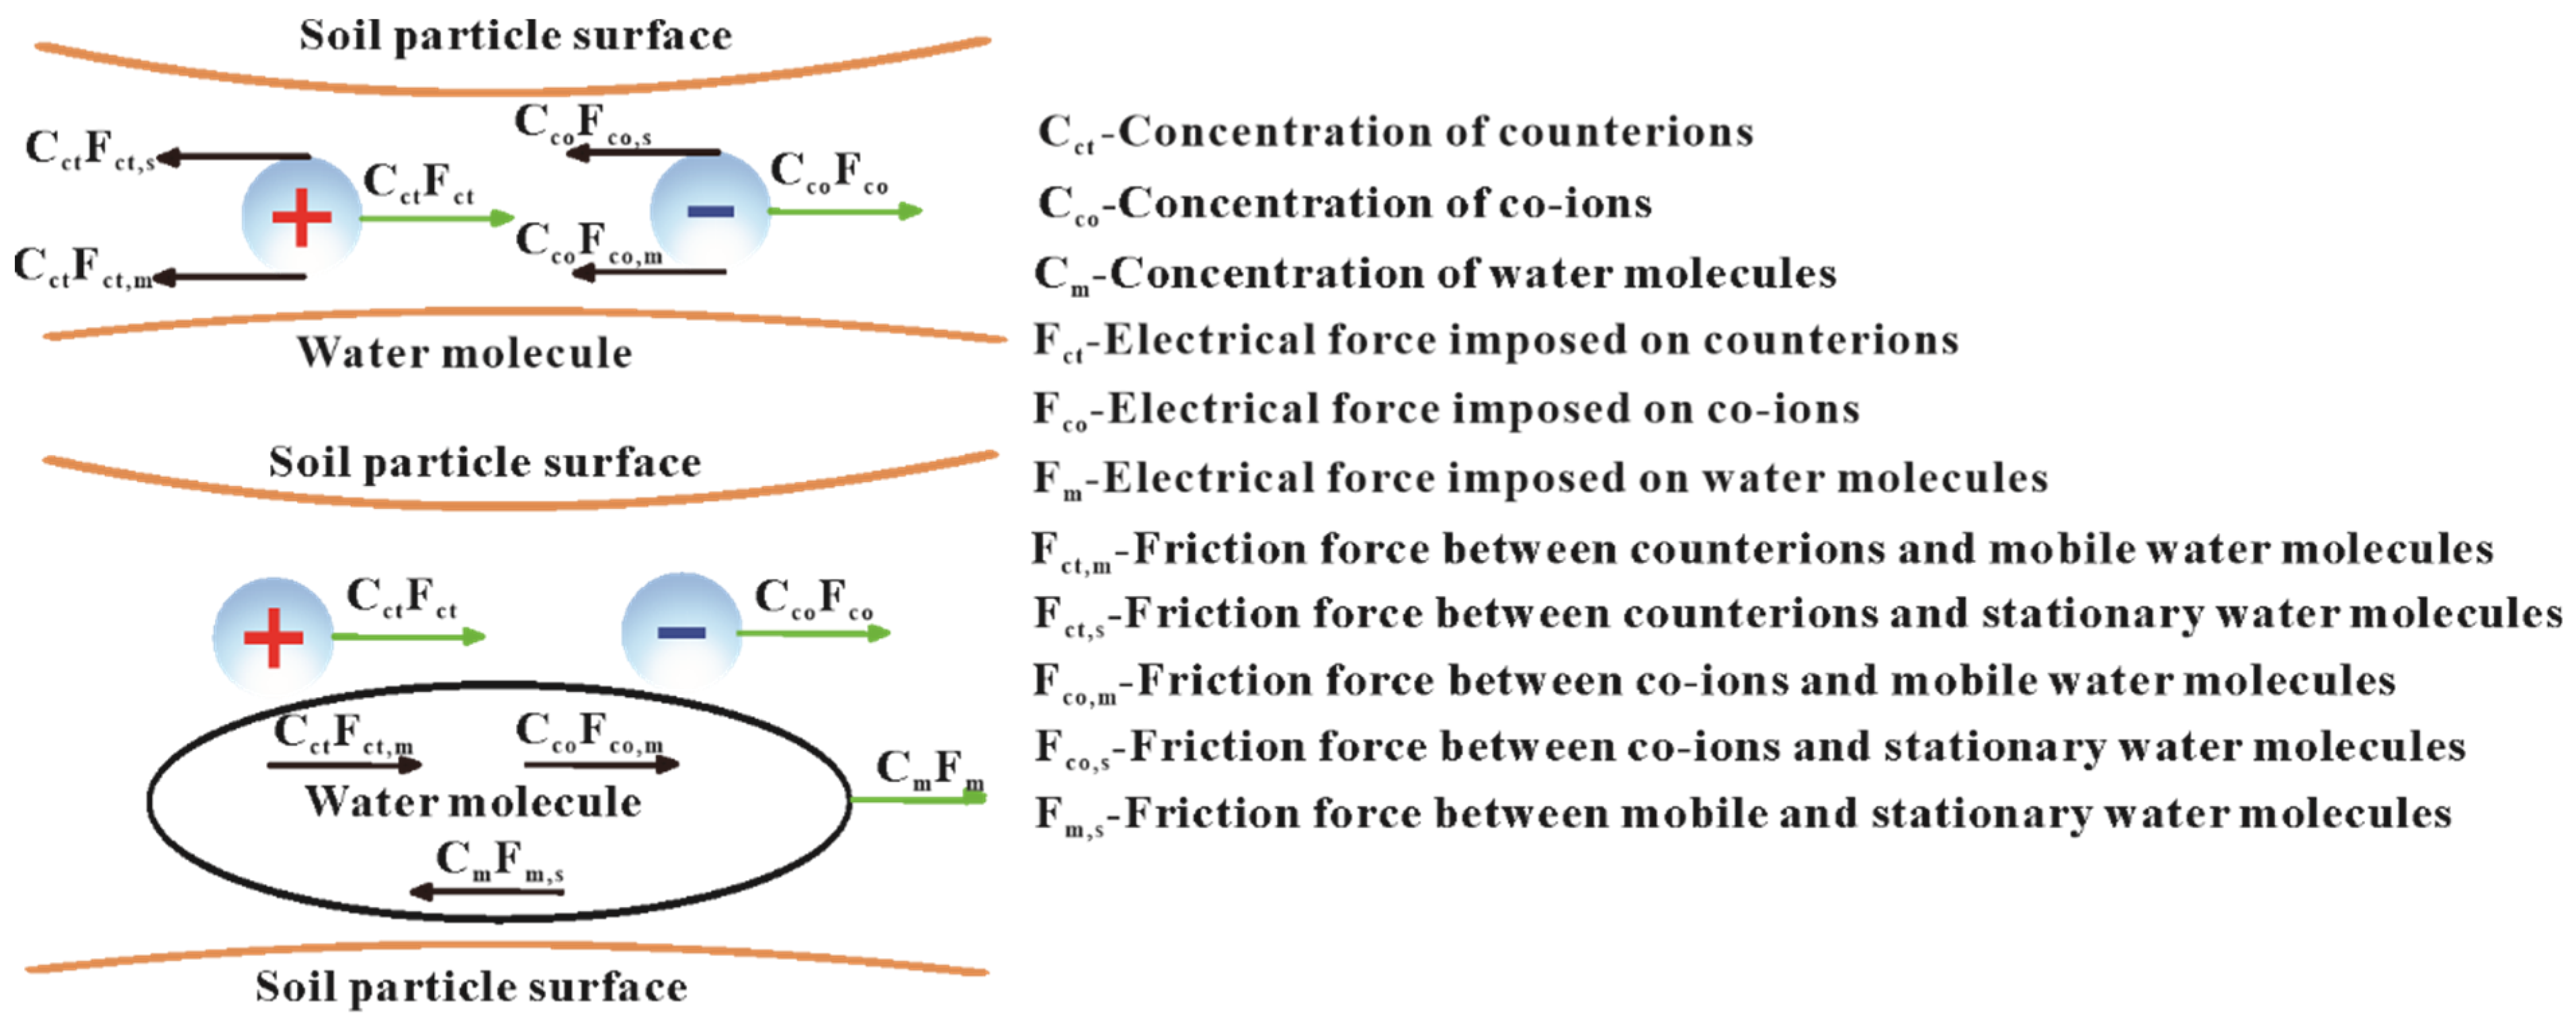
3.1.2. Ion Hydration–Friction Model

The migration of ions in an electric field drives the movement of surrounding water molecules due to friction. According to the Spiegler friction theory [42], electroosmosis is only produced when the numbers of anions and cations are significantly different in the solution. The electroosmosis mechanism caused by ion friction is shown in Figure 3. In the Spiegler friction theory, the force equilibrium of counterions, co-ions, and water molecules should be fulfilled as in Equations (11)–(13) [7].
F c t = F c t , m + F c t , s
F c o = F c o , m + F c o , s
F m = F m , s C c t C m F c t , m C c o C m F c o , m
Four components exist in the system, namely counterions, co-ions, moving water molecules, and stationary water molecules. The abbreviations ct, co, m, and s represent counterions, co-ions, moving water molecules, and stationary water molecules, respectively. Therefore, C c t , C c o , and C m are the concentrations of counterions, co-ions, and water molecules, respectively m o l m 3 ; F c t , F c o , and F m are the electrical forces imposed on counterions, co-ions, and water molecules, respectively; F c t , m is the friction force between counterions and moving water molecules; F c t , s is the friction force between counterions and stationary water molecules; F c o , m is the friction force between co-ions and moving water molecules; F c o , s is the friction force between co-ions and stationary water molecules; and F m , s is the friction force between moving and stationary water molecules.
The friction force is proportional to the relative velocity between the components and can be expressed by Equation (14) [7].
F i , j = X i , j v i , j = X i , j v i v j
where X i , j is the friction coefficient between components i and j, and v i , j is the relative velocity between components i and j m s 1 . The friction coefficient can be expressed as X c t , m ,   X c t , s ,   X c o , m ,   X c o , s   a n d   X m , s .
When a potential gradient is applied in the system, the electrical forces ( F c t , F c o , and F m ) imposed on every ion or molecule can be expressed as in Equations (15)–(17) [7].
F c t = z c t F Δ E N A
F c o = z c o F Δ E N A
F m = 0
where N A is the Avogadro constant 6.02 × 10 23 . This is similar in the ion hydration model, assuming that the charges of the counterions and co-ions are equal. By substituting Equations (14)–(17) into Equations (11)–(13), the following force equilibrium equations are obtained:
z c t F Δ E N A = X c t , m v c t v m + X c t , s v c t
z c t F Δ E N A = X c o , m v c o v m + X c o , s v c o
0 = X m , s v m C c t C m v c t v m C c o C m v c o v m
By solving Equations (18)–(20), the velocity of water molecules can be expressed as:
v m = z c t F Δ E N A C c t X c t , m / X c t , m + X c t , s C c o X c o , m / X c o , m + X c o , s C c t X c t , m X c t , s / X c t , m + X c t , s + C c o X c o , m X c o , s / X c o , m + X c o , s + C m X m , s
The force between ions is the Coulomb force and the force between molecules is the van der Waals force [12]. Water molecules are polar molecules due to the asymmetry of the two hydrogen atoms. The counterions and co-ions move regularly in the applied electric field and then drive the surrounding water molecules due to the Coulomb force. The moving and stationary water molecules are the same. Therefore, the friction coefficients between ions and moving or stationary water molecules are equal, namely X c t , m is equal to X c t , s and X c o , m is equal to X c o , s . Similar to the assumption made in the ion hydration model, the concentration of co-ions is equal to 0. Then, the flux of water molecules under the unit potential gradient m o l m 2 s 1 / V m 1 can be expressed as:
σ = z c t F C m N A C c t X c t , s C c t + 2 X m , s C m
The van der Waals force between molecules is much smaller than the Coulomb force, meaning that the friction force caused by the van der Waals force can be negligible ( X m , s = 0 ). Therefore, the electroosmotic permeability can be calculated using the ion hydration–friction model, as demonstrated in Equation (23).
k e , h y d F r i = 10 6 M w F N i n · S r · τ · D o , c t R T ρ d CEC + 10 6 M w z c t F C m N A X c t , s

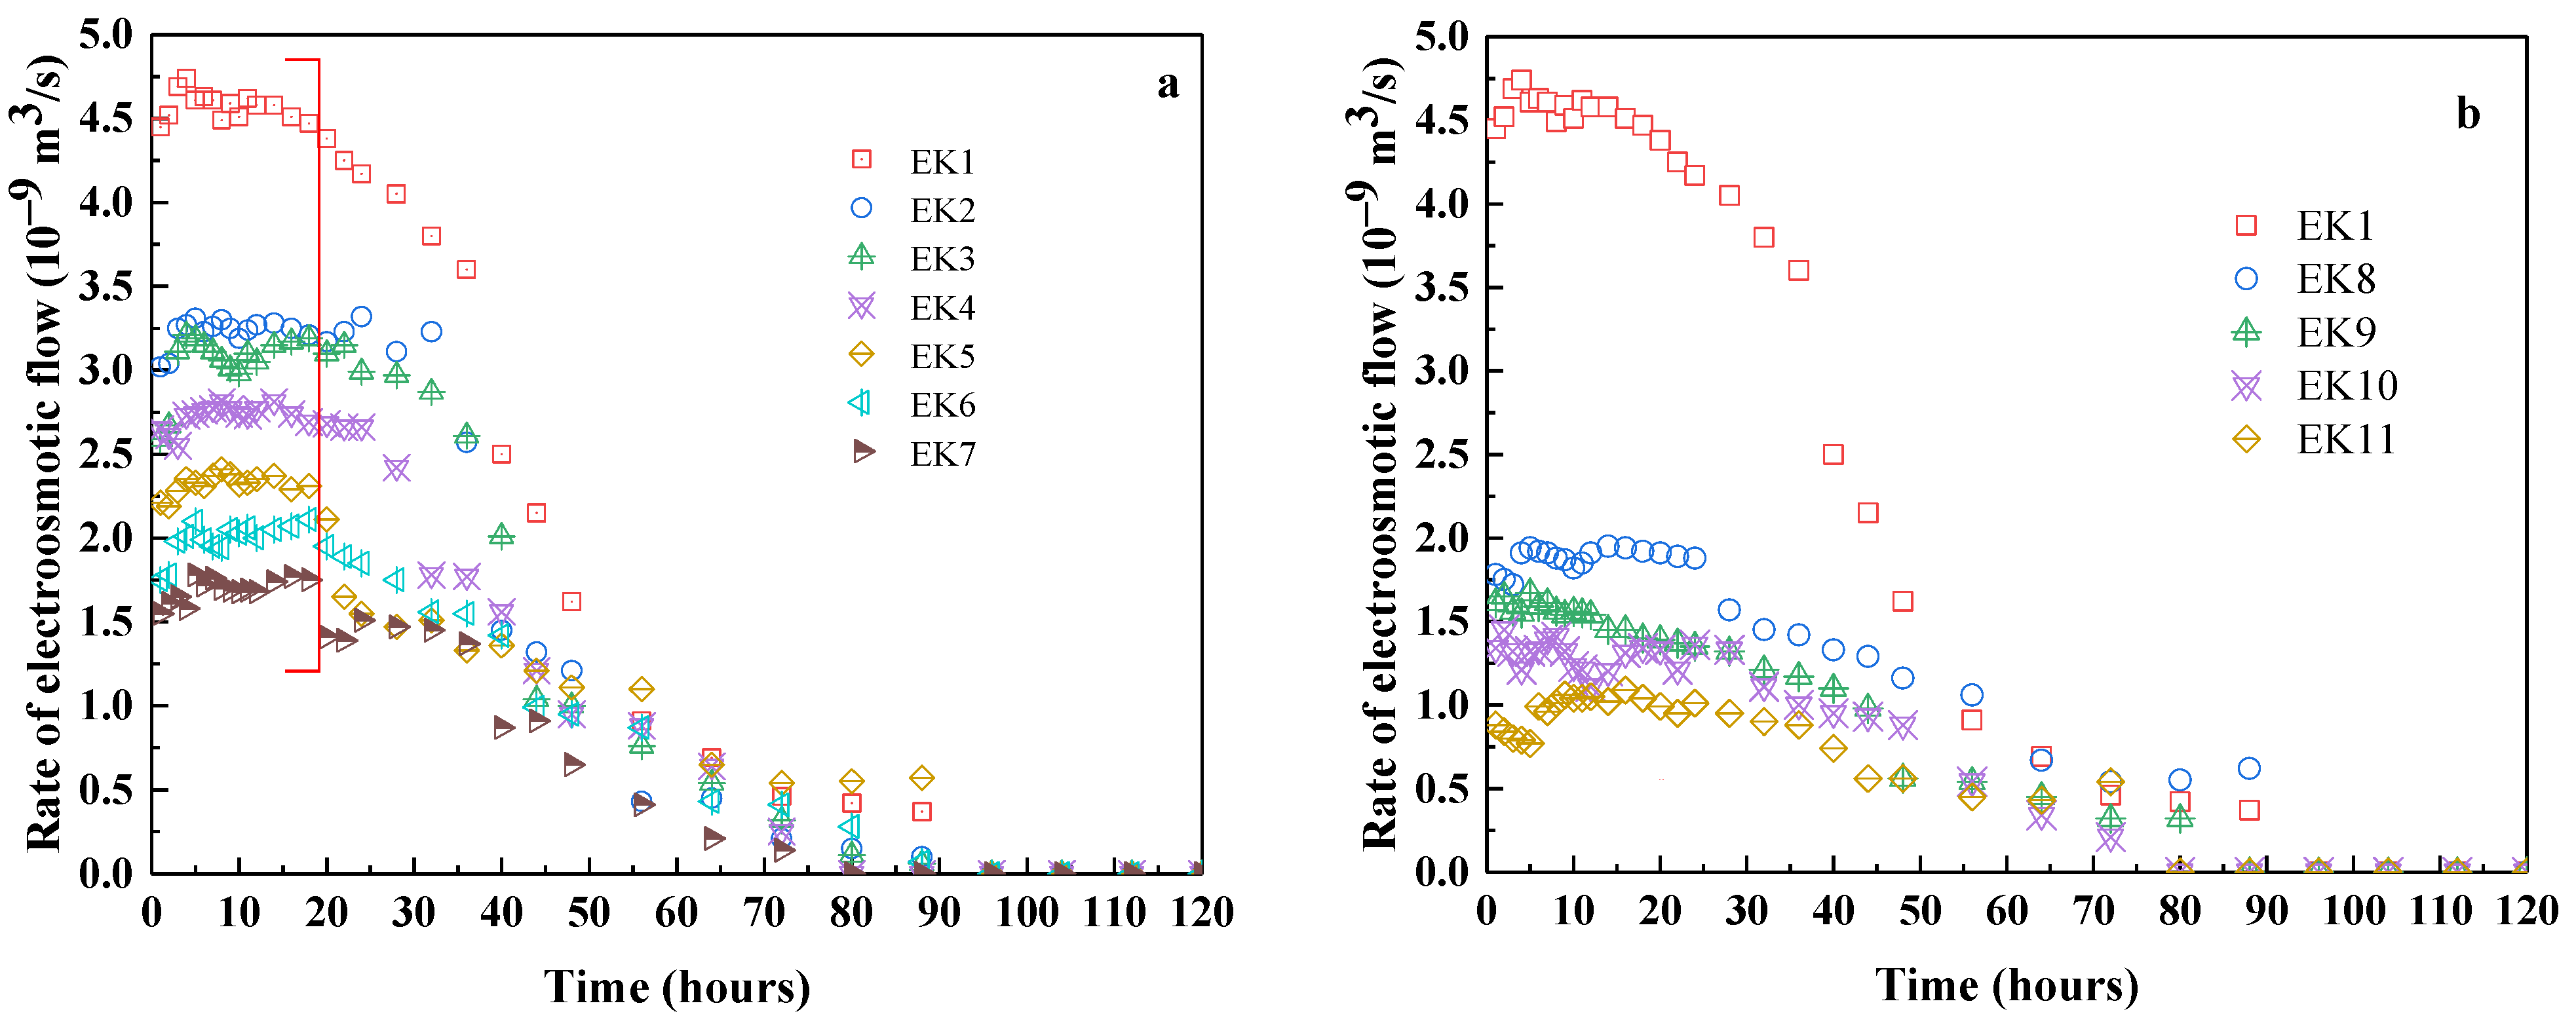
3.1.3. Electroosmotic Permeability Measured by Experiments

The surface of soil particles is generally negatively charged as a result of isomorphic substitutions [12]. The electroosmotic flow is caused by the charge property of soil particles. Moreover, the electroosmotic flow usually flows from the anode to the cathode [43,44].
The electroosmotic flow rate in all the experiments is shown in Figure 4. As shown, the electroosmotic flow remained basically stable for all experiments in the initial 20 h, but this then gradually decreased and ceased. The decrease in the electroosmotic flow is due to the change in the physicochemical properties of soil and electrolyte during the EKR process. Water electrolysis in the cathode produces hydroxide, which alkalizes the electrolyte and soil near the cathode. Calcium and magnesium ions, which are ubiquitous in soil, precipitate easily in the alkaline environment and then block the migrating channels of pore water [34]. Moreover, precipitation increased the interface resistance, decreased the electric current, and then weakened the electroosmotic flow [45]. The electroosmotic flow rate in the decreasing period is influenced by many factors, and the mechanism for the decrease is complicated. Therefore, our study focused on the electroosmotic permeability in the initial 20 h of the EKR experiments. Then, the average in the initial 20 h was taken as the electroosmotic flow rate. The results showed that the electroosmotic flow was weakened by the addition of acid to the soil. In general, the higher the acid concentration, the slower the electroosmotic flow. As illustrated in Table 2, the properties of the soil changed when acid was added, thus affecting the electroosmotic flow.

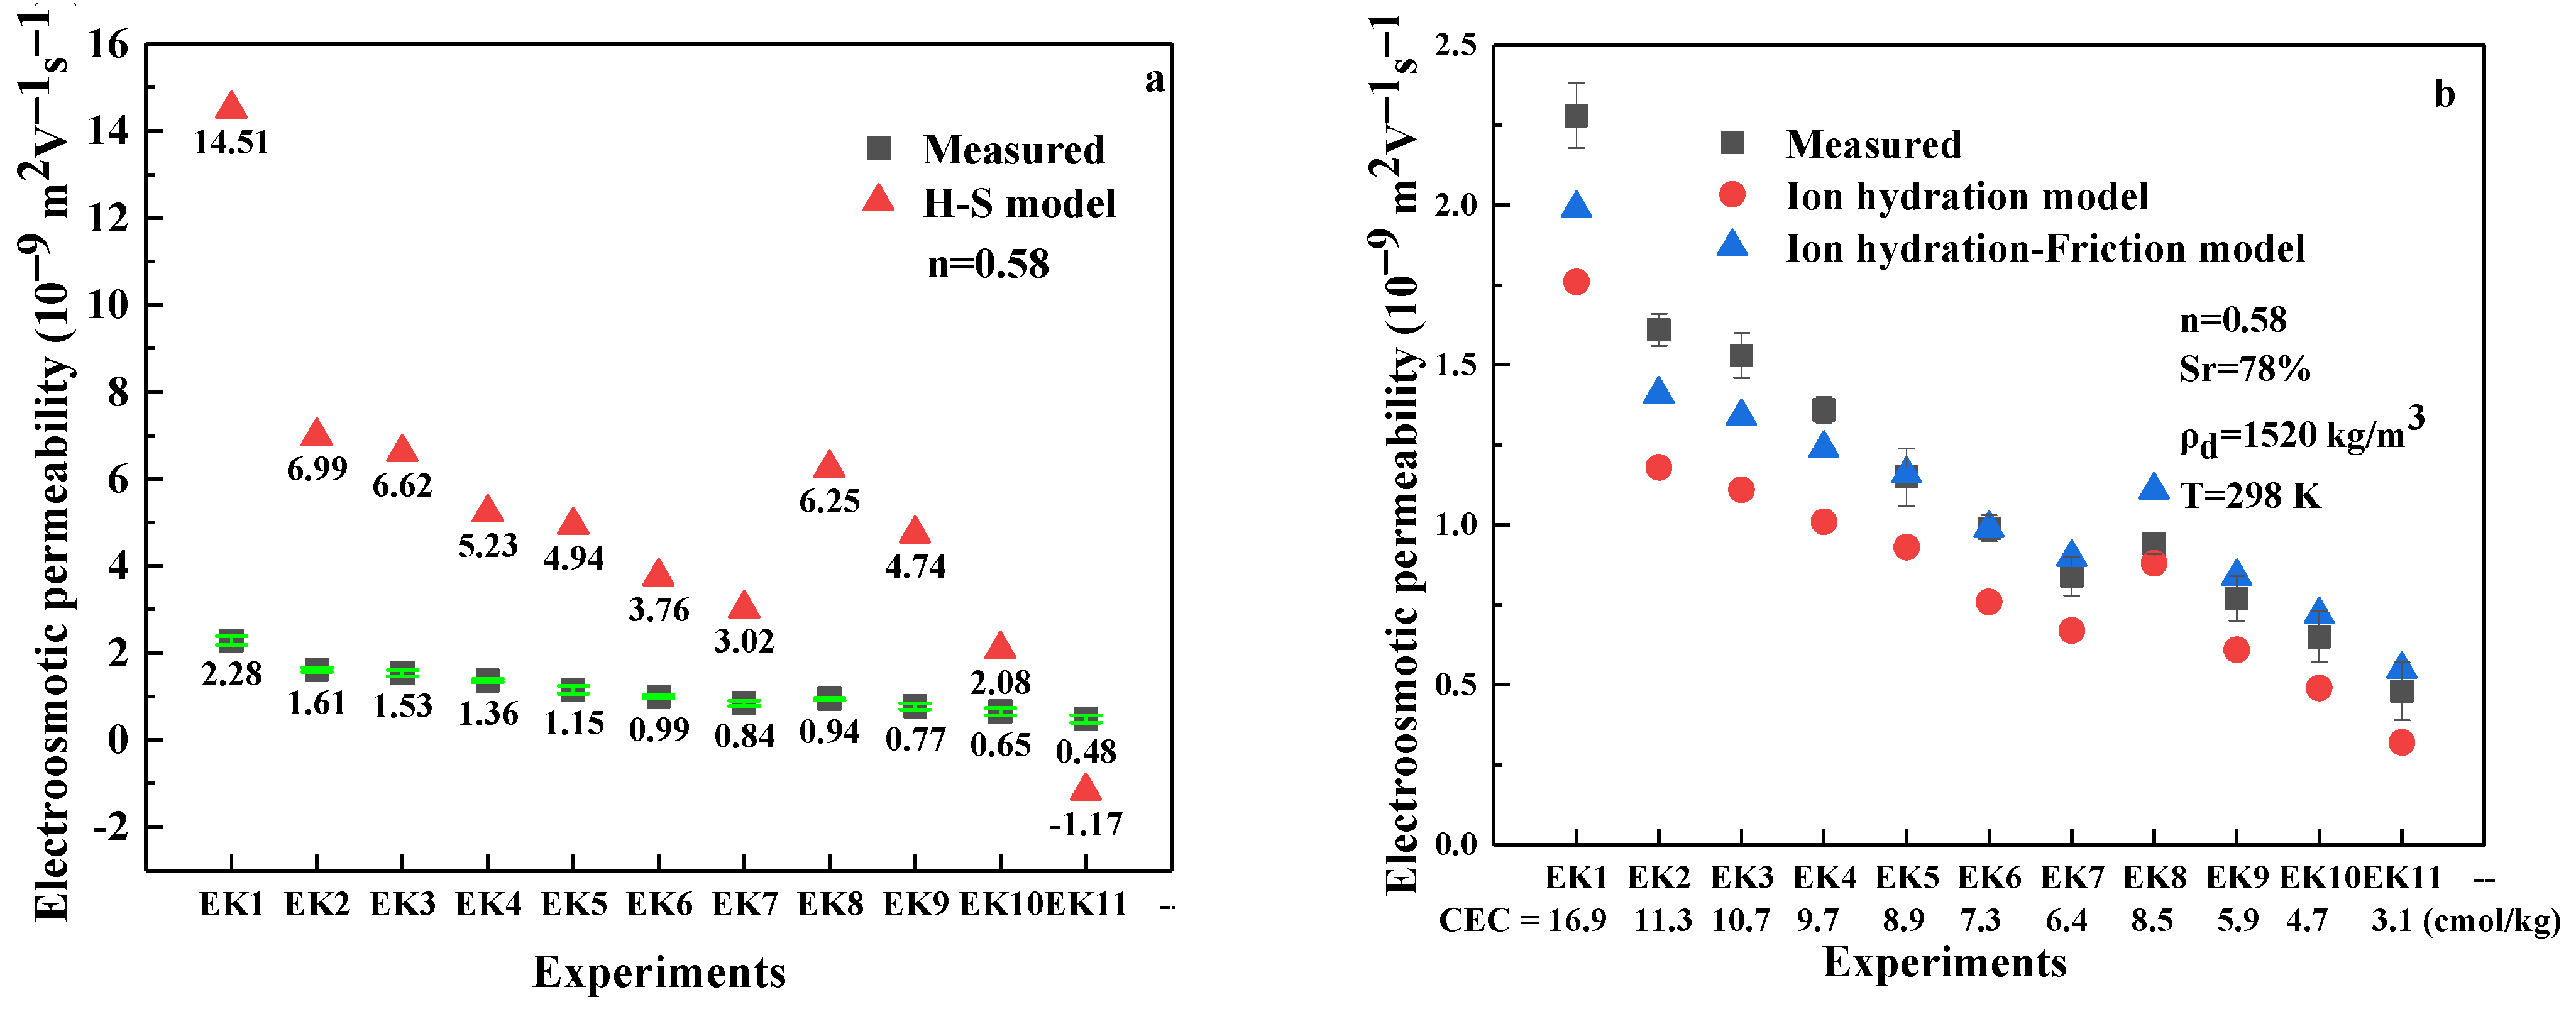
3.1.4. Calculation Verification

The pore solution is deionized water for experiment EK1, 0.1–1.0 mol/L acetic acid for experiments EK2–EK7, and 0.1–1.0 mol/L citric acid for experiments EK8–EK11. Therefore, the counterions in the diffuse double layer are mainly hydrogen ions. This layer also contains a small number of cations such as Na+, K+, Ca2+, and Mg2+ that are dissociated from the soil particles. Ion hydration is the phenomenon of water molecules adsorbed on the surface of ions due to electrostatic attraction or coordination bonds. The ion hydration structure includes two hydration layers [36]. The water molecules in the first hydration layer are firmly bonded to the ion, and the water molecules lose their free energy. The attraction between the ion and water molecules in the second hydration layer is weaker, and the water molecules can easily escape from the hydration layer. Therefore, the water molecule number in the first hydration layer is taken as the hydration number. Zhongzhi Yang [42] used the ABEEM/MM model to demonstrate that the first hydration layer of the hydrogen ion is saturated when the number of water molecules is four. The hydration numbers of K+ and Na+ are 2–6 and 3–6, respectively. The water molecule number in the first hydration layer of the hydrogen ion is taken as the value of Ni, namely Ni = 4.
The friction force between counterions and stationary water molecules is in fact the Coulomb force. The Coulomb force can be expressed by the Coulomb theory and calculated by Equation (24) [7].
F c t , s = k q 1 q 2 r 2 = X c t , s v c t
where k is the Coulomb constant ( k = 8.99 × 10 9   N · m 2 · C 2 ); q 1 , q 2 are the charge of ions ( C ); and r is the distance between ions ( m ). The charge of the hydrogen ion is 1.602 × 10 19   C . The angle between the two hydrogens in the water molecule is 108 degrees, and the charge of polar water molecules can be regarded as 3.204 × 10 20   C . The distance between molecules in liquid is about 1.0 × 10 9   m . The ion in liquid is a charged sphere, and the viscous resistance of the moving counterions in liquid can be expressed as Equation (25) [7].
F f = 6 π η r ν c t
where η is the dynamic viscosity of pore water ( 1.01 × 10 3   N · s / m 2 ) and r is the diameter of counterions (the radius of hydrogen ion is 2.5 × 10 11   m ). The electrical force applied in the counterions can be calculated by Equation (16). According to the force balance, the moving velocity of counterions is expressed by Equation (26) [7].
ν c t = z c t F Δ E 6 π η r N A
Therefore, the friction coefficient X c t , s can be calculated by Equations (24) and (26). The friction coefficient X c t , s equals 6.85 × 10 10   N · s · m 1 . The geotechnical properties and parameters needed in the calculation are listed in Table 3.
The permittivity and dynamic viscosity of pore water can be considered constants. Therefore, the electroosmotic permeability calculated by the H-S model ( k e = ζ D η n ) is determined by the porosity and zeta potential of the soils. The electroosmotic permeability measured by the experiments and calculated by the H-S model in experiments EK1–EK11 is shown in Figure 5a. The soil porosity was 0.58 in all the experiments. Therefore, the electroosmotic permeability in the H-S model was only affected by the zeta potential of the soil. As shown, the electroosmotic permeability calculated by the H-S model is 3–7 times larger than the measured values in experiments EK1–EK10. It has been demonstrated that soil saturation has a great influence on electroosmotic permeability. The pores in soil are not continuous for the transport of ions or water molecules. Therefore, the measured electroosmotic permeability is much smaller than the value calculated by the H-S model.
The electroosmotic permeability calculated by the ion hydration model is expressed as Equation (10), and the electroosmotic permeability calculated by the ion hydration–friction model is expressed as Equation (23). The parameters needed in the calculation are listed in Table 3. The parameters in the ion hydration and ion hydration–friction model mainly include soil physical parameters (porosity, saturation, dry density) and the chemical parameter (CEC). The physical parameters of soil can be obtained by simple geotechnical tests, and the CEC of soil can be tested according to the national standard of HJ 889-2017 [37]. The comparison of the electroosmotic permeability between the measured value, calculated by the ion hydration model and ion hydration–friction model, is shown in Figure 5b.
As shown, the electroosmotic permeability calculated by the ion hydration model is much smaller than the measured value. Most of the electroosmotic permeability estimated by the ion hydration model is 65–90% of the measured value. However, the electroosmotic permeability estimated by the ion hydration–friction model is much closer to the measured value than that of the ion hydration model. The electroosmotic permeability estimated by the ion hydration–friction model and measured value displayed certain regularity in the different CEC of soil. The electroosmotic permeability estimated by the ion hydration–friction model is slightly larger than the measured value when the soil CEC is smaller than 9.0 cmol/kg. As the soil CEC is larger than 9.0 cmol/kg, the electroosmotic permeability estimated by the ion hydration–friction model is smaller than the measured value.

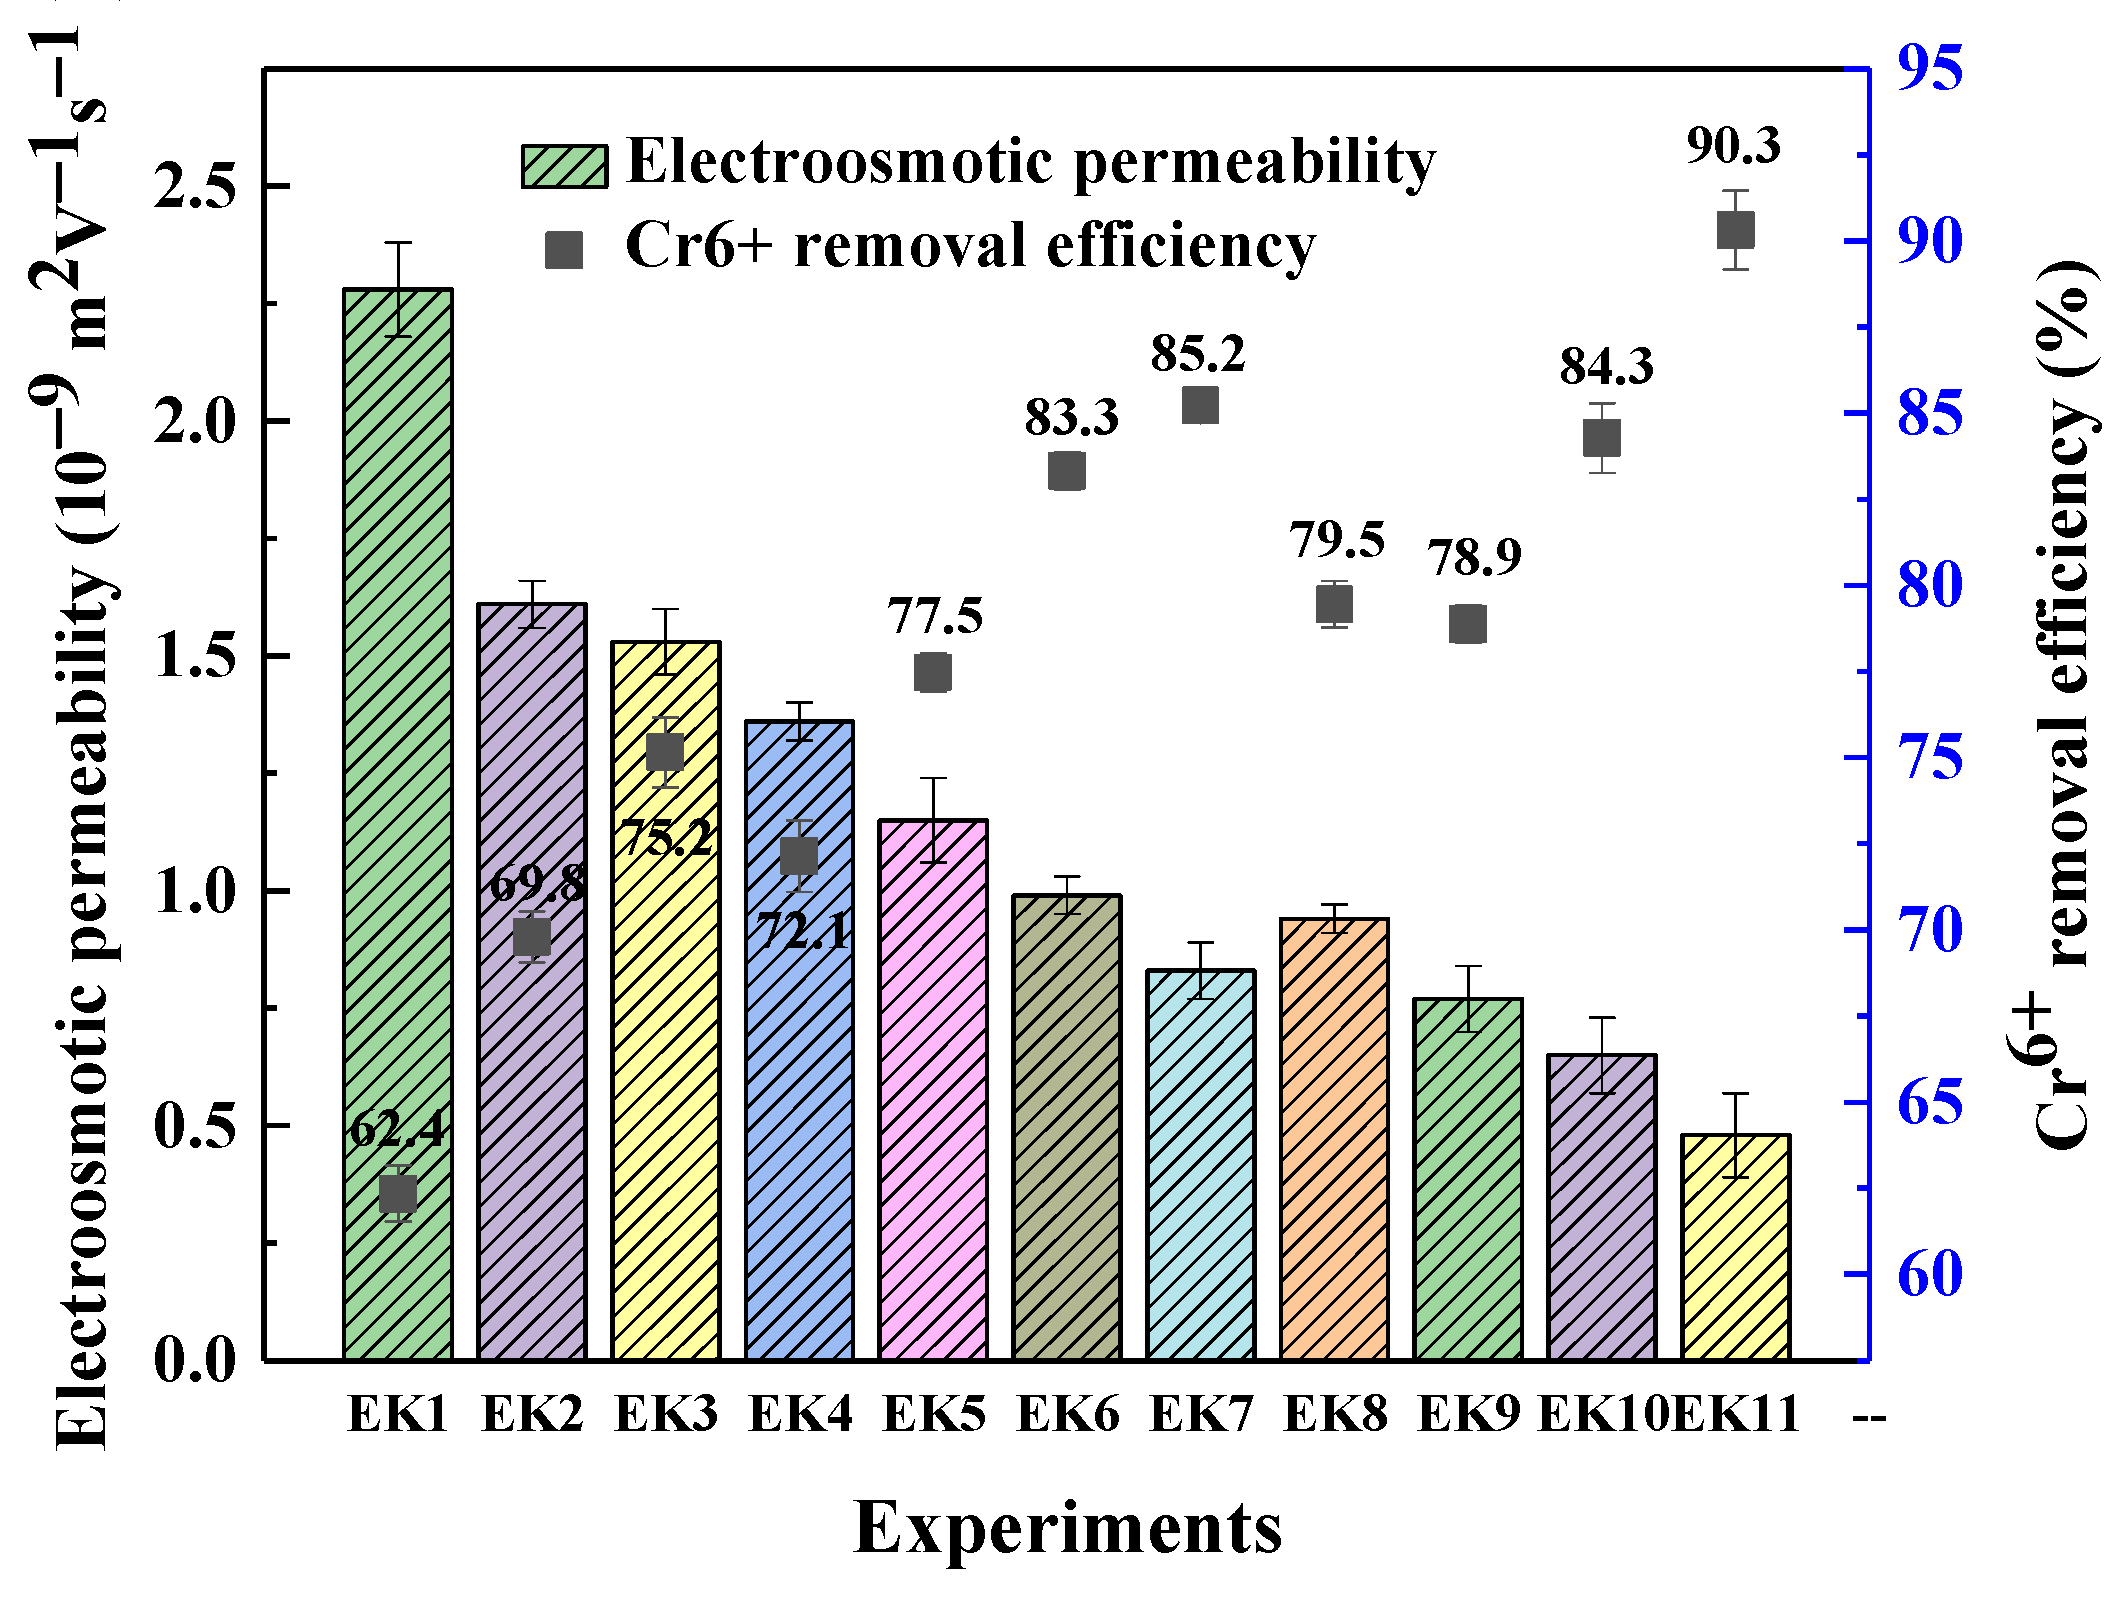
3.2. The Role of Electroosmotic Permeability for Cr6+ Removal

According to the analysis above, the average of the electroosmotic flow rate in the initial 20 h is taken to determine the measured electroosmotic permeability in all experiments. The Cr6+ removal efficiency is calculated using Equation (27).
ϕ = 1 c t c 0 × 100
where ϕ is the Cr6+ removal efficiency (%); c t is the Cr6+ concentration of soil after the EKR experiment (mg/kg); and c 0 is the initial Cr6+ concentration of soil before the EKR experiment (498.5 mg/kg).
The electroosmotic permeability and Cr6+ removal efficiency in experiments EK1–EK11 are shown in Figure 6. The electroosmotic permeability in all experiments is in the range of 0.48–2.28 × 10⁻⁹ m 2 V 1 s 1 , and the highest electroosmotic permeability is in experiment EK1 (pore water is deionized water). The experimental results indicate that the electroosmotic flow was decreased by adding acid to the soil. In general, the higher the acid concentration, the lower the electroosmotic permeability. The absolute values of the zeta potential and CEC of soil were lowered by adding acid. Moreover, the Cr6+ removal efficiency in the experiments, which adds acid to the soil, is obviously higher than the control experiment in EK1, and the Cr6+ removal efficiency is generally proportional to the acid concentration. There are two reasons for the improvement in the Cr6+ removal efficiency. First, the absolute value of the soil zeta potential and CEC was lowered by the addition of acid to soil, subsequently decreasing the quantity of electroosmotic flow which moved towards the cathode. However, Cr6+ in soil exists as anions of CrO42−, HCrO4, and Cr2O72−, and it migrates towards the anode in an electric field [3]. Moreover, the citric acid in experiments EK8–EK11 was capable of reducing Cr6+ to Cr3+, subsequently forming negative Cr3+-cit complexes which moved to the anode [34]. The migration direction of Cr6+ and Cr3+-cit complexes in soil was opposite to the electroosmotic flow. Therefore, the Cr6+ removal efficiency improved when the electroosmotic flow decreased. Second, the acid in soil works as a buffer solution; it neutralizes the hydroxide ions produced by hydrolysis during EKR. As known, soil alkalization results in some cations of soil precipitating easily, which increases the soil resistance [45]. Moreover, precipitation hinders ion migration, thus weakening the EKR effect. In conclusion, the electroosmotic flow was weakened and the Cr6+ removal efficiency improved by the addition of acid to the soil.

4. Conclusions

In this study, the ion hydration model and ion hydration–friction model were established to estimate the electroosmotic permeability. Then, EKR experiments were carried out to study the effect of electroosmotic permeability on the Cr6+ removal efficiency. The electroosmotic permeability values estimated by the H-S model, ion hydration model, and ion hydration–friction model and the measured values were compared. As a result of our study, the following conclusions can be drawn:
(1)
The electroosmotic permeability estimated by the H-S model is 3–7 times larger than the measured value. The ion hydration model and ion hydration–friction model are deduced from the principle of electroosmotic flow, and the value estimated by these two models is closer to the measured value compared to the value from the H-S model. However, the ion hydration–friction model has several drawbacks, such as too many parameters having to be determined and not being concise enough compared to the H-S model.
(2)
The lower the electroosmotic flow, the higher the Cr6+ removal efficiency. The zeta potential and CEC of soil were changed by adding acid, and the Cr6+ removal efficiency was improved.
(3)
No hazardous material was added or produced when using the EKR method to remediate heavy-metal-contaminated soil, meaning that it is a sustainable technology to use for this purpose. This study revealed the relationship between electroosmotic flow and ion migration, contributing towards an improvement in the heavy metal removal efficiency and in the environment. Moreover, the ion hydration and ion hydration–friction model are of great significance to the theory of ion migration in EKR.

Author Contributions

Conceptualization, X.-Y.L. and Y.-F.Z.; formal analysis, X.-Y.L.; funding acquisition, Y.-F.Z.; methodology, X.-Y.L. and Y.-F.Z.; project administration, Y.-F.Z.; writing—original draft, X.-Y.L.; writing—review and editing, Y.-F.Z. All authors have read and agreed to the published version of the manuscript.

Funding

This work was supported by National Natural Science Foundation of China (Ion transport and gradient theory of energy level in electroosmosis, No. 41472039).

Institutional Review Board Statement

Not applicable.

Informed Consent Statement

Not applicable.

Data Availability Statement

The data presented in this study are available on request from the corresponding author.

Acknowledgments

The authors would like to thank Hu Zhe from Shiyanjia Lab for the soil electrochemical properties test.

Conflicts of Interest

The authors declare no conflict of interest.

References

  1. Rodrigo, M.A.; Oturan, N.; Oturan, M.A. Electrochemically assisted remediation of pesticides in soils and water: A review. Chem. Rev. 2014, 114, 8720–8745. [Google Scholar] [CrossRef] [PubMed]
  2. Banks, M.K.; Schwab, A.P.; Henderson, C. Leaching and reduction of chromium in soil as affected by soil organic content and plants. Chemosphere 2006, 62, 255–264. [Google Scholar] [CrossRef] [PubMed]
  3. Li, D.; Xiong, Z.; Nie, Y.; Niu, Y.-Y.; Wang, L.; Liu, Y.-Y. Near-anode focusing phenomenon caused by the high anolyte concentration in the electrokinetic remediation of chromium (VI)-contaminated soil. J. Hazard. Mater. 2012, 229, 282–291. [Google Scholar] [CrossRef] [PubMed]
  4. Cameselle, C.; Gouveia, S. Electrokinetic remediation for the removal of organic contaminants in soils. Curr. Opin. Electrochem. 2018, 11, 41–47. [Google Scholar] [CrossRef]
  5. Yeung, A.T.; Gu, Y.Y. A review on techniques to enhance electrochemical remediation of contaminated soil. J. Hazard Mater. 2011, 195, 11–29. [Google Scholar] [CrossRef]
  6. Sawada, A.; Mori, K.I.; Tanaka, S.; Fukushima, M.; Tatsumi, K. Removal of Cr(VI) from contaminated soil by electrokinetic remediation. Waste Manag. 2004, 24, 483–490. [Google Scholar] [CrossRef]
  7. Alshawabkeh, A.N.; Acar, Y.B. Electrokinetic remediation. II: Theoretical model. J. Geotech. Eng. 1996, 122, 186–196. [Google Scholar] [CrossRef]
  8. Zhuang, Y.F.; Wang, Z. Interface electric resistance of electroosmotic consolidation. J. Geotech. Geoenviron. Eng. 2007, 133, 1617–1621. [Google Scholar] [CrossRef]
  9. He, J.Y.; He, C.Q.; Chen, X.P.; Liang, X.; Huang, T.L.; Yang, X.C.; Shang, H. Comparative study of remediation of Cr(VI)-contaminated soil using electrokinetics combined with bioremediation. Environ. Sci. Pollut. Res. 2018, 25, 17682–17689. [Google Scholar] [CrossRef]
  10. Zhou, J.; Gan, Q.Y.; Tao, Y.L. Electro-osmotic permeability model based on ions migration. Acta Geotech. 2021, 17, 2379–2393. [Google Scholar] [CrossRef]
  11. Gimmi, T.; Alt-Epping, P. Simulating Donnan equilibria based on the Nernst-Planck equation. Geochim. Et Cosmochim. Acta 2018, 232, 1–13. [Google Scholar] [CrossRef]
  12. Yustres, A.; Lopez-Vizcaıno, R.; Cabrera, V.; Rodrigo, M.A.; Navarro, V. Donnan-ion hydration model to estimate the electroosmotic permeability of clays. Electrochim. Acta 2020, 355, 136758. [Google Scholar] [CrossRef]
  13. Wang, L.S.; Huang, L.H. Application of a multi-electrode system with polyaniline auxiliary electrodes for electrokinetic remediation of chromium-contaminated soil. Sep. Purif. Technol. 2019, 224, 106–112. [Google Scholar] [CrossRef]
  14. Yan, Y.J.; Xue, F.; Muhammad, F.; Yu, L.; Xu, F.; Jiao, B.; Shiau, Y.; Li, D. Application of iron-loaded activated carbon electrodes for electrokinetic remediation of chromium-contaminated soil in a three-dimensional electrode system. Sci. Rep. 2018, 8, 8753. [Google Scholar] [CrossRef]
  15. Yan, Y.J.; Ling, Z.; Shu, W.; Huang, T.; Crane, R. Chromium removal from contaminated soil using a novel FeOx/granular activated carbon-based three-dimensional electrokinetic system. Chem. Eng. J. 2023, 455, 140613. [Google Scholar] [CrossRef]
  16. Xu, J.W.; Liu, C.; Hsu, P.C.; Zhao, J.; Wu, T.; Tang, J.; Liu, K.; Cui, Y. Remediation of heavy metal contaminated soil by asymmetrical alternating current electrochemistry. Nat. Commun. 2019, 10, 2440. [Google Scholar] [CrossRef]
  17. Xie, X.Y.; Liu, Y.M.; Zheng, L.W. Experimental study on the effect of soil saturation on the electric permeability coefficient during electroosmosis process. Mar. Georesources Geotechnol. 2018, 37, 1188–1195. [Google Scholar] [CrossRef]
  18. Hu, L.M.; Hong, H.Q.; Wu, W.L. Electro-osmosis tests on kaolin clay. J. Tsinghua Univ. 2010, 50, 1353–1356. [Google Scholar]
  19. Kaniraj, S.R.; Huong, H.L.; Yee, J.H.S. Electroosmotic consolidation studies on peat and clayey silt using electric vertical drain. Geotech. Geol. Eng. 2011, 29, 277–295. [Google Scholar] [CrossRef]
  20. Park, H.M.; Lee, W.M. Helmholtz–Smoluchowski velocity for viscoelastic electroosmotic flows. J. Colloid Interface Sci. 2008, 317, 631–636. [Google Scholar] [CrossRef]
  21. Shang, J.Q. Zeta potential and electroosmotic permeability of clay soils. Can. Geotech. J. 1997, 34, 627–631. [Google Scholar] [CrossRef]
  22. Esrig, M.I.; Majtenyi, S. A new equation for electroosmotic flow and its implications for porous media. Highway Re. Rec. 1966, 111, 31–41. [Google Scholar]
  23. Leroy, P.; Tournassat, C.; Bernard, O.; Devau, N.; Azaroual, M. The electrophoretic mobility of montmorillonite. Zeta potential and surface conductivity effects. J. Colloid Interface Sci. 2015, 451, 21–39. [Google Scholar] [CrossRef] [PubMed]
  24. Paz-Garcia, J.M.; Johannesson, B.; Ottosen, L.M.; Ribeiro, A.B.; Rodriguez-Maroto, J.M. Modeling of electric double-layers including chemical reaction effects. Electrochim. Acta 2014, 150, 263–268. [Google Scholar] [CrossRef]
  25. Friedman, S.P. Soil properties influencing apparent electrical conductivity: A review. Comput. Electron. Agric. 2005, 46, 45–70. [Google Scholar] [CrossRef]
  26. Ye, Z.B.; Xu, J.T.; Yin, F.J.; Shi, L.T.; Chen, H.; Li, Y.L. Effect of Injected Water Composition on Zeta Potential of Liquid-Solid Interface in Reservoir. Fine Chem. 2018, 35, 1765–1771. [Google Scholar] [CrossRef]
  27. Kaya, A.; Yukselen, Y. Zeta potential of clay minerals and quartz contaminated by heavy metals. Rev. Can. De Ge’Otechnique 2011, 42, 1280–1289. [Google Scholar] [CrossRef]
  28. Averjanov, S.F. About permeability of subsurface soils in case of incomplete saturation. Engl. Collect. 1950, 7, 19–21. [Google Scholar]
  29. Mitchell, J.K.; Soga, K. Fundamentals of Soil Behavior; Wiley: New York, NY, USA, 1976; pp. 75–164. [Google Scholar]
  30. Mattson, E.D.; Bowman, R.S.; Lindgren, E.R. Electrokinetic ion transport through unsaturated soil: 1 Theory, model development, and testing. J. Contam. Hydrol. 2002, 54, 99–120. [Google Scholar] [CrossRef]
  31. Xue, Z.J.; Tang, X.W.; Yang, Q.; Tian, Z.F.; Zhang, Y. Influence of salt content on clay electro-dewatering with copper and stainless steel anodes. Dry. Technol. 2019, 37, 2005–2019. [Google Scholar] [CrossRef]
  32. Zhou, H.J.; Fang, Y.G.; Chen, M.H.; Gu, R.G.; Li, W. Experimental and analytical study on electro-osmosis in low-permeability soil considering the pore size effect. Geotechnique 2019, 71, 141–152. [Google Scholar] [CrossRef]
  33. Zhang, Y.T.; Chen, M.; Wang, J.G.; Deng, Y.R.; Li, Z.F. A new method for assessment of electro-osmotic permeability through the integration of theoretical and experimental ion flux in electrokinetic processes. J. Hazard. Mater. 2023, 459, 132049. [Google Scholar] [CrossRef] [PubMed]
  34. Gao, M.; Zeng, F.J.; Tang, F.; Wang, K.D.; Xu, X.Y.; Tian, G.M. An increasing Cr recovery from soil with catholyte-enhanced electrokinetic remediation: Effects on voltage redistribution throughout soil sections. Sep. Purif. Technol. 2020, 253, 117553. [Google Scholar] [CrossRef]
  35. Liu, X.Y.; Xu, L.H.; Zhuang, Y.F. Effect of electrolyte, potential gradient and treatment time on remediation of hexavalent chromium contaminated soil by electrokinetic remediation and adsorption. Environ. Earth Sci. 2023, 82, 40. [Google Scholar] [CrossRef]
  36. Ministry of Ecology and Environment of the People’s Republic of China. Soil and Sediment—Determination of Cr(VI)—Alkaline Digestion/Flame Atomic Absorption Spectrometry; HJ 1082-2019; Ministry of Ecology and Environment of the People’s Republic of China: Beijing, China, 2019.
  37. Ministry of Ecology and Environment of the People’s Republic of China. Soil Quality—Determination of Cation Exchange Capacity (CEC)—Hexamminecobalt Trichloride Solution-Spectrophotometric Mehod; HJ 889-2017; Ministry of Ecology and Environment of the People’s Republic of China: Beijing, China, 2017.
  38. GB/T 50123-2019; Standard for Geotechnical Testing Method. China Planning Press: Beijing, China, 2019.
  39. Gray, D.H.; Mitchell, J.K. Fundamental aspects of electroosmosis in soils. J. Soil Mech. Found. Div. 1967, 6, 39–51. [Google Scholar]
  40. Spiegler, K.S. Transport processes in ionic membranes. Trans. Faraday Soc. 1958, 54, 1408–1428. [Google Scholar] [CrossRef]
  41. Karampinos, D.C.; Georgiadis, J.G. Ab initio study of the energetics of ionic hydration with the polarizable continuum model. Nanoscale Microscale Thermophys. Eng. 2007, 11, 363–378. [Google Scholar] [CrossRef]
  42. Yang, Z.Z.; Meng, X.F.; Zhao, D.X.; Gong, L.D. Theoretical Study on Hydronium Ion Clusters by ab initio Calculation and ABEEM/MM Model. Acta Chim. Sin. 2009, 67, 2074–2080. [Google Scholar]
  43. Liu, Z.T.; Zhuang, Y.F. Electrokinetic transport and removal of lead contaminants from kaolin. Chin. J. Geotech. Eng. 2020, 42, 1359–1366. [Google Scholar] [CrossRef]
  44. Tournassat, C.; Bourg, I.C.; Steefel, C.I.; Bergaya, F. Chapter 1-surface properties of clay minerals. Dev. Clay Sci. 2015, 6, 5–31. [Google Scholar] [CrossRef]
  45. Liu, J.G.; Wang, H.T.; Nie, Y.F. Fractal model for predicting effective diffusion coefficient of solute in porous media. Adv. Water Sci. 2004, 15, 458–462. [Google Scholar]
Figure 1. Three-dimensional diagram of EKR setup (DC = direct current power supply; S1–S5 = soil section S1–S5 from anode to cathode).
Sustainability 15 12706 g001
Figure 2. Electroosmosis mechanism of ion hydration (DC = direct current power supply).
Sustainability 15 12706 g002
Figure 3. Electroosmosis mechanism caused by ion friction.
Sustainability 15 12706 g003
Figure 4. The rate of electroosmotic flow in (a) experiments EK1–EK7 and (b) experiments EK1 and EK8–EK11.
Sustainability 15 12706 g004
Figure 5. (a) The measured electroosmotic permeability and the calculated value by the H-S model; (b) the measured electroosmotic permeability and the calculated value by ion hydration and ion hydration–friction model of experiments EK1–EK11.
Sustainability 15 12706 g005
Figure 6. The measured electroosmotic permeability and Cr6+ removal efficiency in experiments EK1–EK11.
Sustainability 15 12706 g006
Table 1. Main properties and concentration of Cr6+-contaminated soil.
ParametersValue
Cr6+-contaminated soilWater content (%)29.8
Cr6+ concentration (mg/kg)498.5
Porosity (n)0.58
pH7.85
Specific surface area (m2/g)4.41
Dry density ρ d 1520   k g / m 3
Saturation (Sr)78%
Plastic limit/liquid limit18.59/33.26
Particle size distributionClay12.89%
Silt34.00%
Sand53.11%
Table 2. Experimental conditions.
ExperimentsPore SolutionElectrolyte in Anode and CathodePotential GradientZeta PotentialCation Exchange Capacity
EK1Deionized water0.5 mol/L citric acid2 V/cm−35.5 mV16.9 cmol/kg
EK20.1 mol/L acetic acid0.5 mol/L citric acid2 V/cm−17.1 mV11.3 cmol/kg
EK30.2 mol/L acetic acid0.5 mol/L citric acid2 V/cm−16.2 mV10.7 cmol/kg
EK40.4 mol/L acetic acid0.5 mol/L citric acid2 V/cm−12.8 mV9.7 cmol/kg
EK50.5 mol/L acetic acid0.5 mol/L citric acid2 V/cm−12.1 mV8.9 cmol/kg
EK60.8 mol/L acetic acid0.5 mol/L citric acid2 V/cm−9.2 mV7.3 cmol/kg
EK71.0 mol/L acetic acid0.5 mol/L citric acid2 V/cm−7.4 mV6.4 cmol/kg
EK80.1 mol/L citric acid0.5 mol/L citric acid2 V/cm−15.3 mV8.5 cmol/kg
EK90.2 mol/L citric acid0.5 mol/L citric acid2 V/cm−11.6 mV5.9 cmol/kg
EK100.5 mol/L citric acid0.5 mol/L citric acid2 V/cm−5.1 mV4.7 cmol/kg
EK111.0 mol/L citric acid0.5 mol/L citric acid2 V/cm10.2 mV3.1 cmol/kg
Table 3. The main parameters and constants needed in the calculation.
ParametersValue
H+ diffusion coefficient D o , H + 9.31 × 10 9   m 2 / s
Faraday constant (F) 96 , 485.3   C / m o l
Temperature (T)298 K
Universal gas constant (R) 8.314   J / m o l · K
Molar mass of water (Mw) 18   g / m o l
Avogadro constant (NA) 6.02 × 10 23
Permittivity of pore water D 7.12 × 10 10   F / m
Dynamic viscosity of pore water η 1.01 × 10 3   N · s / m 2
Coulomb constant (k) 8.99 × 10 9   N · m 2 · C 2
Disclaimer/Publisher’s Note: The statements, opinions and data contained in all publications are solely those of the individual author(s) and contributor(s) and not of MDPI and/or the editor(s). MDPI and/or the editor(s) disclaim responsibility for any injury to people or property resulting from any ideas, methods, instructions or products referred to in the content.

