Abstract
Data on the potential impact on human health of engineered nanomaterials are still scarce, with an evident lack of knowledge on the exposure levels at all stages of the life cycle. By prioritizing the responsible handling of engineered nanomaterials (ENMs), companies can promote sustainability by minimizing the risks of occupational exposure, protecting employee well-being, reducing liability, and avoiding costly environmental remediation efforts. This research aims to evaluate the risk in real scenarios involving the use of carbon-based nanomaterials in research laboratories, pilot-scale facilities, and industrial settings. Several online and offline instruments have been employed to characterize the particulate matter present in these environments, including particles in the nanometer range and relevant fractions for risk assessment purposes. Samples collected on polycarbonate filters were analyzed by scanning electron microscopy (SEM) and energy-dispersive X-ray spectroscopy (EDX). Exposure estimation has been performed by applying a decision based on tier 2 from the nanoGEM methodology, with the weighing and transferring of reduced graphene oxide (RGO) in a pilot plant being the most liberating processes, which are the activities with the highest risk of exposure. In addition, high levels of particle concentration, with peaks up to 1.7 × 10⁵ and 4.7 × 10⁵ part/cm3, have been found for the dispersion of carbon nanotubes (CNTs) and incorporation of carbonaceous nanoparticles into resins, respectively.
1. Introduction
It is well known that the use of engineered nanomaterials (ENMs) in multiple industrial sectors has grown significantly in recent years. These materials, due to their physical–chemical properties, are widely used in technology, electronics, the construction industry, virus sensing, and biomedical applications, among others [1,2,3,4].
Carbon-based nanomaterials (CBNs) are a subgroup of ENMs with promising applications in a number of sectors, including agriculture [5], pollutant removal [6], energy storage [7], and biomedicine [8,9]. The growing interest in this type of material has led to an increase in the need for their production and a greater interest in the scientific field to study and improve the applications of these versatile materials in different fields. In spite of their advantages, several studies report negative effects on biological systems from materials such as single-walled carbon nanotubes (SWCNTs), which, in high concentrations, are cytotoxic to neuronal cells, as they cause inhibition responses of cell activity [10,11]. Additionally, multi-walled carbon nanotubes (MWCNTs) are characterized by their pulmonary toxicity [12] or graphene (GRA) and graphene oxide (GO), which induce innate immune gene expressions [13,14]. While these materials offer numerous benefits, their potential adverse health and environmental impacts have raised concerns. Addressing these concerns is crucial for ensuring the long-term sustainability of companies operating in nanotechnology-related industries. In this sense, it is important to assess the potential risk of nanoscale materials on human health since, due to their morphological characteristics, they can easily penetrate the respiratory tract and cause lung and cardiovascular damage [15,16]. In particular, the exposure to carbonaceous materials is a cause for concern since they are considered the primary components of tissue damage [17,18]. Carbon nanomaterials have also been associated with lung tumors and cellular inflammation [18]. In addition, recent studies suggest that carbonaceous nanoscale materials are related to abnormal neural activation and function and, eventually, may lead to neurological damage [17].
Materials such as carbon nanotubes (CNTs), graphene (GRA), graphene oxide (GO), multi-walled carbon nanotubes, carbon nanofibers (CNFs), or fullerenes have been widely used over the last decades due to their unique properties in the nanotechnology field. Several applications in electronics, biomedicine, catalysis, and optics have been described in the literature [19,20,21].
Occupational exposure to nanomaterials has received considerable attention in the literature, as exposure during the synthesis and manufacture of nano-enabled products is potentially the highest, such as during bag filling, mixing additives, and pouring processes [22,23]. In addition, research activities involving the handling of nanomaterials may also pose a risk exposure for the operators, workers, and/or researchers involved.
Proactively managing occupational exposure to ENMs not only safeguards employee health, but also helps companies reduce liability risks and avoid costly legal battles. Moreover, by minimizing the release of ENMs into the environment, companies can prevent potential ecological damage and contribute to sustainable practices. The literature has reported several studies concerning the high levels of particles found in the air in the manufacturing sector. These levels depend on the task performed, the ventilation conditions, the matrix in which the material being handled is located, and the dustiness factor of the EMN, among other factors. For example, Sousa et al. (2021) [24] reported levels of ultrafine particles (UFP) between (1.6 and 3.8) × 104 part/cm3 during metal additive manufacturing tasks. Values between (2.5 and 5.2) × 104 part/cm3 were measured in the packing lines of ceramic manufacturing facilities [23]. Higher values (104–105 part/cm3) were reported by Salmatonidis et al. (2019) [25] during thermal spraying of ceramic coatings.
Exposure can occur as a single event, as a series of repeated events, or as continuous exposure. When developing an exposure assessment, the levels of exposure must be considered, as well as other parameters, such as the duration and frequency of exposure. Regular health surveillance and medical monitoring programs are essential for assessing and managing potential health effects resulting from occupational exposure to ENMs. By closely monitoring workers’ health and providing appropriate medical interventions, companies can ensure early detection and timely treatment of any adverse effects, thereby promoting the well-being and longevity of their workforce.
According to the registration, evaluation, authorization, and restriction of chemicals (REACH) regulation, an exposure scenario is a set of information that describes the conditions under which the risks associated with the identified uses of a substance, either in its pure state or in a mixture, can be controlled, including operating conditions and the necessary risk management measures it contains. Exposure scenarios typically contain information on the procedures involved during synthesis, use, or disposal of the ENMs; the associated operational conditions (OCs) of use; the risk management measures and waste treatment measures that are necessary for safe use; and information about the exposure estimation and the models used for this purpose. The methodology used in the framework of this study follows the NEAT (nanoparticles emission assessment technique) approach, developed by the US NIOSH [26] and the three-tiered approach proposed by the Organization for Economic Co-operation and Development (OCDE) [27].
The NEAT method consists of a stepped approach in two stages. The first study (Tier 1) focuses on the identification of the emission sources, as well as a first scoping visit to gather information on the background level and the variations in the concentration of the particles during the relevant activities.
The tier two assessment comprises an in-depth study of the type and levels of particulates released during selected tasks and operations in the workplace. Finally, the tier three assessment involves repeating tier two measurements, together with simultaneous collection of particles for off-line analysis of the mass or fiber concentration, particle morphology, and chemical composition. Filter and electrostatic precipitator-based samples can be collected for chemical analysis, scanning electron microscopy (SEM), transmission electron microscopy (TEM), energy-dispersive X-ray spectroscopy (EDX), and X-ray diffraction (XRD). Off-line analysis can be compared to real-time measurement results. Additional real-time instruments, such as particle sizers based on electrical mobility, aerodynamic or optical properties or impactors, scanning mobility particle sizers (SMPS), aerodynamic particle sizers (APS), optical particle sizers (OPS), or ELPI may be used in the tier three assessment.
The particle number concentration (as part/cm3) in the presence and absence of activities was monitored in this study. Additionally, the lung-deposited surface area (LSDA) has also been obtained in this work. The LSDA parameter was developed to assess the negative health effects of particles deposited in the alveolar region of the human respiratory tract [28].
Finally, in order to assess the potential exposure of the different scenarios, the tier 2 formula (Equation (1)) of the nanoGEM approach described by Asbach et al. (2012) [29] and Kaminski et al. (2015) [30] was chosen and can be described as follows:
where CACT and CBKG are the mean particle number concentration during activity and in its absence (also referred as background (BKG)), respectively, and σBKG is the standard deviation of the background concentration. If the resulting concentration difference between the workplace under investigation and the background is more than three times the standard deviation of the varying background concentration, then the workplace or process concentration is deemed to be significantly increased and must be further assessed for the release of airborne nano-objects, resulting in the necessity of the implementation of mitigation measures.
(CACT − CBKG) > 3 σBKG
Consequently, understanding and managing occupational exposure to ENMs is vital for minimizing their release into the environment and safeguarding the health and safety of workers. By implementing robust safety protocols, such as engineering controls, personal protective equipment, and proper training, companies can minimize the potential health risks associated with nanomaterial exposure. This fosters a safe and healthy work environment, reducing the likelihood of work-related illnesses and injuries. In addition, with environmentally conscious procedures, such as waste management protocols and pollution prevention measures, companies can minimize their ecological footprint. This ensures that nanotechnology-based industries align with sustainable development goals and contribute to a greener future.
Moreover, the European Green Deal presents a roadmap for transforming the EU into a modern, resource-efficient, and competitive economy by converting environmental, health and safety (EHS), and sustainability challenges into opportunities across all policy areas, including chemicals. Nanotechnology is among those enabling technologies that could effectively support the transition towards more sustainable innovation in a broad range of industrial sectors; however, there is an urgent need to generate robust data on the environmental, health, and safety issues of nanomaterials to ensure sustainable industrial-scale nanofabrication and its successful incorporation into high-value industries.
Several EU-funded projects have partially addressed the importance of incorporating sustainability and circularity principles in the management of nanomaterials; however, there is a pressing need to generate new data that can comprehensively assess the human health impacts of these materials, with a specific focus on work-place exposure. Such efforts are crucial for ensuring the sustainable development of nanotechnology.
Finally, there is a global increase in the demand of carbon-based materials. The global graphene market size is expected to expand at a compound annual growth rate (CAGR) of 46.6% from 2023 to 2030. The market is expected to be driven by the growing electronics industry in emerging economies and high penetration in composite applications. The graphene industry is also expected to witness significant growth on account of increasing demand from research institutes and multinational companies for the purpose of research and development [31]. Similarly, Europe’s nanofiber market is estimated to witness a significant growth, at an estimated CAGR of around 20%, over the forecast period. A major factor driving the market studied is the growing commercialization due to increasing end-user applications [32].
In this work, the results of an extensive monitoring campaign of different scenarios through the life cycle of carbonaceous nanomaterials are presented: (1) synthesis of GO, (2) CNTs’ magnetic dispersion, (3) additivation of resins containing carbonaceous ENMs, and (4) dispersion of carbon nanofibers in water. The outcomes of the study contribute to the better understanding of the potential impacts of carbon-based materials on human health as a result of the increasing demand of added value products based on nanomaterials.
2. Materials and Methods
The methodology used to perform the exposure assessment was based on the NEAT approach [26], developed by the US NIOSH for identifying sources and releases of engineered nanoparticles. The measurements were carried out in two different locations within each process: near-field (NF) and far-field (FF). NF is the area around 0.5–1 m from the nanomaterial source, and the FF is a remote zone unaffected by any emissions, around 5–7 m from the source, equivalent to the BKG. In this way, the expansion of the nanoparticles in the workplace where the worker is exposed was compared.
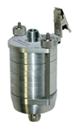
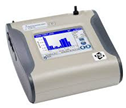
In order to gather high-quality data, several instruments were employed during the campaigns. The instrumentation used during the exposure measurement studies is detailed in Table 1.

Table 1.
Characteristics of the online instrumentation employed.
Additional measurements were obtained by filtering the samples through 37 mm diameter polycarbonate filters. These filters were connected to air pumps that simulate human respiration to capture the volume of particles that an average worker would breathe. Once the sampling was concluded, the samples were subsequently analyzed by electron microscopy (SEM, EDX) to obtain their morphology and composition.
In all the cases, a scoping study was carried out to gather information on the background level and the particle number concentration dispersion during the relevant activities. The background, in terms of part/cm3, was measured during the cessation of activity for each scenario. Because outdoor particles infiltrate work environments, and multiple sources of particles can be present in work areas, an assessment of particle emission and exposure arising from nanotechnology processes must account for local background particle exposure.
The activity process is defined as the NF area where a release may occur, being a possibility of exposure for the worker. These areas are identified through the activity questionnaires completed by the involved companies, complementing them with the critical areas analyzed in the literature and the previous visits to the workplace.
Exposure Scenarios
For the characterization of the scenarios in which the release of ENMs may occur and there is a risk of workers’ exposure, a staged process was followed as mentioned before, applying a proven methodology with high-precision equipment. A total of four different exposure scenarios were studied, which are described in more detail in Table 2. The first exposure scenario (ES1) consists of the synthesis of GO at a laboratory scale. The synthesis process involved consecutive mixing of GO with a NaOH solution and mechanical movements (in enclosed tubes). The area has natural ventilation, central ventilation, and forced ventilation through air conditioning.
Table 2.
Main characteristics of the different exposure scenarios.
The second exposure scenario (ES2) consists of the dispersion of CNTs, also at a laboratory scale, with the same ventilation conditions as described for ES1. The tasks carried out are the weighing of three types of CNTs (event 1), the addition of a solvent inside a laminar flow hood (event 2), and the transfer of the material to an enclosed ultrasound (event 3).
The third exposure scenario (ES3) consists of a pilot plant to incorporate carbonaceous nanoparticles into resins. The main tasks performed were weighing and transferring quantities of graphene, graphite, and MWCNTs. Afterwards, these materials were introduced into a shaker in a separate room with forced ventilation, where a different type of binder was added for each nanomaterial.
Finally, at an industrial scale, the fourth exposure scenario (ES4) consists of the preparation of a dispersion of CNFs in an industrial production facility of advanced carbon materials, including the manual packing of carbon-based materials and the preparation of liquid formulations. In this scenario, two main activities were monitored: weighing and pouring and dispersion of the solution. The following table specifies some important environmental and technical parameters of each exposure scenario.
Regarding the measurement equipment used for each exposure scenario, it is important to know that the selection criteria intended to obtain data on both the size distribution and the particle concentration. In ES1 and ES2, the size distribution was given by the Nanotracer equipment, which gives the automatic calculation of the LDSA value, but for ES3 and ES4, the OPS was used, which is more suitable for complex pilot and industrial scale processes since it has a much more precise size distribution measurement method; however, it does not automatically calculate the LDSA value, but instead shows particle values below the micron, which reach the pulmonary alveoli.
3. Results
In this section, experimental data obtained for each scenario are shown. The analysis and discussion of the results is shown below.
3.1. ES1: Laboraotry 1—Synthesis of GO3.1.1. Measurement Campaign
The results obtained with the different instruments employed in the background and NF for ES1 are shown in Table 3. The particle number concentration (NP, in part/cm3) is also compared against the LDSA (in µm2/cm3) and nanoparticle mean size (in nm).
Table 3.
(a) Values of number concentration measured in background and near field with the instruments, LDSA, and particle size listed. (b) Data measured with the NanoExplore device.
The detected values are similar, with those of the Nanowatcher being a little higher due to its measurement range. A graphical example of the evolution of the number of particles (NP) versus LSDA and particle size has been plotted for the data obtained by NanoExplore device.
The results obtained show a concentration of particles with fairly stable evolution with respect to time for particles of less than 1 μm; however, particles greater than 1 μm showed increases in concentration corresponding to the moment of mixing. The maximum, minimum, and mean values are also shown at the right side of each figure (Figure 1).
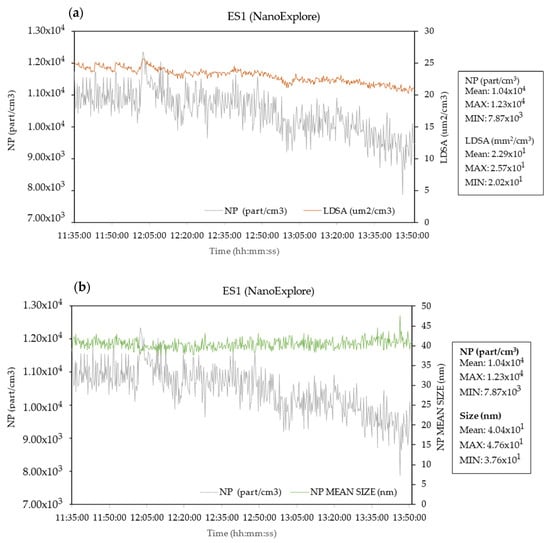
Figure 1.
Results obtained by the NanoExplore device in ES1 in the background and NF. The concentration of the number of particles per volume (NP, part/cm3) is compared against LDSA (µm2/cm3) (a), and nanoparticle mean size (nm) (b) versus elapsed time.
The mass concentration of the particles (C, in μg/m3) within the micrometric range corresponding to 1 micron (PM1), 2.5 microns (PM2.5), and 10 microns (PM10), monitored in ES1, is summarized in Table 4.
Table 4.
Concentration of particles PM1, PM2.5, and PM10, in μg/m3, monitored in the presence and absence of activity in ES1.
As can be seen in Figure 2, the highest fraction corresponds to PM10, with concentrations up to 3.6 µg/m3. The contribution of PM1 seems to be negligible compared with the concentration of PM10.
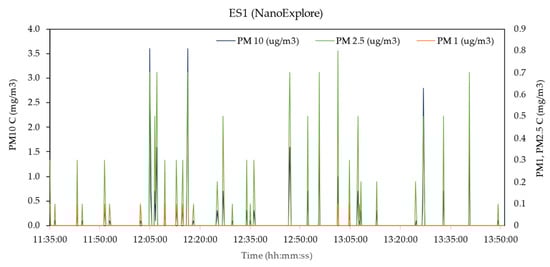
Figure 2.
Plot for PM1, PM2.5, and PM10 fractions versus elapsed time for the activities carried out in ES1.
Semi-Quantitative Morphological and Chemical Characterization
During the measurement campaign, the sampling systems were used based on the collection of material on polycarbonate filters that allow subsequent observation by electron microscopy of their morphology and composition.
The samples collected on the polycarbonate filters were analyzed by scanning electron microscopy (SEM—Hitachi S-4800 Tokyo, Japan) and energy-dispersive X-ray spectroscopy (EDX). The results obtained are shown in Table 5.
Table 5.
EDX results for the SEM images for ES1.
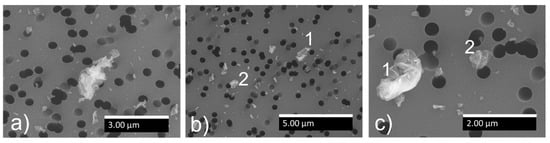
Figure 3.
SEM images for filters analyzed in ES1. Images (a–c) correspond to particles found in different zones of the filter used. Numbers 1 and 2 represent the position of different particles under the same image for which the EDX analysis has been performed.
Table 5.
EDX results for the SEM images for ES1.
| Figure 3a | Figure 3b | Figure 3c | |
|---|---|---|---|
| Chemical Composition | 66.6% C 17% O 0.49% S 0.42% Cl 0.17% Cu | Part 1: 75%C 14% O 0.8% Cl Part 2: 77.7% C 13.7% O 0.15% Cl | Part 1: 76% C 16.5% O 0.3% Cl. Part 2: 78.1% C 12.8% O 0.1% Cl |
| Size (µm) | 2 µm × 0.8 µm | Part 1: 0.7 µm × 0.3 µm. Part 2: 0.6 µm × 0.5 µm | Part 1: 1 µm × 0.6 µm Part 2: 0.5 µm |
3.2. ES2: Laboratory 2—Dispersion of Carbon Nanotubes (CNTs)
3.2.1. Measurement Campaign
In this scenario, as mentioned before, three events took place: weighing CNTs (event 1), addition of a solvent (event 2), and transference of the material to an ultrasound bath (event 3).
The results obtained with the different instruments employed in the background and NF for ES2 are shown in Table 6. The particle number concentration (NP) is also compared against the LDSA (µm2/cm3), and the nanoparticle mean size (nm) is compared against the elapsed time.
Table 6.
(a) Values of number concentration, LDSA, and particle size measured in background and near field with the instruments listed. (b) Data measured with the NanoExplore device.
As in the previous case, the detected values are similar, with those of the Nanowatcher being a little higher due to its measurement range.
As can be seen in Figure 4, the concentration of particles remained quite stable during all the events of the process. The only relevant peaks are shown during the weighing of materials (event 1) and correspond to particles larger than 1 micron.
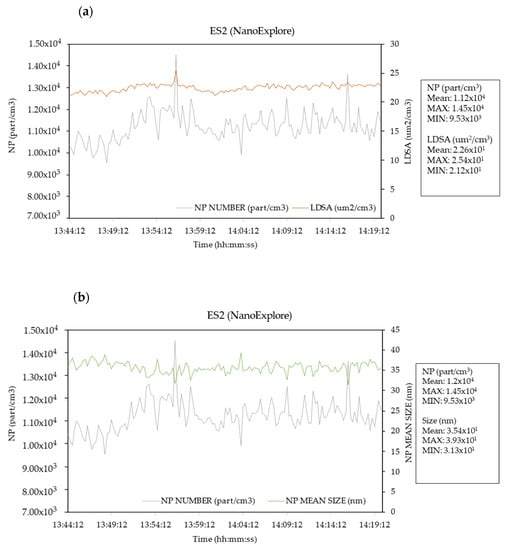
Figure 4.
Results obtained by the NanoExplore device in ES2 in the background and NF. The concentration of particles per volume (NP, in part/cm3) is compared against LDSA (in µm2/cm3) (a), and nanoparticle mean size (in nm) (b) versus elapsed time.
The mass concentration of the particles (C, in μg/m3) for each fraction PM1, P,2.5, and PM10, monitored in ES2, is summarized in Table 7, Figure 5.
Table 7.
Concentration of particles PM1, PM2.5, and PM10, as μg/m3, monitored in the presence and absence of activity in ES2.
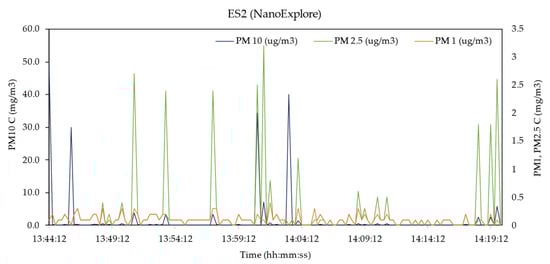
Figure 5.
Plot for PM1, PM2.5, and PM10 fraction versus time for the activities carried out in ES2.
The concentration of PM10 seems to be higher than the other fractions. No other remarkable differences were found between the background and NF concentrations.
3.2.2. Semi-Quantitative Morphological and Chemical Characterization
The results obtained from the SEM and EDX analysis of the filters collected are shown in Table 8.
Table 8.
EDX results for the SEM images for ES2.
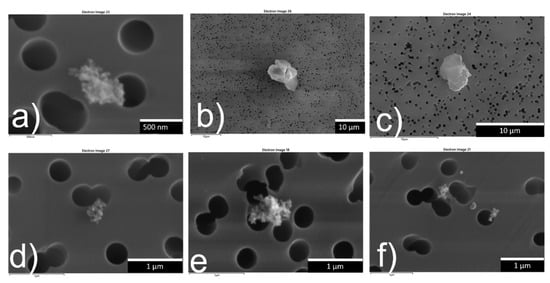
Figure 6.
SEM images for filters analyzed in ES2. The letters (a–f) correspond to particles found in different zones of the filter used.
Table 8.
EDX results for the SEM images for ES2.
| Figure 6a | Figure 6b | Figure 6c | Figure 6d | Figure 6e | Figure 6f | |
|---|---|---|---|---|---|---|
| Chemical composition | 90% C 0.06% Si | 39% C, 0.44% Na, 1.5% Mg, 18.33% Al, 25.7% Si, 8% K, 0.5% Ti, 2.2% Fe | 92% C, 0.4% Na, 0.43% Mg, 0.56% Al, 1% Si, 0.95% K, 0.2% Ca, 0.14% Ti, 1.22% Fe, 0.2% Cu | 99.26% C | 99.2% C 0.04% Cu | Part.1: 99.39% C; Part.2: 99.4% C, 0.07% S; Part 3: 99.54% C |
| Size (µm) | 0.6 µm × 0.3 µm | 10 µm × 5 µm | 8 µm × 4 µm | 0.5 µm × 0.3 µm | 0.8 µm × 0.6 µm | Part.1: 0.5 µm × 0.2 µm Part.2: 0.2 µm × 0.1 µm. Part.3: 0.4 µm × 0.1 µm |
3.3. ES3: Pilot Plant—Incorporation of Carbonaceous Nanoparticles into Resins
3.3.1. Measurement Campaign
In this scenario, since several activities were conducted, the data analysis was achieved in a different manner. Figure 7 shows the levels of particles (size < 1 μm) monitored with the CPC TSI-3007 in the weighing and agitation area. The peaks due to the main activities have been identified.

Figure 7.
Concentration of particles (<1 μm) monitored in the weighing and agitation area. GR: graphene. RGO: reduced graphene oxide. MWCNTs: multi-walled carbon nanotubes.
The evolution of the particle concentration from Figure 7 shows an increase in concentration with respect to the background as soon as the process begins.
During graphene manipulation, however, a newer increase was observed, obtaining very punctual peaks, but reaching the highest peak between (4.3 and 4.9) × 104 part/cm3 in the far field and up to 1.70 × 10⁵ part/cm3 in the near field with the CPC.
According to the list of processes provided by workers, the highest concentration peaks were observed during the transfer of graphene (A); however, these concentration peaks were reduced as soon as the liquid started to be added. This suggests that the addition of liquid helps to mitigate the release or dispersion of particles during the transfer process. The second RGO peak (B) corresponds to the process of cleaning the area. This peak may have been caused by resuspended particles present in the environment. The data measured by the CPC in the near field show high peaks for graphene and graphene oxide, both materials with a high dustiness index, especially when they are handled in powder form.
On the other hand, during the stirring phase, the concentration decreased when the activity started, precisely because of the transfer of personnel from the office area to the laboratory bench and the closing of doors. Peak C corresponds to the moment in which the stirring of the graphene is finished. The last peak, Peak D, occurred when the graphite in the dispersion was extracted to introduce it into warm water; however, the passage notes that the increase in the concentration at this point is likely not due to the process itself, but to external factors. The fact that this increase was detected in the far field (far away from the source) rather than the near field (close to the source) suggests that the rise in the concentration is influenced by factors outside the immediate process, such as air currents or ventilation patterns. A summary of the particle concentrations obtained during the different activities carried out in ES3, for particle sizes between 300 nm and 10 μm (OPS) and under 1 μm (CPC), is shown in Table 9.
Table 9.
Maximum, minimum, mean, and standard deviation (Std. Dev) values of the particle concentration (NP) and mass concentration (C) obtained during activities carried out in ES3 in the far field (FF) for particles < 1 μm.
The concentration in the far field for particles between 300 nm and 10 μm was also monitored by the OPS device. The particle number and mass concentration are shown in Table 10.
Table 10.
Maximum, minimum, mean, and standard deviation (Std. Dev) values of the particle concentration (NP) and mass concentration (C) obtained during activities carried out in ES3 in the far field (FF) for particles between 300 nm and 10 μm.
3.3.2. Semi-Quantitative Morphological and Chemical Characterization
The samples collected on the polycarbonate filters were analyzed by SEM-EDX microscopy.
During the graphene handling and agitation processes (Figure 8), lamellar particles that morphologically could be graphene were collected; however, due to the carbonaceous composition of the filter, we cannot distinguish them from the background in the analysis. Traces of aluminum, silicone, and iron appeared, as can be seen in Table 11. These particles are probably present in the environment and adhere to the surface of the largest graphene particles.
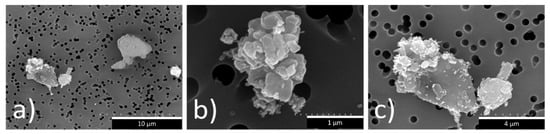
Figure 8.
SEM images for filters for graphene handling in ES3. The letters (a–c) correspond to particles found in different zones of the filter used.
Table 11.
EDX results for the SEM during graphene handling (ES3).
Similar results were obtained for the graphite handling and agitation processes (Figure 9), where many larger lamellar particles are observed. In this case, only carbon and oxygen are observed. The materials from metallization (Au and Pd) are ignored; therefore, the carbon contribution comes mostly from the collected graphite particles. Table 12 includes data on the composition of the particles shown in Figure 9.
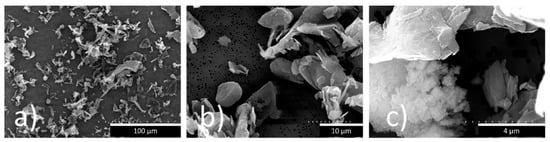
Figure 9.
SEM images for filters for graphite handling and agitation in ES3. The letters (a–c) correspond to particles found in different zones of the filter used.
Table 12.
EDX results for the SEM during graphite handling and agitation in ES3.
In the case of the MWCNTs manipulation (Figure 10), no nanotubes collected on the filters were observed, although they may be below the resolution of the microscope. On the other hand, graphene or graphite particles from the previous processes that still remained in the environment were observed, and their contribution is remarkable. Table 13 includes data on the composition of the particles shown in Figure 10.
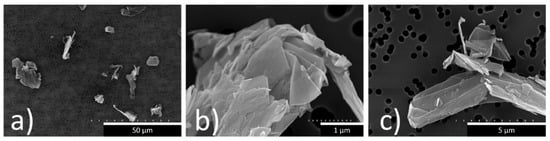
Figure 10.
SEM images for filters for MWCNTs handling and agitation in ES3. The letters (a–c) correspond to particles found in different zones of the filter used.
Table 13.
EDX results for the SEM during MWCNTs handling and agitation in ES3.
3.4. ES4: Industrial Scale
3.4.1. Measurement Campaign
The processes were developed in different rooms where the NanoExplore devices were registering data for 10 min in the weighing room, and 2 h 30 min in the dispersion room. In both cases, the device was placed at the nearest possible distance from the worker position in the process. Figure 11 and Figure 12 show the concentration levels of the particles registered.
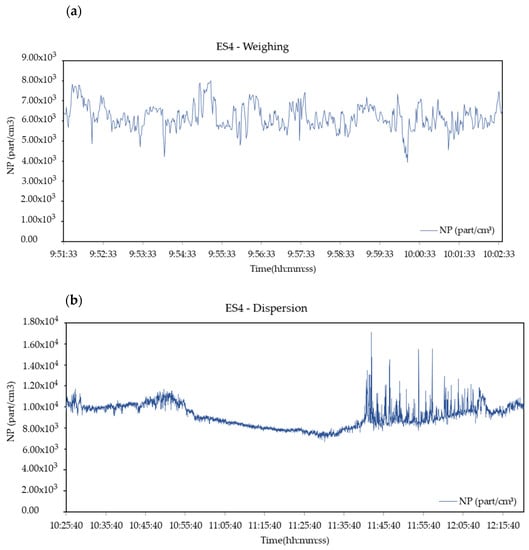
Figure 11.
Nanoparticle number concentration (NP) levels during the weighing (a) and dispersion (b) at industrial facilities.
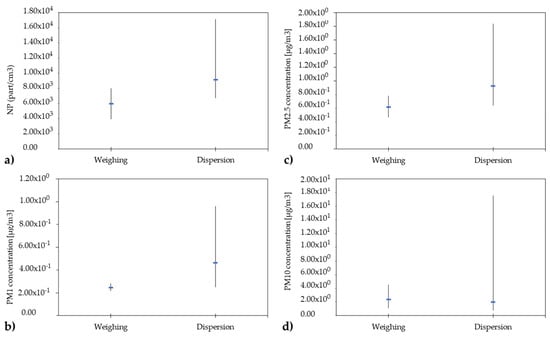
Figure 12.
Average, minimum, and maximum values for number concentration of nanoparticles (NP) (a) and mass concentration of micro-sized particles PM1 (b), PM2,5 (c), and PM10 (d) from both events, weighing and dispersion, at industrial facilities.
The measurements developed allowed for the analysis of the particulate matter (micro-sized and nano-sized) concentration during the processes taking place during the exposure campaign.
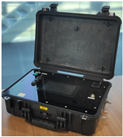
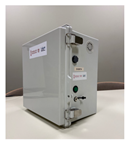
In this case, measurements from the NanoExplore device were compared to the data acquired by commercially available devices that present a higher accuracy, obtaining a good correlation between the different data sets. The setup developed to perform this test is shown in Figure 13.
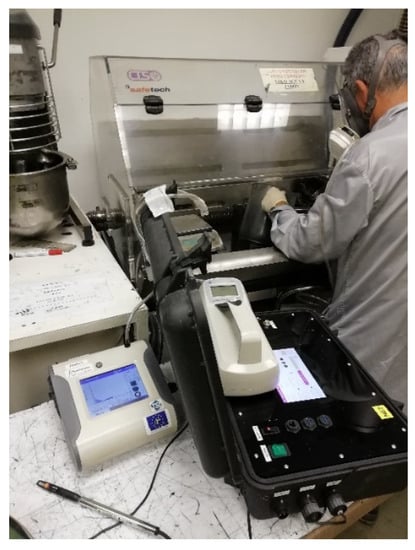
Figure 13.
Setup developed to perform the particulate matter exposition campaign at the industrial facility.
The total particle concentrations resulting from the two studied activities are very low, as indicated in Table 14.
Table 14.
Concentration of particles (10–300 nm) measured with NanoExplore device in μg/m3 in the presence and absence of activity in ES4.
The weighing process clearly reveals a continuous evolution of the particle concentration over time, without showing significant emission moments. On the other hand, the evolution of the concentration of particles during the dispersion process shows emission peaks at the moment of the greatest energy used; however, significant exposure values were not reached.
3.4.2. Semi-Quantitative Morphological and Chemical Characterization
For the filter samples, from the exposure scenario in industrial facilities, a TEM analysis was performed alongside the selected area electron diffraction (SAED) technique. The analysis confirmed the detection of CNTs by the NanoExplore devices at the correct performance of the devices in the carbon nanotubes laboratory. Figure 14 shows the results obtained after the analysis of the filter, which was placed in the personal breathing zone (PBZ) of the worker.
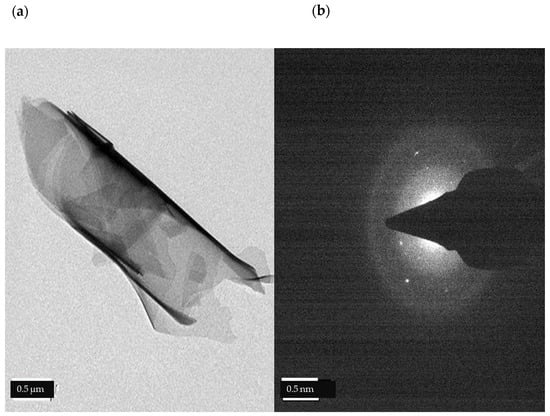
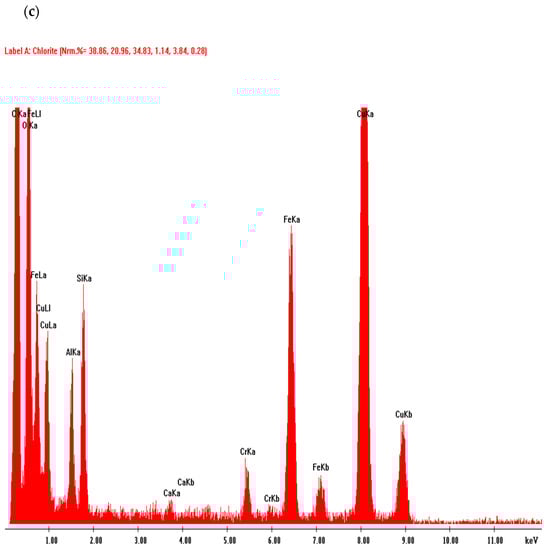
Figure 14.
(a) Particle found by TEM analysis of the filter placed in the PBZ of the worker in ES4. (b) Diffraction pattern resulting from SAED. (c) Chemical composition of the particle.
4. Discussion
This document shows data on the exposure concentration retrieved from a number of case studies involving carbon-based materials. The study includes data measured with a suite of devices, including recently developed nanoparticle detectors (i.e., NanoExplore/NanoWatcher). This is the first set of data published so far, which can be used in the future for data comparison purposes. Moreover, data on the concentration levels for PM10, PM2.5, and PM1 fractions are provided, which demonstrates the importance of covering a wider particle size distribution, not only at the nanometer range, as the potential effects of PM1, PM2.5, and PM10 are of prime importance.
The studies were conducted without considering the age of the process operators who are responsible for conducting the tasks involving the production and use of nanomaterials. Nevertheless, the operators involved in the ES1 correspond with an age band below 30 years, as the facilities are operated by PhD students. On the other hand, ES2 to ES4 are all operated by operators in the age band or group of 35 to 50, which implies more experience and knowledge of safety procedures.
Concerning the measured data, the average concentration of particles in the near field in ES1 and ES2 are similar (1.25 × 10⁴ and 1.67 × 10⁴ part/cm3, respectively), being slightly higher than the background level; however, these scenarios are characterized by not having the possibility of stopping production to make a clean background measurement without any ongoing process. The local particle reference value corresponds to the average of the measurements made at the door of the laboratories.
For ES3, similar values of the particles for all the activities were obtained, with the handling of RGOs being the activity with the highest release of particles (NPMAX 1.44 × 10⁵ part/cm3).
For ES4, the particle concentration values were rather low, with peaks above 1.00 × 10⁴ part/cm3. The weighing process was conducted in a fume hood, maintaining a low concentration of particles in place. The dispersion process showed several peaks, with values reaching 1.70 × 10⁴ part/cm3.
As mentioned above, to evaluate the potential exposure of the different scenarios, calculations by employing Equation (1) have been performed. The exposure concentration is considered significantly above the background if (CACT − CBKG) > ±3 σBKG [29].
The data obtained from NanoExplore NF measurements were employed for ES1, ES2, and ES4. For ES3, the calculations were obtained from the CPC NF results, with a subsequent mismatch in the measuring ranges between the two devices. The exposure estimation obtained for each scenario is summarized in the following table.
According to the results obtained in Table 15, the weighing and transferring of RGO is the activity with the highest exposure estimation, followed by graphite stirring. The rest of the scenarios seem to not have a significant risk of exposure. The table below shows additional information on the concentration levels of carbon-based materials from studies conducted by ITENE under the framework of EU-funded projects. Table 16 compiles exposure concentration levels measured in scenarios of fabricating graphene based particles, where weighing Graphene Platelets operations generated a higher exposure level.
Table 15.
Exposure estimation for each scenario according to the nanoGEM approach.
Table 16.
Exposure concentration levels measured in scenarios of fabricating carbon-based materials.
5. Conclusions
The rapid development and integration of engineered nanomaterials, especially carbonaceous ones, such as carbon nanotubes and graphene, have revolutionized various industries, offering tremendous opportunities for technological advancements and improved product performance; however, the potential risks associated with occupational exposure to these nanomaterials have raised concerns regarding worker safety and environmental impacts.
The control and management of occupational exposure to these carbonaceous engineered nanomaterials are essential for improving the safety and sustainability of companies. By implementing robust risk assessment and management strategies, employing engineering controls and personal protective equipment, and fostering training and awareness programs, companies can effectively protect their workers’ health while reducing environmental impacts.
This work explores the potential risk of exposure of a combination of different scenarios and carbon-based materials in quantitative and analytic ways, ranking the most probable scenarios for the release of particles that could potentially affect the health of the workers and the environment. According to the results, the activity of weighing and transferring reduced graphene oxide is estimated to have the highest exposure, followed by graphite stirring. Both of these activities involve dry processes with powder materials. The implication is that workers engaged in these specific activities may be at a higher risk of exposure to potentially harmful particles compared to other scenarios analyzed.
The findings of the research will not only provide quantitative and analytical assessments of potential risks of exposure to carbon-based materials, but will also enable qualitative assessments by industry during the early stages of the innovation process. The qualitative assessment aims to identify sources or hotspots of possible environment, health, safety (EHS), and/or sustainability concerns along the entire lifecycle of the targeted materials.
Author Contributions
Conceptualization, C.F.L. and I.C.G.; methodology, C.F.L. and O.A.S.; validation, C.F.L. and O.A.S.; investigation, C.F.L., O.A.S., V.V. and M.D.R.; resources, C.F.L. and O.A.S.; writing—original draft preparation, I.C.G. and C.F.L. All authors have read and agreed to the published version of the manuscript.
Funding
This research was carried out as part of the LIFE project NanoExplore funded by the European Commission’s LIFE program, under grant agreement LIFE17 ENV/GR/000285.
Institutional Review Board Statement
Not applicable.
Informed Consent Statement
Not applicable.
Data Availability Statement
Not applicable.
Conflicts of Interest
The authors declare that we have no conflict of interest.
References
- Hu, T.; Gu, Z.; Williams, R.G.; Strimaite, M.; Zha, J.; Zhou, Z.; Zhang, X.; Tan, C.; Liang, R. Layered double hydroxide-based nanomaterials for biomedical applications. Chem. Soc. Rev. 2022, 51, 6126–6176. [Google Scholar] [CrossRef]
- Janczarek, M.; Klapiszewski, L.; Jedrzejczak, P.; Klapiszewska, I.; Slosarczyk, A.; Jesionowski, T. Progress of functionalized TiO2-based nanomaterials in the construction industry: A comprenhensive review. J. Chem. Eng. 2022, 430, 132062. [Google Scholar] [CrossRef]
- Liu, Y.; Zhu, Y. Nanomaterials for Soft Wearable Electronics, Department of Mechanical and Aerospace Engineering; North Carolina State University; Elseiver Inc.: Raleigh, NC, USA, 2022. [Google Scholar]
- Pirzada, M.; Altintas, Z. Nanomaterials for virus sensing and tracking. Chem. Soc. Rev. 2022, 51, 5805–5841. [Google Scholar] [CrossRef]
- Kole, C.; Kumar, D.S.; Khodakovskaya, M.V. Plant Nanotechnology, 1st ed.; Springer International Publishing: Cham, Switzerland, 2016. [Google Scholar] [CrossRef]
- Muhammad, S.S.; Faezrul, Z.A.H.; Farhana, A.; Mukhlis, A.R.; Mohamed, A.M.A.; Dayang, N.A.C. Carbon-based material derived from biomass waste for wastewater treatment. Environ. Adv. 2022, 9, 100259. [Google Scholar]
- Tariq, M.; Hussain, T.; Mujahid, A.; Ahmad, M.N.; Din, M.I.; Intisar, A.; Zahid, M. Applications of Carbon Based Materials in Developing Advanced Energy Storage Devices. In Carbon Nanotubes; Ghosh, K.M., Datta, K., Rushi, A.D., Eds.; IntechOpen: London, UK, 2021. [Google Scholar] [CrossRef]
- Maiti, D.; Tong, X.; Mou, X.; Yang, K. Carbon-Based Nanomaterials for Biomedical Applications: A Recent Study. Front. Pharmacol. 2019, 9, 1401. [Google Scholar] [CrossRef] [PubMed]
- Rajakumar, G.; Zhang, X.H.; Gomathi, T.; Wang, S.-F.; Azam, A.M.; Mydhili, G.; Nirmala, G.; Alzohairy, M.A.; Chung, I.M. Current Use of Carbon-Based Materials for Biomedical Applications. Processes 2020, 8, 355. [Google Scholar] [CrossRef]
- Vaniyamparambath, V.D.S.; Anjanapura, V.R. Single walled carbon nanotubes in high concentrations is cytotoxic to the human neuronal cell LN18. Results Chem. 2022, 4, 100484. [Google Scholar] [CrossRef]
- González-Durruthy, M.; Concu, R.; Ruso, J.M.; Cordeiro, M.N.D.S. New Mechanistic Insights on Carbon Nanotubes’ Nanotoxicity Using Isolated Submitochondrial Particles, Molecular Docking, and Nano-QSTR Approaches. Biology 2021, 10, 171. [Google Scholar] [CrossRef]
- Laurent, G.; Kristina, B.K.; Carole, S.; Trine, B.; Laëtitia, C.; Nicklas, R.J.; Sarah, V.; Håkan, W.; Sébastien, B.; Henrik, W.; et al. Pulmonary toxicity of two different multi-walled carbon nanotubes in rat: Comparison between intratracheal instillation and inhalation exposure. Toxicol. Appl. Pharmacol. 2019, 375, 17–31. [Google Scholar] [CrossRef]
- Devasena, T.; Francis, A.P.; Ramaprabhu, S. Toxicity of Graphene: An Update. Rev. Environ. Contam. Toxicol. 2021, 259, 51–76. [Google Scholar] [CrossRef]
- Rive, C.; Reina, G.; Wagle, P.; Treossi, E.; Palermo, V.; Bianco, A.; Delogu, L.G.; Rieckher, M.; Schumacher, B. Improved biocompatibility of amino-functionalized graphene oxide in Caenorhabditis elegans. Small 2019, 15, 1902699. [Google Scholar] [CrossRef]
- Gakidou, E.; Afshin, A.; Abajobir, A.A.; Abate, K.H.; Abbafati, C.; Abbas, K.M.; Abd-Allah, F.; Abdulle, A.M.; Abera, S.F.; Aboyans, V.; et al. Global, regional, and national comparative risk assessment of 84 behavioural, environmental and occupational, and metabolic risks or clusters of risks, 1990–2016: A systematic analysis for the Global Burden of Disease Study 2016. Lancet 2017, 390, 1345–1422. [Google Scholar] [CrossRef] [PubMed]
- Sotiriou, A.G.; Díaz, E.; Long, M.S.; Godleski, J.; Brain, J.; Pratsinis, S.E.; Demokritou, P. A novel platform for pulmonary and cardiovascular toxicological characterization of inhaled engineered nanomaterials. Nanotoxicology 2012, 6, 680–690. [Google Scholar] [CrossRef] [PubMed]
- Lee, H.; Kim, S.; Hwang, K.S.; Lim, N.R.; Oh, H.B.; Cho, I.J.; Kim, J.; Kim, K.H.; Kim, H.N. Effect of carbon nanomaterial dimension on the functional activity and degeneration of neurons. Biomaterials 2021, 279, 121232. [Google Scholar] [CrossRef] [PubMed]
- Peng, Z.; Liu, X.; Zhang, W.; Zeng, Z.; Liu, Z.; Zhang, C.; Liu, Y.; Shao, B.; Liang, Q.; Wangwang, T.; et al. Advances in the application; toxicity and degradation of carbon nanomaterials in environment: A review. Environ. Int. 2020, 134, 105298. [Google Scholar] [CrossRef]
- Yi, H.; Huang, D.; Qin, L.; Zeng, G.; Lai, C.; Chen, M.; Ye, S.; Song, B.; Ren, X.; Guo, X. Selective prepared carbon nanomaterials for advanced photocatalytic application in environmental pollutant treatment and hydrogen production. Appl. Catal. B Environ. 2018, 239, 408–424. [Google Scholar] [CrossRef]
- Negri, V.; Pacheco-Torres, J.; Calle, D.; López-Larrubia, P. Carbon Nanotubes in Biomedicine; Nanobiomaterials for Electrochemical and Biomedicine Applications. Top. Curr. Chem. 2020, 378, 177–217. [Google Scholar] [CrossRef]
- Williams, P.T. Hydrogen and Carbon Nanotubes from Pyrolysis-Catalysis of Waste Plastics: A Review. Waste Biomass Valor. 2021, 12, 1–28. [Google Scholar] [CrossRef]
- Boccuni, F.; Ferrante, R.; Tombolini, F.; Natale, C.; Gordani, A.; Sabella, S.; Iavicoli, S. Occupational exposure to graphene and silica nanoparticles, Part I: Workplace measurements and sampling. Nanotoxicology 2020, 14, 1280–1300. [Google Scholar] [CrossRef] [PubMed]
- Ribalta, C.; López-Lilao, A.; Estupiñá, S.; Fonseca, A.S.; Tobías, A.; García-Cobos, A.; Minguillón, M.C.; Monfort, E.; Viana, M. Health risk assessment from exposure to particles duringpacking in working environments. Sci. Total Environ. 2019, 671, 474–487. [Google Scholar] [CrossRef]
- Sousa, M.; Arezes, P.; Silva, F. Occupational Exposure to Ultrafine Particles in Metal Additive Manufacturing: A Qualitative and Quantitative Risk Assessment. Int. J. Environ. Res. Public. 2021, 18, 9788. [Google Scholar] [CrossRef] [PubMed]
- Salmatonidis, A.; Ribalta, C.; Sanfélix, V.; Bezantakos, S.; Biskos, G.; Vulpoi, A.; Simion, S.; Monfort, E.; Viana, M. Workplace Exposure to Nanoparticles during Thermal Spraying of Ceramic Coatings. Ann. Work Expo. Health 2019, 6, 91–106. [Google Scholar] [CrossRef] [PubMed]
- Methner, M.; Hodson, L.; Geraci, C. Nanoparticle emission assessment technique (NEAT) for the identification and measurement of potential inhalation exposure to engineered nanomaterials--part A. J. Occup. Environ. Hyg. 2010, 7, 127–132. [Google Scholar] [CrossRef] [PubMed]
- Strategies, Techniques and Sampling Protocols for Determining the Concentration of Manufaturaed Nanomaterias in Air at the Workplace, No. 82, ENV/JM/MONO (2017)30. Available online: https://one.oecd.org/document/ENV/JM/MONO(2017)30/en/pdf (accessed on 8 December 2022).
- Lepistö, T.; Kuuluvainen, H.; Juuti, P.; Järvinen, A.; Arffman, A.; Rönkkö, T. Measurement of the human respiratory tract deposited surface area of particles with an electrical low pressure impactor. Aerosol. Sci. Technol. 2020, 54, 958–971. [Google Scholar] [CrossRef]
- Asbach, C.H.C.; Kuhlbusch, T.A.J.; Kaminski, H.; Stahlmecke, B.; Plitzko, S.; Götz, U.; Voetz, M.; Kiesling, H.J.; Dahmann, D. Standard Operation Procedures for Assessing Exposure to Nanomaterials, Following a Tiered Approach, nanoGEM. Federal Ministry of Education and Reseach. 2012. Available online: https://www.nanopartikel.info/data/methodik/SOPs_aus_Projekten/nanoGEM-SOP_tiered-approach-exposure-assessment-workplace_2012.pdf (accessed on 30 November 2022).
- Kaminski, H.; Beyer, M.; Fissan, H.; Asbach, C.; Kuhlbusch, T.A.J. Measurements of nanosale TiO2 and Al2O3 in industrial workplace environments; Methodology and results. Aerosol. Air. Qual. Res. 2015, 15, 129–141. [Google Scholar] [CrossRef]
- Grand View Research. Graphene Market Size, Share and Trends Analysis Report by Product (Graphene Oxide, Graphene Nanoplatelets), By Application (Electronics, Composites, Energy), By Region, And Segment Forecasts, 2023–2030. Market Report. Report Code: CH 3833. Available online: https://www.grandviewresearch.com/industry-analysis/graphene-industry (accessed on 30 March 2023).
- Mordor Intelligence. Europe Nanofiber Market Size and Share Analysis-Growth Trends and Forecasts (2023–2028). Available online: https://www.mordorintelligence.com (accessed on 30 March 2023).


Disclaimer/Publisher’s Note: The statements, opinions and data contained in all publications are solely those of the individual author(s) and contributor(s) and not of MDPI and/or the editor(s). MDPI and/or the editor(s) disclaim responsibility for any injury to people or property resulting from any ideas, methods, instructions or products referred to in the content. |
© 2023 by the authors. Licensee MDPI, Basel, Switzerland. This article is an open access article distributed under the terms and conditions of the Creative Commons Attribution (CC BY) license (https://creativecommons.org/licenses/by/4.0/).