Article

Internet of Things Assisted Solid Biofuel Classification Using Sailfish Optimizer Hybrid Deep Learning Model for Smart Cities

1
Information Technology Department, Faculty of Computing and Information Technology, King Abdulaziz University, Jeddah 21589, Saudi Arabia
2
Department of Mathematics, Faculty of Science, Al-Azhar University, Naser City 11884, Egypt
3
Information Systems Department, Faculty of Computing and Information Technology, King Abdulaziz University, Jeddah 21589, Saudi Arabia
4
Faculty of Earth Sciences, King Abdulaziz University, Jeddah 21589, Saudi Arabia
5
Geology Department, Faculty of Science, Al-Azhar University, Naser City 11884, Egypt
6
Center of Research Excellence in Artificial Intelligence and Data Science, King Abdulaziz University, Jeddah 21589, Saudi Arabia
*
Author to whom correspondence should be addressed.
Sustainability 2023, 15(16), 12523; https://doi.org/10.3390/su151612523
Submission received: 9 July 2023 / Revised: 11 August 2023 / Accepted: 15 August 2023 / Published: 17 August 2023

Abstract

:
Solid biofuels and Internet of Things (IoT) technologies play a vital role in the development of smart cities. Solid biofuels are a renewable and sustainable source of energy obtained from organic materials, such as wood, agricultural residues, and waste. The integration of IoT technology with solid biofuel classification can improve the performance, quality control, and overall management of biofuel production and usage. Recently, machine learning (ML) and deep learning (DL) models can be applied for the solid biofuel classification process. Therefore, this article develops a novel solid biofuel classification using sailfish optimizer hybrid deep learning (SBFC-SFOHDL) model in the IoT platform. The proposed SBFC-SFOHDL methodology focuses on the identification and classification of solid biofuels from agricultural residues in the IoT platform. To achieve this, the SBFC-SFOHDL method performs IoT-based data collection and data preprocessing to transom the input data into a compatible format. Moreover, the SBFC-SFOHDL technique employs the multihead self attention-based convolutional bidirectional long short-term memory model (MSA-CBLSTM) for solid biofuel classification. For improving the classification performance of the MSA-CBLSTM model, the SFO algorithm is utilized as a hyperparameter optimizer. The simulation results of the SBFC-SFOHDL technique are tested and the results are examined under different measures. An extensive comparison study reported the betterment of the SBFC-SFOHDL technique compared to recent DL models.

1. Introduction

Forestry and agricultural practices yield enormous quantities of waste derived from farm yields [1]. The yearly production of biomass waste worldwide offers management issues, as discarded biomass could have adverse environmental effects [2]. Agricultural biomass residues or wastes are mainly fruit peels, crop stalks, roots, leaves, nutshells or seeds that are generally burned or discarded, but they are a potential supply of feedstock material [3]. Important information for energy applications is the type of fuel to be used because of the necessity of different chemical processes that are needed for the proper processing of the material and to gain optimal results [4].
Additionally, one of the preferred choices for generating power from the fuel is combustion or incineration [5]. However, there are several technological options for minimizing the total emission of gases and waste into the atmosphere while producing power from existing fuels [6]. Moreover, the potential technique is selected based on the input fuel type [7], considering the effect of the energy conversion procedure on air pollution as well as effects on soil and water. For instance, manufactured biomass generally contains high amounts of heavy metals (Ni, Cu, Zn and Cr), while coal-type fuels have more sulphur in them [8]. However, the recovered fuels are heterogeneous mixtures produced from various kinds of solid fuels to attain high availability. Therefore, a particular classification was required for the study of the thermal conversion of solid fuels and it is vital to plan to preprocess and enhance the generation of power [8]. It is essential to consider the effect of energy conversion on air pollution and its impacts on soil and water as well [9]. A practical method to categorize the type of fuel is to consider an expert opinion, but it might be misleading because of human error [10]. Machine learning (ML) is a technique that allows software applications to accurately predict the outcome without being explicitly programmed [11]. ML is an accumulation of methods, producing different inferences from prevailing data through mathematical and statistical approaches [12]. ML has been comprehensively used in domains such as forensics, image processing, prediction, cybersecurity, etc. [13]. There is various research concerning biomass gasification by implementing ML to constitute a regression method [14]. However, these studies do not illustrate the overall outcomes of various ML methods for biomass gasification [15].
This article develops a novel solid biofuel classification using a sailfish optimizer hybrid deep learning (SBFC-SFOHDL) model on the IoT environment. The proposed SBFC-SFOHDL technique performs IoT-based data collection and data preprocessing to transform the input data into a compatible format. Furthermore, the SBFC-SFOHDL technique employs the multihead self attention-based convolutional bidirectional long short-term memory model (MSA-CBLSTM) for solid biofuel classification. For improving the classification accuracy of the MSA-CBLSTM algorithm, the SFO algorithm is utilized as a hyperparameter optimizer. The simulation results of the SBFC-SFOHDL technique are tested and the outcomes are examined under distinct measures.
The rest of the paper is organized as follows. Section 2 provides the related works and Section 3 offers the proposed model. Then, Section 4 gives the result analysis and Section 5 concludes the paper.

2. Related Works

Al-Wesabi et al. [16] present a new approach named IEVB-SFC (intelligent ensemble of voting-based solid fuel classification technique) for harvesting energy from agronomic residue. First, the data preprocessing takes place in three ways similar to data normalization, data transformation and class labeling. As well, the presented approach has three different DL methods: convolutional neural network-based LSTM (CNN-LSTM), GRU and LSTM. At last, an ensemble of three DL methods was carried out through the voting method and determined the suitable solid fuel class labels. In [17], two types of digestate have been observed as effective feedstock to prepare hydrochar implemented as a solid biofuel and porous material. First digestate samples are a clean digestate from common biogas plants, executing the anaerobic digestion of common agronomic residues such as cow dung.
Zheng et al. [18] aim to resolve the low efficiency while extracting novel energy from agricultural waste (AW). The consumption and development of AW were deeply elaborated upon by merging the recent technological progression. To choose the product team organization pattern, the adaptive decision approach of the product team organization pattern was intensely learned for the successful implementation of novel energy mining schemes, and the FNN approach was applied as a decision technique. Bot et al. [19] aimed to examine the economic viability and power utilization of biomass briquettes generation from agricultural waste. This study concentrated on the briquetting conversion of banana peels, coconut shells, sugarcane bagasse and rattan waste depending on small-scale plant production in Cameroon. Bosona et al. [20] aimed to develop and define a traceability system (TS) to ensure the quality of pruning biomass for the generation of solid biofuel and to offer assurance to users that the biomass was in better condition. It was devised for an agricultural pruning supply chain where transporters, agronomists, end users and biomass traders are major actors.
Jifara et al. [21] intended to use a combination of khat stem and corn cob using an integration of co-pelletization and torrefaction processes. To inspect the optimization of co-pelletization parameters, the response surface approach was utilized. A particle size and Torrefied biomass blending ratio were selected as independent factors. The dependent variable was durability, heating value and bulk density of torrefied mixed pellets. Samadi et al. [22] created a study with the purpose of framing a stoichiometric equilibrium technique for predicting the energy production of gasification. This method was authenticated with an experimental dataset for determining the syngas composition. For determining optimum performance characteristics, the impacts of a parameter of operating conditions on the performance of gasification were assessed later. Further, the developed method was utilized for predicting the amount of heat and power gained from various farming residues by gasification.
In [23], numerical simulations were carried out employing computational fluid dynamics (CFD) for evaluating the fluid dynamic strategy and the combustion model of biomass particles under a horizontal cyclonic combustion chamber. Michal et al. [24] examined a conceptual scheme of WSN intended to estimate the SmartCity air quality in realtime. The sensor devices would autonomously monitor the flue gas temperature, CO and particulate matter concentrations. Koval et al. [25] estimated if residential heating affects the quality of air by modeling three provided conditions of a solid fuel boiler altered at chosen places and compared the outcomes with measured data. Akarsu et al. [26] aimed to comparatively estimate the outcome of a hydrothermal carbonization (HTC) condition on the produce and fuel properties of hydrochar attained in food waste (FW) and its digestate (FD).
Though several models are available in the literature, it still remains a challenging problem. Due to incessant deepening of the model, the number of parameters of DL models also rapidly increased and led to model overfitting. At the same time, different hyperparameters have a significant impact on the efficiency of the CNN model, particularly the learning rate. The learning rate parameter also needs to be modified to obtain better performance. Therefore, in this study, we employ an SFO technique for the hyperparameter tuning of the MSA-CBLSTM model.

3. The Proposed Model

In this study, we concentrated on the improvement of the SBFC-SFOHDL model in the IoT platform. The main purpose of the proposed SBFC-SFOHDL methodology lies in the proficient detection and classification of solid biofuels from agricultural residues in the IoT platform. To achieve this, the SBFC-SFOHDL system includes IoT-based data collection, data preprocessing, MSA-CBLSTM-based solid fuel classification and SFO-based hyperparameter tuning. Primarily, the input data are preprocessed to transform the input data into a compatible format. Next, the classification process take place using the MSA-CBLSTM model, which categorizes the solid biofuels into different classes. Finally, the SFO algorithm is executed to adjust the hyperparameter values of the DL model. Figure 1 demonstrates the workflow of the SBFC-SFOHDL algorithm.

3.1. Data Preprocessing

In the initial stage, the actual data is preprocessed in three various approaches such as data normalization, data transformation and class labeling. Primarily, the data in categorical values can be suitably transformed as mathematical values. Secondarily, the class labeling procedure can be carried out but the data samples can be assigned to suitable class labels. Eventually, the experimental value can be changed as a standard method by discarding and scaling the mean to unit variance.

3.2. Solid Biofuel Classification

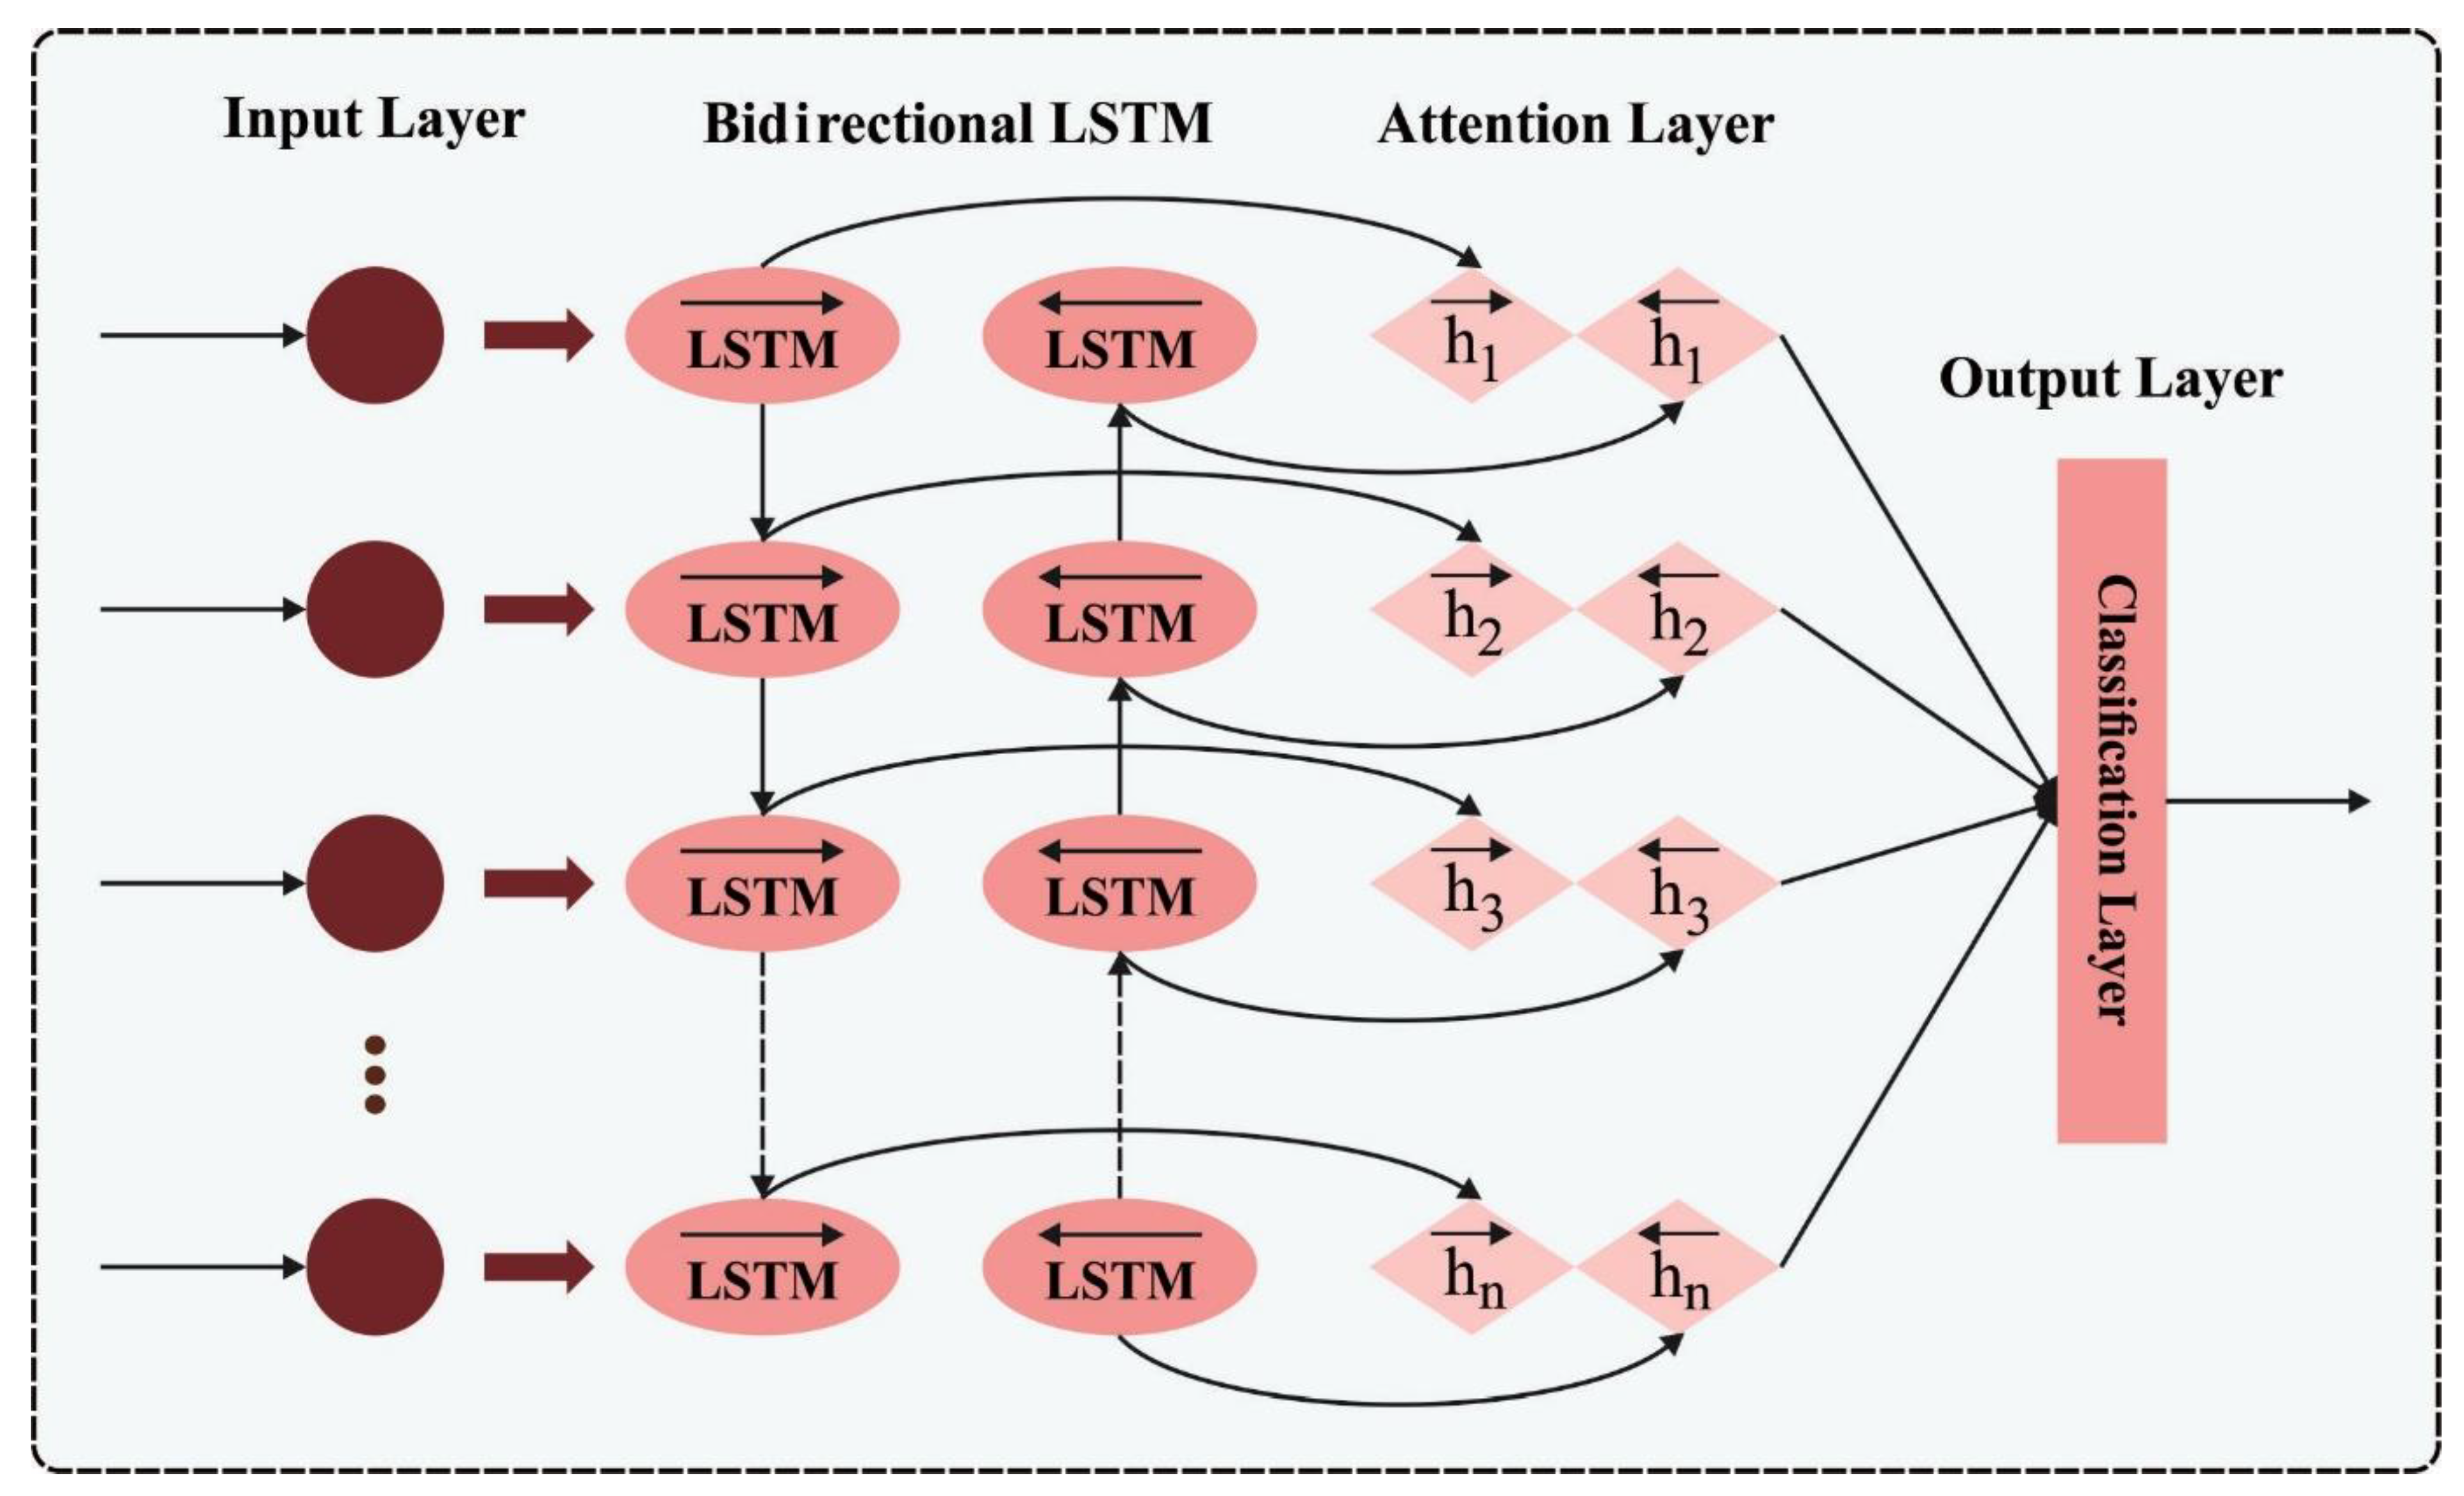
To classify solid biofuels in the IoT environment, the MSA-CBLSTM technique can be used. In this study, the training module considered is a bidirectional LSTM (Bi-LSTM) with a multi-head self-attentive model in conjunction with one-layer CNN architecture, represented as an MSA-CBLSTM model [27]. LSTM takes place in the consecutive signal analysis via sharing weight, and then the weight between the output and hidden layers is recycled. It is a chain model to process time sequences and it could efficiently compensate for the disappearing gradient problems. The bidirectional EEG signal extraction model extracts dynamic data from the prior and latter segments in comparison to the unidirectional EEG signal extraction model. An LSTM contains three gating control mechanisms of input and the forget gates and the computation formula are shown as follows:
f t = σ W f h t 1 , x t + b f ) ,
i t = σ W i h t 1 , x t + b i ) ,
C ~ = t a n h W C h t 1 , x t + b C ) ,  
C t = f t × C t 1 + i t × C ~ t  
O t = σ W O h t 1 x t + b O ) ,
h t = t a n h C t × O t ,
From the expression, O t signifies the output gate, W represents the weight matrix, x t refers to the time series at t time, C t denotes the cell state, h t represents the hidden layer, σ shows the sigmoid function, C ~ t indicates the temporary cell state, i t indicates the memory gate, b signifies the bias vector of respective weight and f t denotes the forget gate. The memory gate is accountable for updating the cell state of the LSTM, where the input gate controls the output values to the following LSTM cell:
y t = σ W h h t h t + b h ) ,  
The Bi-LSTM adds a backward layer for learning the upcoming data, which is the addition of historical data. The Bi-LSTM perfectly combines the bidirectional characteristics and gating structure such that further details can be processed and remembered by the two LSTM components. The time series data are inputted into the algorithm, then the forward layer interconnects the feature data in the historical sequence with current data, later the backward layer connects the future data, and lastly, the forecast values are outputted using Equation (7).
The Transformer method is an autoregressive generative model that largely exploits sinusoidal location data and a self-attentive mechanism. Each layer involves a dropout, a pre-feedback network, a time-self-noticing and residual network sublayers. Figure 2 represents the architecture of a Bi-LSTM.
The attention mechanism usually allows for a weight factor to be applied to all the elements in the EEG series, and if one component is stored, the attention mechanism is computed as a similarity between Q and K that reflects the significance of the extracted V value, and the weight is summed and weighted to attain the attention value:
A t t e n t i o n   Q , K , V = s o f t m a χ Q K T d k V
The multi-head self-attention module attains various representations of h   ( Q , K , V ) , evaluates the self-attention of every h representation and interconnects the outcomes and is represented as follows:
h e a d i = A t t e n t i o n   Q W i Q ,   K W i K , V W i V ,  
M u l t i H e a d Q , K , V = C o n t a c t h e a d i , , h e a d h W 0 ,  
In Equation (10), W i and W 0 make the parameter matrix. Meanwhile, as Bi-LSTM considers the location data, it is not necessary to set up further position encoding. We apply scaled dot product attention in the process of implementing the self-attention module in Bi-LSTM. The output H D of the last time step is multiplied with t h e   W Q matrix as Query, whereas the output O t of all the time steps is linearly converted as K e y t and Value:
Q u e r y = ω Q H D ,  
V a l u e t = ω V O t
K e y t = ω K O t  
e t = Q u e r y K e y t T d k ,  
a t = e x p ( e t ) Σ t = 0 n e x p ( e t ) ,  
The Query does not change with the time step and ω Q ,   ω K ,   ω V denote the parameter of the NN that is adapted with BP. V a l u e t and weights a t at all the time steps are summed and weighted to attain the emotional feature vector with a self-attentive model:
z Q , K , V = t a t V a l u e t
The abovementioned formula is accomplished h times to attain multi-head self-attention features z 1 ,   , z h , which is merged and linearly converted:
M u l t i H e a d   ( Q , K , V ) = C o n c a t ( z 1 , , z h ) ω z

3.3. Hyperparameter Tuning Using SFO Algorithm

For hyperparameter tuning of the MSA-CBLSTM algorithm, the SFO algorithm is utilized to improve the classifier results. Sailfish are a group of predators that contribute to harassing and catching their beasts [28]. In the group game, the hunter uses different approaches to assault. The sailfish culture can be determined as an alternative attack strategy. It comprises the group leader who targeted and harmed or killed the sardine (prey school) itself, whereas others saved the resource. It changes its location with sailfish that attack the beast farm. Furthermore, the fish are capable of migrating to the sardine location and maximizing the prey chasing. The target group (sardine) changes the location the party member is wounded to avoid the future attack from the sailfish. Thus, the sailfish optimizer technique is applied. As compared to the other optimization techniques, the SFO algorithm includes succeeding features. In recent work, the metaheuristic approach has proficiently managed different optimization problems because of its ability for flexible exploration and diversification, which are the two notable characteristics of the metaheuristic method that could search the whole solution space in all the iterations for better solutions, except for local optimal, intensification or exploitation, and it leads to quick convergence and determines the potential solution. An optimal metaheuristic method attempts to balance exploitation and exploration. The stepwise process of the SFO technique is shown as follows:

3.3.1. Initialization of Population

The sardine and sailfish populations are initialized at random. The arbitrary position for all the sailfishes is w χ q and the arbitrary place is v y q for all the sardines, where χ {Sailfish}, y {Sardines} and q {Iteration value}. The location of all the sailfishes w x q or sardines v y q is a possible choice for q - t h iterations.

3.3.2. Mechanism and Evaluation of Elitism

According to the fitness function (FF), Fnes as the location for all the newest populations is determined by all the quest agents (sardine or sail). As the sardine injured is processed as v i n i q ,   i n j {Sardineset}, for instance, Fnes ( v i n j q )   Fnes ( v y q ) , q , this is the most efficient sardine in the sardine population. Furthermore, as the elite fish w e l i t q ,   e l i t {Sailfish set}, i.e., Fnes ( w e l i t q e )   Fnes ( w x q ) ,   q in impedance conundrum, the better sailfish with lower fitness in the sailfish population is sustained.

3.3.3. Sailfish Position Updating

In the iteration, any sailfish member of a group can change its location. The modification in the place of the sailfish operation can be performed by taking free space on the prey farm or by changing the attack technique. The transition of Sailfish is focused mostly on elite and injured sardine locations demonstrated in Equation (18).
w χ q + 1 = w e l i t q λ q β w e q l i t e + g i n j q 2 w χ q ,
where w χ q + 1 represents the new location of the sailfish at ( q + 1 )th iterations. The location w χ q becomes the sailfish existing location q .   β shows the random integer amongst [0, 1], w e l i t e q signifies the location of the existing elite sailfish and g i n i q signifies the location of the presently injured sardine. λ q denotes the coefficient produced at every q - t h iteration as follows:
λ q = 2 × β × D s t D s t ,  
In Equation (19), β represents the arbitrary integer in the range of zero and one, and D s t shows the scale prey density. It results in the reduction in prey attacking the prey farm; sailfish are injured and eat the sardines. The variable D s t can be determined as follows:
D s t = 1 N M s a i l N M s a r d + N M s a i l ,  
In Equation (20),   N M s a r d indicates the number of sardines and N M s a i l shows the number of sailfish. The primary sardine is greater than the sailfish population. It is predicted to be N M s a r d = 3 × N M s a i l . The λ q fluctuation value is an essential component in the model because every fish adjusts its position by raising the λ q fluctuation value.

3.3.4. Sardine Position Update

Initially, at stalking, the capability for sardines and power attacks is appreciated to escape. The defensive skill of sailfish and the capability to escape the sardines diminishes with time. The sailfish harm the sardine without the ability to capture them. The sailfish is mainly responsible for making an effort to modify assault skills, whereas the sardine is responsible for corporeal damage. The growth rate in finding sailfish is increasing. In response to the sailfish attack, sardine action must be considered. All the sardines are used for adjusting their position as follows:
v y q + 1 = z × w e l i t q v y q + P R a t k ,
In Equation (21), v y q + 1 denotes the new sardine location and v y q shows the present sardine location. z indicates the random integer within [0, 1], w e l i t q represents the better location of elite sailfish and p R a t k defines the sailfish attack strength at all the iterations, implemented as:
P a t k = Q × 1 2 × r × ε
In Equation (22), the two factors Q and ε denote a decrease in the existing iteration value of attack power ( P R a t k ) and the number of existing iterations. At first, the success rate is poor since most sardine transition positions prevent the attack. The sardine’s ability to escape though decreases after fishing, thereby increasing the success rate. The quantity of sardines that can be modified reduces over time. At last, hunting is taken into account, once the power attack P R o t k is less than 0.5. Finally, the number of sardines rises in the location based on the assault of power ( P R a t k < 0.5 ) as follows:
α = N M s a r d × P R a t k ,
In Equation (23), P R a t k is less than 0.5, and only the selected number modifies its position. At the same time, each sardine should be modified if the P R a t k is higher than 0.5. Once the sailfish x is hunched, the sardine place is replaced with the sardine y . The succeeding Fnes ( v y q ) < F n e s   ( w χ q ) ,   q is thereby attained as follows:
w χ q = v y q   i f   F n e s   v y q < F n e s   w χ q ,  
In Equation (24), w χ q indicates the position of sailfish x at q - t h iterations and v y q represents the location of the sardine at q t h iterations. While extracting the sardine, the sardine should be isolated in the population. Algorithm 1 demonstrates the pseudocode of the SFO.
Algorithm 1 Pseudocode of SFO algorithm
Begin
The population of sailfish and sardine are arbitrarily initialized
Set parameter ( q = 4 ,   ε = 0.001 )
Evaluate the fitness of sailfish and sardine
Choose the better sailfish and sardine and define them as injured sardine and elite sailfish, correspondingly
While the ending condition is not fulfilled
     For all the sailfishes
          Evaluate λ q using based on Equation (19)
          Upgrade the position of the sailfish based on (18)
     End for
     Evaluate the attack power based on (22)
                     I f   P R a t k < 0.5
              Evaluate α based on (23)
              Choose a set of sardines based on the α value
              Upgrade the position of the selected sardine based on Equation (24)
          Else
        Upgrade the position of the sardine based on Equation (24)
        End if
     Evaluate each sardine fitness
    If the best solution for the sardine population
        Exchange the sailfish alongside the wounded sardine
        Remove the hunted sardine from the population
        Upgrade the better sailfish with sardine
    End if
End while
Return better sailfish obtained so far
The SFO methodology not only develops an FF to achieve optimal accuracy of the classifier, but it also defines a positive integer to signify the enhanced efficiency of solution candidates. The decline in the classification error rate is observed as FF.
f i t n e s s x i = n u m b e r   o f   m i s c l a s s i f i e d   s a m p l e s T o t a l   n u m b e r   o f   s a m p l e s 100  

4. Results and Discussion

The performance analysis of the SBFC-SFOHDL method is tested by the datasets [29] including 585 samples with four different classes such as manufactured biomass (MB), coal, wood and agricultural residues (AR).
The confusion matrices of the SBFC-SFOHDL approach on solid fuel classification performance are exemplified in Figure 3. The outcome highlighted that the SBFC-SFOHDL method classifies four class labels accurately. It is noticed that the classification increases with an increase in the number of epochs.
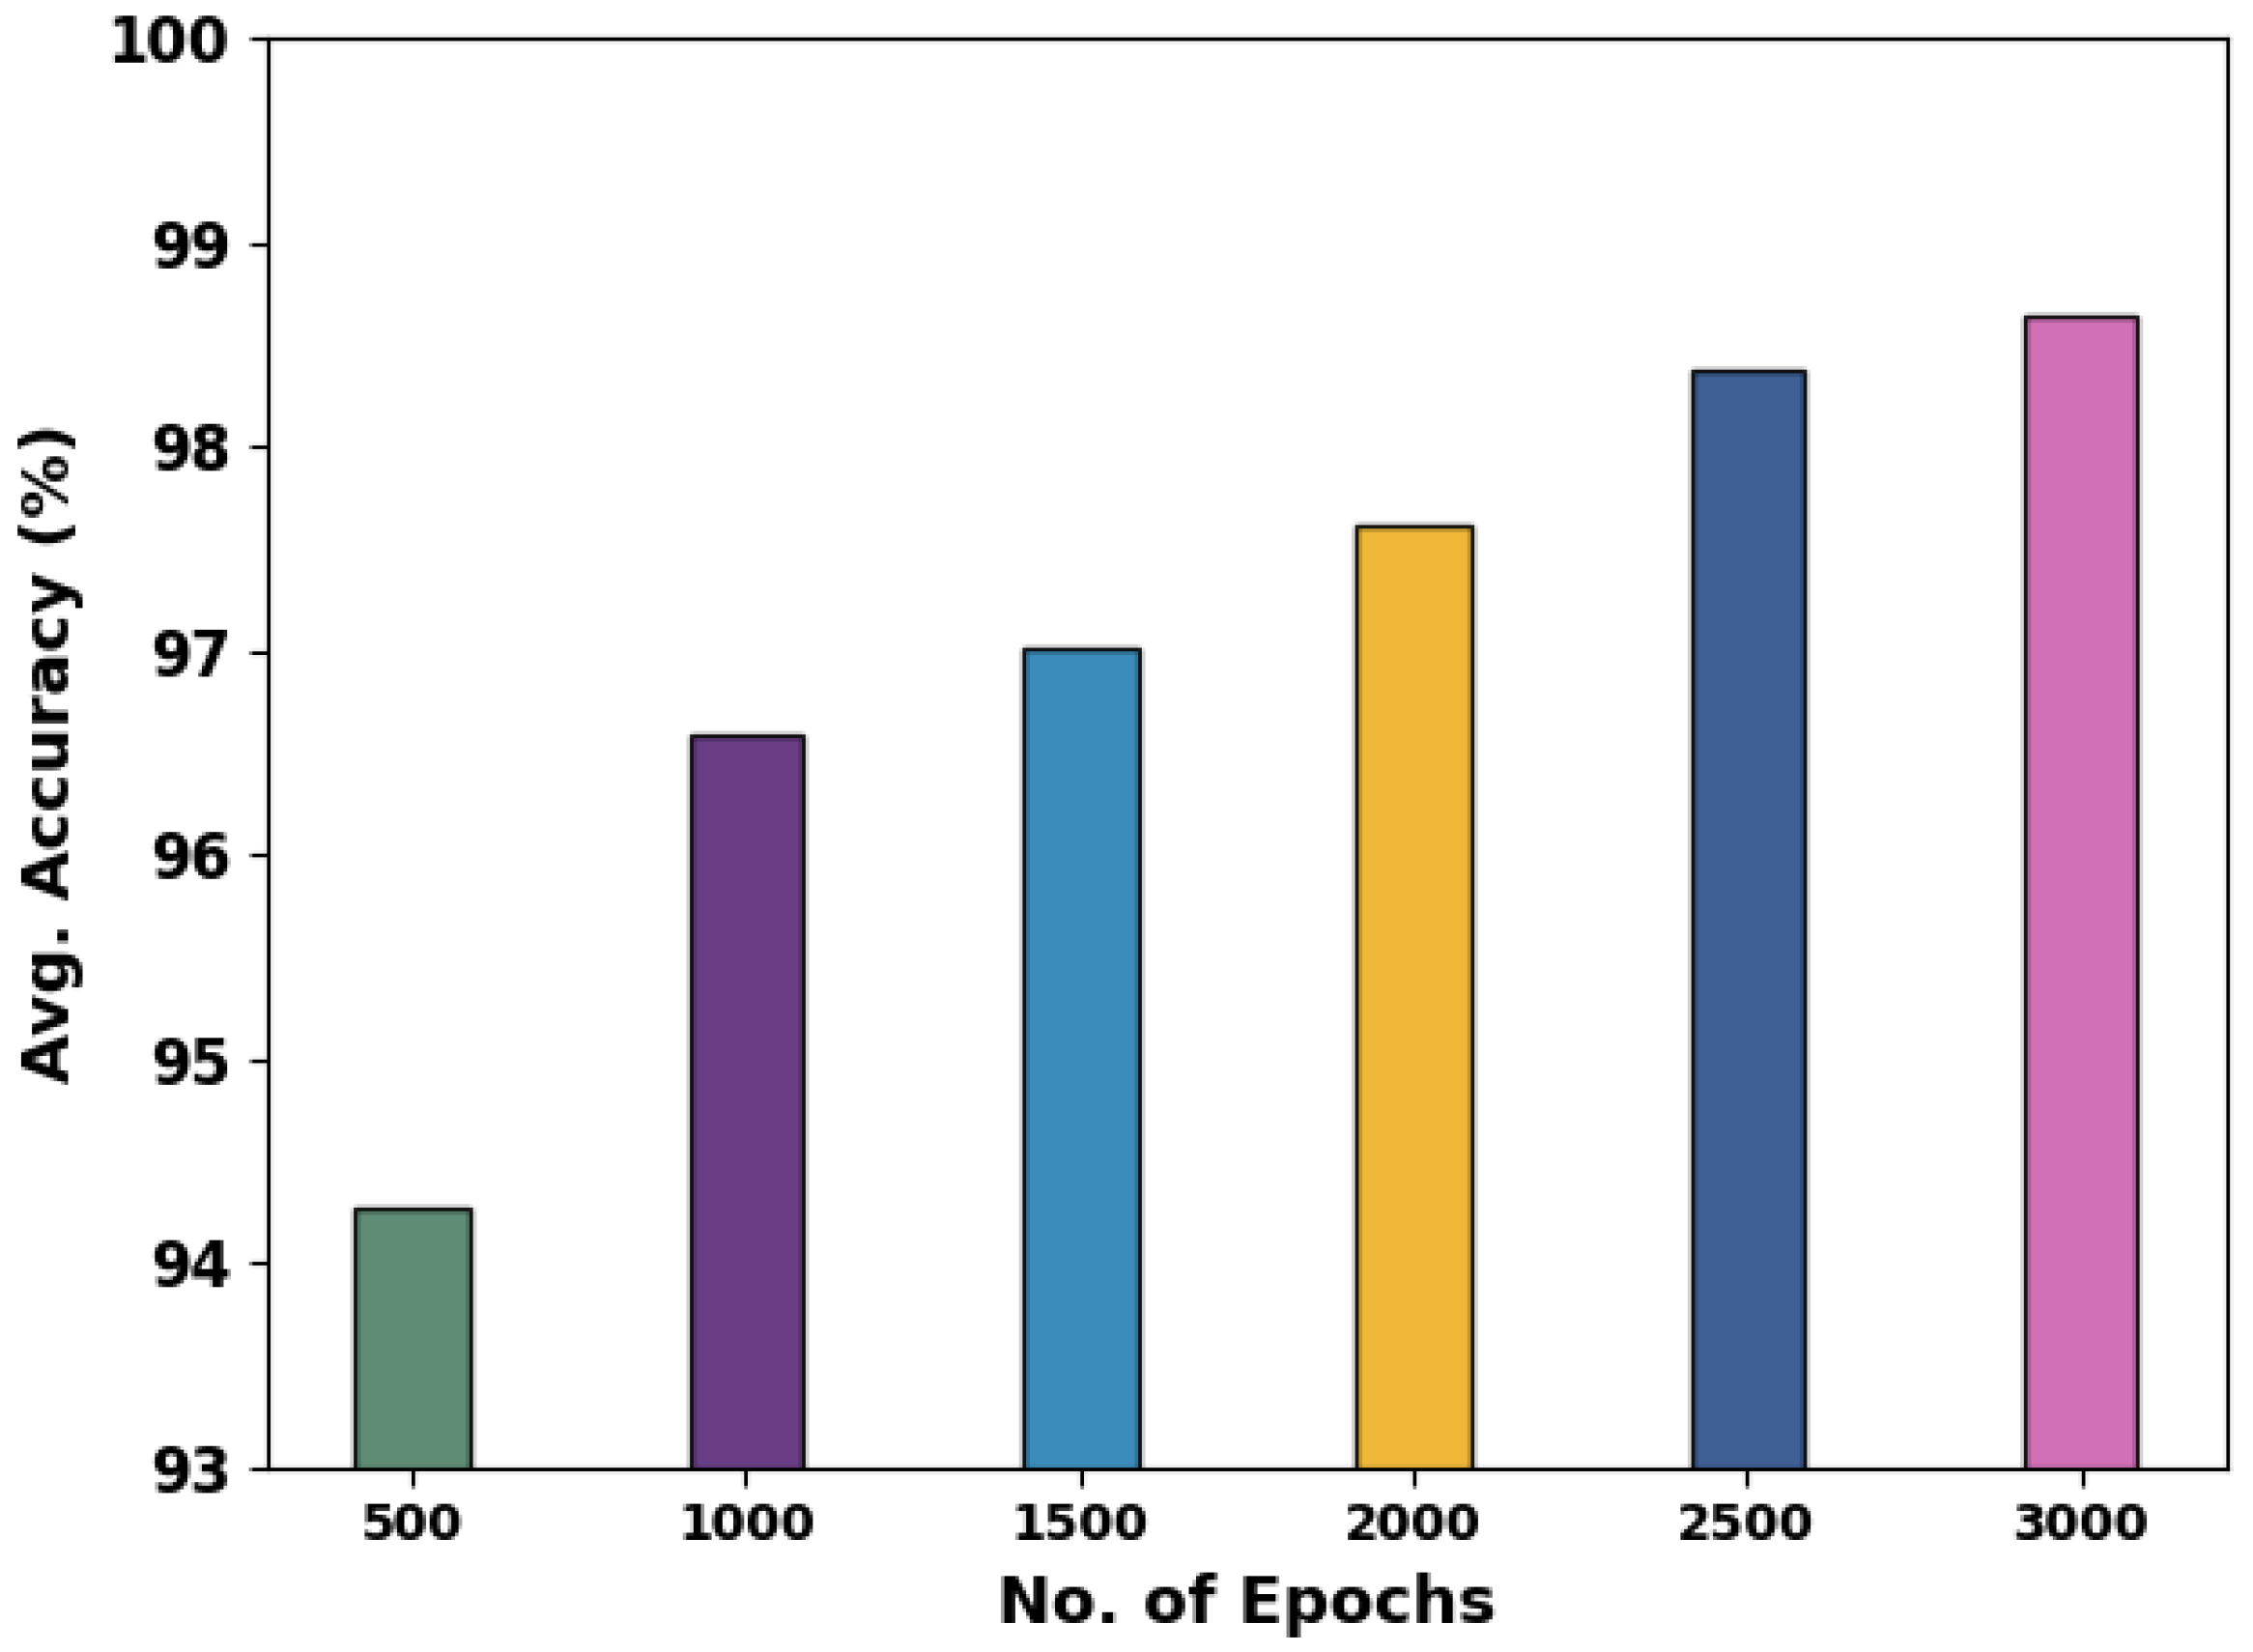
The overall outcomes of the SBFC-SFOHDL algorithm under various epochs are demonstrated in Table 1. Figure 4 signifies the average results of the SBFC-SFOHDL approach with respect to a c c u y . The results indicate that the SBFC-SFOHDL system obtains higher a c c u y values under all epochs. For instance, with 500 epochs, the SBFC-SFOHDL technique attains an average a c c u y of 94.27%. Similarly, with 1500 epochs, the SBFC-SFOHDL technique achieves an average a c c u y of 97.01%. Concurrently, with 3000 epochs, the SBFC-SFOHDL method accomplishes an average a c c u y of 98.63%.
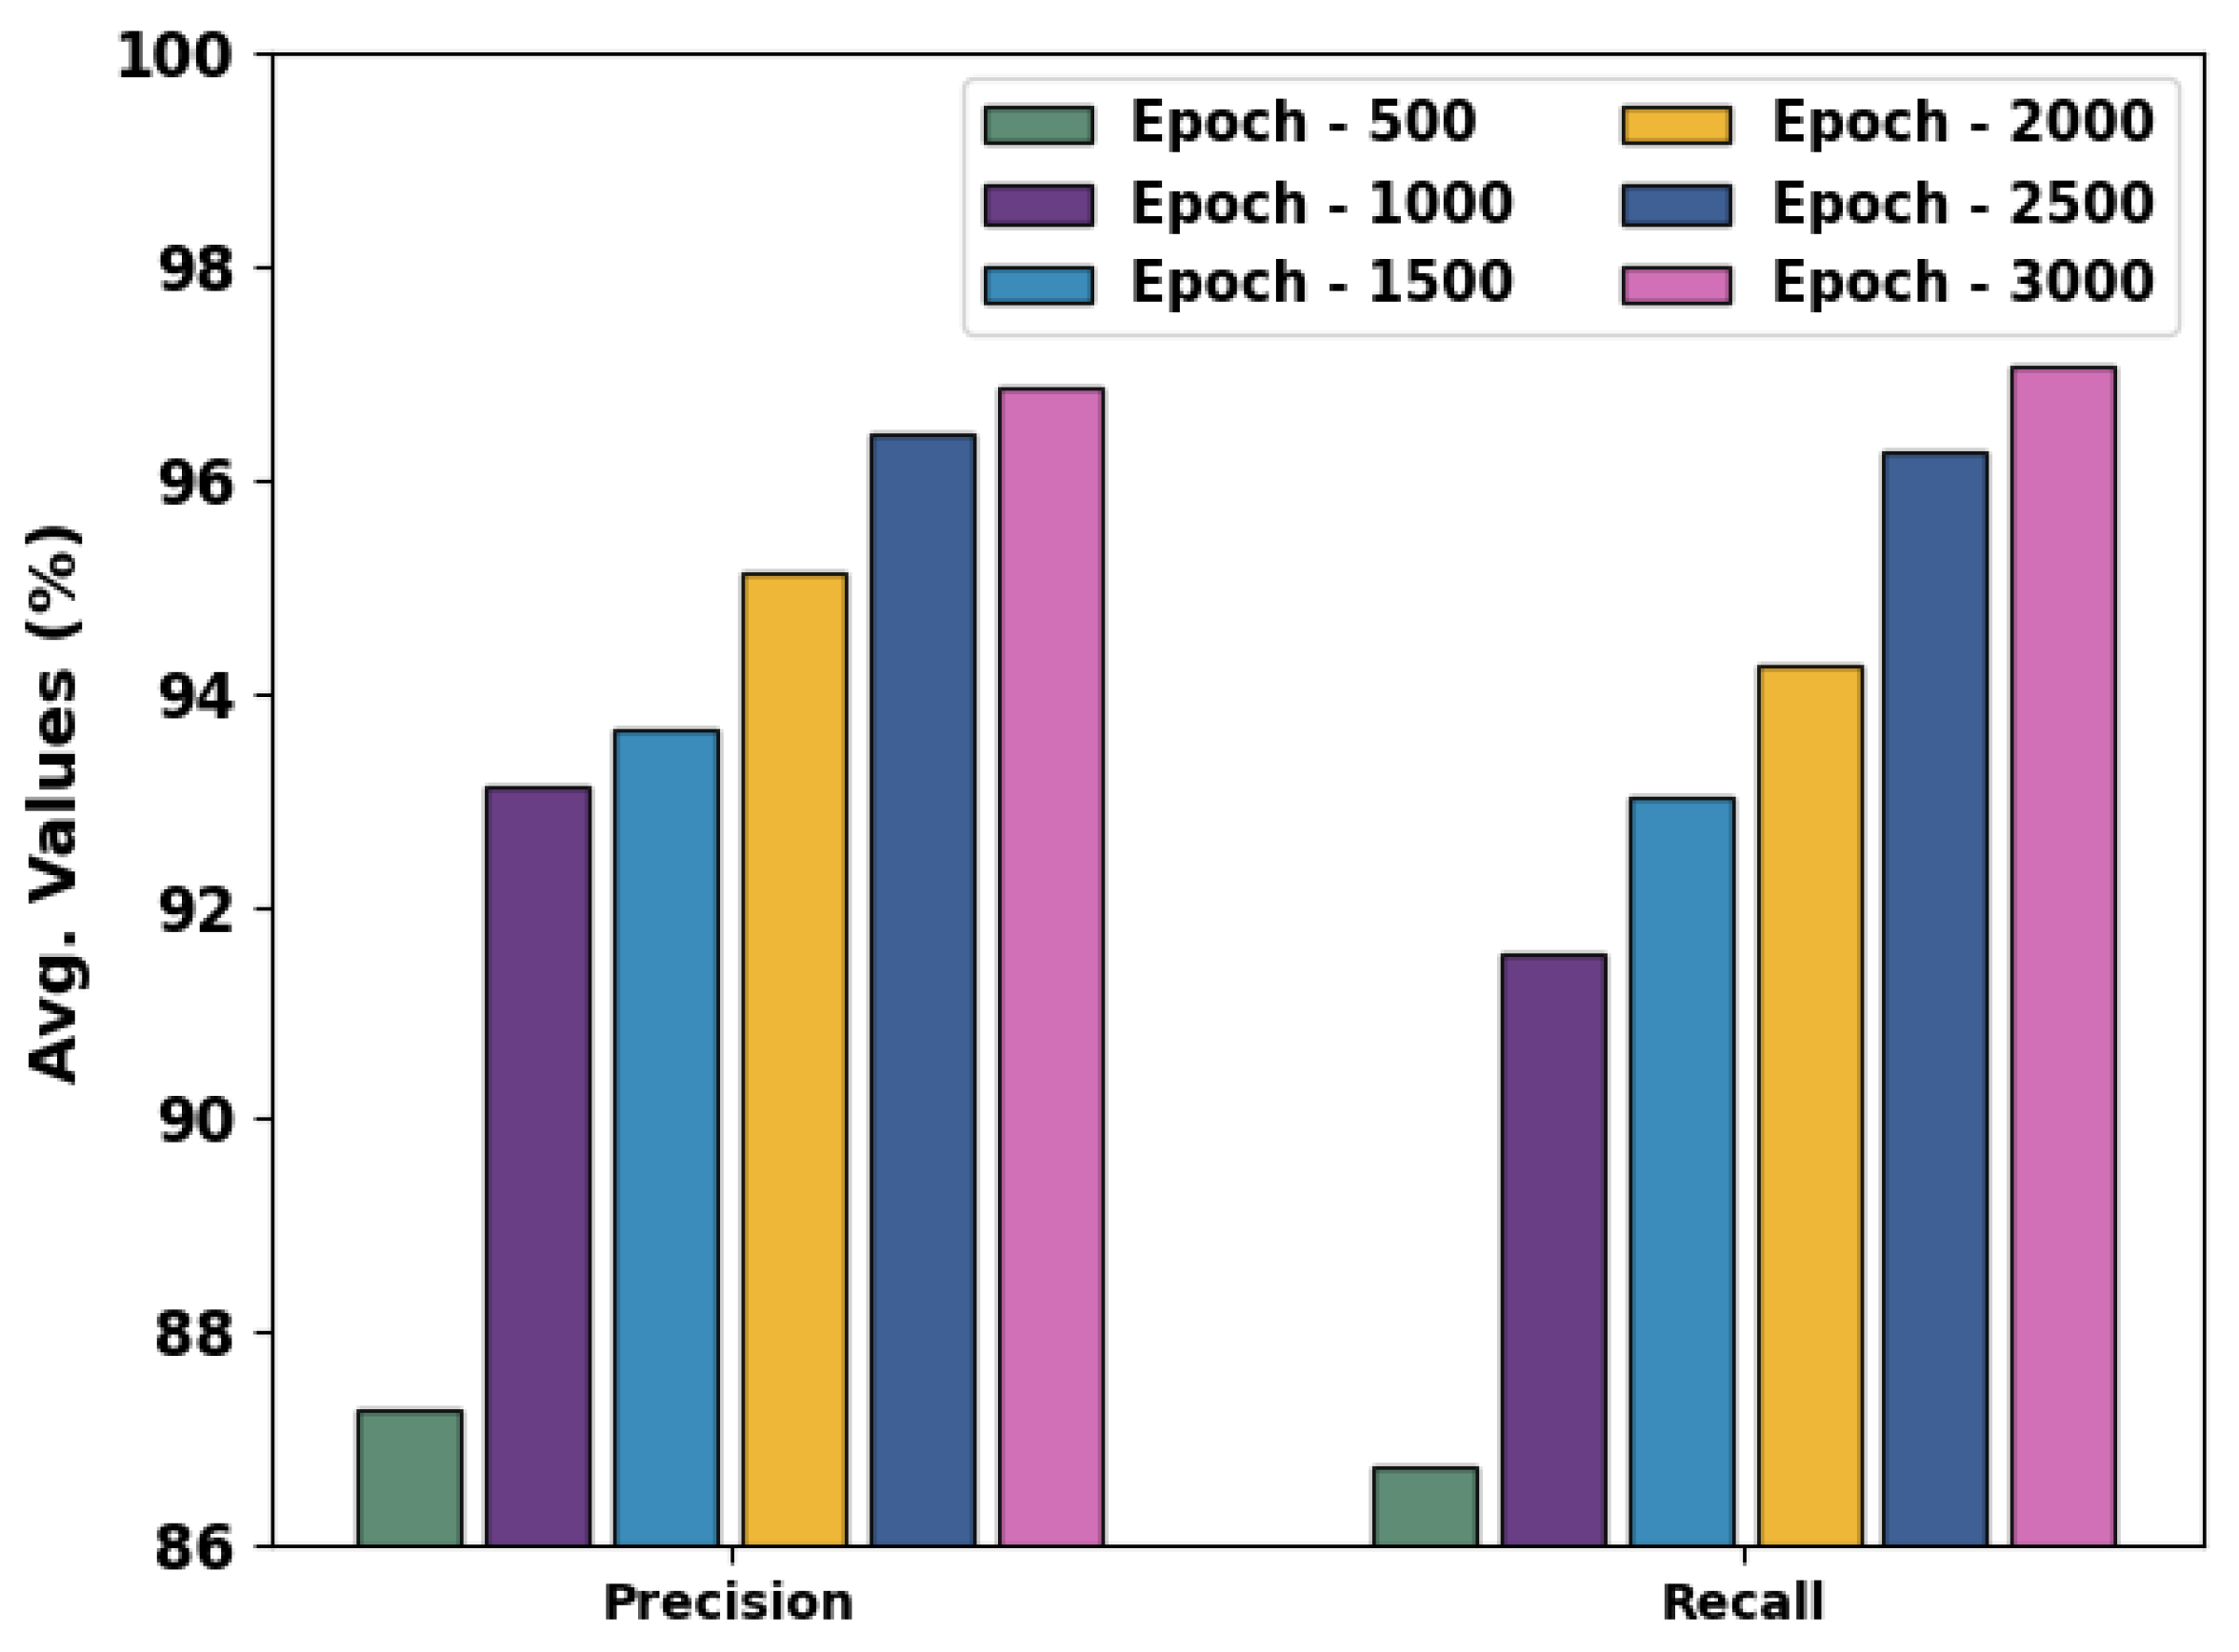
Figure 5 represents the average results of the SBFC-SFOHDL method in terms of p r e c n and r e c a l . The results indicate that the SBFC-SFOHDL method achieves increasing p r e c n and r e c a l values under all epochs. For example, with 500 epochs, the SBFC-SFOHDL technique accomplishes an average p r e c n and r e c a l of 87.29% and 86.75%. Similarly, with 1500 epochs, the SBFC-SFOHDL method attains an average p r e c n and r e c a l of 93.66% and 93.03%. Concurrently, with 3000 epochs, the SBFC-SFOHDL technique attains an average p r e c n and r e c a l of 96.85% and 97.05%.
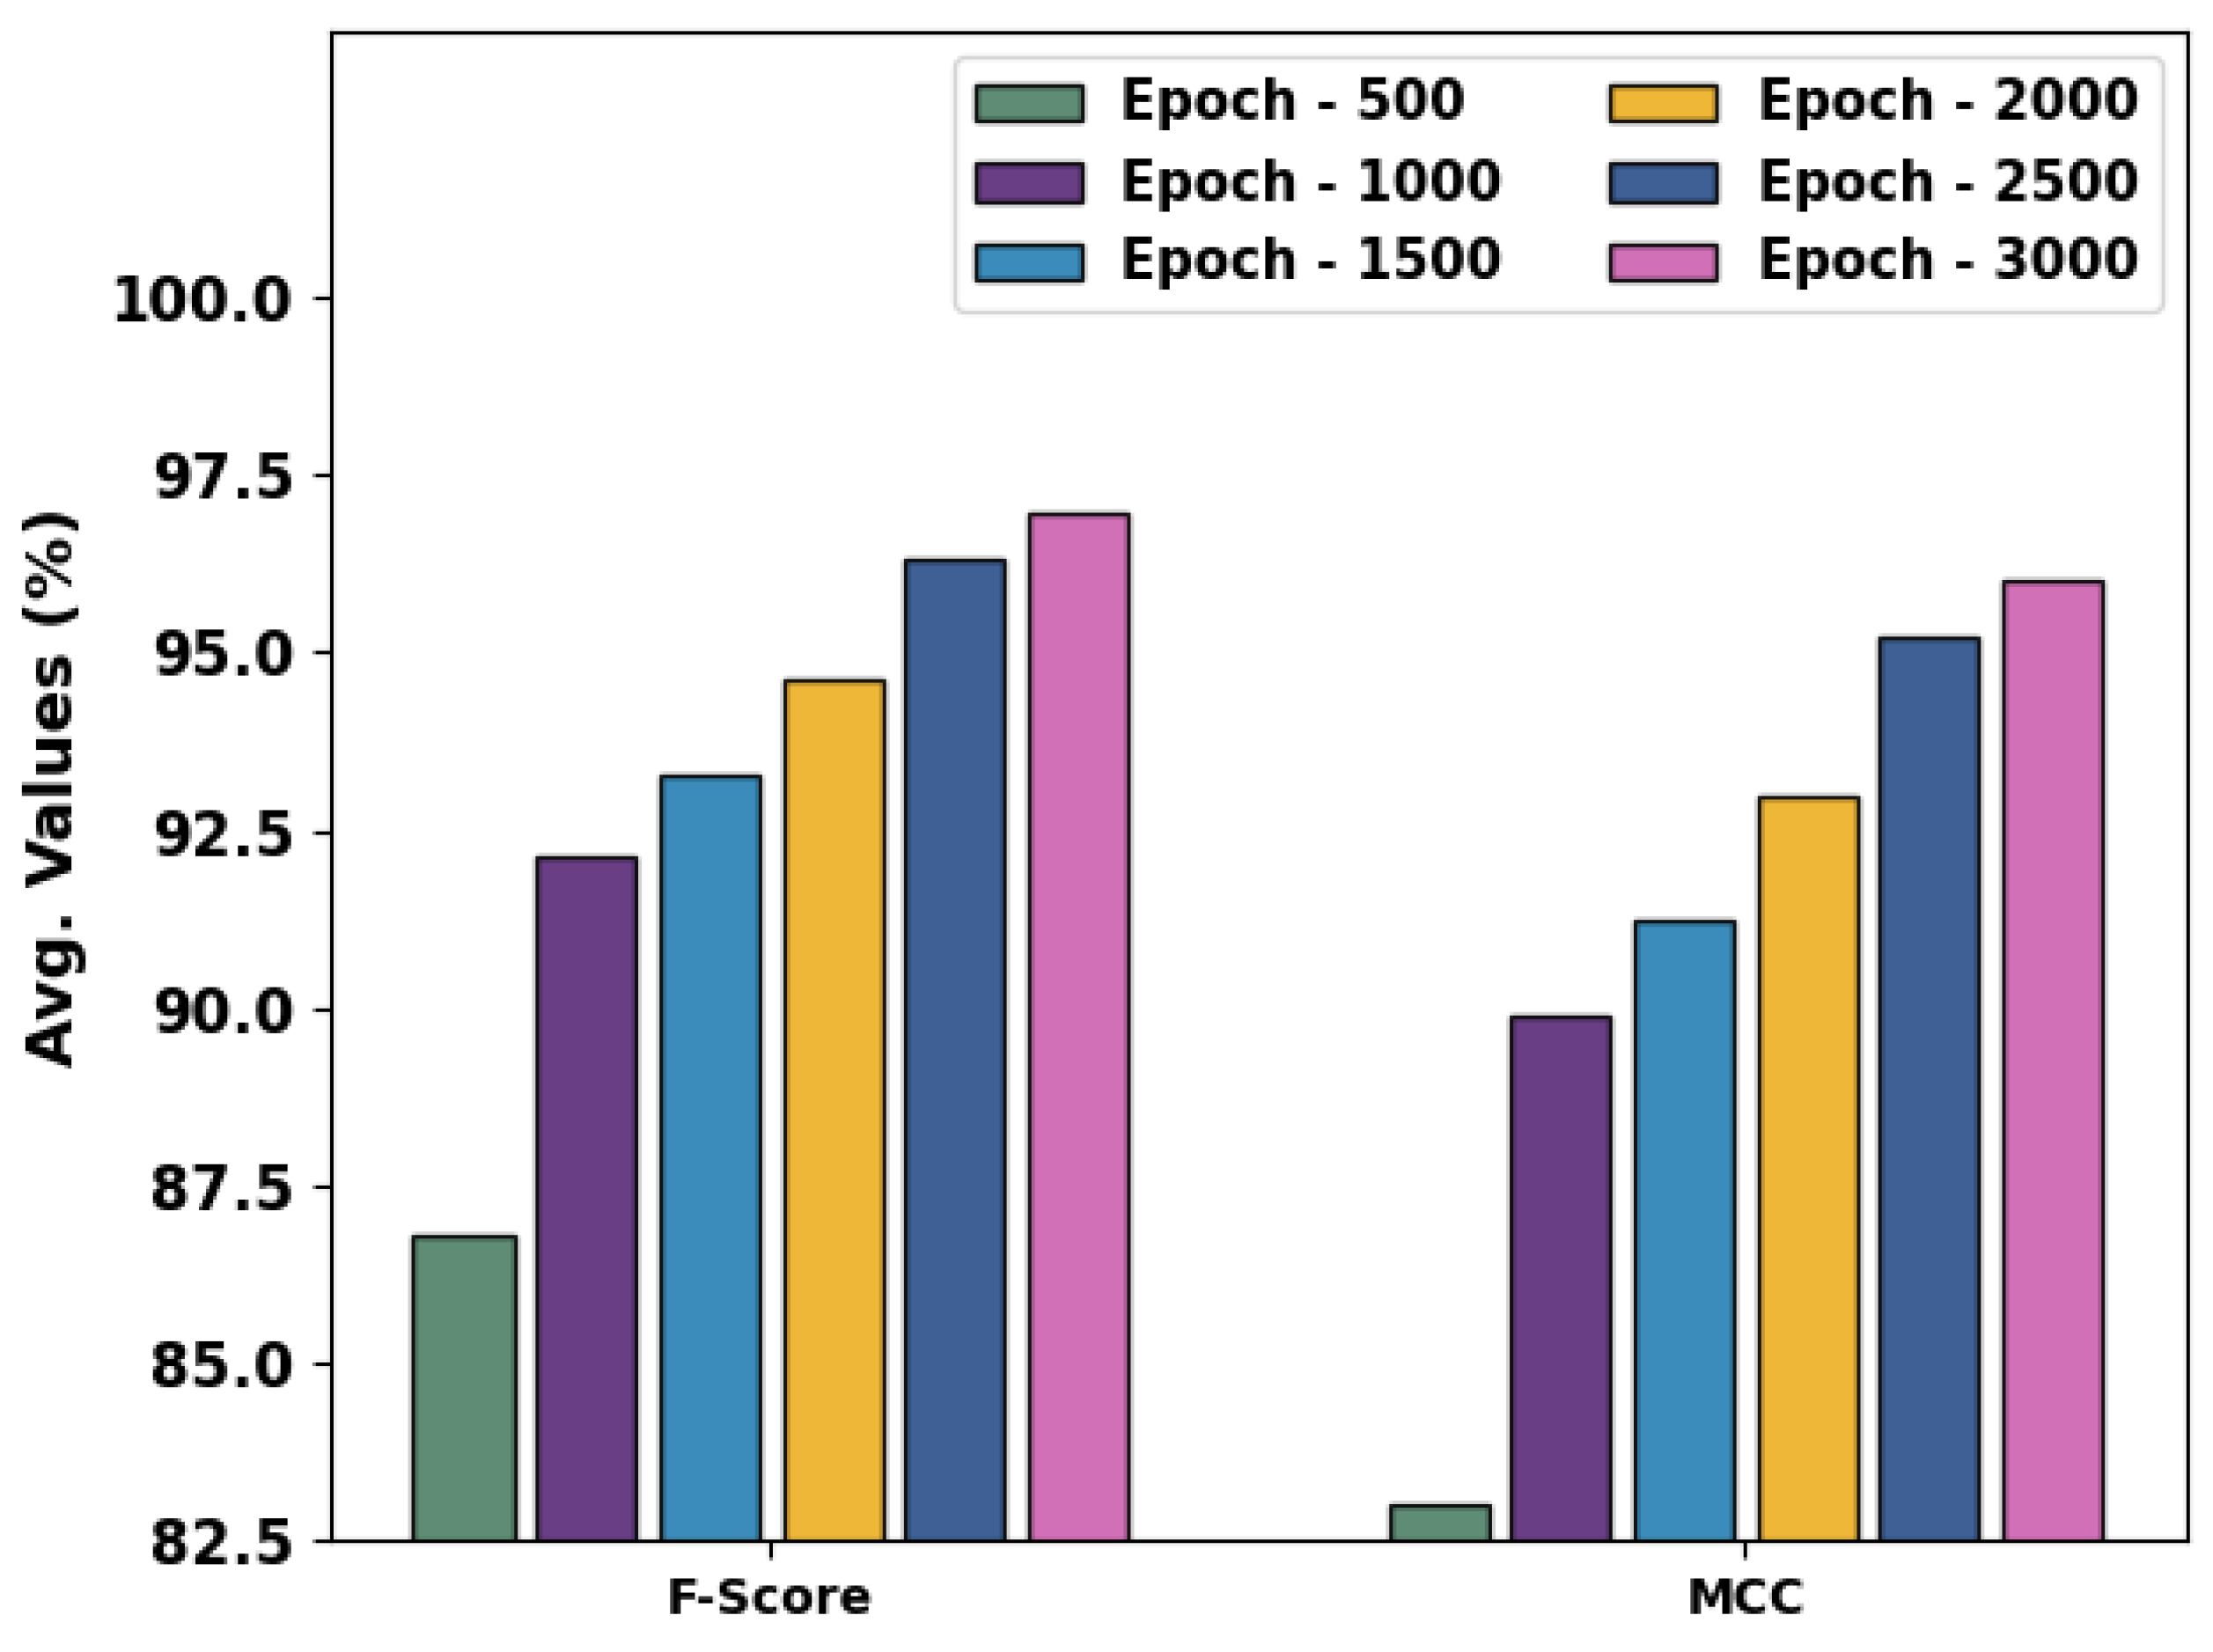
Figure 6 represents the average results of the SBFC-SFOHDL method in terms of the F s c o r e and MCC. The results indicate that the SBFC-SFOHDL technique attains increasing F s c o r e and MCC values under all epochs. For example, with 500 epochs, the SBFC-SFOHDL technique attains an average F s c o r e and MCC of 86.80% and 83.02%. Similarly, with 1500 epochs, the SBFC-SFOHDL method attains an average F s c o r e and MCC of 93.28% and 91.24%. Concurrently, with 3000 epochs, the SBFC-SFOHDL technique attains an average F s c o r e and MCC of 96.95% and 95.99%.
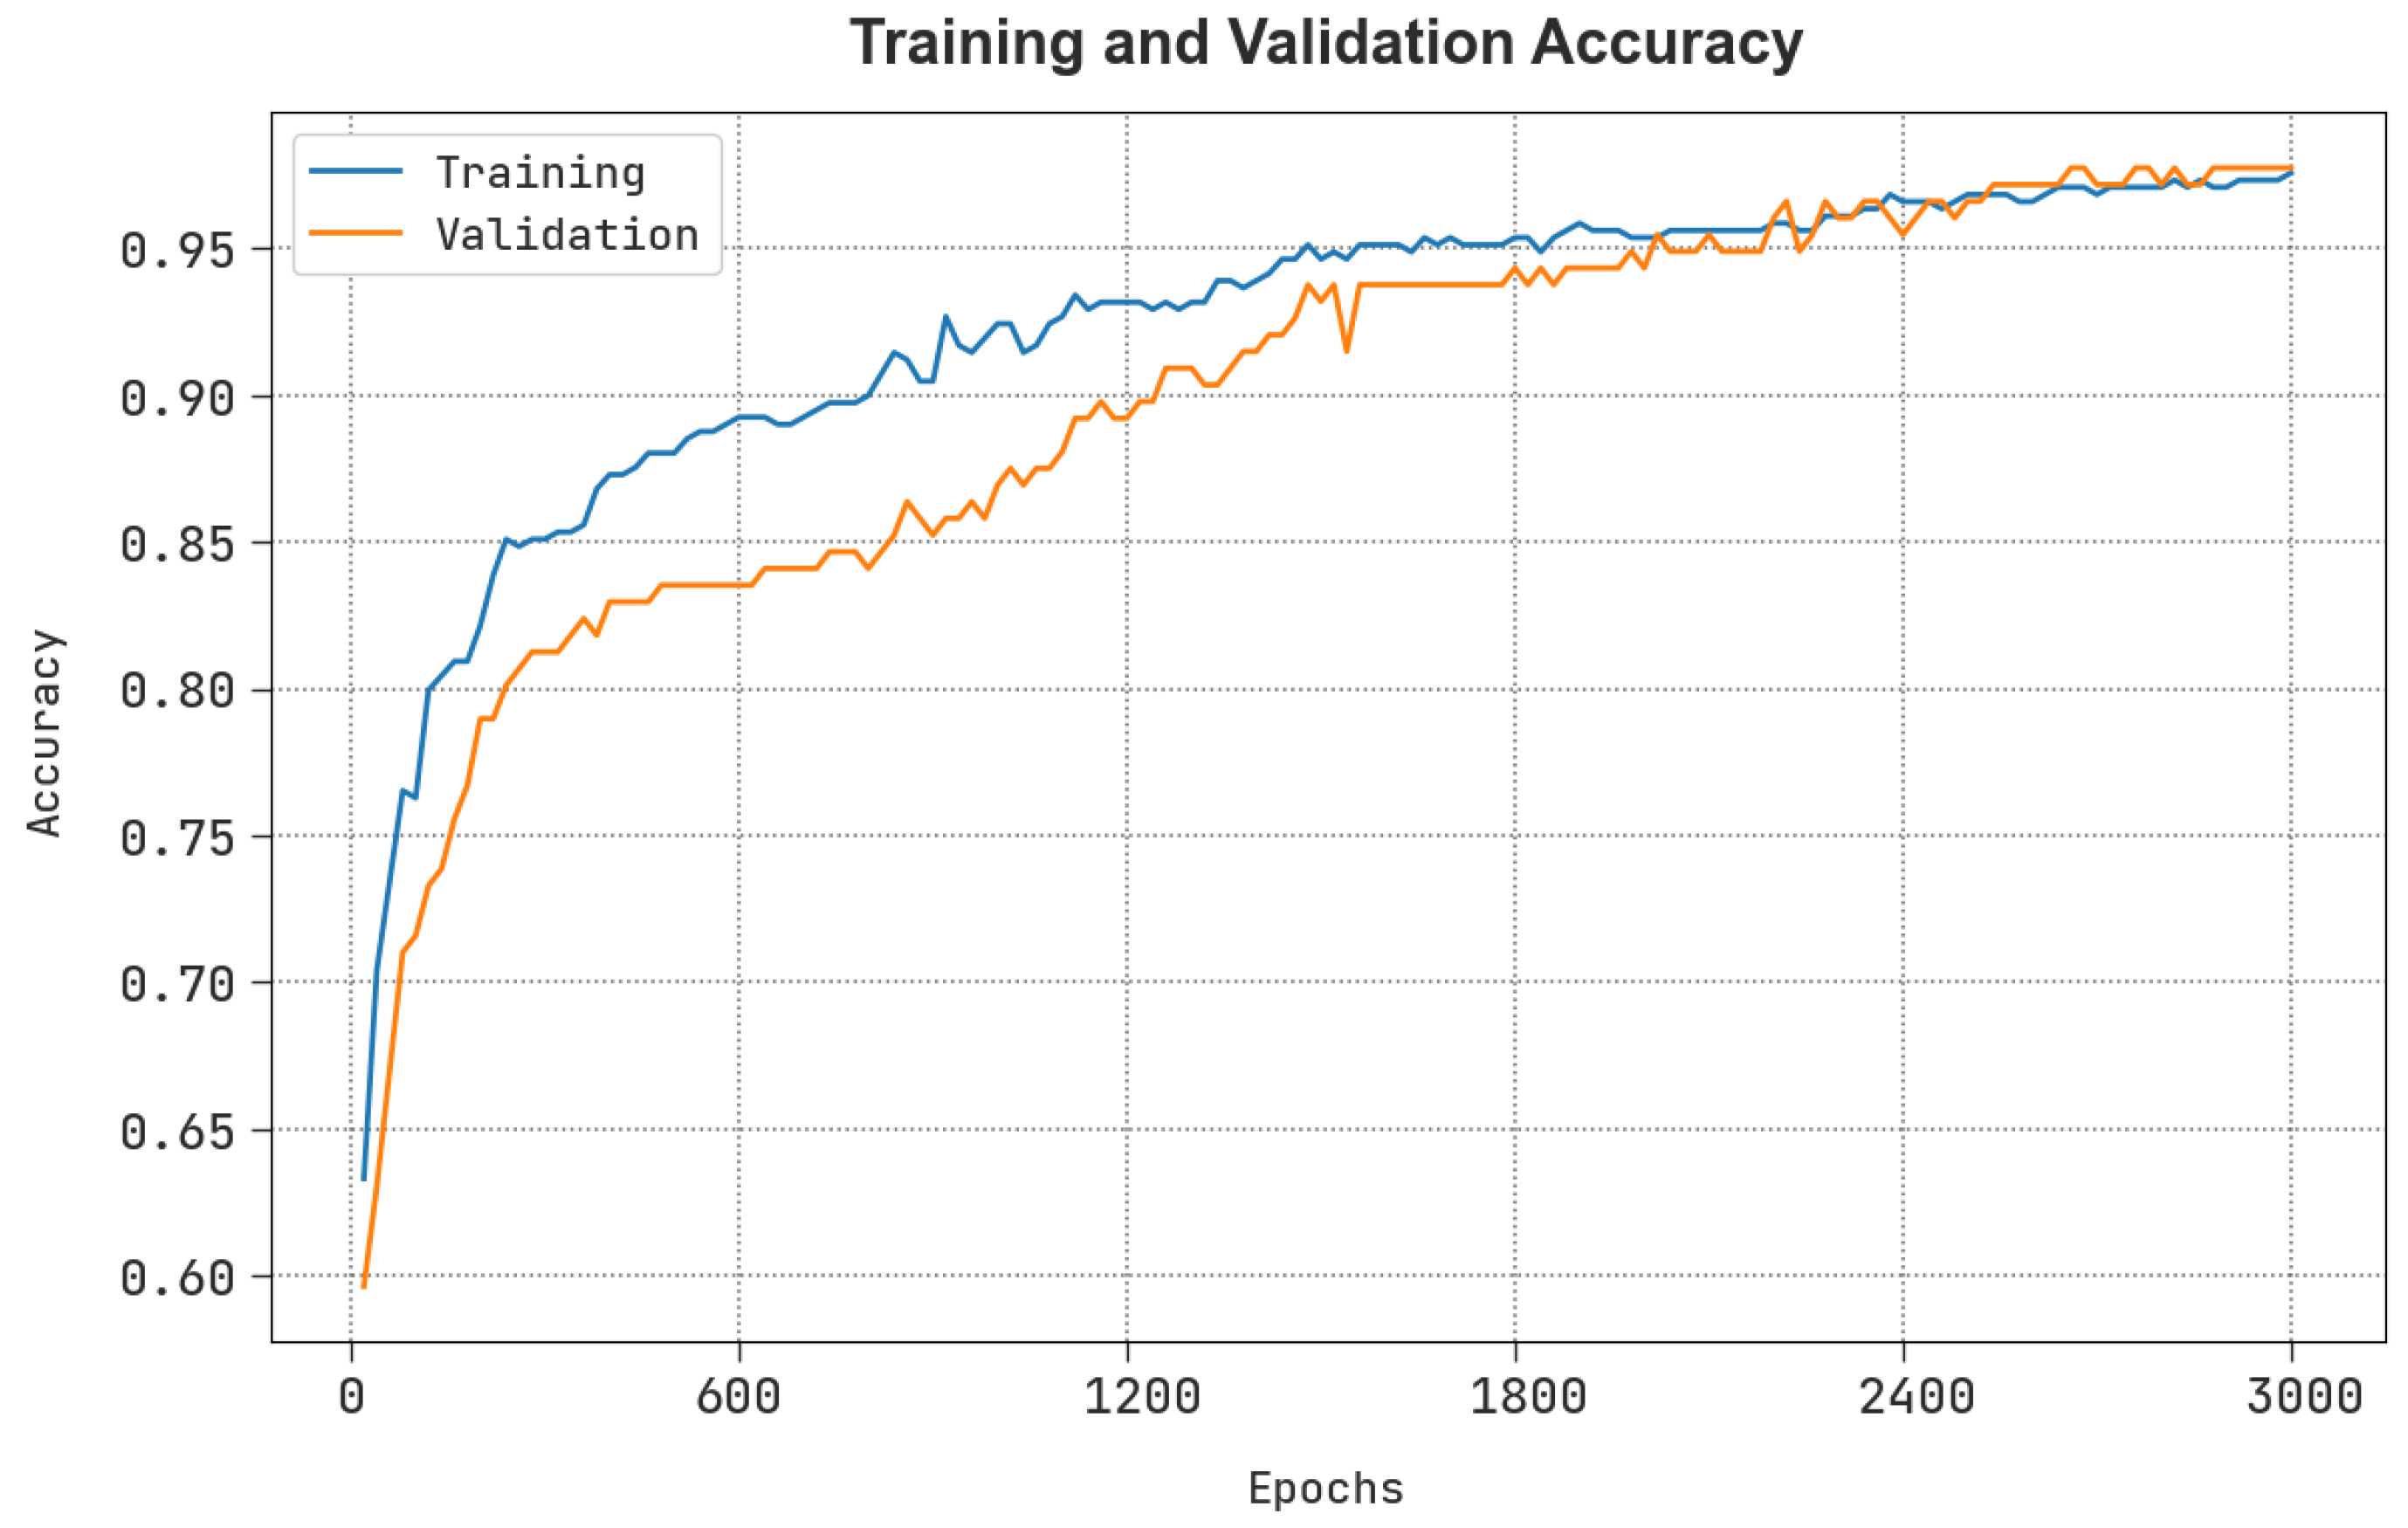
Figure 7 examines the a c c u y of the SBFC-SFOHDL method in the training and validation method on the test database. The outcome demonstrated that the SBFC-SFOHDL methodology achieves enhancing a c c u y values over higher epochs. Furthermore, the maximal validation a c c u y over training a c c u y displays that the SBFC-SFOHDL method is attained effectively on the test database.
The loss examination of the SBFC-SFOHDL method at the time of training and validation is demonstrated on the test database in Figure 8. The outcome indicates that the SBFC-SFOHDL methodology attains nearby values of training and validation loss. The SBFC-SFOHDL method acquired the values capably on the test database.
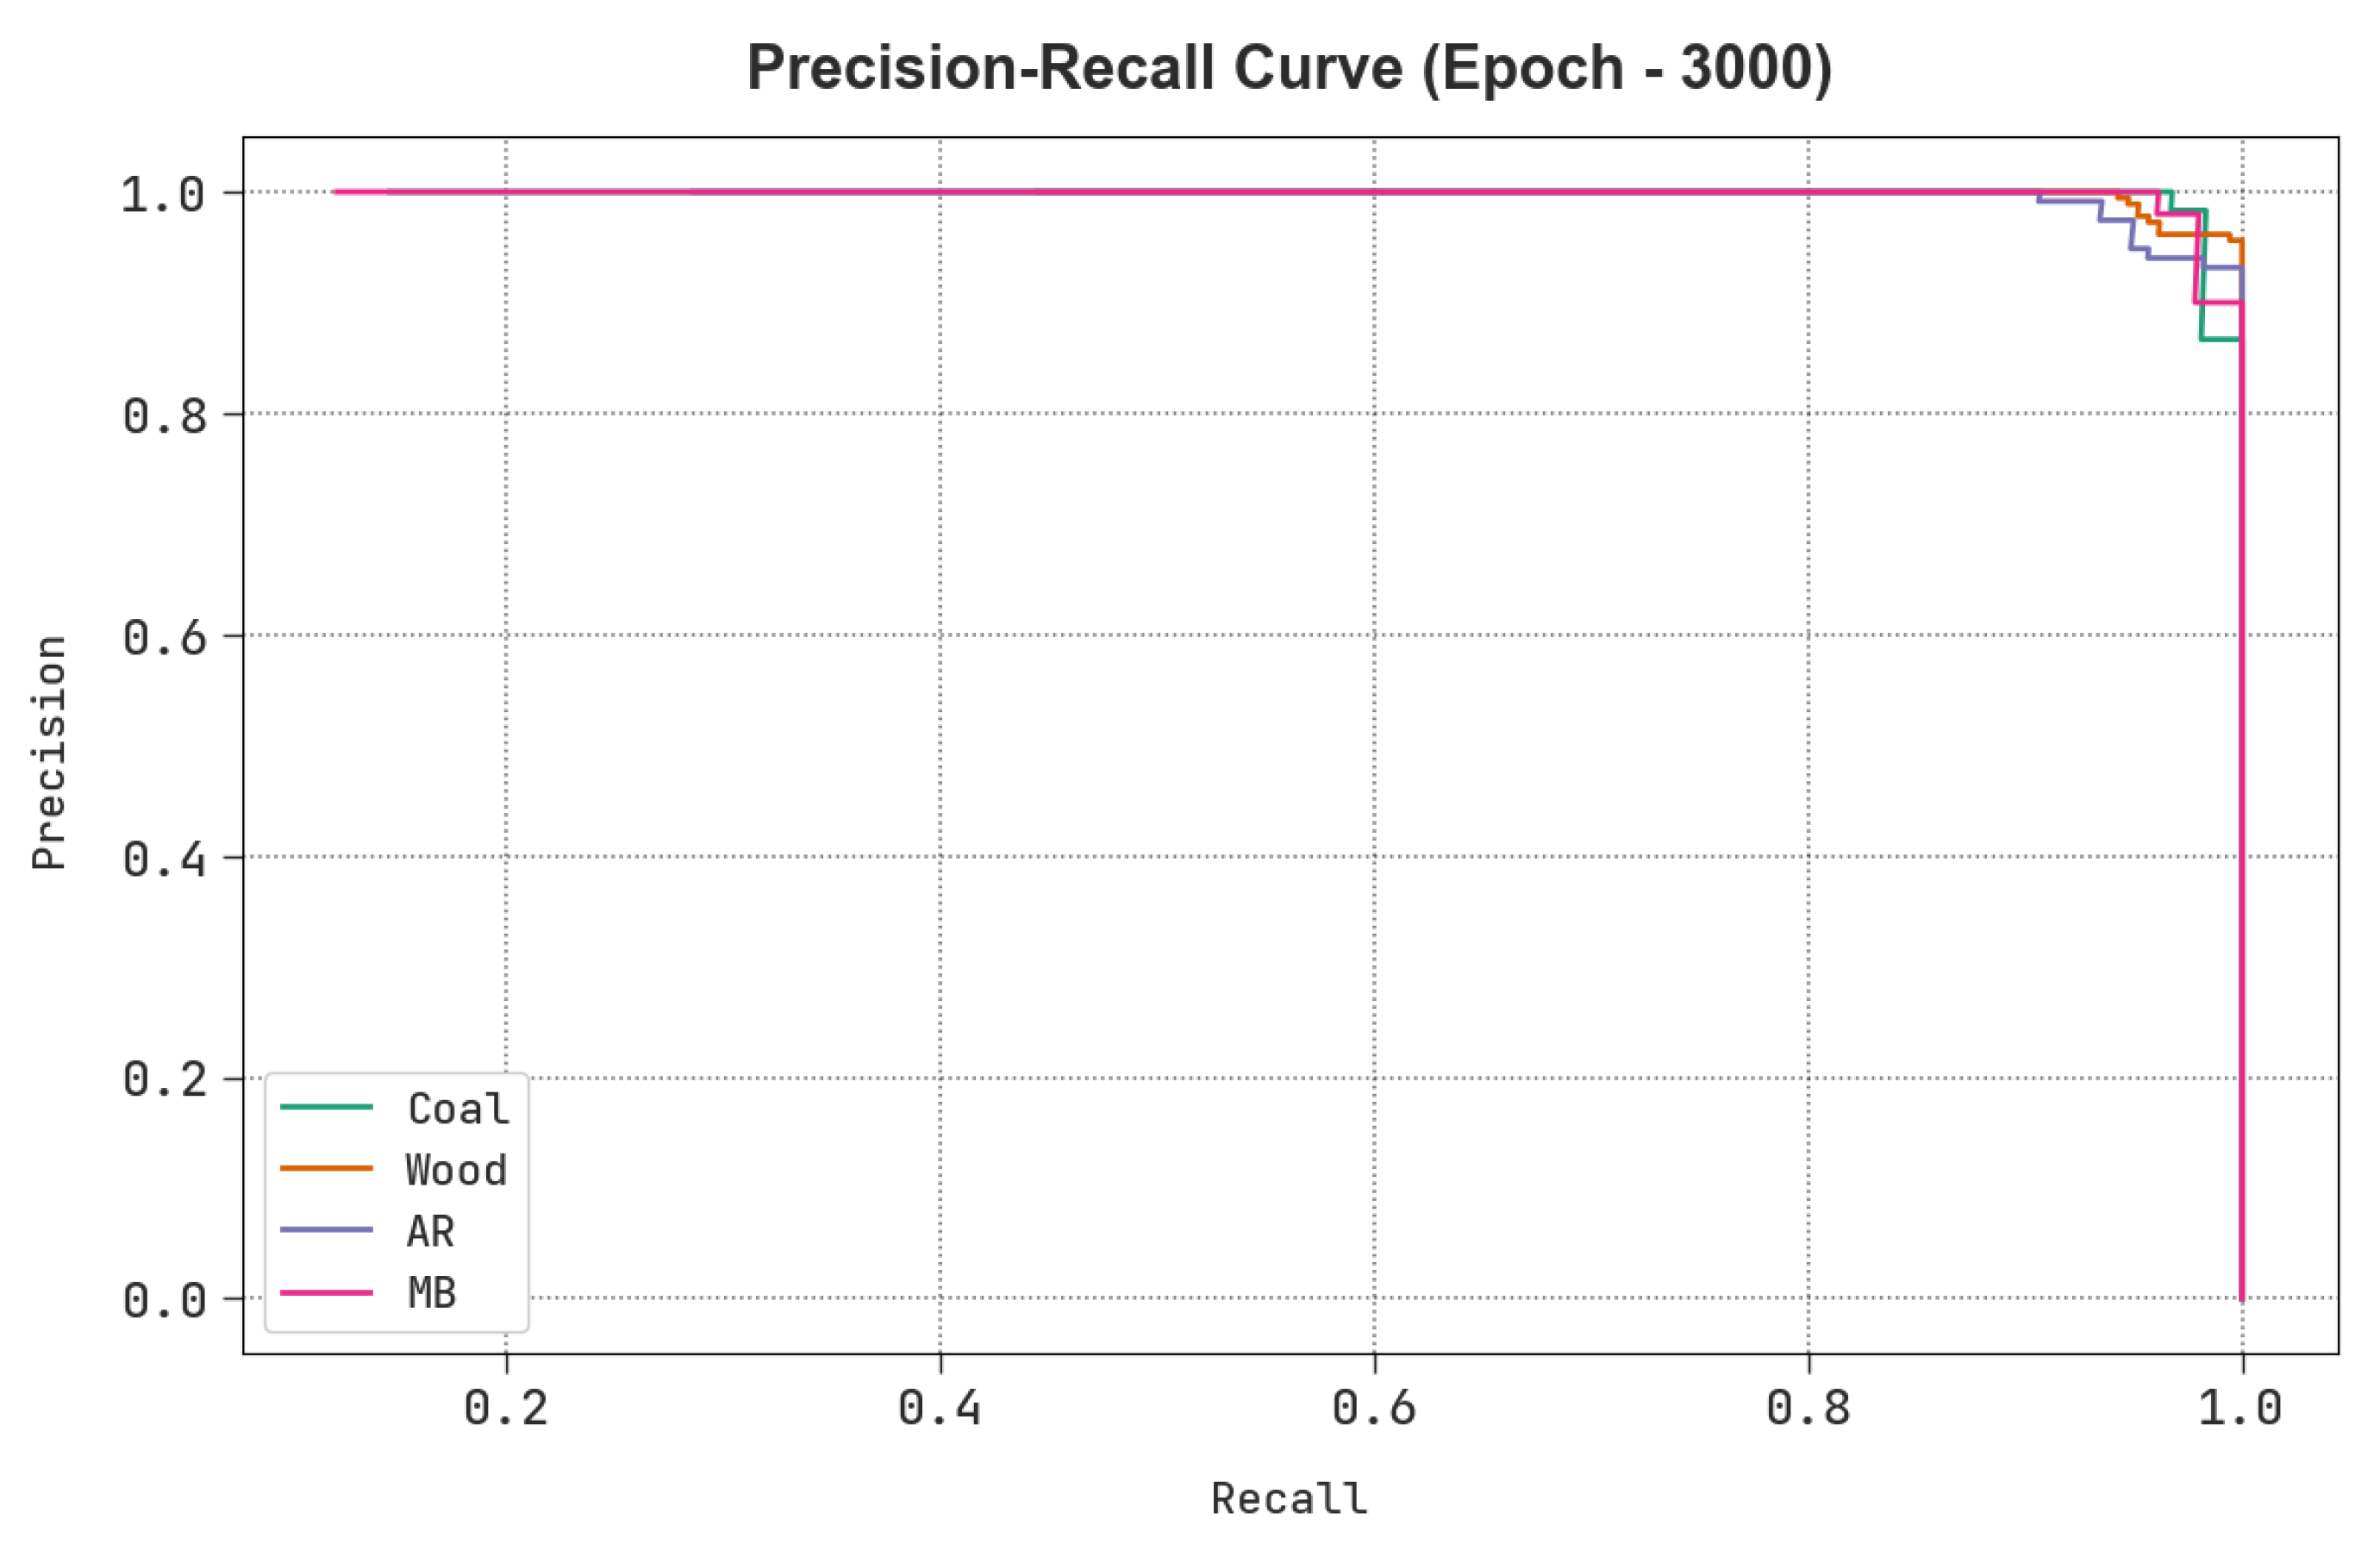
A brief precision–recall (PR) analysis of the SBFC-SFOHDL system is exposed on the test dataset in Figure 9. The outcome indicates that the SBFC-SFOHDL methodology produced superior values of PR. In addition, it is noticeable that the SBFC-SFOHDL technique could achieve greater PR values in four classes.
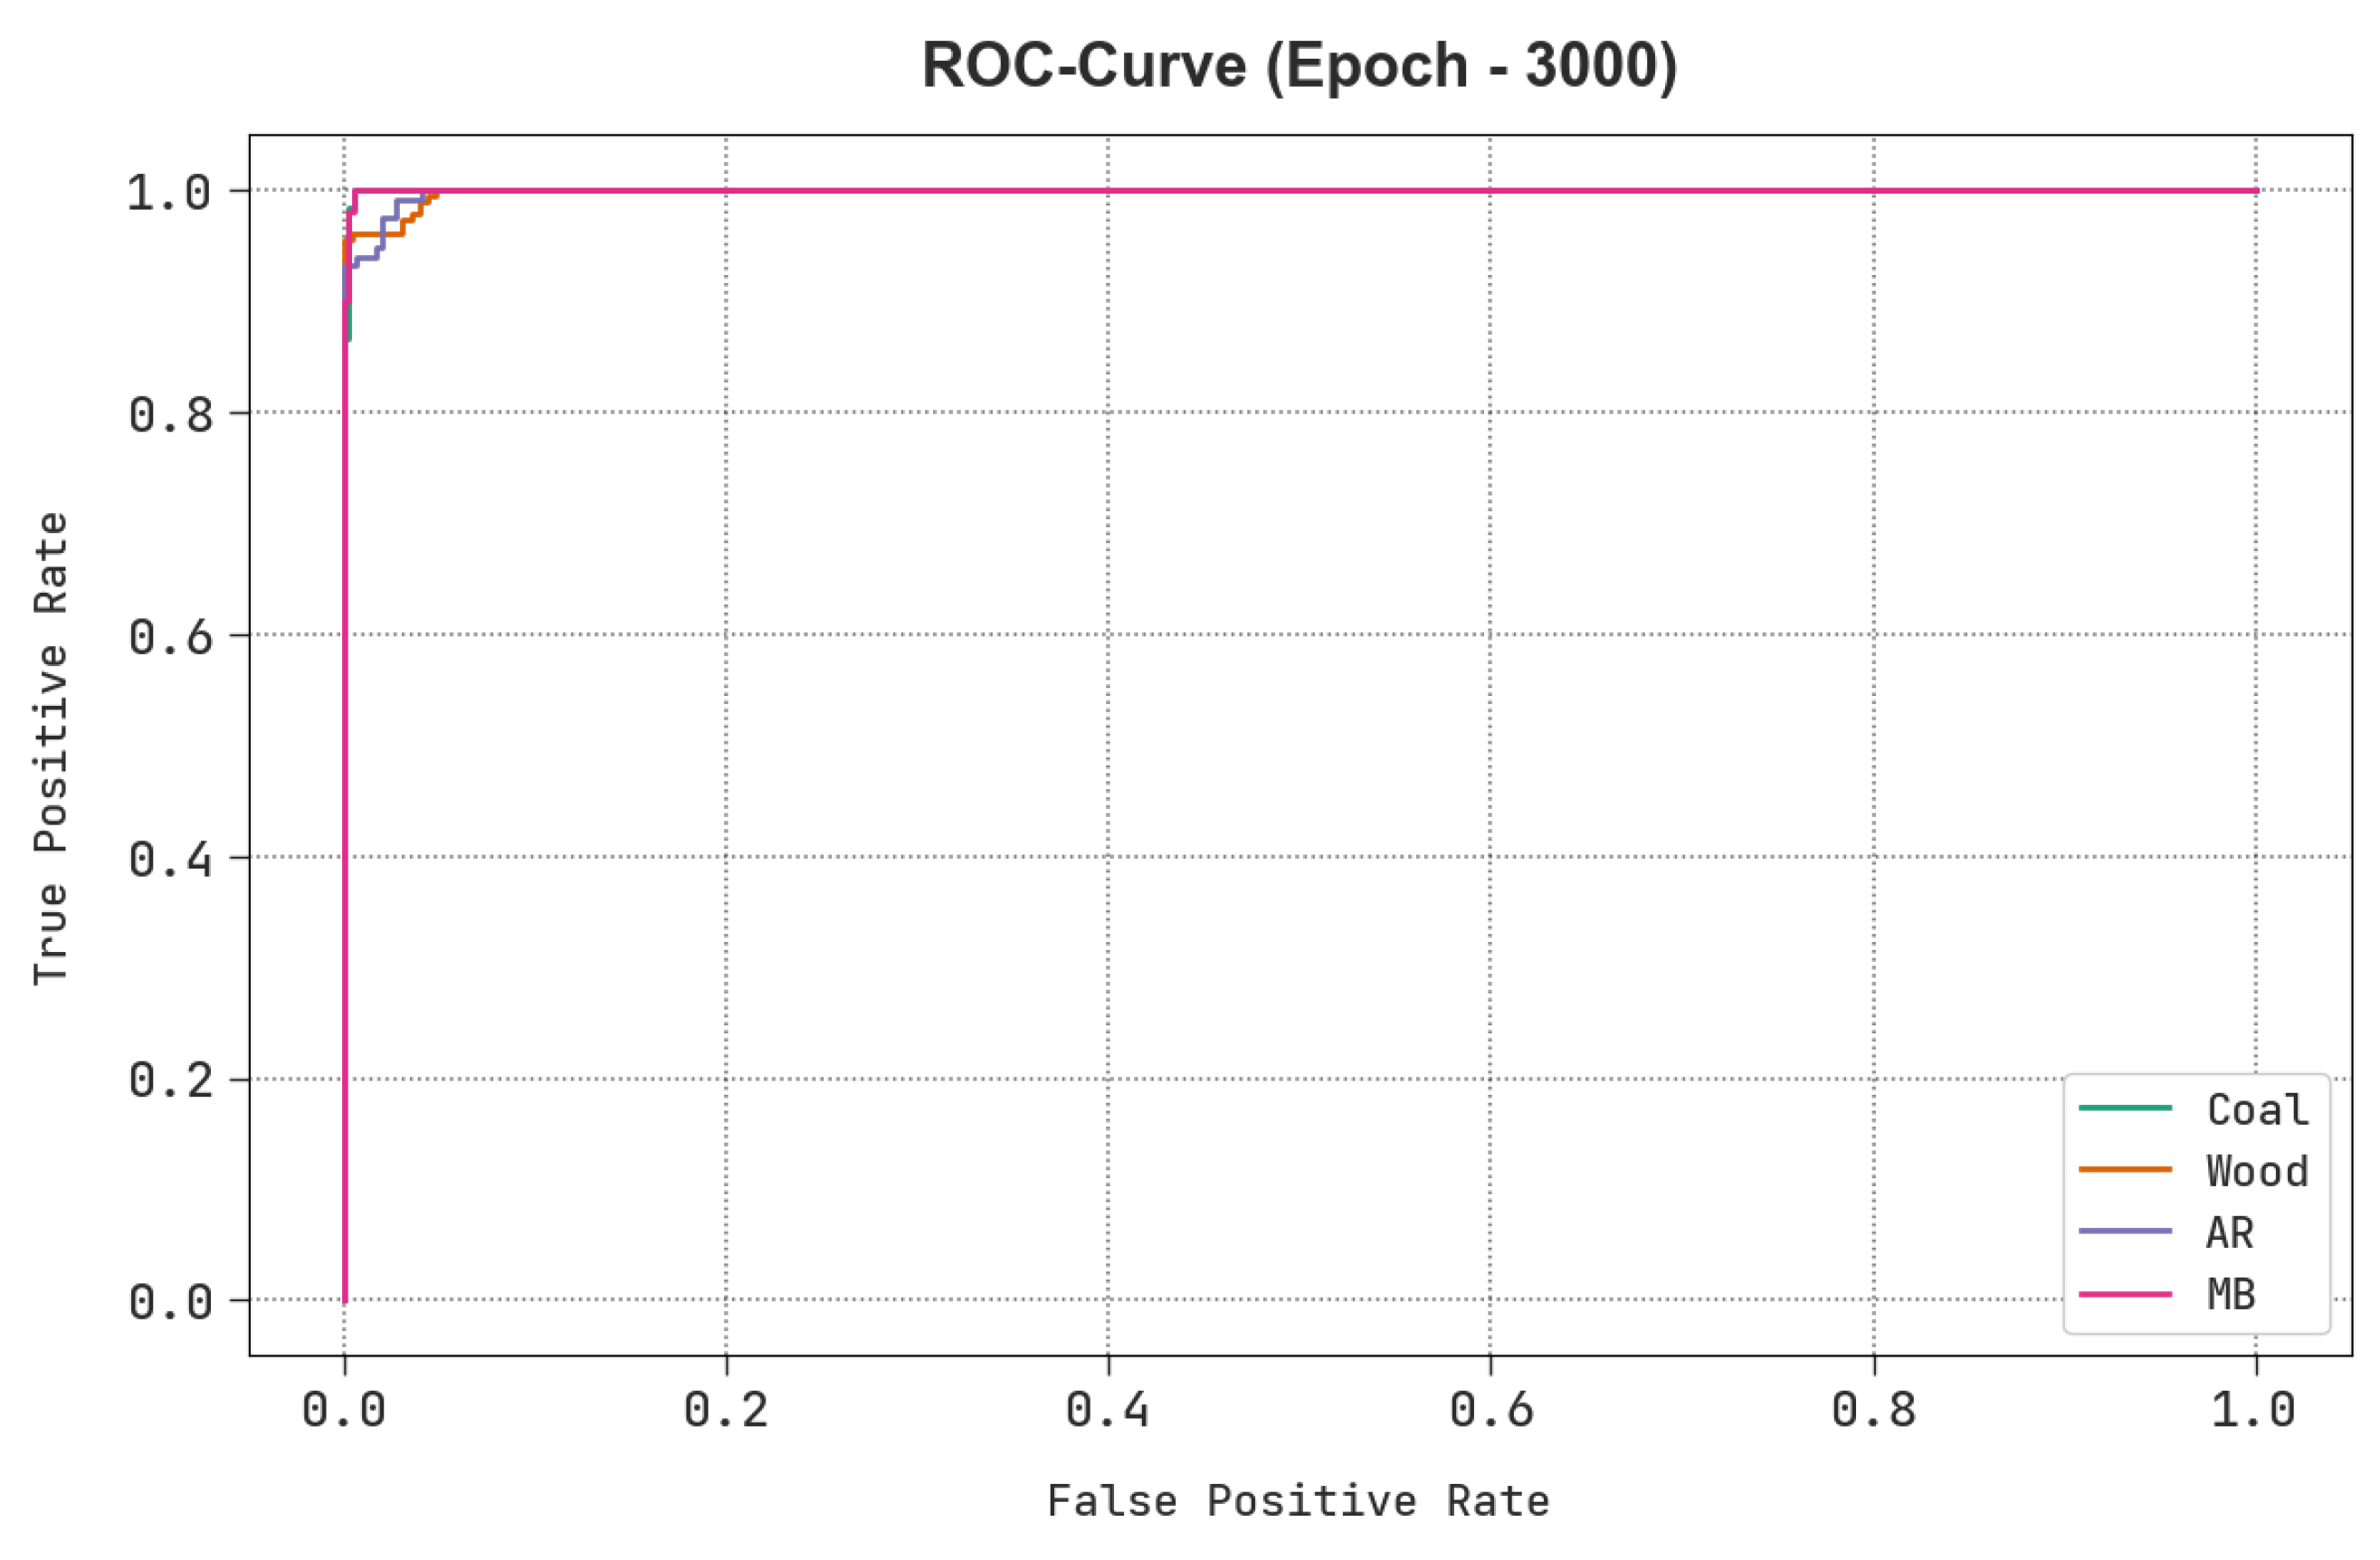
In Figure 10, an ROC examination of the SBFC-SFOHDL technique is shown on the test dataset. The outcome defined that the SBFC-SFOHDL system resulted in better ROC values. Moreover, the SBFC-SFOHDL technique can encompass enhanced ROC values on four class labels.
A detailed comparative study of the SBFC-SFOHDL approach is stated in Table 2 [16]. Figure 11 represents the results of the SBFC-SFOHDL technique with recent models in terms of p r e c n and r e c a l . Based on p r e c n , the SBFC-SFOHDL technique gains an increasing value of 96.85% while the SVM, KNN, flat classifier, HC and IEVB-SFC models obtain a decreasing p r e c n of 89.61%, 91.90%, 90.49%, 91.33% and 94.71%, correspondingly.
Meanwhile, based on r e c a l , the SBFC-SFOHDL system obtains a maximal value of 97.05% but the SVM, KNN, flat classifier, HC and IEVB-SFC models obtain a decreasing r e c a l of 85.45%, 86.59%, 84.22%, 90.37% and 92.56%, correspondingly.
Figure 12 represents the results of the SBFC-SFOHDL method with recent models in terms of a c c u y and F s c o r e . Based on a c c u y , the SBFC-SFOHDL technique gains an increasing value of 98.63% while the SVM, KNN, flat classifier, HC and IEVB-SFC models attain a decreasing a c c u y of 94.54%, 95.48%, 94.02%, 95.24% and 96.63%, correspondingly. Meanwhile, based on the   F s c o r e , the SBFC-SFOHDL method gains an increasing value of 96.95% while the SVM, KNN, flat classifier, HC and IEVB-SFC techniques attain a decreasing F s c o r e of 86.88, 88.84%, 86.80%, 90.97% and 93.44%, correspondingly. Therefore, the SBFC-SFOHDL technique gains maximum performance on solid fuel classification.
In summary, the SBFC-SFOHDL technique exhibits better performance with a maximum a c c u y of 98.63%, p r e c n of 96.85%, r e c a l of 96.85% and F s c o r e of 96.95%. The enhanced performance of the proposed model is due to the incorporation of the SFO-based hyperparameter tuning. Hyperparameters are settings that are not learned during training but must be set prior to training. They can have a significant impact on the performance of the model, and selecting the optimal values can lead to better accuracy. With SFO-optimizer-based hyperparameter tuning, the SBFC-SFOHDL model can achieve even better results by focusing on the most relevant features and selecting the optimal settings for the algorithm. These results ensure the improved performance of the SBFC-SFOHDL technique over other existing techniques.

5. Conclusions

In this study, we concentrated on the improvement of the SBFC-SFOHDL model in the IoT platform. The main purpose of the proposed SBFC-SFOHDL algorithm lies in the proficient detection and classification of solid biofuels from agricultural residues in the IoT platform. To achieve this, the SBFC-SFOHDL algorithm includes IoT-based data collection, data preprocessing, MSA-CBLSTM-based solid fuel classification and SFO-based hyperparameter tuning. The design of the SFO technique helps with the optimum choice of hyperparameter values, which in turn improves the classification accuracy of the MSA-CBLSTM approach. The simulation results of the SBFC-SFOHDL technique are tested and the results are examined under different measures. Extensive comparison studies reported the greater performance of the SBFC-SFOHDL method over recent DL approaches with a maximum a c c u y of 98.63%, p r e c n of 96.85%, r e c a l of 96.85% and F s c o r e of 96.95%. In the future, feature fusion-based DL approaches can be designed to enhance the solid biofuel classification performance.

Author Contributions

Conceptualization, M.R.; Methodology, M.R. and A.O.K. (Adil O. Khadidos); Software, K.H.A., A.M.A. and A.O.K. (Alaa O. Khadidos); Validation, A.O.K. (Alaa O. Khadidos); Formal analysis, M.R., A.O.K. (Adil O. Khadidos) and A.O.K. (Alaa O. Khadidos); Investigation, A.M.A. and D.H.; Resources, A.O.K. (Adil O. Khadidos), A.M.A. and K.H.A.; Data curation, A.O.K. (Adil O. Khadidos), A.M.A. and K.H.A.; Writing—original draft, M.R.; Writing—review & editing, K.H.A., D.H. and A.O.K. (Alaa O. Khadidos); Visualization, K.H.A.; Project administration, M.R.; Funding acquisition, D.H. All authors have read and agreed to the published version of the manuscript.

Funding

This research work was funded by Institutional Fund Projects under grant no. (IFPIP: 1463-145-1443). Therefore, the authors gratefully acknowledge technical and financial support provided by the Ministry of Education and Deanship of Scientific Research (DSR), King Abdulaziz University (KAU), Jeddah, Saudi Arabia.

Institutional Review Board Statement

Not applicable.

Informed Consent Statement

Not applicable.

Data Availability Statement

Data sharing is not applicable to this article as no datasets were generated during the current study.

Conflicts of Interest

The authors declare no conflict of interest. The manuscript was written through contributions of all authors. All authors have given approval of the final version of the manuscript.

References

  1. Peng, W.; Sadaghiani, O.K. An Analytical Review on the Utilization of Machine Learning in the Biomass Raw Materials, Their Evaluation, Storage, and Transportation. Arch. Comput. Methods Eng. 2023, 1–22. [Google Scholar] [CrossRef]
  2. Peng, W.; Sadaghiani, O.K. Enhancement of quality and quantity of woody biomass produced in forests using machine learning algorithms. Biomass Bioenergy 2023, 175, 106884. [Google Scholar] [CrossRef]
  3. Akram, S.V.; Rawat, B. The Smart Analysis of Hydropower Energy Measurement in Power Plants using Industrial Machine Learning Model. In Proceedings of the 2023 IEEE International Conference on Integrated Circuits and Communication Systems (ICICACS), Raichur, India, 24–25 February 2023; pp. 1–6. [Google Scholar]
  4. Barus, J.; Mustikawati, D.R.; Endriani, E.; Meithasari, D.; Ernawati, R.; Wardani, N.; Soraya, S.; Suretno, N.D.; Tambunan, R.D.; Silalahi, M. Evaluation of composting of several plant biomass wastes with different types of starters. Int. J. Recycl. Org. Waste Agric. 2023. [Google Scholar]
  5. Mondal, P.P.; Galodha, A.; Verma, V.K.; Singh, V.; Show, P.L.; Awasthi, M.K.; Lall, B.; Anees, S.; Pollmann, K.; Jain, R. Review on machine learning-based bioprocess optimization, monitoring, and control systems. Bioresour. Technol. 2022, 370, 128523. [Google Scholar] [CrossRef]
  6. Zheng, K.; Jia, X.; Chi, K.; Liu, X. DDPG-based joint time and energy management in ambient backscatter-assisted hybrid underlay CRNs. IEEE Trans. Commun. 2022, 71, 441–456. [Google Scholar] [CrossRef]
  7. Liu, X.; Xu, B.; Zheng, K.; Zheng, H. Throughput maximization of wireless-powered communication network with mobile access points. IEEE Trans. Wirel. Commun. 2022, 22, 4401–4415. [Google Scholar] [CrossRef]
  8. Zheng, K.; Jiang, G.; Liu, X.; Chi, K.; Yao, X.; Liu, J. DRL-Based Offloading for Computation Delay Minimization in Wireless-Powered Multi-Access Edge Computing. IEEE Trans. Commun. 2023, 71, 1755–1770. [Google Scholar] [CrossRef]
  9. Balachander, K.; Paulraj, D. RETRACTED ARTICLE: ANN and fuzzy based household energy consumption prediction with high accuracy. J. Ambient. Intell. Humaniz. Comput. 2021, 12, 7543–7557. [Google Scholar] [CrossRef]
  10. Rajamoorthy, R.; Saraswathi, H.V.; Devaraj, J.; Kasinathan, P.; Elavarasan, R.M.; Arunachalam, G.; Mostafa, T.M.; Mihet-Popa, L. A Hybrid Sailfish Whale Optimization and Deep Long Short-Term Memory (SWO-DLSTM) Model for Energy Efficient Autonomy in India by 2048. Sustainability 2022, 14, 1355. [Google Scholar] [CrossRef]
  11. Sharma, A.K.; Ghodke, P.K.; Goyal, N.; Nethaji, S.; Chen, W.H. Machine learning technology in biohydrogen production from agriculture waste: Recent advances and future perspectives. Bioresour. Technol. 2022, 364, 128076. [Google Scholar] [CrossRef] [PubMed]
  12. Ning, H.; Li, R.; Zhou, T. Machine learning for microalgae detection and utilization. Front. Mar. Sci. 2022, 9, 947394. [Google Scholar] [CrossRef]
  13. Hai, A.; Bharath, G.; Patah, M.F.A.; Daud, W.M.A.W.; Rambabu, K.; Show, P.; Banat, F. Machine learning models for the prediction of total yield and specific surface area of biochar derived from agricultural biomass by pyrolysis. Environ. Technol. Innov. 2023, 30, 103071. [Google Scholar] [CrossRef]
  14. Adeleke, O.; Akinlabi, S.; Jen, T.C.; Adedeji, P.A.; Dunmade, I. Evolutionary-based neuro-fuzzy modelling of combustion enthalpy of municipal solid waste. Neural Comput. Appl. 2022, 34, 7419–7436. [Google Scholar] [CrossRef]
  15. Kaewpengkrow, P.R.; Atong, D.; Sricharoenchaikul, V. Bio-fuel production from catalytic fast pyrolysis of Jatropha wastes using pyroprobe GC/MS and drop tube pyrolyzer. J. Anal. Appl. Pyrolysis 2022, 165, 105574. [Google Scholar] [CrossRef]
  16. Al-Wesabi, F.N.; Malibari, A.A.; Hilal, A.M.; NEMRI, N.; Kumar, A.; Gupta, D. Intelligent ensemble of voting based solid fuel classification model for energy harvesting from agricultural residues. Sustain. Energy Technol. Assess. 2022, 52, 102040. [Google Scholar] [CrossRef]
  17. Pawlak-Kruczek, H.; Niedzwiecki, L.; Sieradzka, M.; Mlonka-Mędrala, A.; Baranowski, M.; Serafin-Tkaczuk, M.; Magdziarz, A. Hydrothermal carbonization of agricultural and municipal solid waste digestates–Structure and energetic properties of the solid products. Fuel 2020, 275, 117837. [Google Scholar] [CrossRef]
  18. Zheng, J.; Wu, Z.; Sharma, R.; Lv, H. Adaptive decision model of product team organization pattern for extracting new energy from agricultural waste. Sustain. Energy Technol. Assess. 2022, 53, 102352. [Google Scholar] [CrossRef]
  19. Bot, B.V.; Axaopoulos, P.J.; Sakellariou, E.I.; Sosso, O.T.; Tamba, J.G. Energetic and economic analysis of biomass briquettes production from agricultural residues. Appl. Energy 2022, 321, 119430. [Google Scholar] [CrossRef]
  20. Bosona, T.; Gebresenbet, G.; Olsson, S.O. Traceability system for improved utilization of solid biofuel from agricultural prunings. Sustainability 2018, 10, 258. [Google Scholar] [CrossRef]
  21. Jifara, B.; Diriba, M.; Mengesha, A. Pelletization of mixed torrefied corn cob and khat stem to enhance the physicochemical and thermal properties of solid biofuel and parametric optimization. Biomass Convers. Biorefinery 2022, 1–15. [Google Scholar] [CrossRef]
  22. Samadi, S.H.; Ghobadian, B.; Nosrati, M. Prediction and estimation of biomass energy from agricultural residues using air gasification technology in Iran. Renew. Energy 2020, 149, 1077–1091. [Google Scholar] [CrossRef]
  23. Perez-Herrera, R.; de Souza, T.A.; Coronado, C.J.; do Nascimento, M.A.R.; Pinto, G.M. Numerical CFD Simulation of a Horizontal Cyclonic Combustion Chamber for Burning Pulverized Biomass Solid Fuels. Waste Biomass Valorization 2023, 14, 1979–2007. [Google Scholar] [CrossRef]
  24. Michal, H.; Jozef, J.; Miriam, N. Design of a wireless monitoring system with emission analysis integration for solid-fuel based heating devices in households of SmartCity. Wirel. Netw. 2022, 1–10. [Google Scholar] [CrossRef]
  25. Koval, S.; Vytisk, J.; Ruzickova, J.; Raclavska, H.; Skrobankova, H.; Hellebrandova, L. The Impact of Solid Fuel Residential Boilers Exchange on Particulate Matter Air Pollution. Appl. Sci. 2021, 11, 5400. [Google Scholar] [CrossRef]
  26. Akarsu, K.; Duman, G.; Yilmazer, A.; Keskin, T.; Azbar, N.; Yanik, J. Sustainable valorization of food wastes into solid fuel by hydrothermal carbonization. Bioresour. Technol. 2019, 292, 121959. [Google Scholar] [CrossRef] [PubMed]
  27. Hu, Z.; Chen, L.; Luo, Y.; Zhou, J. EEG-Based Emotion Recognition Using Convolutional Recurrent Neural Network with Multi-Head Self-Attention. Appl. Sci. 2022, 12, 11255. [Google Scholar] [CrossRef]
  28. Sailaja, C.; Maloji, S.; Mannepalli, K. A hybrid HXPLS-TMFCC parameterization and DCNN-SFO clustering based speaker diarization system. Concurr. Comput. Pract. Exp. 2022, 34, e6954. [Google Scholar] [CrossRef]
  29. Elmaz, F.; Büyükçakır, B.; Yücel, Ö.; Mutlu, A.Y. Hierarchical Classification Framework for Solid Fuel Classification. Available online: https://github.com/furkanelmaz/SolidFuelClassification (accessed on 12 June 2023).
Figure 1. Workflow of SBFC-SFOHDL approach.
Sustainability 15 12523 g001
Figure 2. Structure of a Bi-LSTM.
Sustainability 15 12523 g002
Figure 3. Confusion matrices of SBFC-SFOHDL approach: (af) epochs 500–3000.
Sustainability 15 12523 g003
Figure 4. Average a c c u y outcome of SBFC-SFOHDL approach under varying epochs.
Sustainability 15 12523 g004
Figure 5. Average p r e c n and r e c a l outcome of SBFC-SFOHDL approach under varying epochs.
Sustainability 15 12523 g005
Figure 6. Average F s c o r e and MCC outcome of SBFC-SFOHDL approach under varying epochs.
Sustainability 15 12523 g006
Figure 7. Accuracy curve of the SBFC-SFOHDL approach.
Sustainability 15 12523 g007
Figure 8. Loss curve of the SBFC-SFOHDL system.
Sustainability 15 12523 g008
Figure 9. PR curve of the SBFC-SFOHDL approach.
Sustainability 15 12523 g009
Figure 10. ROC curve of the SBFC-SFOHDL methodology.
Sustainability 15 12523 g010
Figure 11. P r e c n and r e c a l outcome of SBFC-SFOHDL algorithm with other recent methodologies.
Sustainability 15 12523 g011
Figure 12. A c c u y and F s c o r e outcome of SBFC-SFOHDL algorithm with other recent methodologies.
Sustainability 15 12523 g012
Table 1. Classifier outcome of SBFC-SFOHDL approach with varying epochs.
No. of Epochs Classes A c c u y P r e c n R e c a l F S c o r e MCC
Epoch 500Coal92.8282.5070.2175.8672.00
Wood95.0496.2592.0394.0989.89
AR91.4580.9591.6285.9680.16
MB97.7889.4793.1591.2890.03
Average94.2787.2986.7586.8083.02
Epoch 1000Coal95.7393.6778.7285.5583.50
Wood97.0996.8096.4196.6194.07
AR94.7087.3695.2191.1287.52
MB98.8094.5995.8995.2494.56
Average96.5893.1191.5692.1389.91
Epoch 1500Coal96.4192.9484.0488.2786.31
Wood97.2696.8196.8196.8194.42
AR95.3890.2394.0192.0888.86
MB98.9794.6797.2695.9595.37
Average97.0193.6693.0393.2891.24
Epoch 2000Coal97.0995.2986.1790.5088.95
Wood97.6197.2197.2197.2195.12
AR96.5892.0096.4194.1591.79
MB99.1595.9597.2696.6096.11
Average97.6195.1194.2694.6292.99
Epoch 2500Coal98.2996.6792.5594.5793.58
Wood98.2998.3997.6198.0096.51
AR97.7894.7797.6096.1794.62
MB99.1595.9597.2696.6096.11
Average98.3896.4496.2696.3395.21
Epoch 3000Coal98.8096.7795.7496.2695.55
Wood98.4698.7997.6198.2096.86
AR98.1295.8897.6096.7495.42
MB99.1595.9597.2696.6096.11
Average98.6396.8597.0596.9595.99
Table 2. Comparative outcome of SBFC-SFOHDL approach with other recent methodologies.
Methods P r e c n R e c a l A c c u y F S c o r e
SBFC-SFOHDL96.8597.0598.6396.95
SVM89.6185.4594.5486.88
KNN91.9086.5995.4888.84
Flat Classifier90.4984.2294.0286.80
Hierarchical Classifier91.3390.3795.2490.97
IEVB-SFC94.7192.5696.6393.44
Disclaimer/Publisher’s Note: The statements, opinions and data contained in all publications are solely those of the individual author(s) and contributor(s) and not of MDPI and/or the editor(s). MDPI and/or the editor(s) disclaim responsibility for any injury to people or property resulting from any ideas, methods, instructions or products referred to in the content.