
Life Cycle Assessment of PLA Products: A Systematic Literature Review


Abstract
:1. Introduction
1.1. Eco-Design
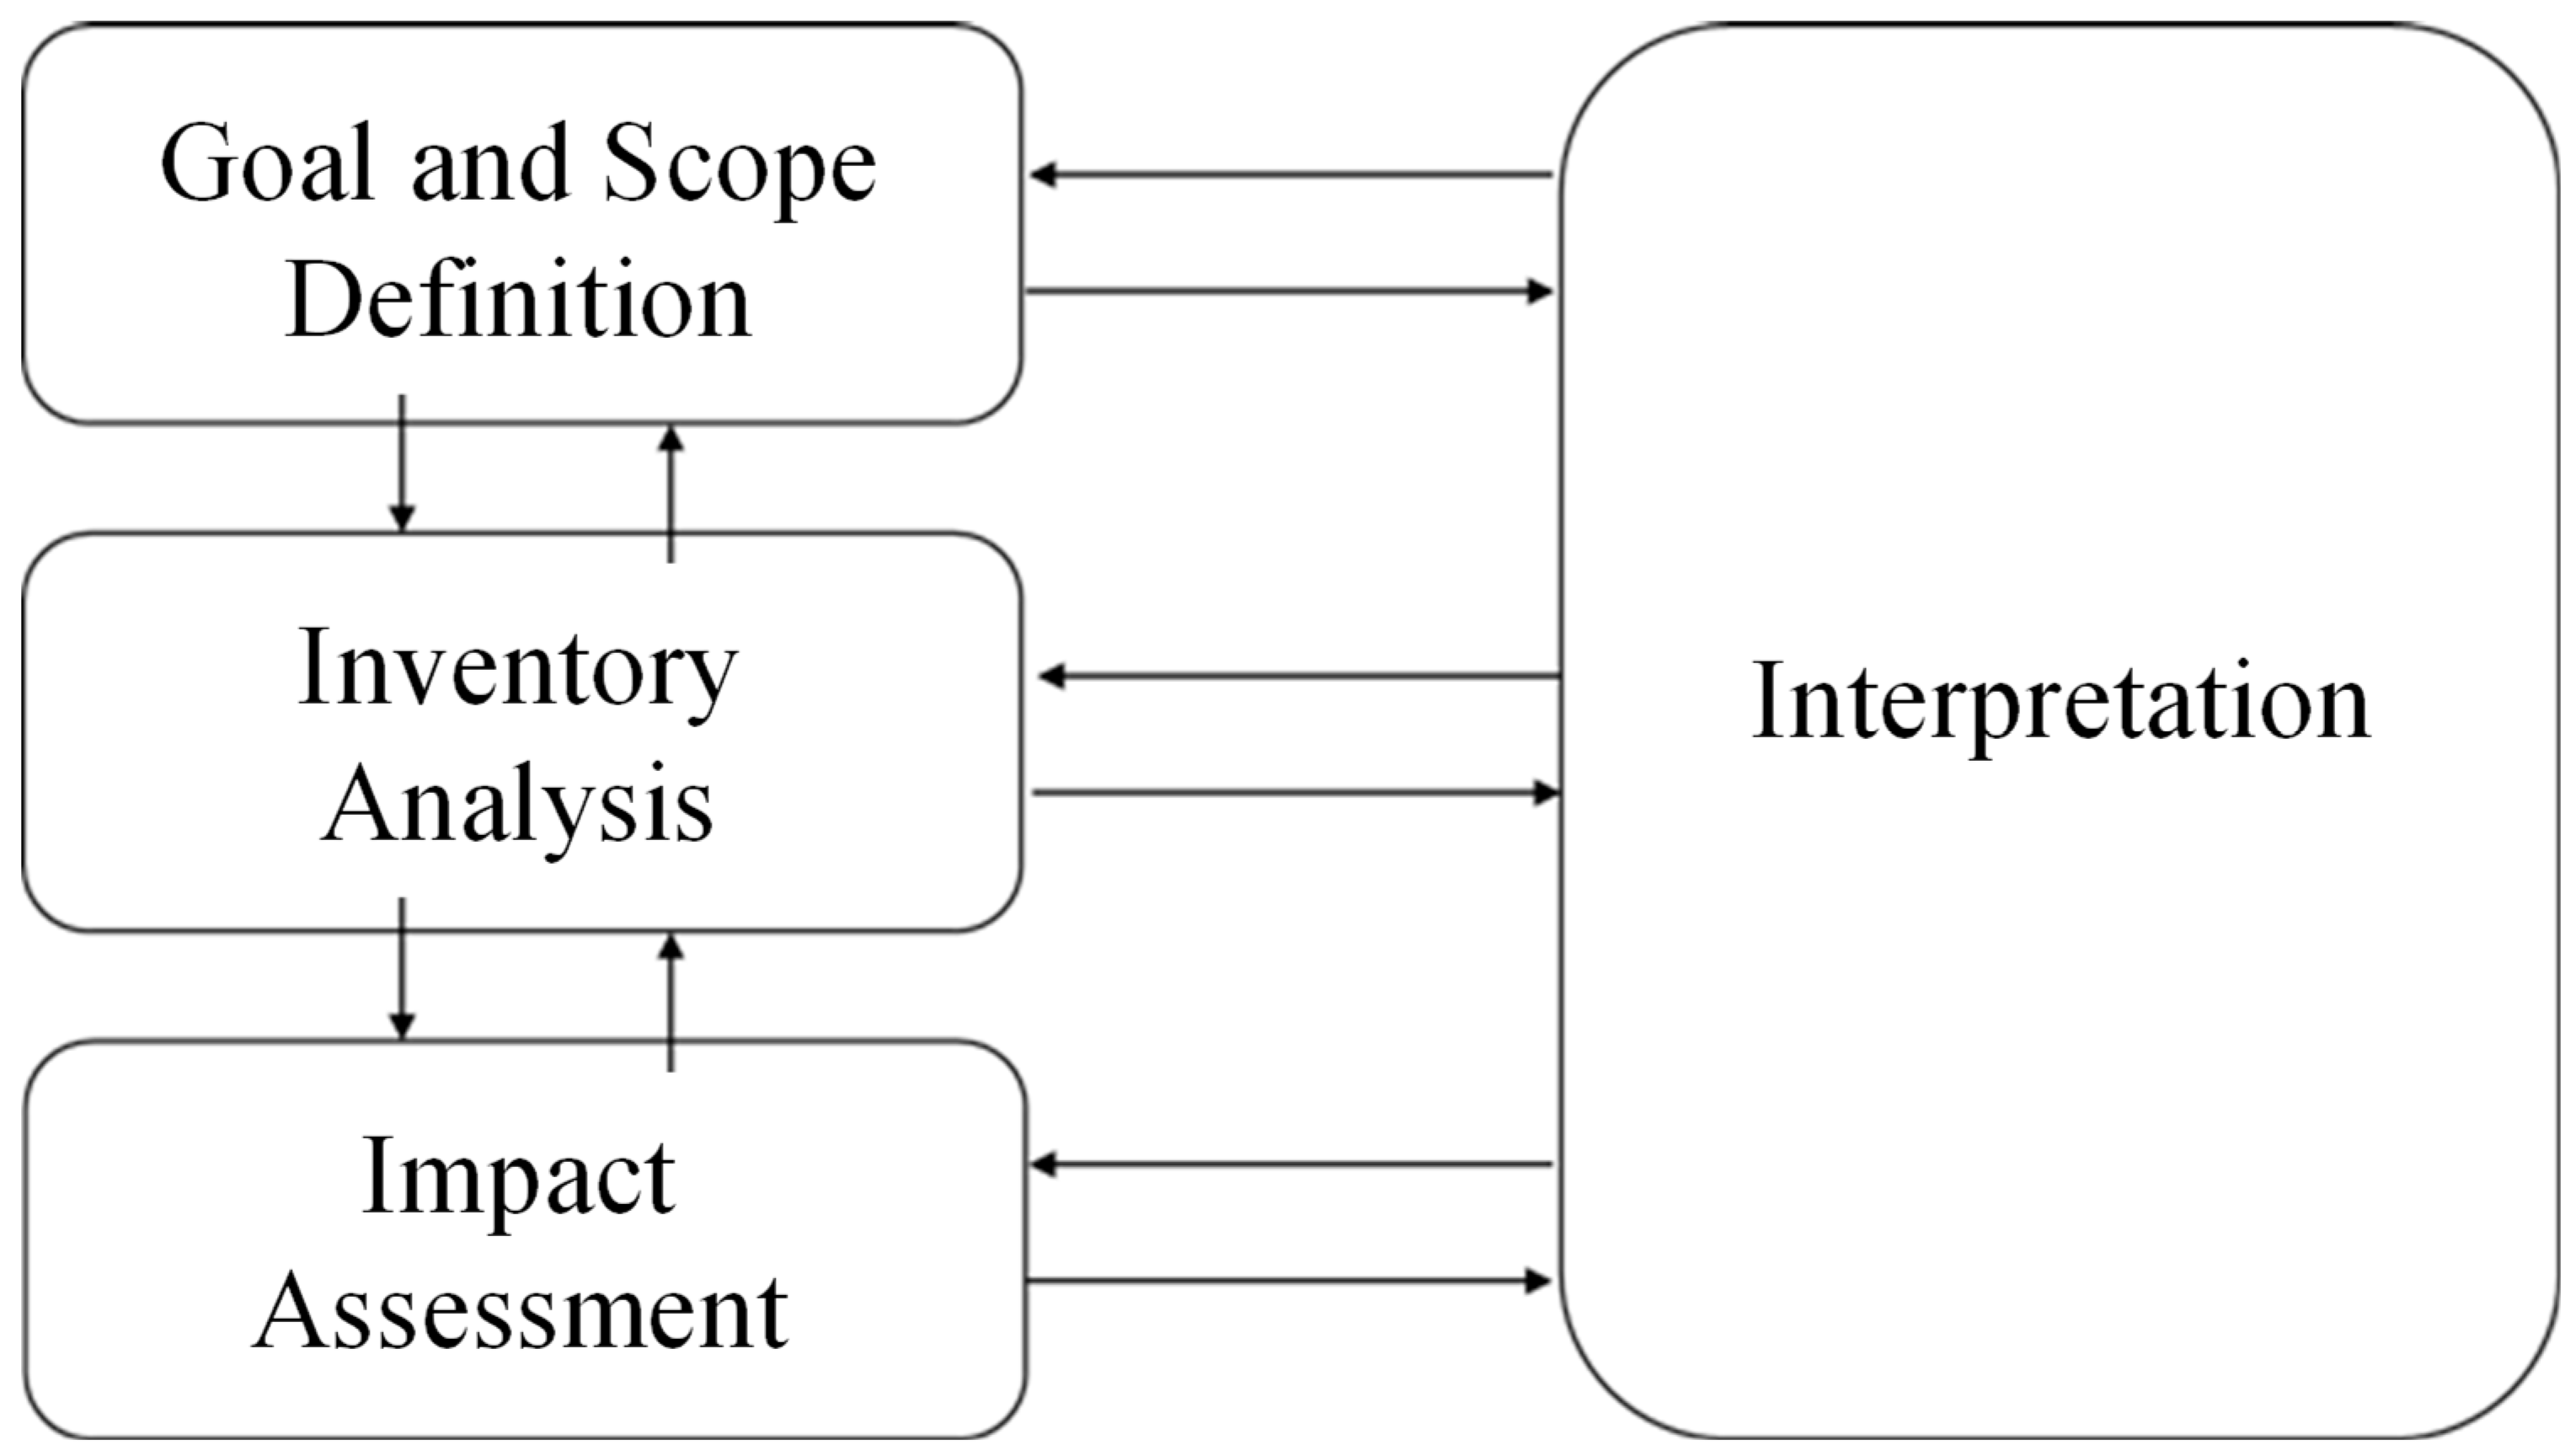
1.2. Life Cycle Assessment
- Goal and Scope Definition:
- 2.
- Life Cycle Inventory (LCI):
- 3.
- Life Cycle Impact Assessment (LCIA):
- 4.
- Life Cycle Interpretation:
- Searching for pre-existing life cycles, e.g., those with the least negative impact on the environment [17];
- Making decisions in industry, public organizations, or NGOs, which can determine the direction and priorities for strategic planning, product design, or process change [17];
- Choosing indicators capable of analyzing the environmental behavior of the organization, including measurement and evaluation techniques, mainly related to the assessment of the state of the environment surrounding the system under analysis [17];
- Linking marketing with the formulation of environmental product claims or eco-labels [17].
2. Materials and Methods
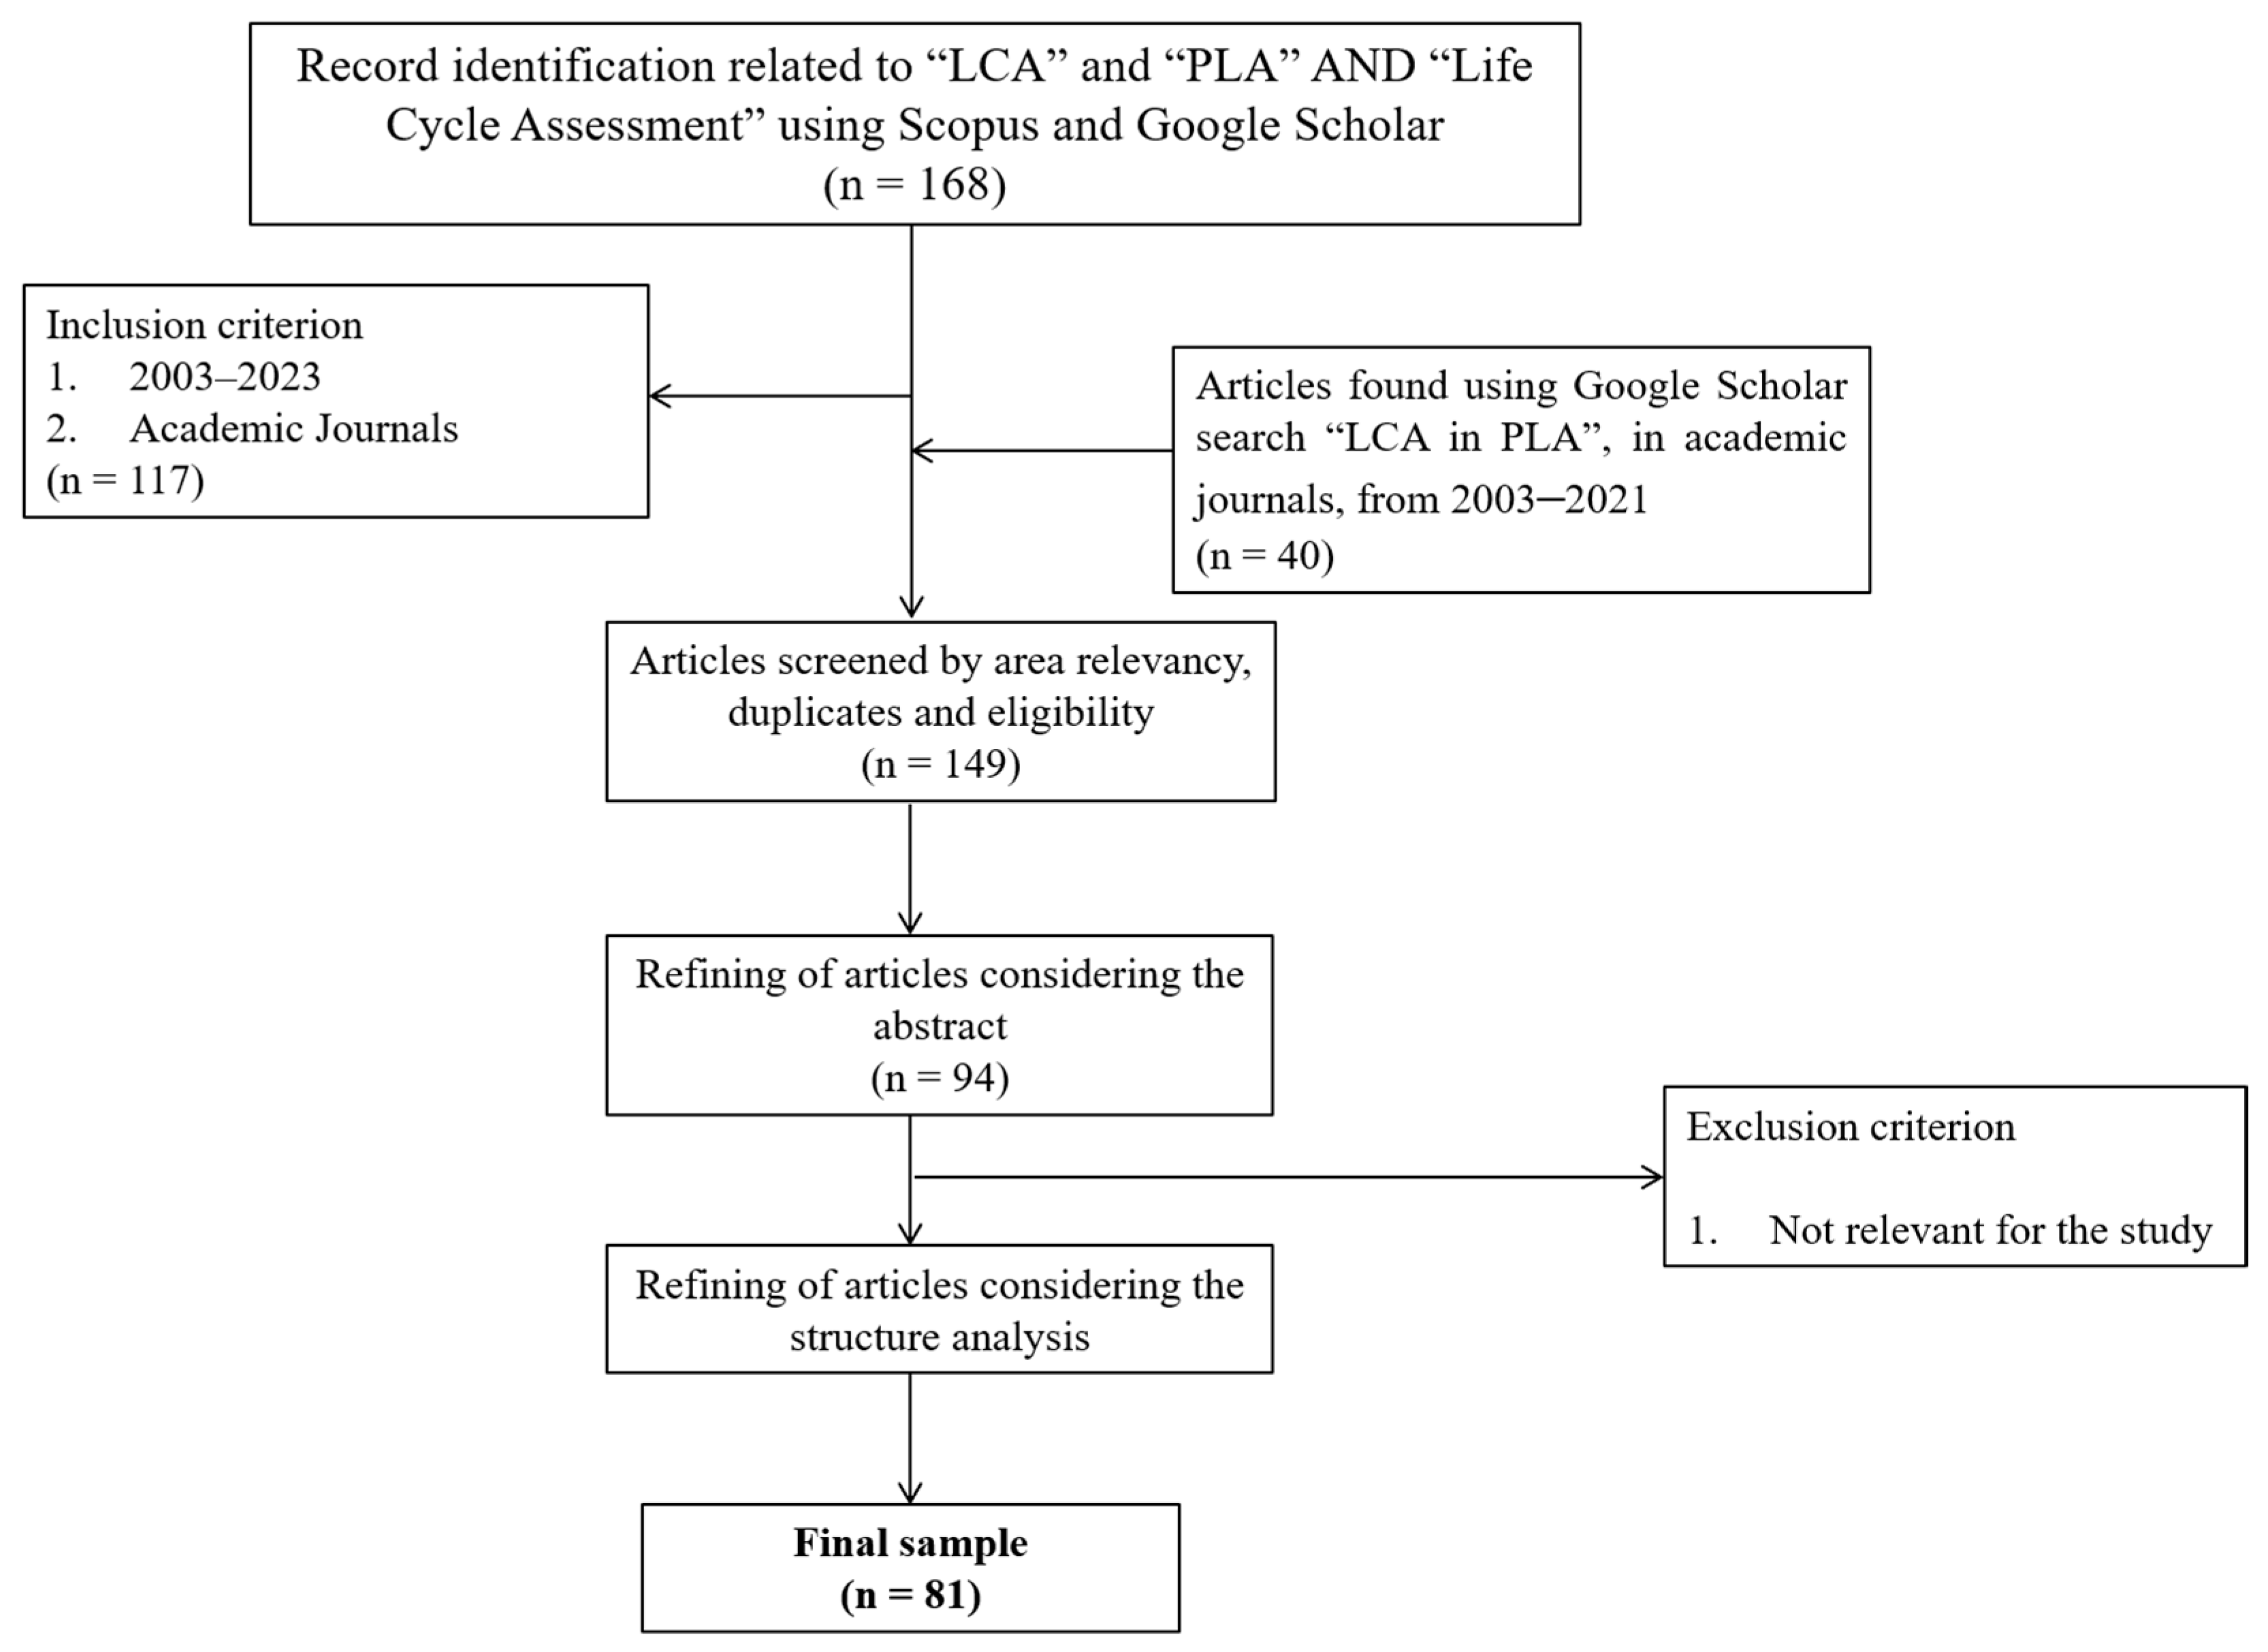
2.1. Bibliographic Research
2.2. Comparison of Environmental Impacts by Impact Category between Different Polymers
3. Results
3.1. Goal and Scope Definition
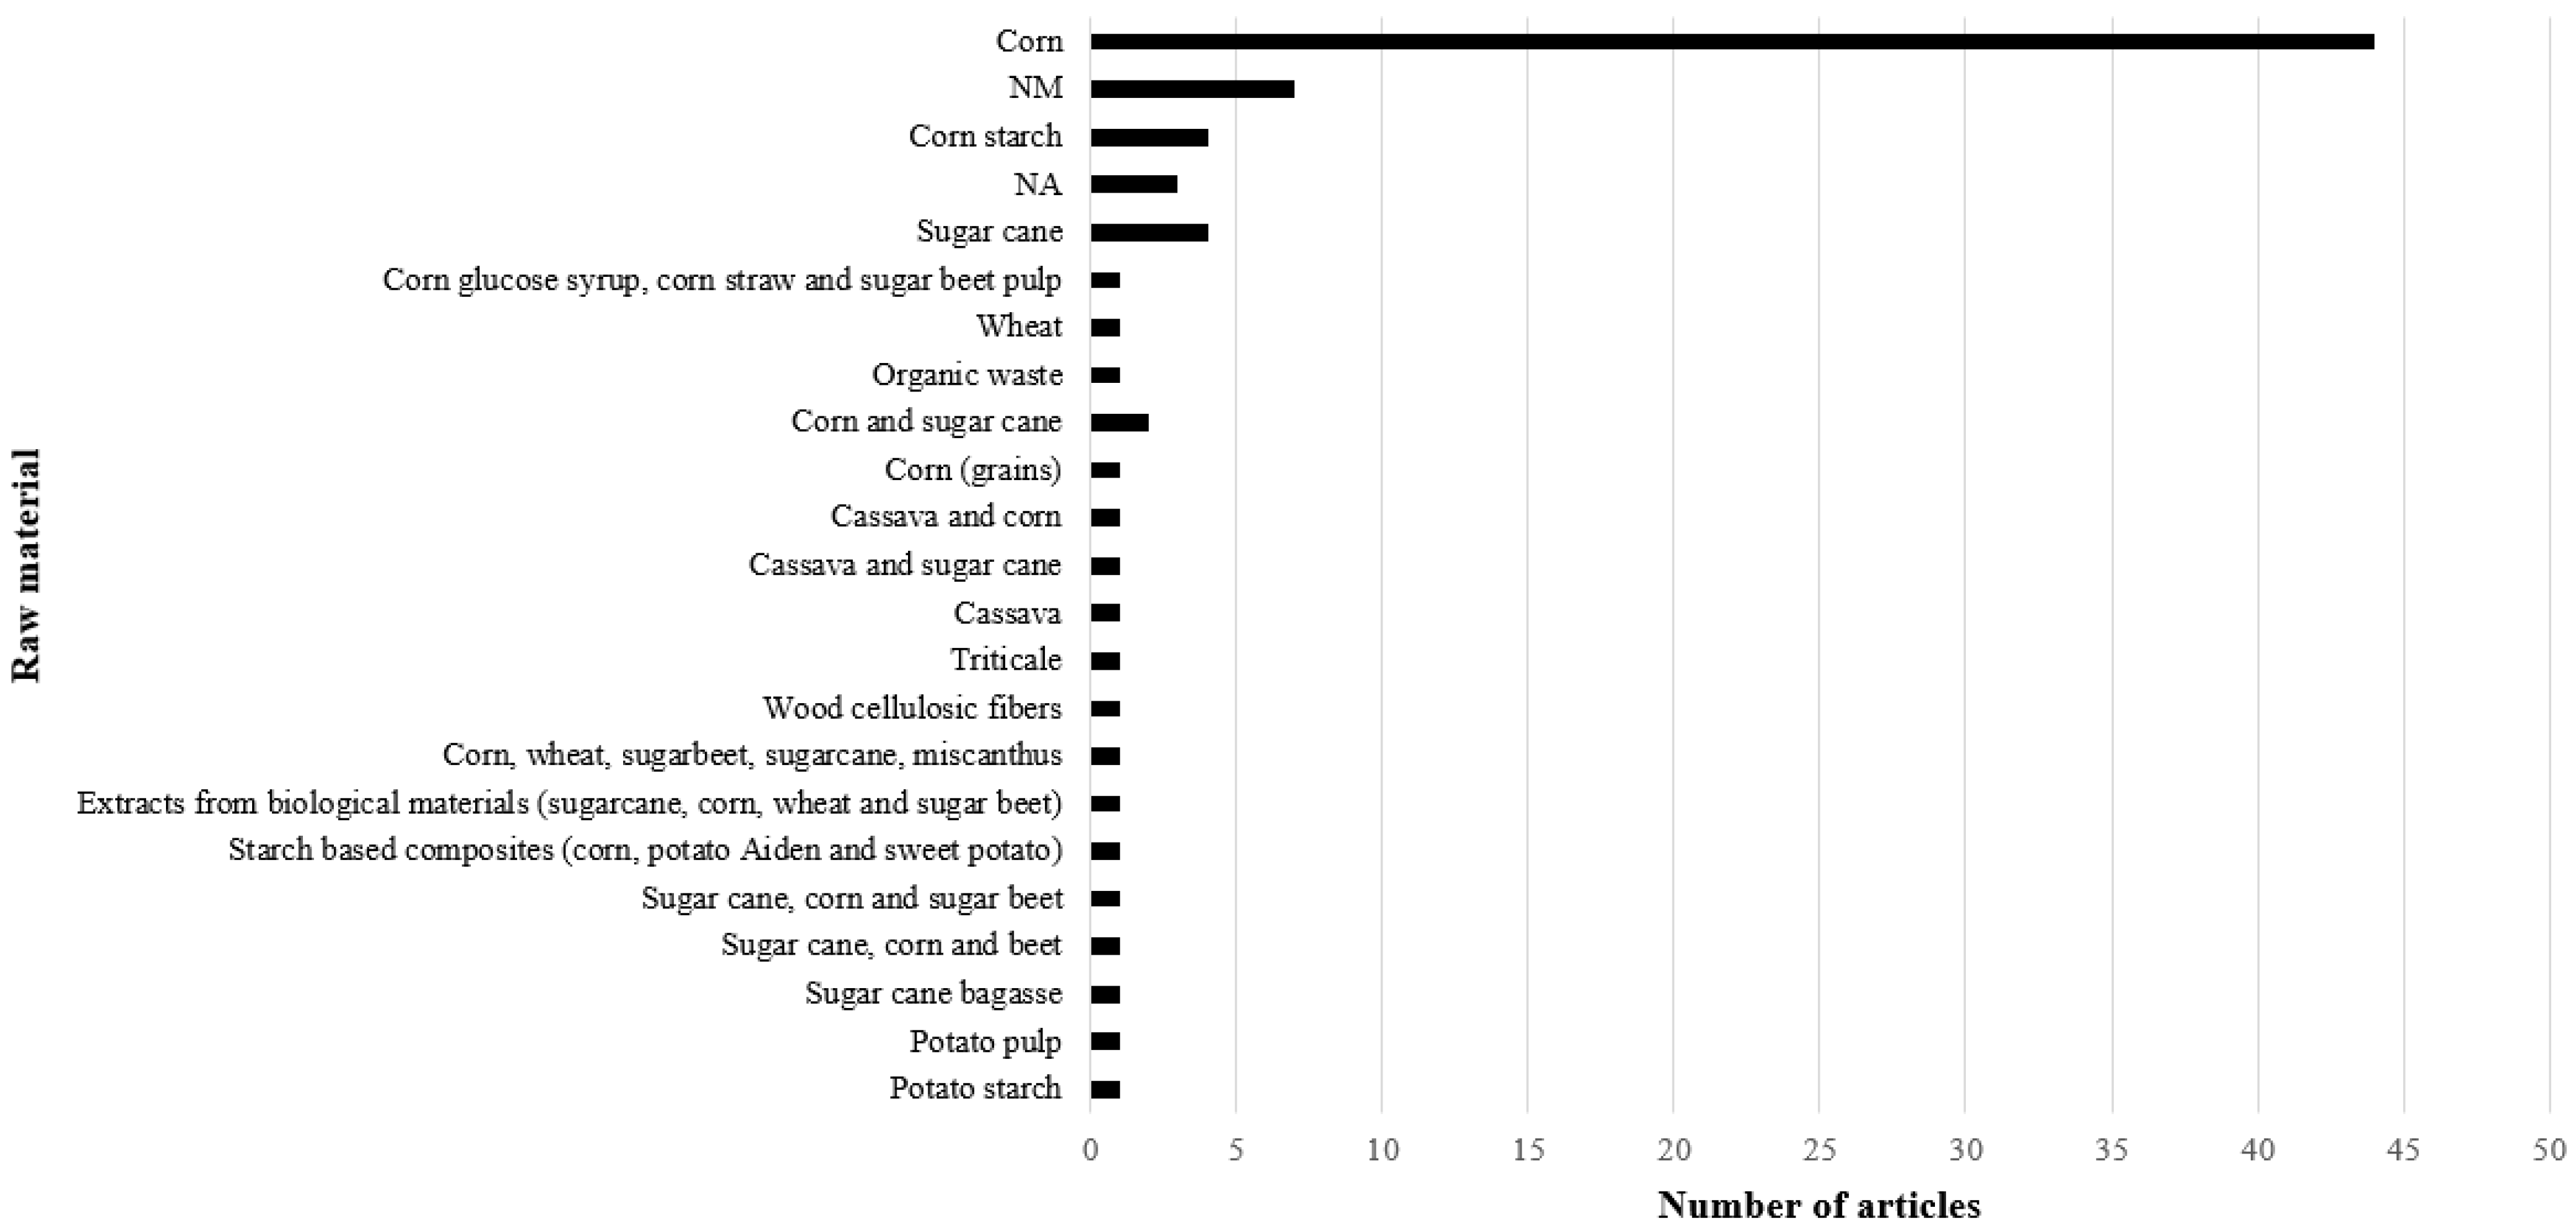
3.2. Life Cycle Inventory
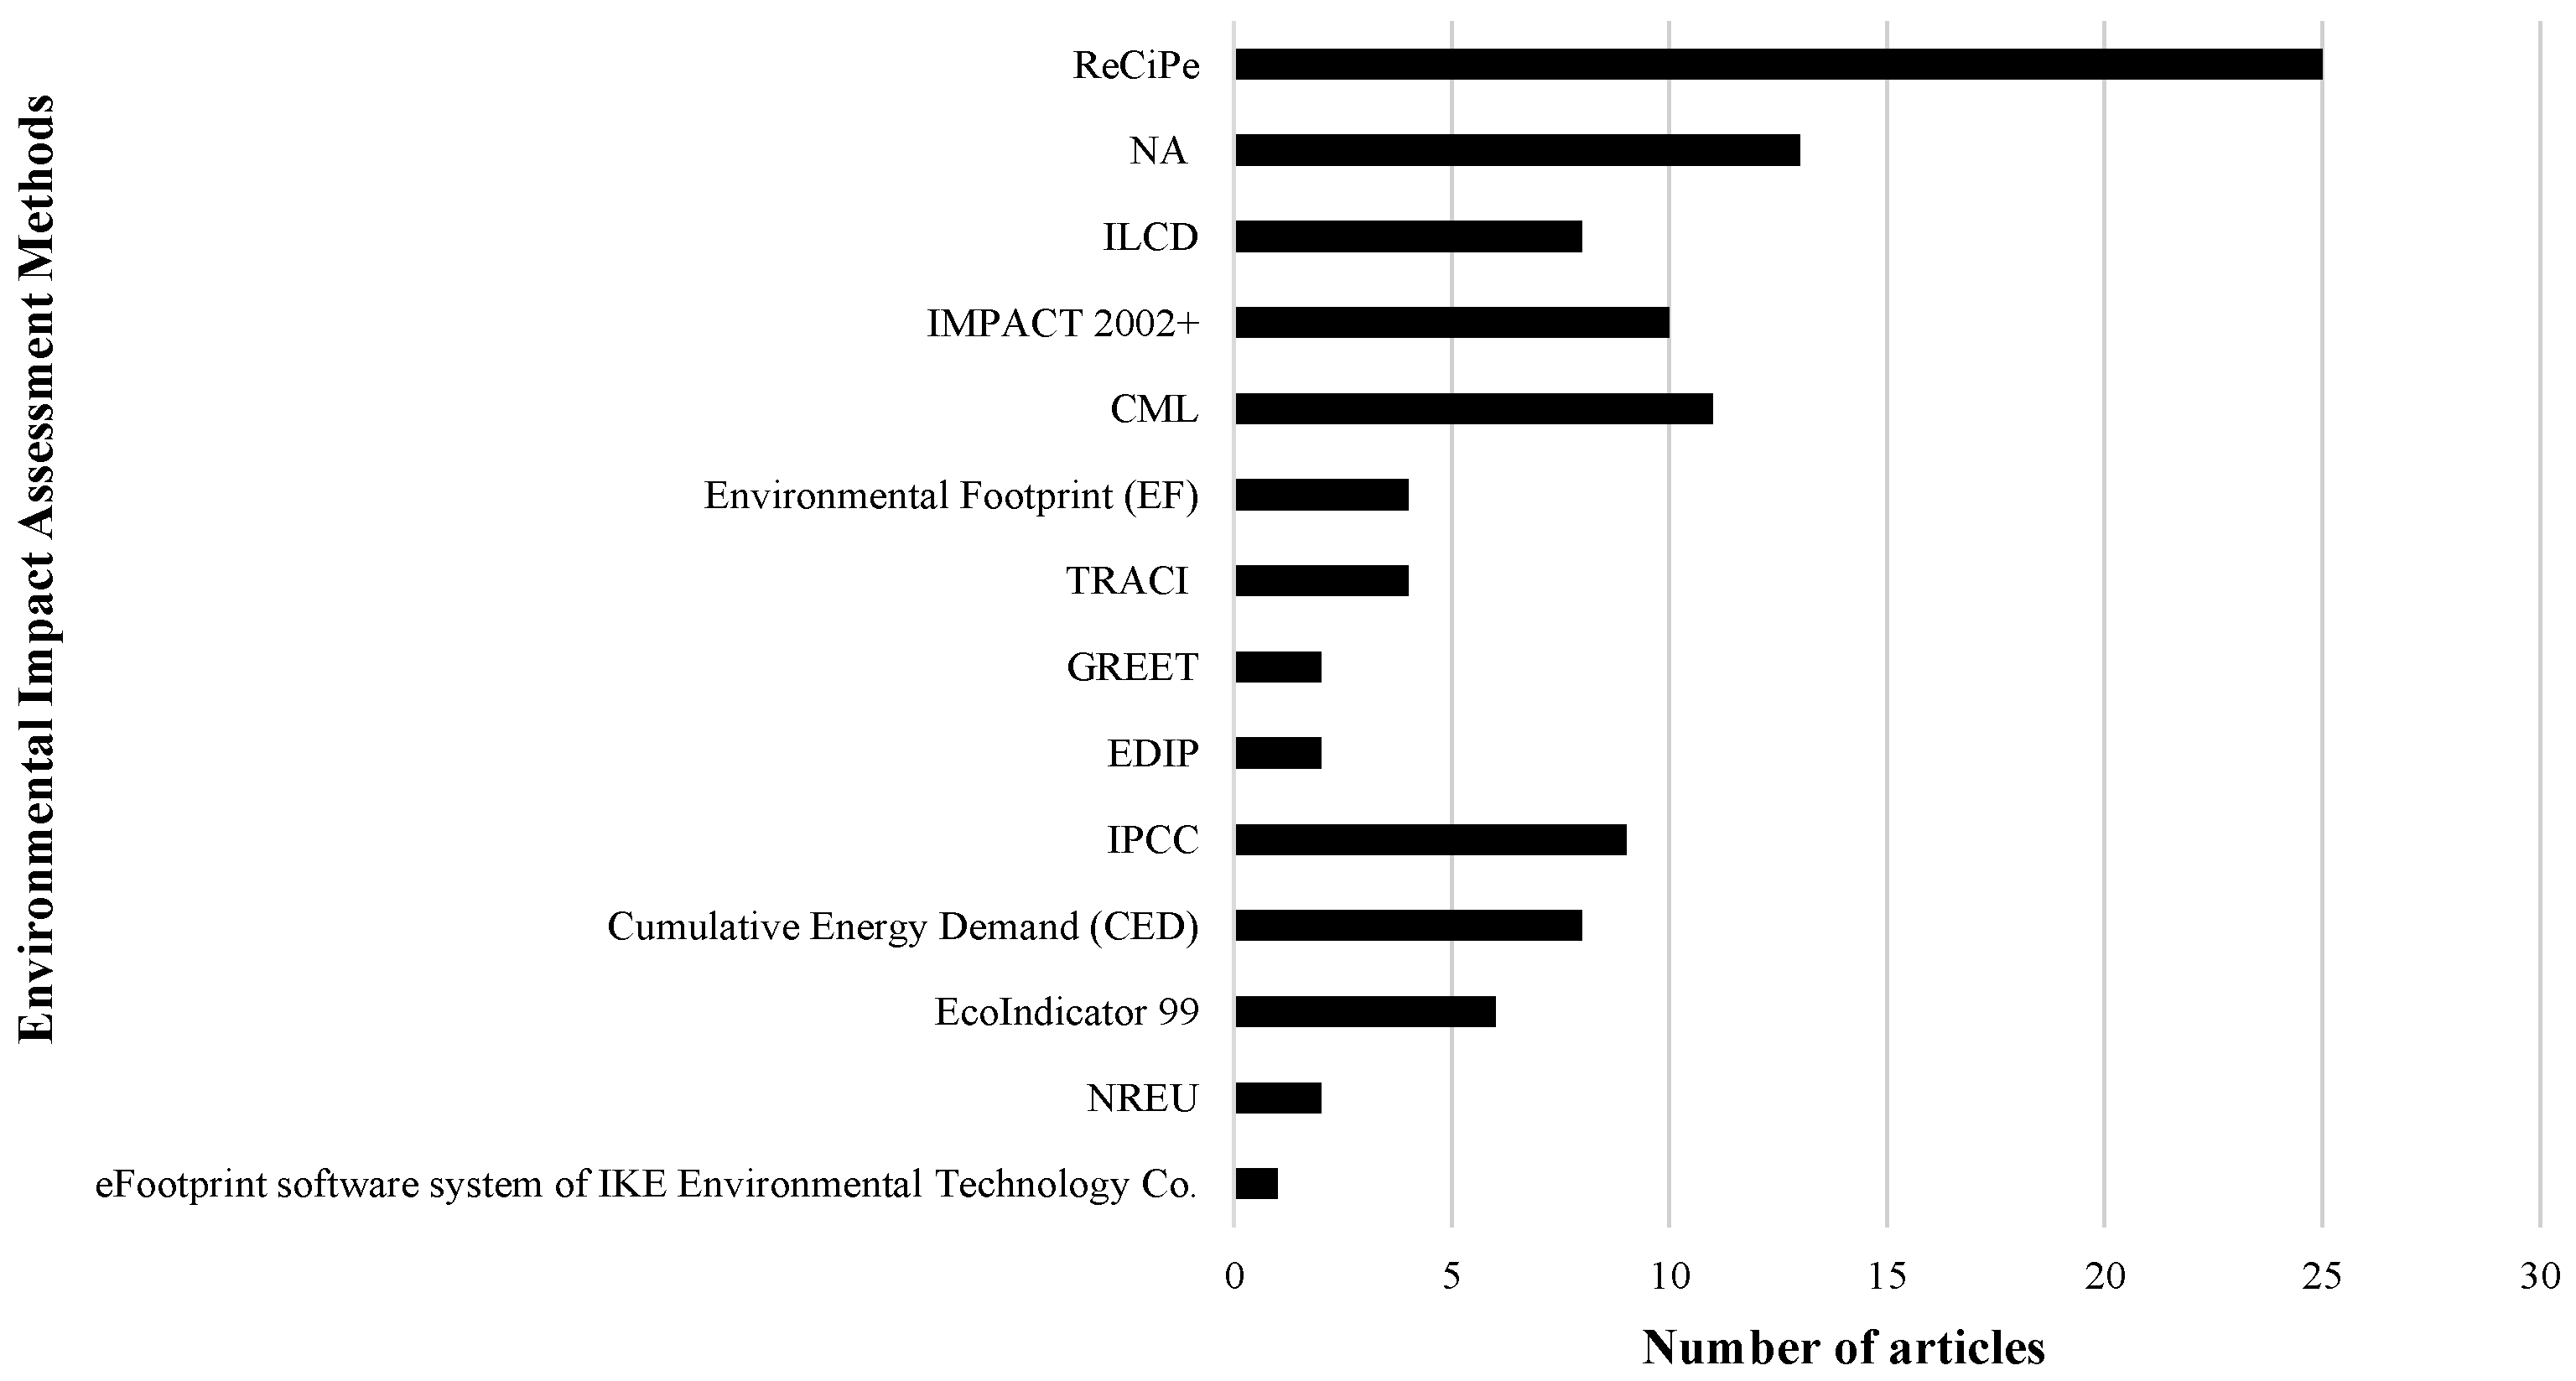
3.3. Life Cycle Impact Assessment
4. Discussion
5. Conclusions
Challenges and Future Work
- Identification of new residual sources of raw materials for the production of PLA. Another no less important aspect is related to the end of life of PLA and to the scientific validation of its biodegradable potential and potential end-of-life applications;
- Definition of Eco-design indicators to address environmental issues and map Eco-design strategies in order to perform an environmental assessment.
Supplementary Materials
Author Contributions
Funding
Data Availability Statement
Acknowledgments
Conflicts of Interest
References
- Tamburini, E.; Costa, S.; Summa, D.; Battistella, L.; Fano, E.A.; Castaldelli, G. Plastic (PET) vs bioplastic (PLA) or refillable aluminium bottles—What is the most sustainable choice for drinking water? A life-cycle (LCA) analysis. Environ. Res. 2021, 196, 110974. [Google Scholar] [CrossRef] [PubMed]
- Trivedi, A.K.; Gupta, M.; Singh, H. PLA based biocomposites for sustainable products: A review. Adv. Ind. Eng. Polym. Res. 2023, in press. [Google Scholar] [CrossRef]
- Moretti, C.; Hamelin, L.; Jakobsen, L.G.; Junginger, M.H.; Steingrimsdottir, M.M.; Høibye, L.; Shen, L. Cradle-to-grave life cycle assessment of single-use cups made from PLA, PP and PET. Resour. Conserv. Recycl. 2021, 169, 105508. [Google Scholar] [CrossRef]
- Rajeshkumar, G.; Seshadri, S.A.; Devnani, G.; Sanjay, M.; Siengchin, S.; Maran, J.P.; Al-Dhabi, N.A.; Karuppiah, P.; Mariadhas, V.A.; Sivarajasekar, N.; et al. Environment friendly, renewable and sustainable poly lactic acid (PLA) based natural fiber reinforced composites—A comprehensive review. J. Clean. Prod. 2021, 310, 127483. [Google Scholar] [CrossRef]
- Hottle, T.A.; Bilec, M.M.; Landis, A.E. Biopolymer production and end of life comparisons using life cycle assessment. Resour. Conserv. Recycl. 2017, 122, 295–306. [Google Scholar] [CrossRef]
- Ali, W.; Ali, H.; Gillani, S.; Zinck, P.; Souissi, S. Polylactic acid synthesis, biodegradability, conversion to microplastics and toxicity: A review. Environ. Chem. Lett. 2023, 21, 1761–1786. [Google Scholar] [CrossRef]
- Ali, S.S.; Abdelkarim, E.A.; Elsamahy, T.; Al-Tohamy, R.; Li, F.; Kornaros, M.; Zuorro, A.; Zhu, D.; Sun, J. Bioplastic production in terms of life cycle assessment: A state-of-the-art review. Environ. Sci. Ecotechnol. 2023, 15, 100254. [Google Scholar] [CrossRef]
- Malek, N.S.A.; Faizuwan, M.; Khusaimi, Z.; Bonnia, N.N.; Rusop, M.; Asli, N.A. Preparation and Characterization of Biodegradable Polylactic Acid (PLA) Film for Food Packaging Application: A Review. J. Phys. Conf. Ser. 2021, 1892, 012037. [Google Scholar] [CrossRef]
- Perera, K.Y.; Jaiswal, A.K.; Jaiswal, S. Biopolymer-Based Sustainable Food Packaging Materials: Challenges, Solutions, and Applications. Foods 2023, 12, 2422. [Google Scholar] [CrossRef]
- Taib, N.-A.A.B.; Rahman, R.; Huda, D.; Kuok, K.K.; Hamdan, S.; Bin Bakri, M.K.; Bin Julaihi, M.R.M.; Khan, A. A review on poly lactic acid (PLA) as a biodegradable polymer. Polym. Bull. 2023, 80, 1179–1213. [Google Scholar] [CrossRef]
- Chalermthai, B.; Giwa, A.; Schmidt, J.E.; Taher, H. Life cycle assessment of bioplastic production from whey protein obtained from dairy residues. Bioresour. Technol. Rep. 2021, 15, 100695. [Google Scholar] [CrossRef]
- Camocho, D.; Henriques, J.; Catarino, J. Diretiva Ecodesign—Documentos de Apoio Às Empresas; Publicação EEN: Lisboa, Portugal, 2016; ISBN 978-989-675-051-0. [Google Scholar]
- 2009/125/EC. Directive 2009/125/EC of the European Parliament and of the Council of 21 October 2009 Establishing a Framework for the Setting of Ecodesign Requirements for Energy-Related Products; Publications Office of the European Union: Luxembourg, 2009. [Google Scholar]
- ISO 14006:2020; Environmental Management Systems—Guidelines for Incorporating Ecodesign. ISO: Geneva, Switzerland, 2020.
- Navajas, A.; Uriarte, L.; Gandía, L.M. Application of Eco-Design and Life Cycle Assessment Standards for Environmental Impact Reduction of an Industrial Product. Sustainability 2017, 9, 1724. [Google Scholar] [CrossRef]
- Heslouin, C.; Perrot-Bernardet, V.; Cornier, A.; Perry, N. A User Oriented Framework to Support Environmental Performance Indicators Selection. Procedia CIRP 2017, 61, 709–714. [Google Scholar] [CrossRef]
- Muralikrishna, I.V.; Manickam, V. Life Cycle Assessment. In Environmental Management; Muralikrishna, I.V., Manickam, V., Eds.; Elsevier: Amsterdam, The Netherlands, 2017; pp. 57–75. ISBN 978-0-12-811989-1. [Google Scholar]
- Standard ISO 14040; Environmental Management—Life Cycle Assessment—Principles and Framework, 2nd ed. International Standard Organization: Geneva, Switzerland, 2006.
- Standard ISO 14044; Environmental Management—Life Cycle Assessment—Requirements and Guidelines, 1st ed. International Standard Organization: Geneva, Switzerland, 2006.
- Ghomi, E.R.; Khosravi, F.; Ardahaei, A.S.; Dai, Y.; Neisiany, R.E.; Foroughi, F.; Wu, M.; Das, O.; Ramakrishna, S. The Life Cycle Assessment for Polylactic Acid (PLA) to Make It a Low-Carbon Material. Polymers 2021, 13, 1854. [Google Scholar] [CrossRef]
- Madival, S.; Auras, R.; Singh, S.P.; Narayan, R. Assessment of the environmental profile of PLA, PET and PS clamshell containers using LCA methodology. J. Clean. Prod. 2009, 17, 1183–1194. [Google Scholar] [CrossRef]
- Maga, D.; Hiebel, M.; Thonemann, N. Life cycle assessment of recycling options for polylactic acid. Resour. Conserv. Recycl. 2019, 149, 86–96. [Google Scholar] [CrossRef]
- Ioannidou, S.M.; Ladakis, D.; Moutousidi, E.; Dheskali, E.; Kookos, I.K.; Câmara-Salim, I.; Moreira, M.T.; Koutinas, A. Techno-economic risk assessment, life cycle analysis and life cycle costing for poly(butylene succinate) and poly(lactic acid) production using renewable resources. Sci. Total Environ. 2021, 806, 150594. [Google Scholar] [CrossRef]
- Guo, X.; Yao, Y.; Zhao, H.; Chi, C.; Zeng, F.; Qian, F.; Liu, Z.; Huo, L.; Lv, Y. Environmental impacts of functional fillers in polylactide (PLA)-based bottles using life cycle assessment methodology. Sci. Total Environ. 2021, 788, 147852. [Google Scholar] [CrossRef]
- Cottafava, D.; Costamagna, M.; Baricco, M.; Corazza, L.; Miceli, D.; Riccardo, L.E. Assessment of the environmental break-even point for deposit return systems through an LCA analysis of single-use and reusable cups. Sustain. Prod. Consum. 2021, 27, 228–241. [Google Scholar] [CrossRef]
- Munagala, M.; Shastri, Y.; Nalawade, K.; Konde, K.; Patil, S. Life cycle and economic assessment of sugarcane bagasse valorization to lactic acid. Waste Manag. 2021, 126, 52–64. [Google Scholar] [CrossRef]
- Cañado, N.; Lizundia, E.; Akizu-Gardoki, O.; Minguez, R.; Lekube, B.; Arrillaga, A.; Iturrondobeitia, M. 3D printing to enable the reuse of marine plastic waste with reduced environmental impacts. J. Ind. Ecol. 2022, 26, 2092–2107. [Google Scholar] [CrossRef]
- Rojas-Bringas, P.M.; De-La-Torre, G.E.; Torres, F.G. Influence of the source of starch and plasticizers on the environmental burden of starch-Brazil nut fiber biocomposite production: A life cycle assessment approach. Sci. Total Environ. 2021, 769, 144869. [Google Scholar] [CrossRef] [PubMed]
- Cappiello, G.; Aversa, C.; Genovesi, A.; Barletta, M. Life cycle assessment (LCA) of bio-based packaging solutions for extended shelf-life (ESL) milk. Environ. Sci. Pollut. Res. 2022, 29, 18617–18628. [Google Scholar] [CrossRef] [PubMed]
- Bałdowska-Witos, P.; Piasecka, I.; Flizikowski, J.; Tomporowski, A.; Idzikowski, A.; Zawada, M. Life Cycle Assessment of Two Alternative Plastics for Bottle Production. Materials 2021, 14, 4552. [Google Scholar] [CrossRef]
- Peydayesh, M.; Bagnani, M.; Mezzenga, R. Sustainable Bioplastics from Amyloid Fibril-Biodegradable Polymer Blends. ACS Sustain. Chem. Eng. 2021, 9, 11916–11926. [Google Scholar] [CrossRef]
- Maga, D.; Hiebel, M.; Aryan, V. A Comparative Life Cycle Assessment of Meat Trays Made of Various Packaging Materials. Sustainability 2019, 11, 5324. [Google Scholar] [CrossRef]
- Rybaczewska-Błażejowska, M.; Mena-Nieto, A. Circular economy: Comparative life cycle assessment of fossil polyethylene terephthalate (PET)and its recycled and bio-based counterparts. Manag. Prod. Eng. Rev. 2020, 11, 121–128. [Google Scholar] [CrossRef]
- Morão, A.; de Bie, F. Life Cycle Impact Assessment of Polylactic Acid (PLA) Produced from Sugarcane in Thailand. J. Polym. Environ. 2019, 27, 2523–2539. [Google Scholar] [CrossRef]
- Aryan, V.; Maga, D.; Majgaonkar, P.; Hanich, R. Valorisation of polylactic acid (PLA) waste: A comparative life cycle assessment of various solvent-based chemical recycling technologies. Resour. Conserv. Recycl. 2021, 172, 105670. [Google Scholar] [CrossRef]
- Bałdowska-Witos, P.; Kruszelnicka, W.; Kasner, R.; Tomporowski, A.; Flizikowski, J.; Kłos, Z.; Piotrowska, K.; Markowska, K. Application of LCA Method for Assessment of Environmental Impacts of a Polylactide (PLA) Bottle Shaping. Polymers 2020, 12, 388. [Google Scholar] [CrossRef]
- Gironi, F.; Piemonte, V. Life cycle assessment of polylactic acid and polyethylene terephthalate bottles for drinking water. Environ. Prog. Sustain. Energy 2011, 30, 459–468. [Google Scholar] [CrossRef]
- Chen, W.; Oldfield, T.L.; Cinelli, P.; Righetti, M.C.; Holden, N.M. Hybrid life cycle assessment of potato pulp valorisation in biocomposite production. J. Clean. Prod. 2020, 269, 122366. [Google Scholar] [CrossRef]
- Bishop, G.; Styles, D.; Lens, P.N. Land-use change and valorisation of feedstock side-streams determine the climate mitigation potential of bioplastics. Resour. Conserv. Recycl. 2022, 180, 106185. [Google Scholar] [CrossRef]
- Qiu, H.; Hu, B.; Zhang, Z. Impacts of land use change on ecosystem service value based on SDGs report—Taking Guangxi as an example. Ecol. Indic. 2021, 133, 108366. [Google Scholar] [CrossRef]
- Mohr, A.; Raman, S. Lessons from first generation biofuels and implications for the sustainability appraisal of second generation biofuels. Energy Policy 2013, 63, 114–122. [Google Scholar] [CrossRef]
- Kiemel, S.; Rietdorf, C.; Schutzbach, M.; Miehe, R. How to Simplify Life Cycle Assessment for Industrial Applications—A Comprehensive Review. Sustainability 2022, 14, 15704. [Google Scholar] [CrossRef]
- Iswara, A.P.; Farahdiba, A.U.; Nadhifatin, E.N.; Pirade, F.; Andhikaputra, G.; Muflihah, I.; Boedisantoso, R. A Comparative Study of Life Cycle Impact Assessment using Different Software Programs. IOP Conf. Ser. Earth Environ. Sci. 2020, 506, 012002. [Google Scholar] [CrossRef]
- Huijbregts, M.A.J.; Steinmann, Z.J.N.; Elshout, P.M.F.; Stam, G.; Verones, F.; Vieira, M.; Zijp, M.; Hollander, A.; van Zelm, R. ReCiPe2016: A harmonised life cycle impact assessment method at midpoint and endpoint level. Int. J. Life Cycle Assess. 2017, 22, 138–147. [Google Scholar] [CrossRef]
- Kaswan, M.S.; Rathi, R. Investigation of life cycle assessment barriers for sustainable development in manufacturing using grey relational analysis and best worst method. Int. J. Sustain. Eng. 2021, 14, 672–685. [Google Scholar] [CrossRef]
- Kim, S.J.; Kara, S.; Hauschild, M. Functional unit and product functionality—Addressing increase in consumption and demand for functionality in sustainability assessment with LCA. Int. J. Life Cycle Assess. 2017, 22, 1257–1265. [Google Scholar] [CrossRef]
- Gomes, T.S.; Visconte, L.L.Y.; Pacheco, E.B.A.V. Life Cycle Assessment of Polyethylene Terephthalate Packaging: An Overview. J. Polym. Environ. 2019, 27, 533–548. [Google Scholar] [CrossRef]
- Poulikakos, L.D.; Papadaskalopoulou, C.; Hofko, B.; Gschösser, F.; Falchetto, A.C.; Bueno, M.; Arraigada, M.; Sousa, J.; Ruiz, R.; Petit, C.; et al. Harvesting the unexplored potential of European waste materials for road construction. Resour. Conserv. Recycl. 2017, 116, 32–44. [Google Scholar] [CrossRef]
- Bałdowska-Witos, P.; Idzikowski, U. Ecological Analysis of Selected Stages of the Food Packaging Production Process. Syst. Saf. Hum.-Tech. Facil.-Environ. 2021, 3, 152–161. [Google Scholar] [CrossRef]
- Benetto, E.; Jury, C.; Igos, E.; Carton, J.; Hild, P.; Vergne, C.; Di Martino, J. Using atmospheric plasma to design multilayer film from polylactic acid and thermoplastic starch: A screening Life Cycle Assessment. J. Clean. Prod. 2015, 87, 953–960. [Google Scholar] [CrossRef]
- Bishop, G.; Styles, D.; Lens, P.N. Environmental performance of bioplastic packaging on fresh food produce: A consequential life cycle assessment. J. Clean. Prod. 2021, 317, 128377. [Google Scholar] [CrossRef]
- David, G.; Vega, G.C.; Sohn, J.; Nilsson, A.E.; Hélias, A.; Gontard, N.; Angellier-Coussy, H. Using life cycle assessment to quantify the environmental benefit of upcycling vine shoots as fillers in biocomposite packaging materials. Int. J. Life Cycle Assess. 2021, 26, 738–752. [Google Scholar] [CrossRef]
- Deng, Y.; Achten, W.M.; Van Acker, K.; Duflou, J.R. Life cycle assessment of wheat gluten powder and derived packaging film. Biofuels Bioprod. Biorefin. 2013, 7, 429–458. [Google Scholar] [CrossRef]
- Desole, M.P.; Aversa, C.; Barletta, M.; Gisario, A.; Vosooghnia, A. Life cycle assessment (LCA) of PET and PLA bottles for the packaging of fresh pasteurised milk: The role of the manufacturing process and the disposal scenario. Packag. Technol. Sci. 2022, 35, 135–152. [Google Scholar] [CrossRef]
- Hobbs, S.R.; Harris, T.M.; Barr, W.J.; Landis, A.E. Life Cycle Assessment of Bioplastics and Food Waste Disposal Methods. Sustainability 2021, 13, 6894. [Google Scholar] [CrossRef]
- Mahalle, L.; Alemdar, A.; Mihai, M.; Legros, N. A cradle-to-gate life cycle assessment of wood fibre-reinforced polylactic acid (PLA) and polylactic acid/thermoplastic starch (PLA/TPS) biocomposites. Int. J. Life Cycle Assess. 2014, 19, 1305–1315. [Google Scholar] [CrossRef]
- Moutousidi, E.S.; Kookos, I.K. Life cycle assessment of biobased chemicals from different agricultural feedstocks. J. Clean. Prod. 2021, 323, 129201. [Google Scholar] [CrossRef]
- Moy, C.-H.; Tan, L.-S.; Shoparwe, N.F.; Shariff, A.M.; Tan, J. Comparative Study of a Life Cycle Assessment for Bio-Plastic Straws and Paper Straws: Malaysia’s Perspective. Processes 2021, 9, 1007. [Google Scholar] [CrossRef]
- Nejad, B.F.; Smyth, B.; Bolaji, I.; Mehta, N.; Billham, M.; Cunningham, E. Carbon and energy footprints of high-value food trays and lidding films made of common bio-based and conventional packaging materials. Clean. Environ. Syst. 2021, 3, 100058. [Google Scholar] [CrossRef]
- Papong, S.; Malakul, P.; Trungkavashirakun, R.; Wenunun, P.; Chom-In, T.; Nithitanakul, M.; Sarobol, E. Comparative assessment of the environmental profile of PLA and PET drinking water bottles from a life cycle perspective. J. Clean. Prod. 2014, 65, 539–550. [Google Scholar] [CrossRef]
- Piemonte, V. Bioplastic Wastes: The Best Final Disposition for Energy Saving. J. Polym. Environ. 2011, 19, 988–994. [Google Scholar] [CrossRef]
- Rodriguez, L.J.; Fabbri, S.; Orrego, C.E.; Owsianiak, M. Comparative life cycle assessment of coffee jar lids made from biocomposites containing poly(lactic acid) and banana fiber. J. Environ. Manag. 2020, 266, 110493. [Google Scholar] [CrossRef]
- Rodríguez, L.J.; Ospina, S.; Ribeiro, I.; Peças, P.; Orrego, C.E. Banana fibre-biocomposite applied to bottle lid case—Life-cycle engineering model for material selection. Int. J. Sustain. Eng. 2021, 14, 1181–1192. [Google Scholar] [CrossRef]
- Roy, P.; Ashton, L.; Wang, T.; Corradini, M.G.; Fraser, E.D.; Thimmanagari, M.; Tiessan, M.; Bali, A.; Saharan, K.M.; Mohanty, A.K.; et al. Evolution of drinking straws and their environmental, economic and societal implications. J. Clean. Prod. 2021, 316, 128234. [Google Scholar] [CrossRef]
- Schwarz, A.E.; Ligthart, T.N.; Bizarro, D.G.; De Wild, P.; Vreugdenhil, B.; van Harmelen, T. Plastic recycling in a circular economy; determining environmental performance through an LCA matrix model approach. Waste Manag. 2021, 121, 331–342. [Google Scholar] [CrossRef]
- Tonini, D.; Schrijvers, D.; Nessi, S.; Garcia-Gutierrez, P.; Giuntoli, J. Carbon footprint of plastic from biomass and recycled feedstock: Methodological insights. Int. J. Life Cycle Assess. 2021, 26, 221–237. [Google Scholar] [CrossRef]
- Vigil, M.; Pedrosa-Laza, M.; Cabal, J.A.; Ortega-Fernández, F. Sustainability Analysis of Active Packaging for the Fresh Cut Vegetable Industry by Means of Attributional & Consequential Life Cycle Assessment. Sustainability 2020, 12, 7207. [Google Scholar] [CrossRef]
- Vink, E.T.H.; Rábago, K.R.; Glassner, D.A.; Gruber, P.R. Applications of life cycle assessment to NatureWorks™ polylactide (PLA) production. Polym. Degrad. Stab. 2003, 80, 403–419. [Google Scholar] [CrossRef]
- Zhu, X.; Tian, Y.; Wang, S. Comparing two types of mainstream disposable lunch boxes by LCA and exploring the possibility of converting carbon dioxide into products. Heliyon 2023, 9, e13480. [Google Scholar] [CrossRef]
- Leejarkpai, T.; Tawkaew, S.; Chuichulcherm, S.; Suwanmanee, U. Comparative Assessment of the Greenhouse Gas Emission and Land Use Capacity of Plastics Waste in Thailand. Chem. Eng. Trans. 2022, 91, 409–414. [Google Scholar] [CrossRef]
- Fico, D.; Rizzo, D.; De Carolis, V.; Montagna, F.; Palumbo, E.; Corcione, C.E. Development and characterization of sustainable PLA/Olive wood waste composites for rehabilitation applications using Fused Filament Fabrication (FFF). J. Build. Eng. 2022, 56, 104673. [Google Scholar] [CrossRef]
- Zhao, M.; Yang, Z.; Zhao, J.; Wang, Y.; Ma, X.; Guo, J. Life Cycle Assessment of Biodegradable Polylactic Acid (PLA) Plastic Packaging Products—Taking Tianjin, China as a Case Study. J. Resour. Ecol. 2022, 13, 428–441. [Google Scholar] [CrossRef]
- Gao, A.L.; Wan, Y. Life cycle assessment of environmental impact of disposable drinking straws: A trade-off analysis with marine litter in the United States. Sci. Total Environ. 2022, 817, 153016. [Google Scholar] [CrossRef]
- Kamalakkannan, S.; Abeynayaka, A.; Kulatunga, A.K.; Singh, R.K.; Tatsuno, M.; Gamaralalage, P.J.D. Life Cycle Assessment of Selected Single-Use Plastic Products towards Evidence-Based Policy Recommendations in Sri Lanka. Sustainability 2022, 14, 14170. [Google Scholar] [CrossRef]
- Michaliszyn-Gabryś, B.; Krupanek, J.; Kalisz, M.; Smith, J. Challenges for Sustainability in Packaging of Fresh Vegetables in Organic Farming. Sustainability 2022, 14, 5346. [Google Scholar] [CrossRef]
- Machado, N.M.P.; Melo, G.C.; Camargo, M.F.; Steffens, C.; Cansian, R.L.; Pessan, L.A.; Moreira, F.K.V. Melt Extrusion of Environmentally Friendly Poly(L-lactic acid)/Sodium Metabisulfite Films for Antimicrobial Packaging Applications. J. Renew. Mater. 2020, 9, 337–349. [Google Scholar] [CrossRef]
- Benavides, P.T.; Lee, U.; Zarè-Mehrjerdi, O. Life cycle greenhouse gas emissions and energy use of polylactic acid, bio-derived polyethylene, and fossil-derived polyethylene. J. Clean. Prod. 2020, 277, 124010. [Google Scholar] [CrossRef]
- de Oliveira, S.A.; de Macedo, J.R.N.; Rosa, D.d.S. Eco-efficiency of poly (lactic acid)-Starch-Cotton composite with high natural cotton fiber content: Environmental and functional value. J. Clean. Prod. 2019, 217, 32–41. [Google Scholar] [CrossRef]
- Choi, B.; Yoo, S.; Park, S.-I. Carbon Footprint of Packaging Films Made from LDPE, PLA, and PLA/PBAT Blends in South Korea. Sustainability 2018, 10, 2369. [Google Scholar] [CrossRef]
- Zhao, P.; Rao, C.; Gu, F.; Sharmin, N.; Fu, J. Close-looped recycling of polylactic acid used in 3D printing: An experimental investigation and life cycle assessment. J. Clean. Prod. 2018, 197, 1046–1055. [Google Scholar] [CrossRef]
- Haylock, R.; Rosentrater, K.A. Cradle-to-Grave Life Cycle Assessment and Techno-Economic Analysis of Polylactic Acid Composites with Traditional and Bio-Based Fillers. J. Polym. Environ. 2018, 26, 1484–1503. [Google Scholar] [CrossRef]
- Changwichan, K.; Silalertruksa, T.; Gheewala, S.H. Eco-Efficiency Assessment of Bioplastics Production Systems and End-of-Life Options. Sustainability 2018, 10, 952. [Google Scholar] [CrossRef]
- Molins, G.; Álvarez, M.D.; Garrido, N.; Macanás, J.; Carrillo, F. Environmental Impact Assessment of Polylactide(PLA)/Chicken Feathers Biocomposite Materials. J. Polym. Environ. 2018, 26, 873–884. [Google Scholar] [CrossRef]
- Horowitz, N.; Frago, J.; Mu, D. Life cycle assessment of bottled water: A case study of Green2O products. Waste Manag. 2018, 76, 734–743. [Google Scholar] [CrossRef]
- Liard, G.; Lesage, P.; Samson, R.; Stuart, P.R. Systematic assessment of triticale-based biorefinery strategies: Environmental evaluation using life cycle assessment. Biofuels Bioprod. Biorefin. 2018, 12, S60–S72. [Google Scholar] [CrossRef]
- Ingrao, C.; Gigli, M.; Siracusa, V. An attributional Life Cycle Assessment application experience to highlight environmental hotspots in the production of foamy polylactic acid trays for fresh-food packaging usage. J. Clean. Prod. 2017, 150, 93–103. [Google Scholar] [CrossRef]
- Cinelli, P.; Coltelli, M.; Mallegni, N.; Morganti, P.; Lazzeri, A. Degradability and sustainability of nanocomposites based on polylactic acid and chitin nano fibrils. Chem. Eng. Trans. 2017, 60, 115–120. [Google Scholar] [CrossRef]
- Lorite, G.S.; Rocha, J.M.; Miilumäki, N.; Saavalainen, P.; Selkälä, T.; Morales-Cid, G.; Gonçalves, M.; Pongrácz, E.; Rocha, C.M.; Toth, G. Evaluation of physicochemical/microbial properties and life cycle assessment (LCA) of PLA-based nanocomposite active packaging. LWT 2016, 75, 305–315. [Google Scholar] [CrossRef]
- Posen, I.D.; Jaramillo, P.; Landis, A.E.; Griffin, W.M. Greenhouse gas mitigation for U.S. plastics production: Energy first, feedstocks later. Environ. Res. Lett. 2017, 12, 034024. [Google Scholar] [CrossRef]
- Leejarkpai, T.; Mungcharoen, T.; Suwanmanee, U. Comparative assessment of global warming impact and eco-efficiency of PS (polystyrene), PET (polyethylene terephthalate) and PLA (polylactic acid) boxes. J. Clean. Prod. 2016, 125, 95–107. [Google Scholar] [CrossRef]
- de Andrade, M.F.C.; Souza, P.M.S.; Cavalett, O.; Morales, A.R. Life Cycle Assessment of Poly(Lactic Acid) (PLA): Comparison Between Chemical Recycling, Mechanical Recycling and Composting. J. Polym. Environ. 2016, 24, 372–384. [Google Scholar] [CrossRef]
- Nikoliae, S.; Kiss, F.; Mladenoviae, V.; Bukurov, M.; Stankoviae, J. Corn-Based Polylactide vs. PET Bottles—Cradle-to-Gate LCA and Implications. Mater. Plast. 2015, 52, 517–521. [Google Scholar]
- Potting, J.; van der Harst, E. Facility Arrangements and the Environmental Performance of Disposable and Reusable Cups. Int. J. Life Cycle Assess. 2015, 20, 1143–1154. [Google Scholar] [CrossRef]
- Girgenti, V.; Peano, C.; Baudino, C.; Tecco, N. From “farm to fork” strawberry system: Current realities and potential innovative scenarios from life cycle assessment of non-renewable energy use and green house gas emissions. Sci. Total Environ. 2014, 473–474, 48–53. [Google Scholar] [CrossRef]
- van der Harst, E.; Potting, J.; Kroeze, C. Multiple data sets and modelling choices in a comparative LCA of disposable beverage cups. Sci. Total Environ. 2014, 494–495, 129–143. [Google Scholar] [CrossRef]
- Renouf, M.A.; Pagan, R.J.; Wegener, M.K. Bio-production from Australian sugarcane: An environmental investigation of product diversification in an agro-industry. J. Clean. Prod. 2013, 39, 87–96. [Google Scholar] [CrossRef]
- Mirabella, N.; Castellani, V.; Sala, S. Life cycle assessment of bio-based products: A disposable diaper case study. Int. J. Life Cycle Assess. 2013, 18, 1036–1047. [Google Scholar] [CrossRef]
- Suwanmanee, U.; Varabuntoonvit, V.; Chaiwutthinan, P.; Tajan, M.; Mungcharoen, T.; Leejarkpai, T. Life cycle assessment of single use thermoform boxes made from polystyrene (PS), polylactic acid, (PLA), and PLA/starch: Cradle to consumer gate. Int. J. Life Cycle Assess. 2013, 18, 401–417. [Google Scholar] [CrossRef]
- Bos, H.L.; Meesters, K.P.H.; Conijn, S.G.; Corré, W.J.; Patel, M.K. Accounting for the constrained availability of land: A comparison of bio-based ethanol, polyethylene, and PLA with regard to non-renewable energy use and land use. Biofuels Bioprod. Biorefin. 2012, 6, 146–158. [Google Scholar] [CrossRef]
- Hermann, B.; Debeer, L.; De Wilde, B.; Blok, K.; Patel, M. To compost or not to compost: Carbon and energy footprints of biodegradable materials’ waste treatment. Polym. Degrad. Stab. 2011, 96, 1159–1171. [Google Scholar] [CrossRef]
- Gironi, F.; Piemonte, V. Bioplastics disposal: How to manage it. WIT Trans. Ecol. Environ. 2010, 140, 261–271. [Google Scholar] [CrossRef]
- Hermann, B.G.; Blok, K.; Patel, M.K. Twisting biomaterials around your little finger: Environmental impacts of bio-based wrappings. Int. J. Life Cycle Assess. 2010, 15, 346–358. [Google Scholar] [CrossRef]
- Groot, W.J.; Borén, T. Life cycle assessment of the manufacture of lactide and PLA biopolymers from sugarcane in Thailand. Int. J. Life Cycle Assess. 2010, 15, 970–984. [Google Scholar] [CrossRef]
- Vidal, R.; Martínez, P.; Mulet, E.; González, R.; López-Mesa, B.; Fowler, P.; Fang, J.M. Environmental assessment of biodegradable multilayer film derived from carbohydrate polymers. J. Polym. Environ. 2007, 15, 159–168. [Google Scholar] [CrossRef]
- Bohlmann, G.M. Biodegradable packaging life-cycle assessment. Environ. Prog. 2004, 23, 342–346. [Google Scholar] [CrossRef]


| Environmental Impacts | No. of Articles | Environmental Impacts | No. of Articles |
|---|---|---|---|
| Depletion of the ozone layer | 33 | Change in land use | 5 |
| Global warming | 25 | Ecosystems | 2 |
| Climate change | 22 | Carcinogenic effects on human health | 3 |
| Acidification | 24 | Water shortage | 2 |
| Fresh water eutrophication | 18 | Aquatic eutrophication | 3 |
| Marine eutrophication | 17 | Land use as an urban mesh | 2 |
| Human toxicity | 20 | Soil occupation for agriculture | 2 |
| Formation of particulate matter/suspended particles | 16 | Resources | 2 |
| Terrestrial acidification | 15 | Use of water resources | 2 |
| Global warming potential | 31 | Fresh water acidification | 1 |
| Land use | 19 | Global warming (including and excluding biogenic carbon) | 1 |
| Ionizing radiation | 16 | Fossil fuels | 1 |
| Depletion of water resources | 10 | Depletion of mineral resources | 2 |
| Ecotoxicity in fresh water | 8 | Carbon-derived effects of biogenic origin | 1 |
| Terrestrial ecotoxicity | 16 | Non-carcinogenic effects | 1 |
| Photochemical formation of oxidants | 12 | Scarcity of fossil resources | 3 |
| Non-carcinogenic agents | 6 | Scarcity of mineral resources | 2 |
| Depletion of fossil resources | 7 | Matter in suspension | 1 |
| Fresh water ecotoxicity | 14 | Minerals | 2 |
| Marine ecotoxicity | 13 | Primary energy needs | 1 |
| Land cover | 6 | Soil and water acidification potential | 1 |
| Inorganic respiration | 11 | Ozone layer depletion potential | 4 |
| Carcinogens | 9 | Fossil fuel depletion potential | 3 |
| Abiotic depletion | 10 | Depletion potential of the aquatic environment | 1 |
| Terrestrial eutrophication | 6 | Ecotoxicity potential | 2 |
| Resource utilization | 5 | Photochemical ozone formation potential | 3 |
| Fossil fuel depletion | 6 | Soil occupation potential | 1 |
| Photochemical formation of ozone | 5 | Human toxicity potential | 4 |
| Eutrophication potential | 6 | Primary energy saving | 1 |
| Human health | 5 | Ecosystem quality | 1 |
| Aquatic ecotoxicity | 5 | Energy use (energy needs) | 1 |
| Acidification potential | 4 | Use of non-renewable energy | 7 |
| Organic respiration | 7 | Use of renewable energy | 2 |
| Smog | 3 | Use of resources (fossil fuels) | 2 |
| Use of resources (minerals and metals) | 4 | Use of resources for energy carriers | 1 |
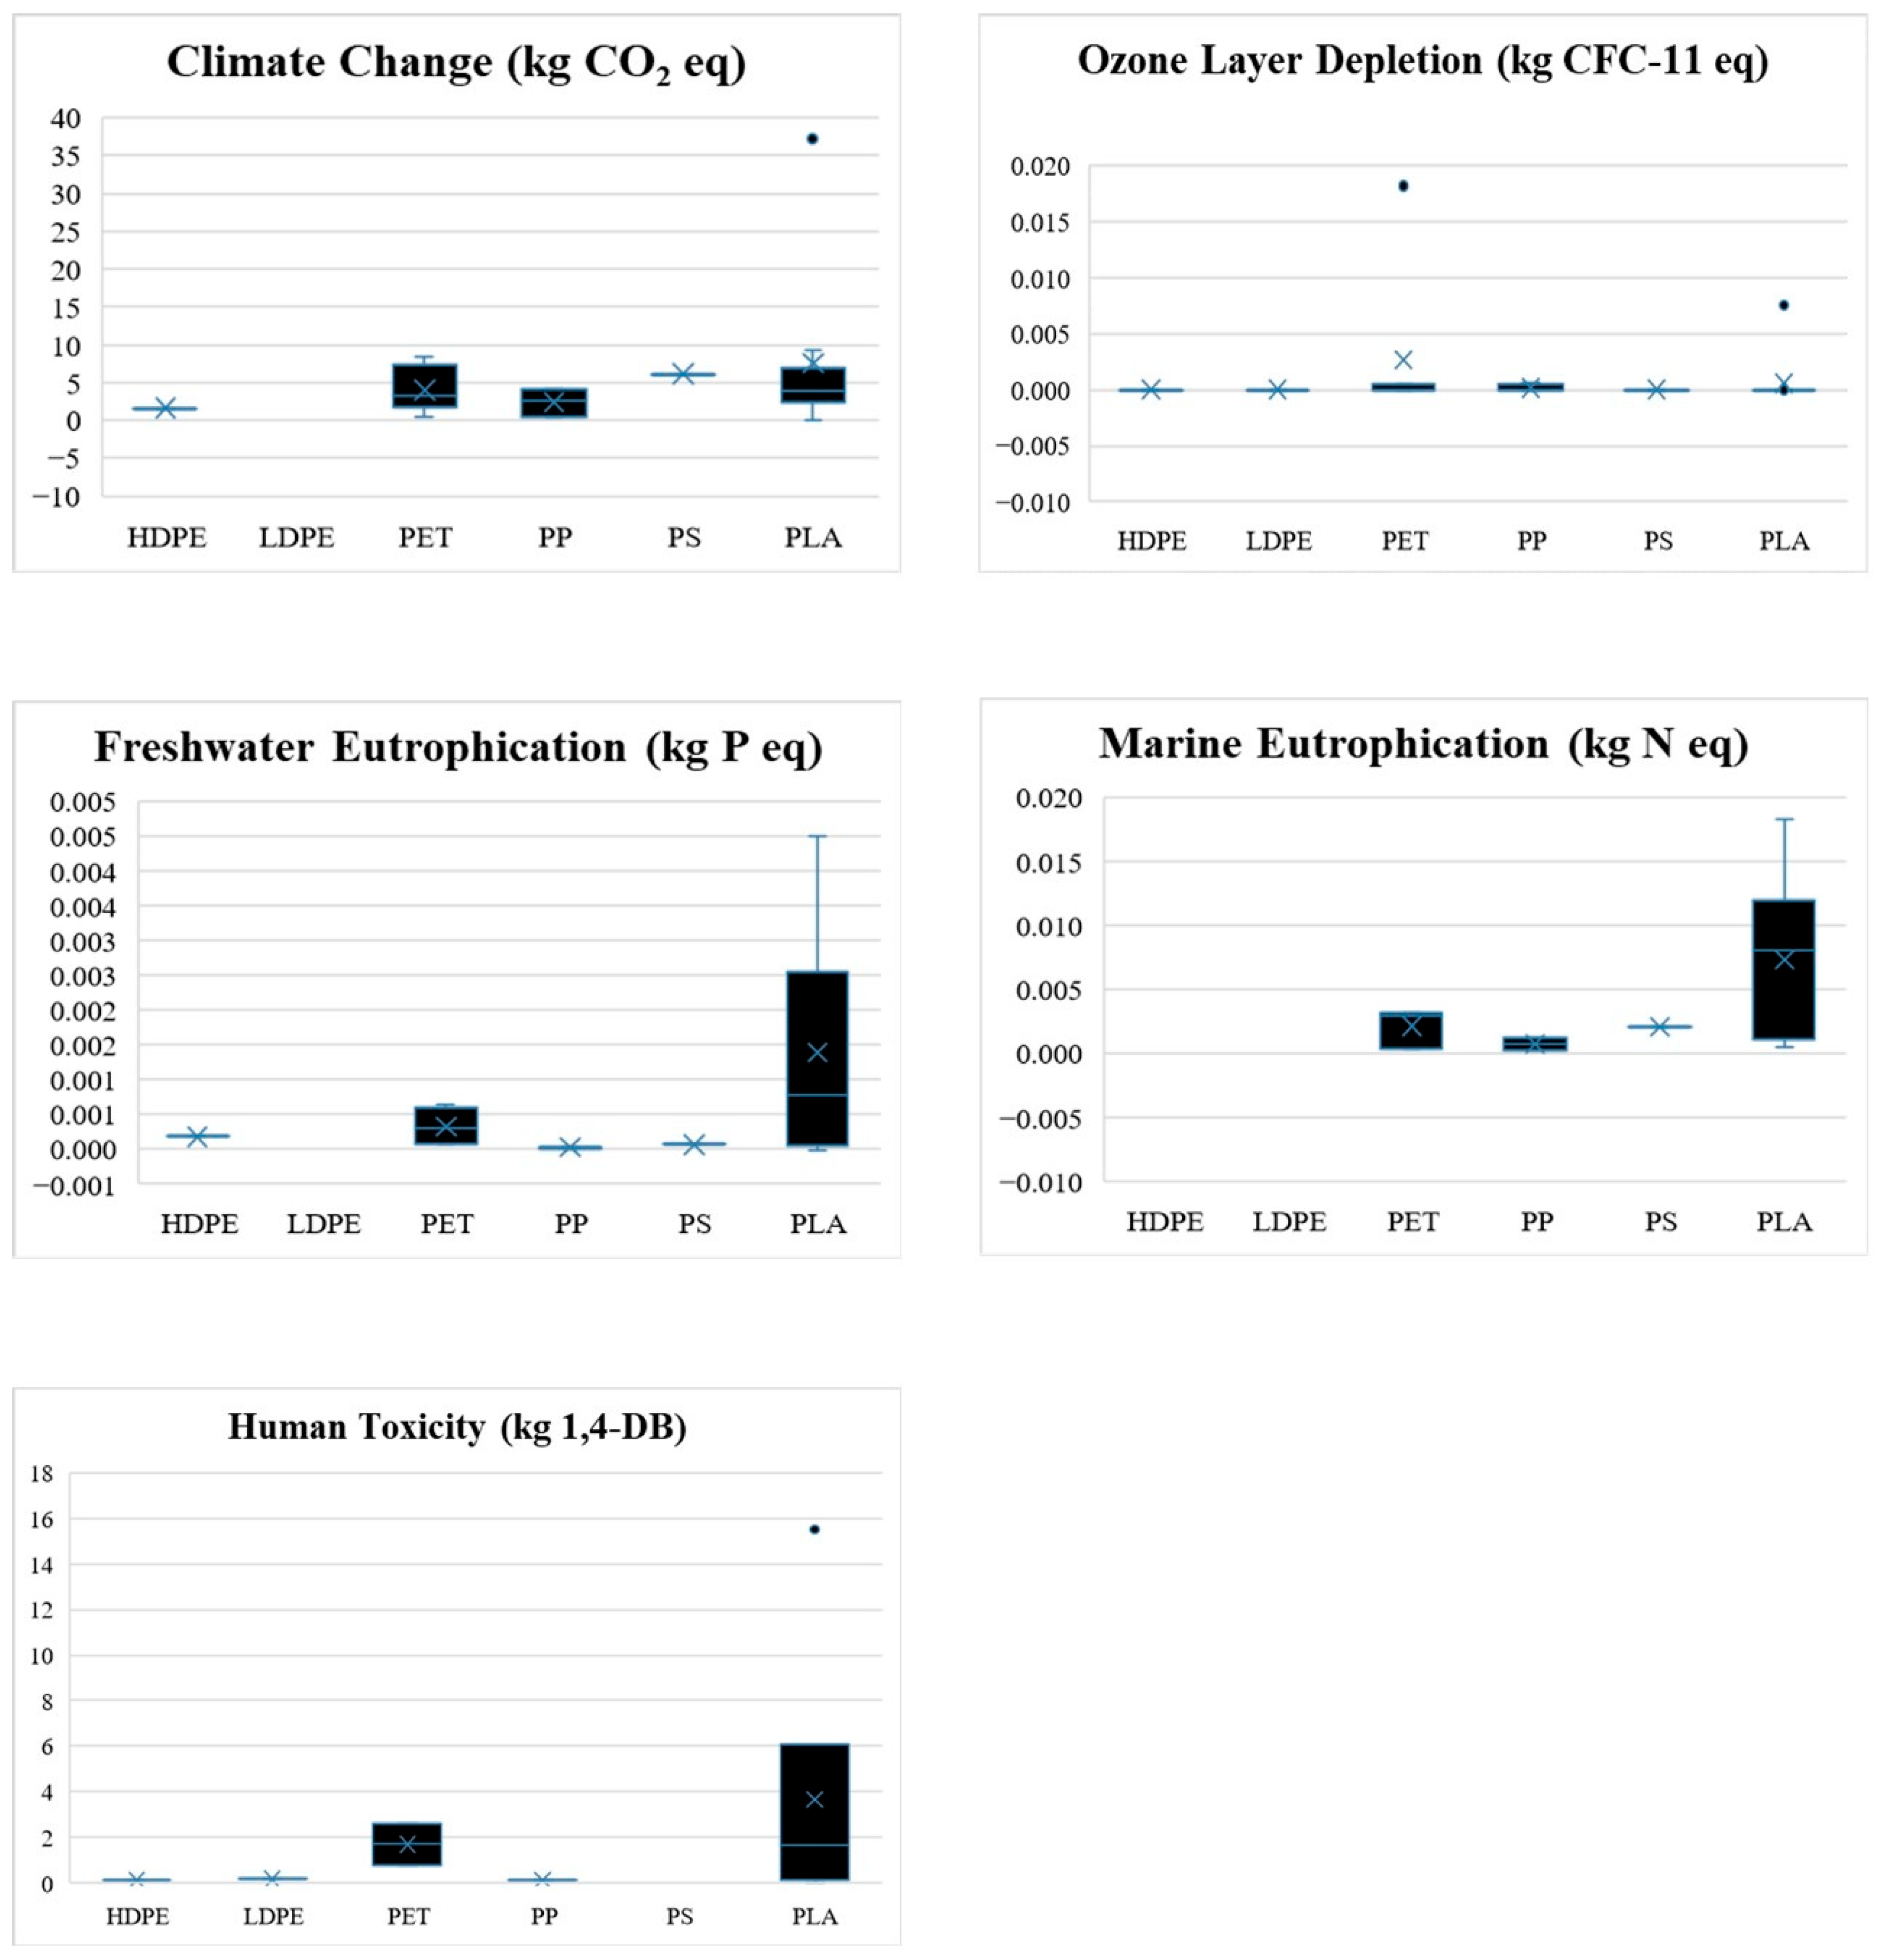
| EIA Category for Each Plastic | PLA | PET | PP | HDPE | LDPE | PS | Refs. |
|---|---|---|---|---|---|---|---|
| OLD (Kg CFC-11 eq/kg plastic) | 5.831 × 10⁻⁴ ± 2.094 × 10⁻³ | 2.668 × 10⁻³ ± 6.326 × 10⁻³ | 1.671 × 10⁻⁴ ± 2.895 × 10⁻⁴ | 2.161 × 10⁻⁸ ± 1.640 × 10⁻⁸ | 3.520 × 10⁻⁸ ± 2.100 × 10⁻⁸ | 9.660 × 10⁻⁸ ± 9.542 × 10⁻⁸ | [1,3,11,21,22,23,24,25,26,27,28,29,30,31,32] |
| (n = 13) | (n = 7) | (n = 4) | (n = 3) | (n = 2) | (n = 2) | ||
| CC (Kg CO2 eq/kg plastic) | 7.584 × 100 ± 1.113 × 101 | 4.066 × 100 ± 2.754 × 100 | 2.446 × 100 ± 1.554 × 100 | 1.648 × 100 | 6.134 × 100 | [1,3,21,23,25,26,29,31,32,33] | |
| (n = 9) | (n = 6) | (n = 3) | (n = 1) | (n = 0) | (n = 1) | ||
| FEW (Kg P eq/kg plastic) | 1.395 × 10⁻³ ± 1.620 × 10⁻³ | 3.330 × 10⁻⁴ ± 2.538 × 10⁻⁴ | 2.766 × 10⁻⁵ ± 1.435 × 10⁻⁵ | 1.807 × 10⁻⁴ | 6.891 × 10⁻⁵ | [3,11,22,23,26,27,28,29,31,32,33] | |
| (n = 10) | (n = 4) | (n = 2) | (n = 1) | (n = 0) | (n = 1) | ||
| ME (Kg N eq/kg plastic) | 7.307 × 10⁻³ ± 6.189 × 10⁻³ | 2.139 × 10⁻³ ± 1.270 × 10⁻³ | 7.777 × 10⁻⁴ ± 4.828 × 10⁻⁴ | (n = 0) | 2.101 × 10⁻³ | [3,5,22,23,27,28,31,32,33,34] | |
| (n = 10) | (n = 3) | (n = 2) | (n = 0) | (n = 1) | |||
| HT (Kg 1,4-DB eq/kg plastic) | 3.648 × 100 ± 5.929 × 100 | 1.692 × 100 ± 9.254 × 10⁻¹ | 1.069 × 10⁻¹ | 1.195 × 10⁻¹ | 1.478 × 10⁻¹ | (n = 0) | [1,11,23,30,31,33] |
| (n = 6) | (n = 2) | (n = 1) | (n = 1) | (n = 1) |
Disclaimer/Publisher’s Note: The statements, opinions and data contained in all publications are solely those of the individual author(s) and contributor(s) and not of MDPI and/or the editor(s). MDPI and/or the editor(s) disclaim responsibility for any injury to people or property resulting from any ideas, methods, instructions or products referred to in the content. |
© 2023 by the authors. Licensee MDPI, Basel, Switzerland. This article is an open access article distributed under the terms and conditions of the Creative Commons Attribution (CC BY) license (https://creativecommons.org/licenses/by/4.0/).
Share and Cite
Fonseca, A.; Ramalho, E.; Gouveia, A.; Figueiredo, F.; Nunes, J. Life Cycle Assessment of PLA Products: A Systematic Literature Review. Sustainability 2023, 15, 12470. https://doi.org/10.3390/su151612470
Fonseca A, Ramalho E, Gouveia A, Figueiredo F, Nunes J. Life Cycle Assessment of PLA Products: A Systematic Literature Review. Sustainability. 2023; 15(16):12470. https://doi.org/10.3390/su151612470
Chicago/Turabian StyleFonseca, Ana, Edgar Ramalho, Ana Gouveia, Filipa Figueiredo, and João Nunes. 2023. "Life Cycle Assessment of PLA Products: A Systematic Literature Review" Sustainability 15, no. 16: 12470. https://doi.org/10.3390/su151612470
APA StyleFonseca, A., Ramalho, E., Gouveia, A., Figueiredo, F., & Nunes, J. (2023). Life Cycle Assessment of PLA Products: A Systematic Literature Review. Sustainability, 15(16), 12470. https://doi.org/10.3390/su151612470