Article

Pollution Analysis and Health Implications of Heavy Metals under Different Urban Soil Types in a Semi-Arid Environment

1
Soil Science Department, Urmia University, P.O. Box 165, Urmia 57134, Iran
2
Hermiston Agricultural Research and Extension Center, Oregon State University, Hermiston, OR 97838, USA
*
Author to whom correspondence should be addressed.
Sustainability 2023, 15(16), 12157; https://doi.org/10.3390/su151612157
Submission received: 21 April 2023 / Revised: 3 August 2023 / Accepted: 7 August 2023 / Published: 9 August 2023

Abstract

:
A fundamental requirement for the effective prevention and management of soil contamination involves the determination of heavy metal contamination levels and the assessment of associated health risks for human populations. In this study, an analysis was conducted to evaluate the pollution levels and health risks associated with heavy metals in urban soils, specifically focusing on four distinct soil types, namely Calcisols, Cambisols, Fluvisols, and Regosols. The mean values of five heavy metals (Zn, Cu, Cd, Pb, and Ni), some soil pollution indices, and human health risk indices were determined. Pollution indices including the integrated Newerow pollution index (PIN), single pollution index (PI), and pollution load index (PLI) showed a moderate pollution class in most soil samples. The non-carcinogen risk index of elements (HI) in each exposure pathway and the total of the exposure pathways (THI) was <1 for three different population groups (children, adult females, and adult males) and in all soils. This shows the lack of non-cancerous risk for local residents in the study site. The variations in HI and THI for the three population groups and three different exposure pathways was in the order of adult males > adult females > children and ingestion > dermal contact > inhalation. The carcinogenicity risk (CR) of Cd, Pb, and Ni through exposure by ingestion was >1 × 10⁻⁴ for children in all soils, meaning that soil ingestion is hazardous to children in the study region. For all three population groups and all soil types, Pb was most effective in HI and THI, whereas Cd had the highest carcinogenicity potential.

1. Introduction

Urban and peri-urban regions represent crucially dense locations worldwide, owing to their extensive provision of services, facilities, industrial establishments, and economic operations. The United Nations’ statistical data support this assertion [1]. Approximately 56% of the global population resided in urban and peri-urban areas in 2014, with projections indicating a surge to 69% by the year 2050. This burgeoning urban and peri-urban populace is anticipated to exacerbate human encroachment upon natural resources, particularly soils, leading to significant alterations in their physical, chemical, and biological characteristics. The soils found within these regions, heavily impacted by human endeavors and urban waste, exhibit notable distinctions from their natural counterparts, resulting in widespread perturbations across numerous attributes primarily influenced by the industrial, commercial, and service activities of individuals. At a global level, urbanization accounts for approximately 80% of urban and industrial waste, which encompasses nearly 2% of the Earth’s land area [2]. The ecosystems within urban and peri-urban regions can be characterized as intricate networks comprising a multitude of elements generated through human and natural processes. Specifically, urban soils pertain to the terrestrial substrates found in peri-urban locales, consisting of diverse constituents predominantly shaped by human endeavors, and thus distinct from agricultural and forest soils [3].
In general, an array of human activities in peri-urban regions are implicated in the introduction of various chemical and organic pollutants, as well as elements, into the soil. Among these pollutants, heavy metal contamination has received particular emphasis. A study conducted in Siena, located in Central Italy, demonstrated that the levels of heavy metals in soils followed the pattern of non-urban soil < green-urban soil < urban soil [4]. Ding and Hu [5] revealed that cadmium (Cd) and arsenic (As) in the urban soils of Nanjing, China, posed a high ecological risk. Soil is the most important natural substance to absorb and maintain heavy metals and is a natural buffer to control heavy metals and transfer them to the atmosphere, hydrosphere, and biosphere. Heavy metals are, on the other hand, stable and indecomposable in soil, and soils have a limited capacity to absorb and maintain them, beyond which they may be emitted into the soil–water–plant–animal–human ecosystem and pose a serious threat to human health [6,7]. They can also find their way into the human body through ingestion, inhalation, and dermal contact and cause various cancerous and non-cancerous diseases, irrespective of age or gender. The heavy metals not metabolized in the body and can accumulate in tissues such as fats, muscles, bones, and joints, and this can cause different diseases. Some of these elements have no pollutant threshold—that is, they are harmful at any concentration and can entail incurable and fatal diseases in the long run by accumulation in the tissues of living organisms. Lead (Pb) and cadmium (Cd) are two of the most important elements whose accumulation in human tissues may be deeply harmful to the neural and enzymatic systems and may cause lung cancer and bone-breaking [8].
In urban areas, heavy metals can enter soil ecosystems from various sources induced by anthropogenic activities, such as the facilities of metal melting, plating, dying, vehicles, mechanical tools, agronomic activities, the wastewater of utilities, the service sector, battery manufacturing, and so on. Huang et al. [9] and Hu [10] reported that traffic and agricultural activities were the main sources of heavy metals in some peri-urban soils in China. In contrast, Walraven et al. [11] in the Netherlands, Gąsiorek et al. [12] in Poland, and Baltas et al. [13] in Turkey reported a series of industrial activities and atmospheric precipitation as the main sources of urban heavy metals. On the other hand, the behavior and characteristics of urban and peri-urban soils are very complicated as they are influenced by a set of natural and artificial factors and processes and these characteristics can dictate the behavior of heavy metals and their changes [2,14,15]. Accordingly, an assessment of the pollution degree and health risk of heavy metals in the soils of these regions has created a new challenge for researchers in most parts of the world.
Previous research has acknowledged the individual influence of agricultural and service–industrial activities on pollution levels and the presence of heavy elements in urban and suburban soils [16,17]. However, the current body of evidence lacks comprehensive data regarding the collective impact of these activities (agricultural and service–industrial activities) on the characteristics, sources, and health risk assessment of heavy metals in soils, particularly in regions exhibiting diverse soil types and affected by urban activities.
The research site chosen for this study is situated in Urmia, a region in northwestern Iran characterized by a semi-arid climate. This location accommodates a variety of small and medium-sized service and industrial establishments, including food processors, cold storage facilities, dying facilities, and metal plating facilities, among others. The effluents and waste products generated by these industries are directly and/or indirectly discharged into the agricultural lands within the region. Additionally, the outskirts of the city of Urmia serve as a disposal site for most of the city’s waste, often situated along the periphery of the farms in the area. Moreover, the region is subjected to the emissions of pollutants from the heavy traffic that traverses the outer belt of the city. Past studies [7,10,18] have demonstrated that any single factor mentioned above can result in a substantial release of heavy metals into soil. However, limited data exist regarding the magnitude of pollution and the associated health risks in agricultural lands situated in urban and peri-urban areas within arid and semi-arid regions, particularly those with diverse soil types including calcareous soils.
The main objectives of the present study are as follows: (1) to determine the quantity, origin, and pollution index of Ni, Pb, Cd, Cu, and Zn in urban soils, (2) to analyze the health risk of heavy metals to humans (different genders and ages) through the assessment of exposure, including ingestion, dermal contact, and inhalation in urban soils, and (3) to assess the impact of different urban soil types on the quantity, pollution index, and health risk of heavy metals.

2. Materials and Methods

2.1. Study Site and Fieldwork

The study site was located in the east of the city of Urmia in Western Azerbaijan province, in the northwest of Iran, covering an area between the longitudes of 45°07′20″ and 45°07′38″ E and the latitudes of 37°31′44″ and 37°34′58″ N (Figure 1). The altitude of the study site is 1285–1330 m from sea level, its mean annual precipitation is 338 mm, and it has a semi-arid Mediterranean climate. The parent material of the soils is young alluvium and its oldest geological structures are from the Quaternary. The main land-uses are agriculture and horticulture, chiefly producing wheat, corn, sunflower, and vegetables on farms and grapes and potatoes in orchards. The irrigation water is supplied from the surface water leaving Urmia and from the deep well water.
In the field operation, a total of 10 soil profiles were dug along a 5 km transect. Then, all soil profiles were described and sampled [19]. The soil samples were taken from all diagnostic horizons of each profile. After determining the morphological characteristics of soil profiles and conducting a physicochemical analysis, the profiles were classified using the World Reference Base (WRB) system [19]. Accordingly, the soils were classified into four main reference groups, including Calcisols (Cal), Cambisols (Cam), Fluvisols (Flu), and Regosols (Reg). Each soil profile was regarded as a central point. Then, composite samples were taken from the soil surface at spots 50–100 m away from these central points in the north–south and east–west directions. Each composite soil sample (0–50 cm depth), which was a mixture of five subsamples, was analyzed in three replications. All soil profiles were characterized by their medium—heavy texture, and a high pH and calcium carbonate.

2.2. Laboratory Analyses

The soil samples were prepared, air-dried, and screened through a 2 mm sieve. They were, then, subjected to typical physicochemical analyses. Soil particle size distribution was determined using the hydrometer method [20]. Soil pH and electrical conductivity (EC) were measured using the saturated paste (1:5 soils to 0.01 M CaCl2) and saturated extract methods, respectively [6]. Organic carbon was determined using a wet oxidation technique [21]. Calcium carbonate equivalent (CCE) was estimated after treating the soil with acid (1N HCl) and titration with 1N NaOH [22]. Cation exchange capacity (CEC) was measured using sodium acetate (1 M NaOAc) at pH 8.2 [23]. The elements Zn, Cu, Cd, Pb, and Ni were extracted by digestion in concentrated nitric acid [24]. Based on the method, 10 cm3 of concentrated HNO3 were added to 2 g of soil and heated for 15 min at 95 °C, followed by the addition of 2 cm3 of deionized water and 3 cm3 of 30% H2O2. The concentrations of these five elements in the extracts were measured via Shimadzu-6300 atomic absorption spectrometry (Shimadzu Corporation, Kyoto, Japan). The highly pure laboratory material of the Merck Group was used to calibrate the d sentences evice. To control the quality of the analyses, some standard samples were prepared, and their concentrations were determined along with the main samples. Their recovery rate was in the range of 94–103%. To validate the measurements of element contents, they were repeated for 20% of the samples, which showed an error of <5%. The analyses of SiO2, Al2O3, and Fe2O3 were carried out via X-ray fluorescence (XRF) spectrometry (PANalytical CubiX, WD) from melted-powder pellets of the samples.

2.3. Soil Pollution and Risk Investigation Indices

The pollution and risk investigation indices were used as follows [25]:
  • Single factor pollution index (PI)
P I = C i S i
  • Nemerow pollution index (PIN)
P I N = ( 1 n i = 1 n P I n ) 2 + [ max P I ] 2 2
In these two equations, Ci is the concentration of the element i, Si is the background value of the metal i [26], max(PI) is the maximum value of the single factor pollution index, n is the number of the examined metals, and i is the ith value of the metals.
  • Pollution load index (PLI) [27]
P L I = ( P I 1 × P I 2 × P I 3 P I n ) 1 n
  • Human health risk assessment indices
Non-carcinogenic and carcinogenic health risk to humans via ingestion, dermal contact, and inhalation was evaluated by calculating the average daily dose (ADD), hazard quotients (HQ), hazard index (HI), and carcinogenic risk (CR) as follows [8,28]:
A D D i n g = C × I R i n g × E F × E D B W × A T × 10 6
A D D i n h = C × I R i n h × E F × E D P E F × B W × A T
A D D d e r m a l = C × S A × A F × A B S × E F × E D B W × A T × 10 6
H I = H Q I = A D D i R f D i
T H I = H I = j = 1 N A D D i n g j R f D i n g j + j = 1 N A D D i n h j R f D i n h j + j = 1 N A D D d e r m a l j R f D d e r m a l j
C R = A D D i × S F
T C R = j = 1 N ( A D D i n g i + S F i n g i ) + j = 1 N ( A D D i n h i + S F i n h i ) + j = 1 N ( A D D d e r m a l i + S F d e r m a l i )
in which ADDing, ADDinh, and ADDdermal are ADD from soil ingestion, inhalation, and dermal contact, respectively (mg element kg−1 bodyweight day−1), C is the heavy metal concentration in soil (mg kg−1), THI represents the total exposure hazard index, SF is the carcinogenicity slope factor (mg (kg day)−1), and TCR denotes the total carcinogenic risk index. The definitions and values of factors to estimate human health risk are illustrated in Table 1.

2.4. Data Analysis

The SPSS 16 software package was used to calculate all statistical parameters, compare the means of the parameters, and draw the graphs (SPSS Inc., Chicago, IL, USA). The same statistical package was used to analyze correlations and perform principal component analysis (PCA) to detect the origin of the elements. The Kaiser–Meyer–Olkin (KMO) test and Bartlett’s test of sphericity were used to assess the capability of PCA to accurately sort down the soil attributes for factor analysis. The high value of KMO (0.635) and the significance level of Bartlett’s test of sphericity (p < 0.000) showed that that factor analysis was adequate for our data. The means of different indices of soil pollution and human health were compared between the different soil types using one-way analysis of variance. Least squared means were compared using Duncan’s test at the p < 0.05 confidence level.

3. Results and Discussion

3.1. Soil Characteristics

Some physicochemical characteristics of the studied soils and their statistical parameters are presented in Table 2. The clay and sand fraction of the soils was in the range of 2.5–71% (an average of 34.8%). About 33% of the soil samples exhibited a texture class of clay and 26% showed a texture class of loam–clay, implying the heavy texture of most samples. The ranges of pH (Min = 7.36, Max = 8.06, Mean = 7.72) and calcium carbonate equivalent (Min = 4.5%, Max = 49.1%, Mean = 23.3%) showed that the soils in the study site were alkaline and calcareous. Salinity (EC) was less than 2 dS m−1 in over 95% of the samples. Therefore, the majority of soils were not saline (EC < 4 dSm−1). Soil organic matter content was in the range of 0.21–5.24%, with an average of 1.98%, implying a very poor to very strong organic matter content of the soils [29,30]. Cation exchange capacity (CEC) ranged from 5.1 to 42.6 Cmol kg−1, with an average of 22.8 Cmol kg−1, reflecting a moderate CEC class [29].

3.2. Soil Heavy Metals

Table 3 shows the range, mean, standard deviation, and coefficient of variations for the studied elements in different soil types. The concentration of the heavy metals in the soil samples varied in the range of 29.9–284.9 mg kg−1 for Zn, 10.1–221.4 mg kg−1 for Cu, 0.49–0.91 mg kg−1 for Cd, 21.9–99.6 mg kg−1 for Pb, and 10.3–122.1 mg kg−1 for Ni.
The average values of these elements in different soil types were in the order of Flu > Cam > Reg > Cal for Zn, Flu > Cam > Cal > Reg for Cu and Pb, and Cal > Flu > Cam > Reg for Cd and Ni. These sequences show that the highest and lowest mean values of these elements occurred in Fluvisols and Regosols, respectively, for most elements. Previous studies have also reported significant differences in heavy metals among different soil types [7,31]. The background values, measured using the median absolute deviation method [26,32], were 53 mg kg−1 for Zn, 32.4 mg kg−1 for Cu, 0.42 mg kg−1 for Cd, 39.3 mg kg−1 for Pb, and 36.1 mg kg−1 for Ni. These are almost similar to those values reported for soils in other parts of the world [33]. There is a consensus in the world that the comparison of element concentrations in urban soils with the values measured in other cities is a good way to estimate the pollution of these soils and apply sound management practices [2].

3.3. Coefficient of Correlation

Coefficients of correlation between the heavy metals and the physicochemical characteristics were calculated and the obtained results are reported in Table 4. Organic matter showed a significant positive correlation with Cu and Zn, implying the high tendency of these elements to form complexes with organic compounds. Shaheen et al. [34] and Zhou et al. [35] reported the impact and high capability of organic matter in maintaining, fixing, and distributing Cu and Zn in Germany and China, respectively. Although past studies have revealed a high correlation of clay distribution and CEC with heavy metals [6,34,36], we did not observe this behavior in the present investigation. This may be associated with the fact that the soils in our study site are alkaline, calcareous, and rich in base cations (Ca, Mg, Na, and K) and these cations fill exchangeable sites fast and do not allow the absorption of heavy metals. This has been well explained by Rezapour and Moazzeni [37]. Another possible explanation could be attributed to the soil’s mineralogical constituents, where illite, chlorite, and kaolinite together constitute more than 80% of the mineral constituents in the clay fraction of these soils [37]. Due to a low CEC and surface area, clay minerals such as illite and chlorite have a lower affinity to absorb heavy metals, resulting in the weak influence of the clay fraction on the adsorption and retention of heavy metals [33,37]. Ni (p < 0.01), Zn (p < 0.05), and Cu (p < 0.05) showed a significant positive correlation with Al2O3 and Fe2O3, which may imply a strong relationship and controlling role of aluminosilicate in distributing these elements. The important role of aluminum and iron oxides in maintaining and absorbing heavy metals has already been proven [33]. Soil EC and pH were insignificantly correlated with heavy metals. In semi-arid regions like our study site, soil EC variations are controlled by elements that are more soluble and abundant than heavy metals (e.g., Na and K), so the insignificant correlation of EC and heavy metals in this study seems reasonable. The lack of a correlation between soil pH and heavy metals can also be attributed to the narrow range of pH in these soils (7.36–8.06), as its small coefficient of variations (CV = 2.2%) confirms too. Also, significant correlations were observed between Cd and Pb and between Ni and Cu, which may reflect that their origins and distributions are controlled by the same processes. Similar correlations have been reported for different soils throughout the world in several authentic research works, e.g., Chabukdhara and Nema [38] in India, Liu et al. [39] in China, and Rinklebe et al. [36] in Germany. All in all, the concentrations of heavy metals in this study did not exhibit similar relationships with the soil characteristics and this can arise from differences in the anthropogenic and lithogenic sources of these elements.

3.4. Factor Analysis

The results of the principal component analysis (PCA), which is an effective way to determine the origin of elements, are given in Table 5. The results of the KMO test (0.635) and Bartlett’s test (p < 0.000) supported that the data were suitable for PCA. In each principal component (PC), the factor loading of the elements can be in the range of strong (>0.75), moderate (0.5–0.75), and weak (0.3–0.5) [40].
According to Table 5, heavy metals were grouped into three principal components and accounted for 74% of the total variance. The first principal component (PC1), which captured 32.6% of the total variance, was the most important in determining the variations in the heavy metal concentrations, and the next two PC accounted for 28.2 and 14.75% of the total variance, respectively. PC1 contained Pb and Cd with a strong factor load (PC > 0.75) and a significant positive correlation was established between them (Table 4). This may reflect a similar pollution level and common pollution sources for these two metals [41,42,43]. Pb and Cd concentrations were higher in most soil samples than their background values and they also had a relatively high coefficient of variations (CV > 35%) in different soil types (Table 3). This means that these elements have mainly anthropogenic origins. The main role of anthropogenic origins in the accumulation of Cd and Pb in urban soils has been stressed in several other studies around the world [15,42,43,44]. In the study site, a huge amount of urban waste containing industrial human wastes spread into the soils via different factors (e.g., wind, water, humans). Based on the literature, these materials contain significant amounts of Pb, Cd, and Zn [6,45,46,47]. However, the role of traffic and agrochemicals in the accumulation of these elements should not be overlooked. The second component (PC2) is more complicated than the other two components. Its main element is Zn with a strong factor loading (0.89), standing between the human factor (PC1) and the natural factor (PC3). So, Zn is likely to have a common human–natural origin. The concentration of Zn was higher than its background value in 61% of the soil samples while in 39% of the samples, it was lower than the background value. Its coefficient of variations was in a moderate range (15% < CV < 35%) within different soil types. These variations may confirm the concurrent anthropogenic and natural origins of Zn. Using multivariate statistical and isothermic methods, Lv and Liu [48] and Hu et al. [10] reported such a human–natural origin for Zn in peri-urban agricultural soils, though the human side of the origins was stronger. Ni and Cu concentrations were smaller than or almost equal to their background concentrations in most soil samples and they had a low coefficient of variations (CV < 15%). This implies that the third component (PC3), whose main factor loadings come from Ni (0.76) and Cu (0.87), has a natural origin and the concentration of the elements of this group is mainly controlled by the weathering of parent material and pedogenic processes. The significant impact of natural factors on the concentration of Ni and Cu has been reported by other researchers such as Franco-Uría et al. [49] in Spain, Adimalla [15] in India, and Yang et al. [50] in China.

3.5. Soil Pollution Indices

Soil pollution indices including Pi, PIN, and PLI were calculated using Equations (1)–(3), respectively. The results are summarized in Table 6 and Table 7. The PI value for Zn, Cu, Cd, Pb, and Ni was in the ranges of 0.9–8.8, 0.1–6.32, 1.26–2.16, 0.71–3.21, and 0.31–7.3, respectively. The data show that, in terms of Pi, the studied soils were in the range of unpolluted (PI ≤ 1) to extremely polluted (PI > 6). Overall, 100%, 78.5%, and 82.5% of the soil samples were lowly (1 < PI ≤ 2) to moderately (2 < PI ≤ 3) polluted by Cd, Pb, and Zn, respectively. Most soil samples were in the class of clean soils in terms of Cu and Ni, implying that most of them are not polluted by these two elements.
The PIN index varied from 1.8 to 6.9 with an average of 2.7 in different soil types, reflecting a range of lowly polluted (1 < PIN < 2) to highly polluted (PIN > 3) classes. In terms of the mean PIN value, the soil types were in the order of Flu (3.1) > Cal (2.66) > Cam (2.59) > Reg (2.47). This means that different soil types had not been influenced by anthropogenic processes equally. In a study on the heavy metal pollution potential of soils in central Greece with different soil types (Alfisols, Inceptisols, Vertisols, and Entisols), Golia et al. [31] concluded that the soil type played a significant role in the quantity and class of pollution indices.
PLI was in the range of 0.35–3.9 with a mean of 1.42. The average variations of this index for different soil types were in the order of Flu (1.53) > Cal (1.49) > Cam (1.36) > Reg (1.29) (Figure 2), which is identical to the order observed for PIN. Zn and Cd were found to be the most influential on PLI. The average of this index, examined for the four soil types, showed a moderate pollution class (1 < PLI < 2). In total, as far as the PIN and PLI indices are concerned, most soils in the study site are in the moderately polluted class, which corroborates other studies in other parts of the world [15,43].

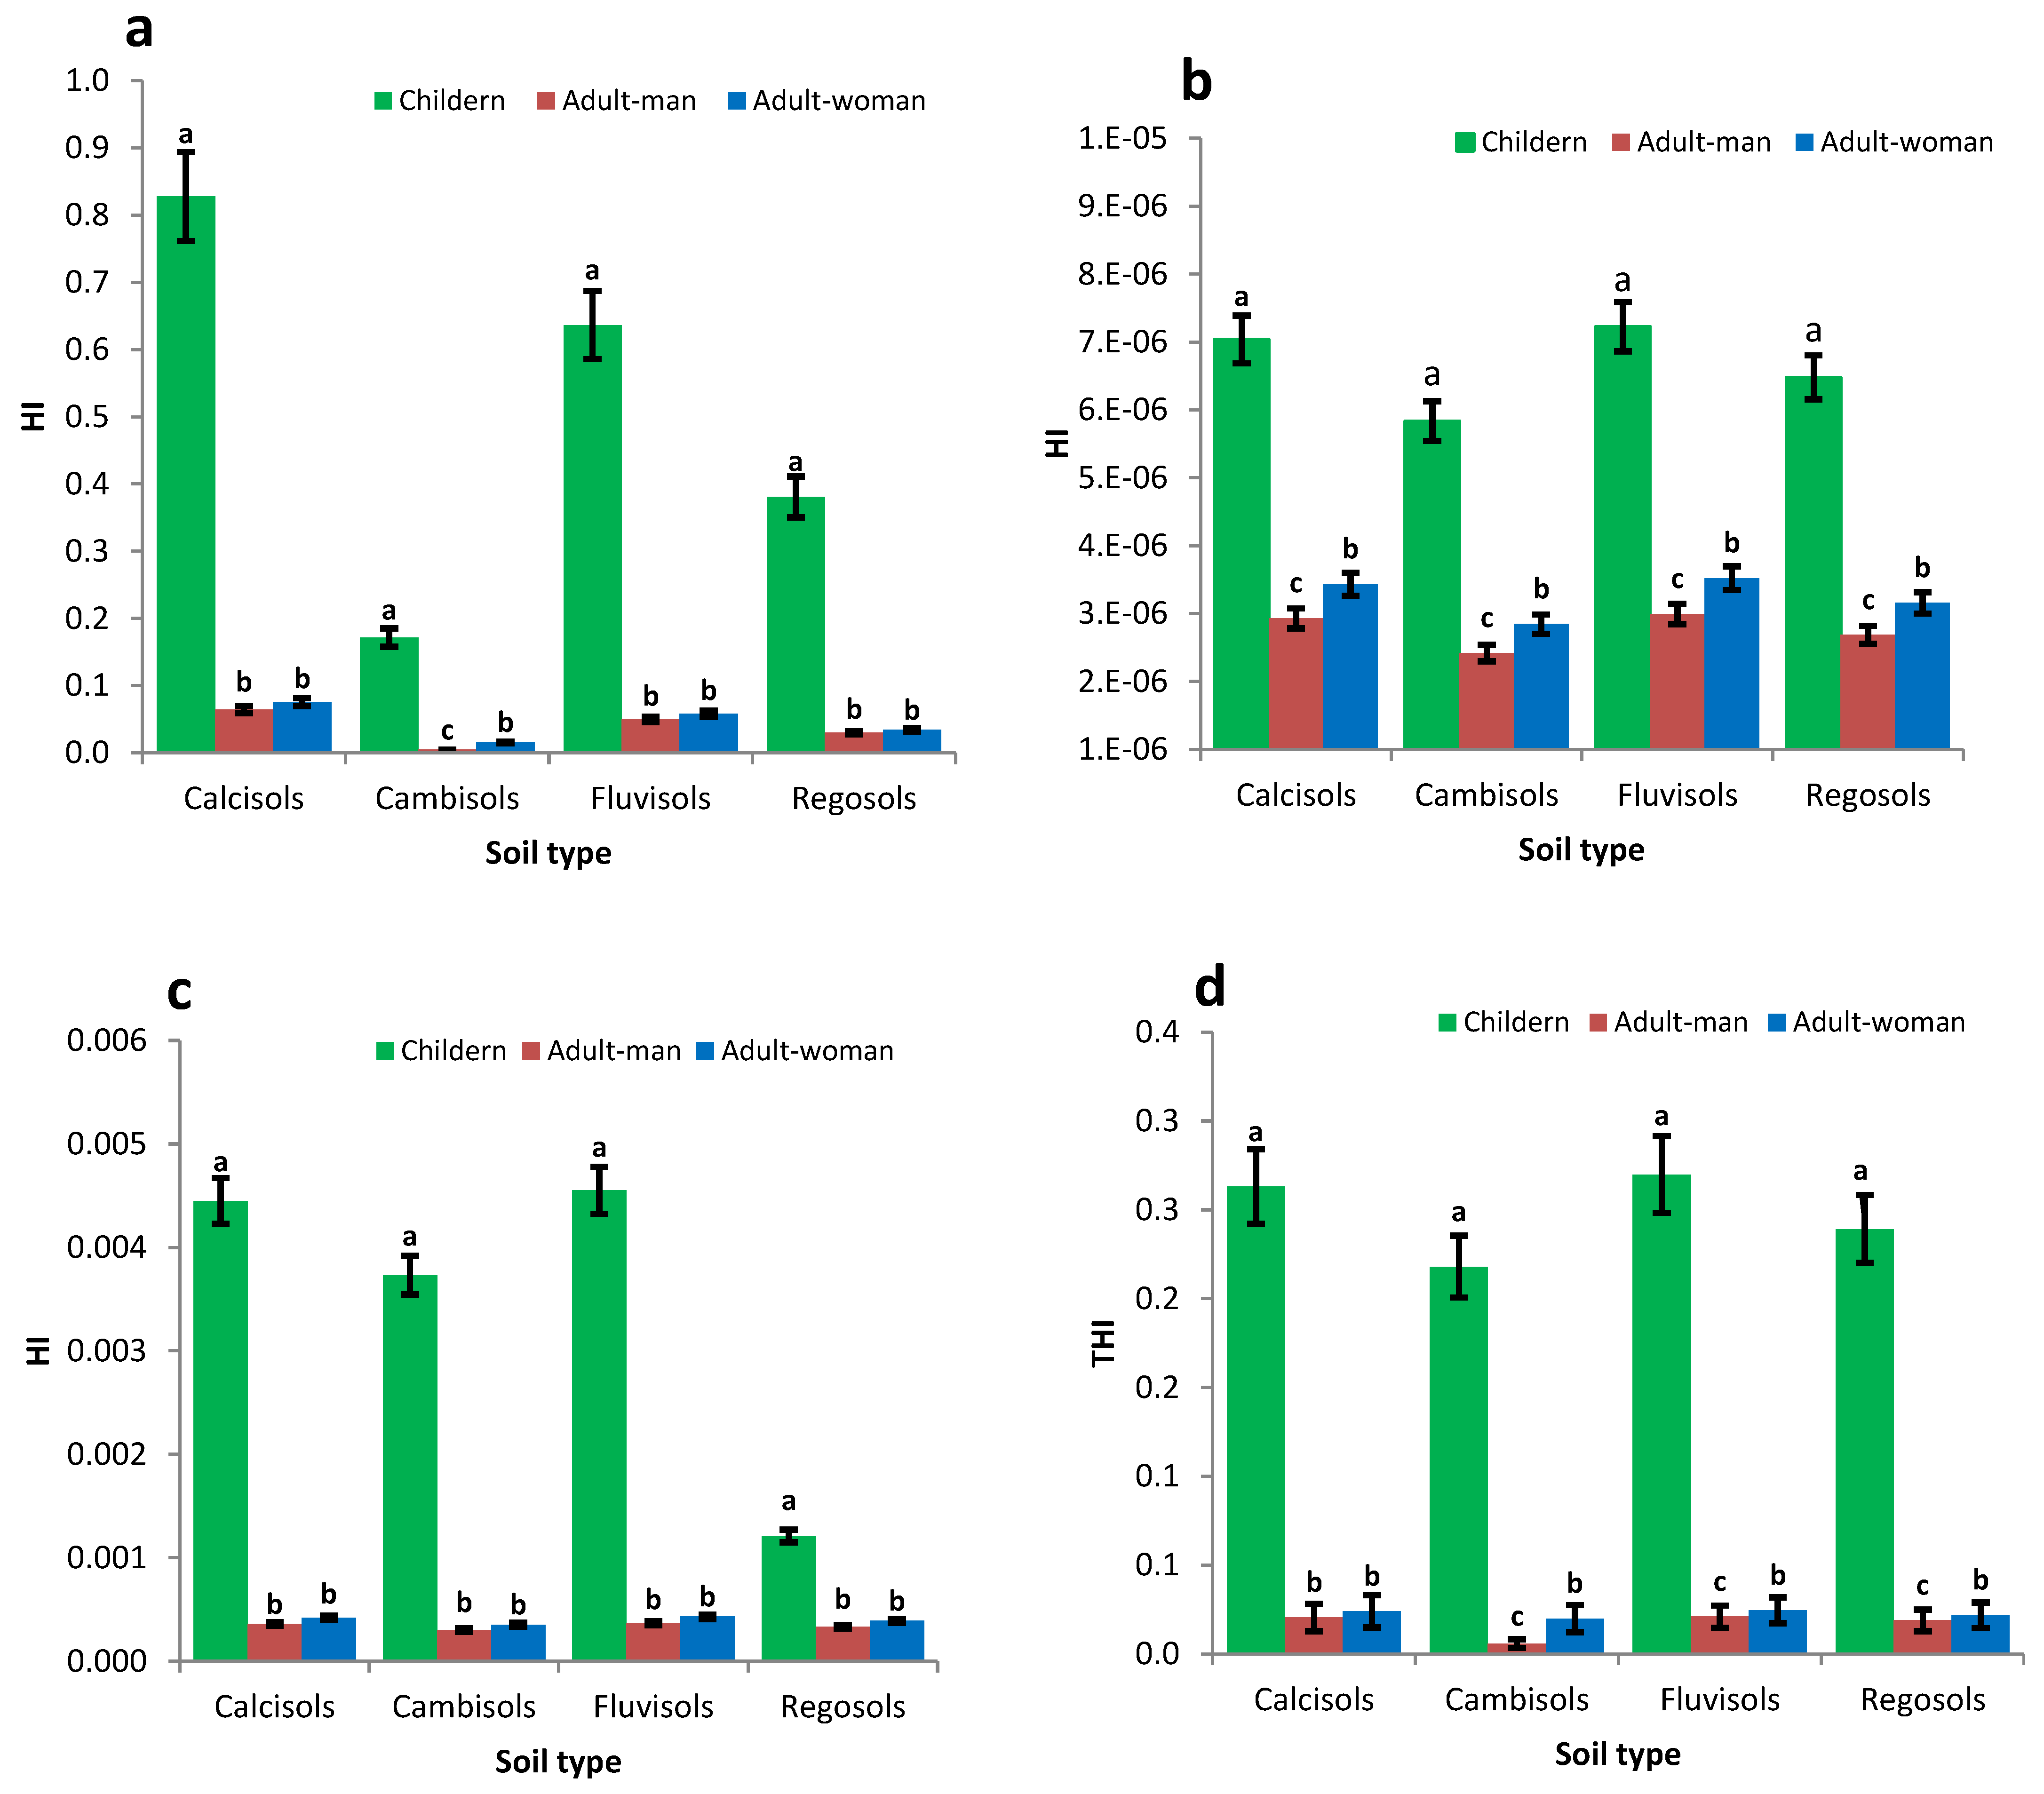
3.6. Health Risk Assessment

The health risk of the five elements to induce cancerous and non-cancerous diseases via ingestion, dermal contact, and inhalation was calculated for children, adult men, and adult women. Table 8 shows the minimum, maximum, and average non-carcinogenic risk for individual heavy metals taken through ingestion, inhalation, and dermal contact in different soil types and for children, adult women, and adult men separately.
As is evident, HQing has the maximum value for all elements for all age groups. HQder and HQinh are in the next ranks. This means that the non-carcinogenic risk of diseases caused by the ingestion of heavy metals in the soils of the region is much more dangerous than that by dermal contact and inhalation. The higher risk of heavy metals taken by ingestion versus the other absorption pathways has been stated in other research too [15,43]. In all soil types, children had the highest HQ via ingestion, inhalation, and dermal contact, and adult females and males were in the next ranks. This means that children are exposed to the risk of non-cancerous diseases by heavy metals to a much greater extent than adults. However, in all soil samples, HQ was <1 in all three exposure pathways of ingestion, inhalation, and dermal contact. So, the risk of non-cancerous alimentary, respiratory, and dermal diseases is weak for all three studied population groups [28]. In addition, in most soil samples and among the three exposure pathways, HQ for the three population groups was the highest for Pb followed by HQ-Cd, HQ-Zn, HQ-Ni, and HQ-Cu. This finding implies a higher risk of the involvement of Pb in the incidence of non-cancerous diseases than the other elements, which is consistent with previous studies [51,52]. For all age groups, the changes in the three exposure pathways (ingestion, inhalation, and dermal contact) for the studied heavy metals in different soil types were in the order of Flu > Cal > Reg > Cam. This sequence shows that the residents of Fluvisols are more exposed to the health risk of heavy metals to induce non-cancerous diseases than the residents of the other soil types.
The HI value, which is the sum of HQ of the five elements in each exposure way, was <1 for all three exposure pathways (ingestion, inhalation, and dermal contact) in all soil types and all three groups of children, women, and men, implying that these elements have a weak non-carcinogenic risk, even altogether (Table 8). For all soil types, the HI of ingestion was significantly higher than that of the dermal contact and inhalation, and dermal contact exhibited a significantly higher HI than inhalation. Similar results have been reported by Chen et al. [53] and Ma et al. [54] for the soils in China. We also found that the HI of the three exposure pathways in different age groups was in the order of children > adult females > adult males, which is similar to the sequence observed for HQ. As for the ingestion and inhalation of heavy metals, Pb and Ni had the highest impact on the HI quantity followed by Cd, Cu, and Zn. But the HI of dermal contact was most affected by Pb and Cd, followed by Ni, Cu, and Zn. Similar results were revealed for all soil types and all age groups and are in agreement with previous studies [55]. The differences found in the impact of the elements on HI may be related to their different toxicity mechanisms and/or the difference in reference dose (RfD) of these elements [6].
THI, which was the sum of the HI in the three exposure ways of the heavy metals, was in the order of children > adult females > adult males (Figure 3). This is in agreement with the research on urban soils in other parts of the world [9,38]. The THI value of children was several times as great as that of adults, as described below. As for children, THI-Calcisols was 12–13 times as great as for adult males and 10.7–11 times as great as for adult females; THI-Cambisols was 32–50 times as great as for adult males and 11–11.4 times as great as for adult females; THI-Fluvisols was 12–13 times as great as for adult males and 11–11.2 times as great as for adult females; and THI-Regosols was 12.6–12.7 times as great as for adult males and 11–12 times as great as for adult females This implies that the risk of non-cancerous diseases varies significantly among different soil types. The variations in THI among different age types were in the range of 0.2–0.4 for children, 0.003–0.004 for adult males, and 0.04–0.1 for adult females. These results reflect that, just like HI, THI was <1 for all soil samples and all population groups, so the local residents are not much threatened by the risk of non-cancerous diseases arising from the total of the three exposure pathways and the elements [28]. Overall, considering HQ, HI, and THI, it becomes evident that children are more exposed to the risk of non-cancerous diseases by these elements when compared to adult males and females. The reasons can be sought in children’s behavioral and metabolic features such as (i) their higher rate of breathing per unit of body weight versus adults, (ii) their more outdoor activities, (iii) contact with different things, soil, and continuously sucking their hands and fingers, and (iv) their higher rate of digestive absorption of some elements versus adults [39]. Furthermore, in all three population groups, the highest HI and THI were related to Fluvisols, followed by Calcisols, Regosols, and Cambisols (Figure 3). In other words, the residents of Fluvisols are more exposed to the risk of non-cancerous diseases induced by heavy metals than the residents of other soil types, which was observed with HQ too.

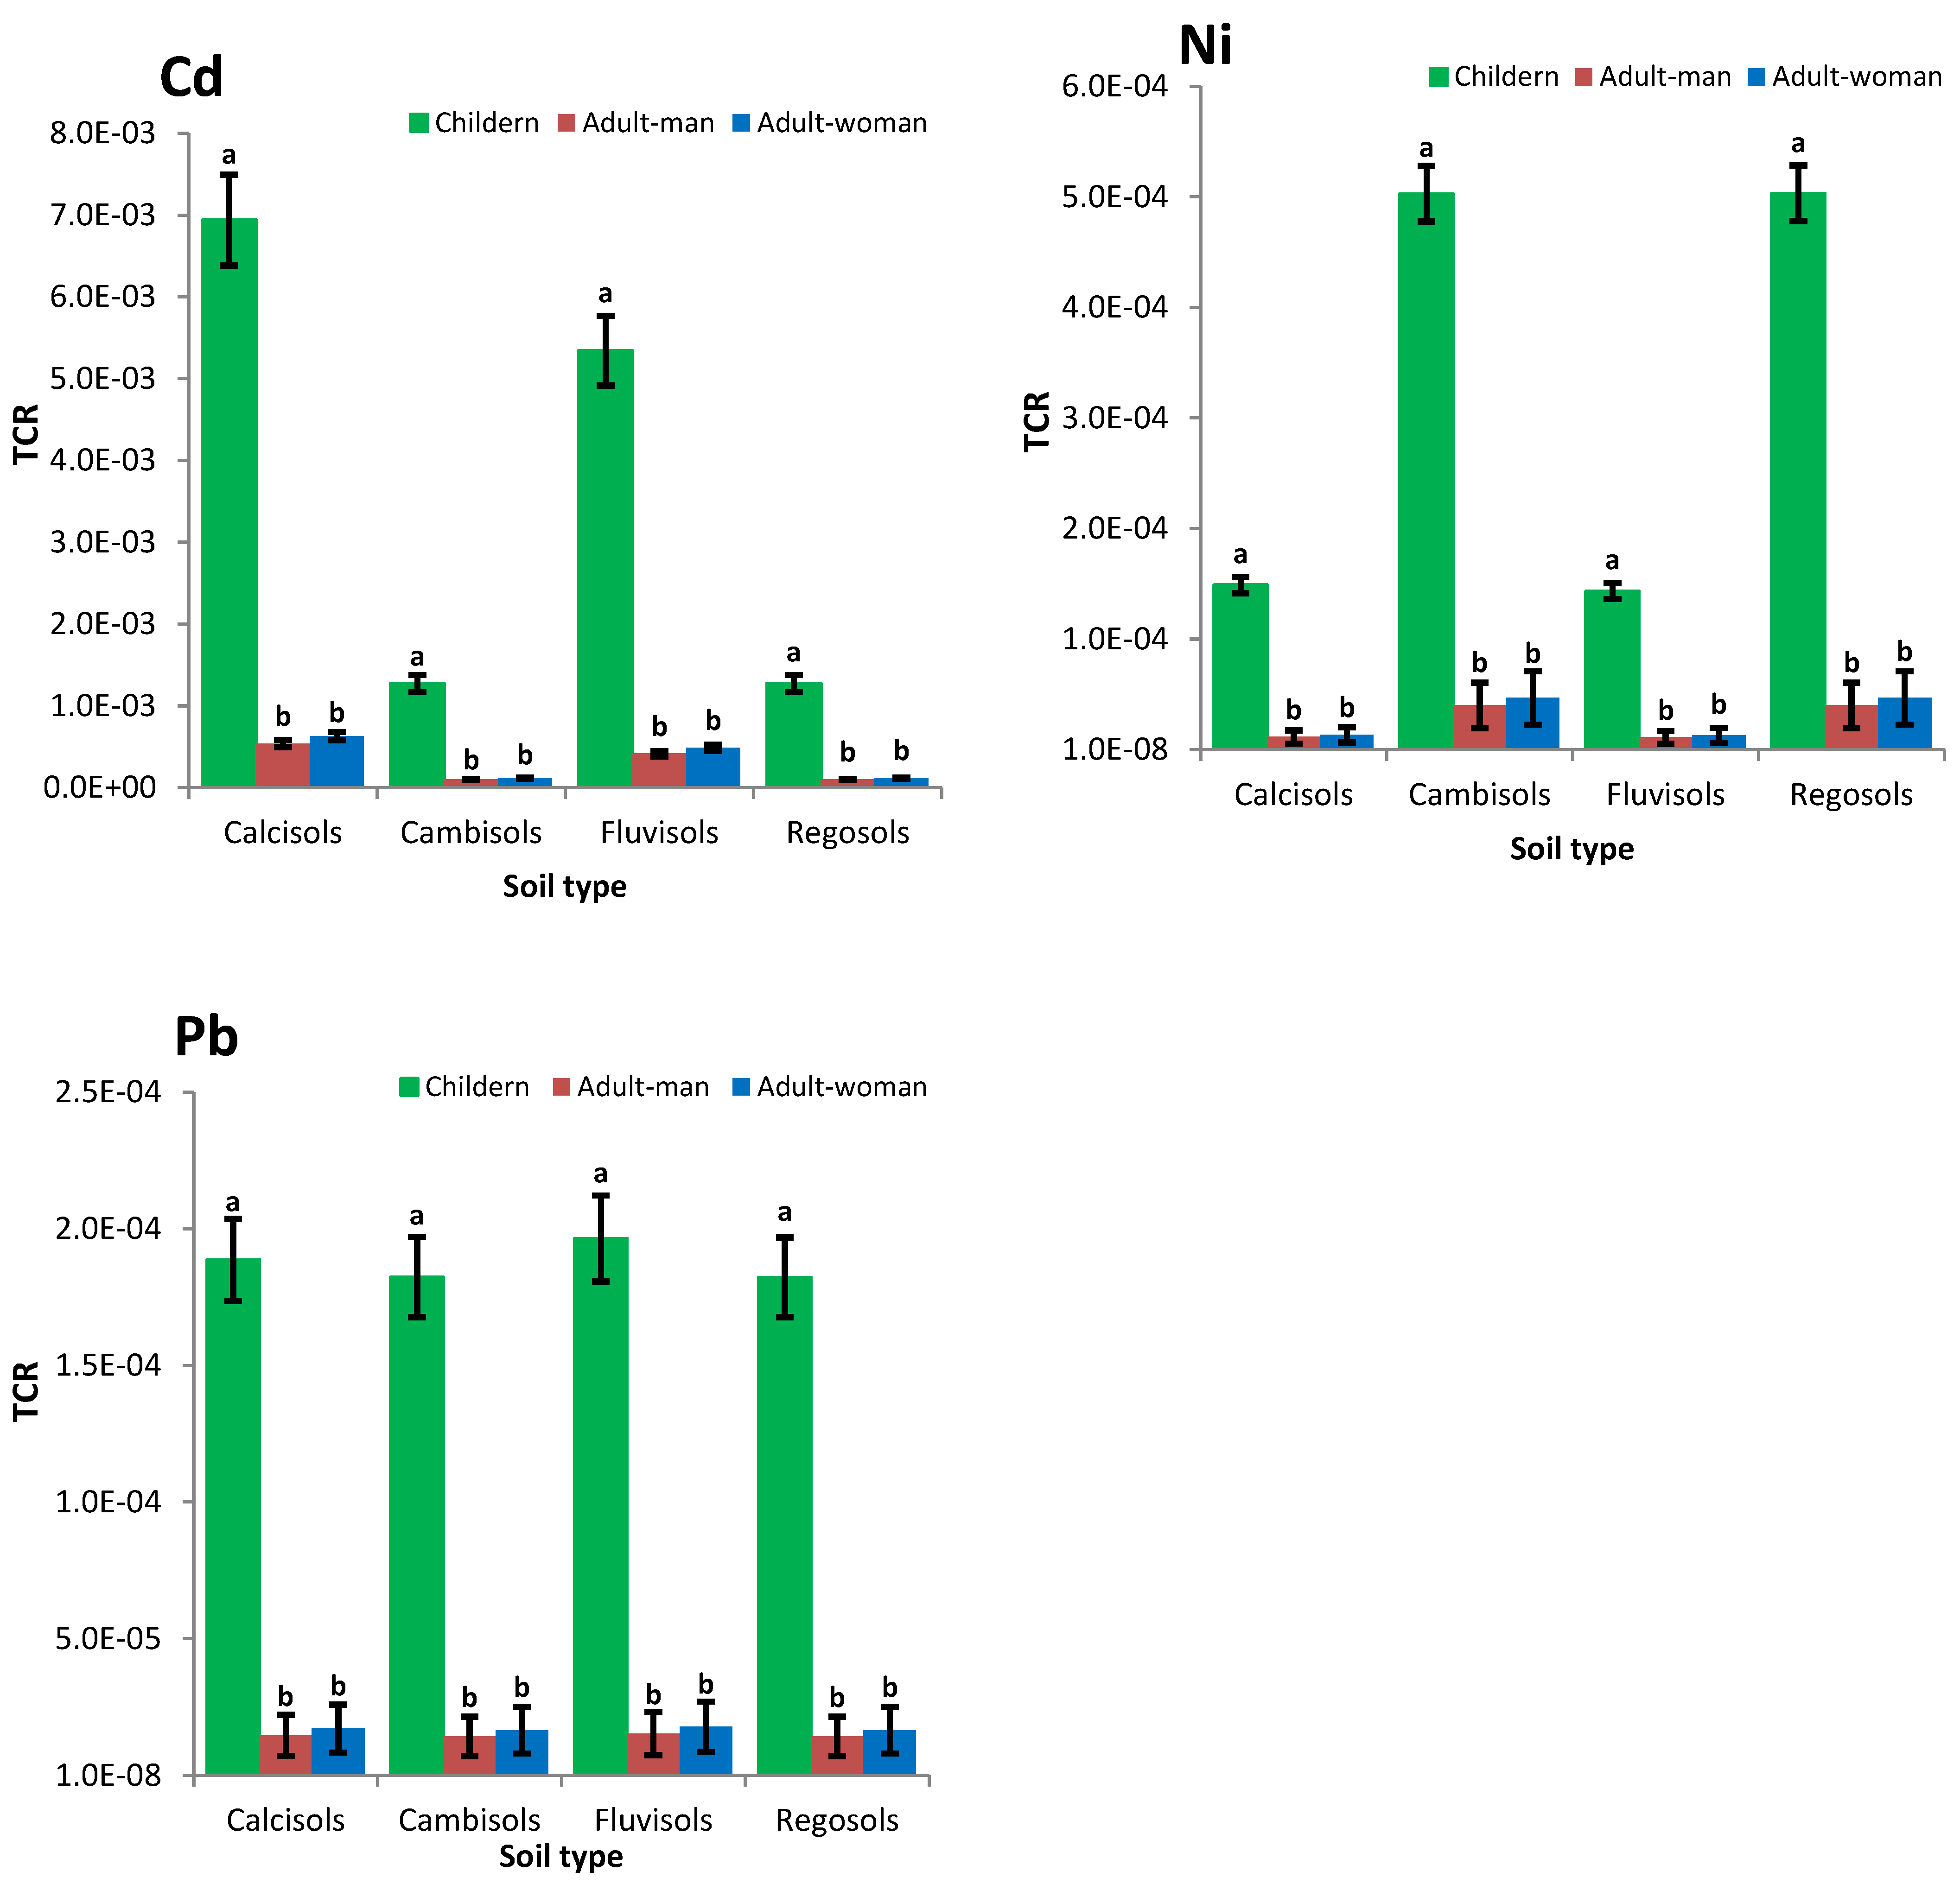
3.7. Cancergenic Risk

The risk of cancerous diseases was assessed for the three population groups in terms of the carcinogenic risk (CR) and total carcinogenic risk (TCR) for Cd, Pb, and Ni which people were exposed to through ingestion (CRing), inhalation (CRinh), and dermal contact (CRder) (Table 9). It was found that CR of these elements was in the order of Cd > Ni > Pb across all the exposure pathways and population groups. Similarly, Qing et al. [56] and Ma et al. [54] reported that Cd and Ni had the highest CR values for children and adults.
Based on the standards of the United States’ Environmental Protection Agency [28], if the CR is smaller than 1 × 10⁻⁶ (the likelihood of cancer incidence in one person per 1 million people), the carcinogenic risk is negligible, but CR > 1 × 10⁻⁴ is unpermitted and dangerous to human health. A CR in the range of 1 × 10⁻⁶ and 1 × 10⁻⁴ shows the allowed risk which is under control. The CR of all three elements (Ni, Pb, and Cd) that the three population groups were exposed to via inhalation and dermal contact in all soil types was <1 × 10⁻⁶, so the risk of respiratory and dermal carcinogenicity of these metals among the local residents is negligible, but the result was different for ingestion. The CRing for children was >1 × 10⁻⁴ in 100% of the soil samples for Cd, in 90% of the samples for Pb, and in 100% of the samples for Ni. As for adult males, it was >1 × 10⁻⁴ in 62.5% of the samples for Cd, in 5% of the samples for Pb, and in 25% of the samples for Ni. Concerning adult females, it was >1 × 10⁻⁴ in 87.5% of the samples for Cd, in 10% of the samples for Pb, and in 45% of the samples for Ni. These findings reflect that, just like the risk of non-cancerous diseases (HI) which turned out to be higher by ingestion (as already discussed), ingestion is again the most dangerous exposure pathway to cause cancers in the studied soils. The CRing value among the population groups was in the order of children > adult females > adult males.
The high risk of cancers via ingestion in children in urban areas can be attributed to the fact that the roads and passages in these regions are mostly covered with dust and dirt, and children play with it and their fingers frequently come into contact with their mouths during playing. For all three elements of Cd, Pb, and Ni in all soil types and all three population groups, the CR of different exposure pathways were in the order of CRing >> CRder > CRinh, which is similar to the risk of non-cancerous diseases (HQ and HI). This means that the risk of cancer by the ingestion of Cd, Pb, and Ni in the soils of the region is much higher than the risk of cancer by dermal contact or inhalation of these elements. These results fully agree with the reports of Pan et al. [43] and Yang et al. [50].
The TCR value in different soil types was >1 × 10⁻⁴ in children, but within the range of 1 × 10⁻⁴ and 1 × 10⁻⁶ for adult men and women (Figure 4). So, the total of ingestion, inhalation, and intentional/accidental contact with soil is in the impermissible range and hazardous to children, but it is within the controlled condition for adults. In all soil types and for all three elements, the TCR for the three population groups was most influenced by CRing (99.2–99.6%), followed by CRder and CRinh. The effect of CRder on the TCR was about 90–100 times as great as the effect of CRinh. Similarly, Wu et al. [52] reported >90% effectiveness of CRing in the TCR in the soils of north Tibet.
The highest values of soil pollution indices (PI, PIN, and PLI) and health risk indices (HQ, HI, THI, CR-Pb, CR-Cd, and TCR-Pb) were observed in Fluvisols, showing that this soil type is more polluted than the other types and has a higher potential to cause cancerous and non-cancerous risk. Fluvisols are naturally more fertile and have a higher potential for crop production [19,57]. Accordingly, these soils are more intensely cultivated (e.g., for summer crops, vegetables, corn, and sunflower) in the study site than the other types and they produce higher yields per unit area too. To gain these higher yields from these soils requires the application of various pesticides, herbicides, insecticides, and some chemical fertilizers whose formulations usually contain heavy metals and are extensively used in the region. Furthermore, Fluvisols in this region are located in the vicinity of an open wastewater canal that serves the utility systems of the urban area and farmers sometimes employ the water of this canal to irrigate their farms. So, these processes may be implicated in the significantly higher values of these indices in Fluvisols than in other soil types.

4. Conclusions

The soils in the study site included four types—Calcisols, Cambisols, Fluvisols, and Regosols. The average concentration of the studied five elements was in the order of Zn > Pb > Ni > Cu > Cd in all soil types. The highest average of most of these elements was observed in Fluvisols, followed by Calcisols, Cambisols, and Regosols. Based on PI, PIN, and PLI, most studied soils were found to be moderately polluted. In most soil samples, the non-carcinogenicity risk of all exposure pathways (THI) was the highest for children, followed by adult females and adult males. This implies that the non-carcinogenicity potential of the metals in all exposure pathways is more challenging for children. The carcinogenicity risk of Cd, Pb, and Ni for ingestion (CR) and for the total of exposure pathways (TCR) was estimated to be >1 × 10⁻⁴ for children. However, the values of CR and TCR were within the range of 1 × 10⁻⁴ and 1 × 10⁻⁶ for adult men and adult women. This reflects the fact that intentional or non-intentional contact with soil, especially its ingestion, is hazardous for children in the region, but not for adults. The values of HI, THI, CR, and TCR in different population groups were in the order of children > adult females > adult males. It can thus be said that the potential risk of cancerous and non-cancerous diseases is higher for children than for adults. In the future, the simulation of the likely hazards of heavy metals by spatial and systemic analysis of these elements based on soil classification and the development of bio-clinical models for the whole soil–food–human system can contribute to reducing and managing the health risks of different population groups.

Author Contributions

S.R. and M.A. designed the study and wrote the manuscript and A.N. reviewed and edited the manuscript. All authors have read and agreed to the published version of the manuscript.

Funding

This research received no external funding.

Institutional Review Board Statement

Not applicable.

Informed Consent Statement

Not applicable.

Data Availability Statement

The data of the current study are available from the corresponding author upon a reasonable request.

Acknowledgments

The authors give a lot of thanks to Urmia University, Urmia, I.R. (Iran), for their support in this work.

Conflicts of Interest

The authors declare no conflict of interest.

References

  1. United Nations, Department of Economic and Social Affairs, Population Division. World Urbanization Prospects: The 2014 Revision. Available online: http://esa.un.org/unpd/wup/Country-Profiles/Default.aspx (accessed on 20 April 2023).
  2. Yang, J.L.; Zhang, G.L. Formation, characteristics and eco-environmental implications of urban soils—A review. Soil Sci. Plant Nutr. 2015, 61, 30–46. [Google Scholar] [CrossRef] [Green Version]
  3. Möller, A.; Müller, H.W.; Abdullah, A.; Abdelgawad, G.; Utermann, J. Urban soil pollution in Damascus, Syria: Concentrations and patterns of heavy metals in the soils of the Damascus Ghouta. Geoderma 2005, 124, 63–71. [Google Scholar] [CrossRef]
  4. Nannoni, F.; Rossi, S.; Protano, G. Soil properties and metal accumulation by earthworms in the Siena urban area (Italy). Appl. Soil Ecol. 2014, 77, 9–17. [Google Scholar] [CrossRef]
  5. Ding, Z.; Hu, X. Ecological and human health risks from metal (loid) s in peri-urban soil in Nanjing, China. Environ. Geochem. Health 2014, 36, 399–408. [Google Scholar] [CrossRef]
  6. Rezapour, S.; Samadi, A.; Kalavrouziotis, I.K.; Ghaemian, N. Impact of the uncontrolled leakage of leachate from a municipal solid waste landfill on soil in a cultivated-calcareous environment. Waste Manag. 2018, 82, 51–61. [Google Scholar] [CrossRef]
  7. Rezapour, S.; Atashpaz, B.; Moghaddam, S.S.; Damalas, C.A. Heavy metal bioavailability and accumulation in winter wheat (Triticum aestivum L.) irrigated with treated wastewater in calcareous soils. Sci. Total Environ. 2019, 656, 261–269. [Google Scholar] [CrossRef]
  8. National Research Council (NRC). Bioavailability of Contaminants in Soils and Sediments, Processes, Tools, and Applications; National Academies Press: Washington, DC, USA, 2003. [Google Scholar]
  9. Huang, Y.; Chen, Q.; Deng, M.; Japenga, J.; Li, T.; Yang, X.; He, Z. Heavy metal pollution and health risk assessment of agricultural soils in a typical peri-urban area in southeast China. J. Environ. Manag. 2018, 207, 159–168. [Google Scholar] [CrossRef]
  10. Hu, W.; Wang, H.; Dong, L.; Huang, B.; Borggaard, O.K.; Hansen, H.C.; He, Y.; Holm, P.E. Source identification of heavy metals in peri-urban agricultural soils of southeast China: An integrated approach. Environ. Pollut. 2018, 237, 650–661. [Google Scholar] [CrossRef]
  11. Walraven, N.; van Gaans, P.F.; van Der Veer, G.; van Os, B.J.; Klaver, G.T.; Vriend, S.P.; Middelburg, J.J.; Davies, G.R. Tracing diffuse anthropogenic Pb sources in rural soils by means of Pb isotope analysis. Appl. Geochem. 2013, 37, 242–257. [Google Scholar] [CrossRef]
  12. Gąsiorek, M.; Kowalska, J.; Mazurek, R.; Pająk, M. Comprehensive assessment of heavy metal pollution in topsoil of historical urban park on an example of the Planty Park in Krakow (Poland). Chemosphere 2017, 179, 148–158. [Google Scholar] [CrossRef]
  13. Baltas, H.; Sirin, M.; Gökbayrak, E.; Ozcelik, A.E. A case study on pollution and a human health risk assessment of heavy metals in agricultural soils around Sinop province, Turkey. Chemosphere 2020, 241, 125015. [Google Scholar] [CrossRef]
  14. Dong, B.; Zhang, R.; Gan, Y.; Cai, L.; Freidenreich, A.; Wang, K.; Guo, T.; Wang, H. Multiple methods for the identification of heavy metal sources in cropland soils from a resource-based region. Sci. Total Environ. 2019, 651, 3127–3138. [Google Scholar] [CrossRef]
  15. Adimalla, N.; Chen, J.; Qian, H. Spatial characteristics of heavy metal contamination and potential human health risk assessment of urban soils: A case study from an urban region of South India. Ecotoxicol. Environ. Saf. 2020, 194, 110406. [Google Scholar] [CrossRef]
  16. Wang, F.; Guan, Q.; Tian, J.; Lin, J.; Yang, Y.; Yang, L.; Pan, N. Contamination characteristics, source apportionment, and health risk assessment of heavy metals in agricultural soil in the Hexi Corridor. Catena 2020, 191, 104573. [Google Scholar] [CrossRef]
  17. Wu, Z.; Chen, Y.; Han, Y.; Ke, T.; Liu, Y. Identifying the influencing factors controlling the spatial variation of heavy metals in suburban soil using spatial regression models. Sci. Total Environ. 2020, 717, 137212. [Google Scholar] [CrossRef]
  18. Zhou, X.Y.; Wang, X.R. Impact of industrial activities on heavy metal contamination in soils in three major urban agglomerations of China. J. Clean. Prod. 2019, 230, 1–10. [Google Scholar] [CrossRef]
  19. IUSS Working Group WRB. World Reference Base for Soil Resources. International Soil Classification System for Naming Soils and Creating Legends for Soil Maps, 4th ed.; International Union of Soil Sciences (IUSS): Vienna, Austria, 2022. [Google Scholar]
  20. Bouyoucos, G.J. Hydrometer method improved for making particle size analyses of soils. Agron. J. 1962, 5, 464–465. [Google Scholar] [CrossRef]
  21. Nelson, D.A.; Sommers, L. Total carbon, organic carbon, and organic matter. In Methods of Soil Analysis: Part 2 Chemical and Microbiological Properties; John Wiley & Sons: Hoboken, NJ, USA, 1983; Volume 9, pp. 539–579. [Google Scholar]
  22. Nelson, R.E. Carbonate and gypsum. In Methods of Soil Analysis: Part 2 Chemical and Microbiological Properties; John Wiley & Sons: Hoboken, NJ, USA, 1983; Volume 9, pp. 181–197. [Google Scholar]
  23. Sparks, D.L.; Page, A.; Helmke, P.A.; Loeppert, R.H. (Eds.) Methods of Soil Analysis, Part 3: Chemical Methods; John Wiley & Sons: Hoboken, NJ, USA, 2020. [Google Scholar]
  24. Soon, Y.R.; Abboud, S. Cadmium, chromium, and nickel. In Soil Sampling and Methods of Soil Analysis; Carter, M.R., Ed.; Lewis Publishers: Boca Raton, FL, USA, 1993; pp. 101–108. [Google Scholar]
  25. Zhang, C.; Li, Z.; Yang, W.; Pan, L.; Gu, M.; Lee, D. Assessment of metals pollution on agricultural soil surrounding a lead–zinc mining area in the karst region of Guangxi, China. Bull. Environ. Contam. Toxicol. 2013, 6, 736–741. [Google Scholar] [CrossRef]
  26. Esmaeili, A.; Moore, F.; Keshavarzi, B.; Jaafarzadeh, N.; Kermani, M. A geochemical survey of heavy metals in agricultural and background soils of the Isfahan industrial zone, Iran. Catena 2014, 121, 88–98. [Google Scholar] [CrossRef]
  27. Cabrera, F.; Clemente, L.; Barrientos, E.D.; López, R.; Murillo, J.M. Heavy metal pollution of soils affected by the Guadiamar toxic flood. Sci. Total Environ. 1999, 242, 117–129. [Google Scholar] [CrossRef] [Green Version]
  28. Norris, G.; Duvall, R. EPA Positive Matrix Factorization (PMF) 5.0-Fundamentals and User Guide; US Environmental Protection Agency: Washington, DC, USA, 2014. [Google Scholar]
  29. Hazelton, P.; Murphy, B. Interpreting Soil Test Results: What do All the Numbers Mean? CSIRO Publishing: Clayton, Australia, 2016. [Google Scholar]
  30. Ntzala, G.; Koukoulakis, P.H.; Papadopoulos, A.H.; Leotsinidis, M.; Sazakli, E.; Kalavrouziotis, I.K. Interrelationships of pollution load index, transfer factor, and concentration factor under the effect of sludge. Environ. Monit. Assess. 2013, 185, 5231–5242. [Google Scholar] [CrossRef]
  31. Golia, E.E.; Dimirkou, A.; Mitsios, I.K. Levels of heavy metals pollution in different types of soil of central Greece. Bull. Environ. Contam. Toxicol. 2008, 3, 206–210. [Google Scholar] [CrossRef]
  32. Teng, Y.; Ni, S.; Wang, J.; Zuo, R.; Yang, J. A geochemical survey of trace elements in agricultural and non-agricultural topsoil in Dexing area, China. J. Geochem. Explor. 2010, 104, 118–127. [Google Scholar] [CrossRef]
  33. Kabata-Pendias, A. Trace Elements in Soils and Plants; CRC Press: Boca Raton, FL, USA, 2010. [Google Scholar]
  34. Shaheen, S.M.; Rinklebe, J.; Rupp, H.; Meissner, R. Temporal dynamics of pore water concentrations of Cd, Co, Cu, Ni, and Zn and their controlling factors in a contaminated floodplain soil assessed by undisturbed groundwater lysimeters. Environ. Pollut. 2014, 191, 223–231. [Google Scholar] [CrossRef]
  35. Zhou, T.; Wu, L.; Luo, Y.; Christie, P. Effects of organic matter fraction and compositional changes on distribution of cadmium and zinc in long-term polluted paddy soils. Environ. Pollut. 2018, 232, 514–522. [Google Scholar] [CrossRef]
  36. Rinklebe, J.; Antoniadis, V.; Shaheen, S.M.; Rosche, O.; Altermann, M. Health risk assessment of potentially toxic elements in soils along the Central Elbe River, Germany. Environ. Int. 2019, 126, 76–88. [Google Scholar] [CrossRef]
  37. Rezapour, S.; Moazzeni, H. Assessment of the selected trace metals in relation to long-term agricultural practices and landscape properties. Int. J. Environ. Sci. Technol. 2016, 13, 2939–2950. [Google Scholar] [CrossRef]
  38. Chabukdhara, M.; Nema, A.K. Heavy metals assessment in urban soil around industrial clusters in Ghaziabad, India: Probabilistic health risk approach. Ecotoxicol. Environ. Saf. 2013, 87, 57–64. [Google Scholar] [CrossRef]
  39. Liu, C.; Lu, L.; Huang, T.; Huang, Y.; Ding, L.; Zhao, W. The distribution and health risk assessment of metals in soils in the vicinity of industrial sites in Dongguan, China. Int. J. Environ. Res. Public Health 2016, 13, 832. [Google Scholar] [CrossRef] [Green Version]
  40. Liu, C.W.; Lin, K.H.; Kuo, Y.M. Application of factor analysis in the assessment of groundwater quality in a blackfoot disease area in Taiwan. Sci. Total Environ. 2003, 313, 77–89. [Google Scholar] [CrossRef]
  41. Karim, Z.; Qureshi, B.A.; Mumtaz, M. Geochemical baseline determination and pollution assessment of heavy metals in urban soils of Karachi, Pakistan. Ecol. Indic. 2015, 48, 358–364. [Google Scholar] [CrossRef]
  42. Mazurek, R.; Kowalska, J.; Gąsiorek, M.; Zadrożny, P.; Józefowska, A.; Zaleski, T.; Kępka, W.; Tymczuk, M.; Orłowska, K. Assessment of heavy metals contamination in surface layers of Roztocze National Park forest soils (SE Poland) by indices of pollution. Chemosphere 2017, 168, 839–850. [Google Scholar] [CrossRef]
  43. Pan, L.; Wang, Y.; Ma, J.; Hu, Y.; Su, B.; Fang, G.; Wang, L.; Xiang, B. A review of heavy metal pollution levels and health risk assessment of urban soils in Chinese cities. Environ. Sci. Pollut. Res. 2018, 25, 1055–1069. [Google Scholar] [CrossRef]
  44. Argyraki, A.; Kelepertzis, E.; Botsou, F.; Paraskevopoulou, V.; Katsikis, I.; Trigoni, M. Environmental availability of trace elements (Pb, Cd, Zn, Cu) in soil from urban, suburban, rural and mining areas of Attica, Hellas. J. Geochem. Explor. 2018, 187, 201–213. [Google Scholar] [CrossRef]
  45. Yu, J.; Sun, L.; Wang, B.; Qiao, Y.; Xiang, J.; Hu, S.; Yao, H. Study on the behavior of heavy metals during thermal treatment of municipal solid waste (MSW) components. Environ. Sci. Pollut. Res. 2016, 23, 253–265. [Google Scholar] [CrossRef]
  46. Samadder, S.R.; Prabhakar, R.; Khan, D.; Kishan, D.; Chauhan, M.S. Analysis of the contaminants released from municipal solid waste landfill site: A case study. Sci. Total Environ. 2017, 580, 593–601. [Google Scholar] [CrossRef]
  47. Ye, J.; Chen, X.; Chen, C.; Bate, B. Emerging sustainable technologies for remediation of soils and groundwater in a municipal solid waste landfill site—A review. Chemosphere 2019, 227, 681–702. [Google Scholar] [CrossRef]
  48. Lv, J.; Liu, Y. An integrated approach to identify quantitative sources and hazardous areas of heavy metals in soils. Sci. Total Environ. 2019, 646, 19–28. [Google Scholar] [CrossRef]
  49. Franco-Uría, A.; López-Mateo, C.; Roca, E.; Fernández-Marcos, M.L. Source identification of heavy metals in pastureland by multivariate analysis in NW Spain. J. Hazard. Mater. 2009, 165, 1008–1015. [Google Scholar] [CrossRef]
  50. Yang, S.; Zhao, J.; Chang, S.X.; Collins, C.; Xu, J.; Liu, X. Status assessment and probabilistic health risk modeling of metals accumulation in agriculture soils across China: A synthesis. Environ. Int. 2019, 128, 165–174. [Google Scholar] [CrossRef]
  51. Kalavrouziotis, I.K.; Koukoulakis, P.H.; Ntzala, G.; Papadopoulos, A. Proposed indices for assessing soil pollution under the application of sludge. Water Air Soil Pollut. 2012, 8, 5189–5196. [Google Scholar] [CrossRef]
  52. Wu, J.; Lu, J.; Li, L.; Min, X.; Luo, Y. Pollution, ecological-health risks, and sources of heavy metals in soil of the northeastern Qinghai-Tibet Plateau. Chemosphere 2018, 201, 234–242. [Google Scholar] [CrossRef]
  53. Chen, H.; Teng, Y.; Lu, S.; Wang, Y.; Wang, J. Contamination features and health risk of soil heavy metals in China. Sci. Total Environ. 2015, 512, 143–153. [Google Scholar] [CrossRef]
  54. Ma, W.; Tai, L.; Qiao, Z.; Zhong, L.; Wang, Z.; Fu, K.; Chen, G. Contamination source apportionment and health risk assessment of heavy metals in soil around municipal solid waste incinerator: A case study in North China. Sci. Total Environ. 2018, 631, 348–357. [Google Scholar] [CrossRef]
  55. Zhang, Y.; Yin, C.; Cao, S.; Cheng, L.; Wu, G.; Guo, J. Heavy metal accumulation and health risk assessment in soil-wheat system under different nitrogen levels. Sci. Total Environ. 2018, 622, 1499–1508. [Google Scholar] [CrossRef]
  56. Qing, X.; Yutong, Z.; Shenggao, L. Assessment of heavy metal pollution and human health risk in urban soils of steel industrial city (Anshan), Liaoning, Northeast China. Ecotoxicol. Environ. Saf. 2015, 120, 377–385. [Google Scholar] [CrossRef]
  57. Sun, J.; Zhao, X.; Fang, Y.; Gao, F.; Wu, C.; Xia, J. Effects of water and salt for groundwater-soil systems on root growth and architecture of Tamarix chinensis in the Yellow River Delta, China. J. For. Res. 2023, 34, 441–452. [Google Scholar] [CrossRef]
Figure 1. Location of the study area. The map of individual study soil profiles (A) and location of the study region (B).
Sustainability 15 12157 g001
Figure 2. Comparison of the mean values of the pollution load index (PLI) for different soil types. Different letters represent significant differences in the PLI values between soil types at the p < 0.05 confidence level using Duncan’s test.
Sustainability 15 12157 g002
Figure 3. Comparison of the mean values of hazard index (HI) for pathways of ingestion (a), inhalation (b), dermal contact (c), and total exposure hazard index (THI, (d)) in different soil types. Different letters represent significant differences in the HI and THI values between soil types at a p < 0.05 confidence level using Duncan’s test.
Sustainability 15 12157 g003
Figure 4. Comparison of the mean values of total carcinogenic risk (TCR) for the metals of Cd, Ni, and Pb in different soil types. Different letters represent significant differences in the TCR values between soil types at a p < 0.05 confidence level Duncan’s test.
Sustainability 15 12157 g004
Table 1. The description and reference values of basic parameters for risk assessment models.
ParameterDefinitionUnitChildMaleFemale
IRingIngestion ratemg d−1200100100
EFExposure frequencyday year−1350250250
EDExposure durationyear62525
BWAverage body weightkg156858
ATAverage life span for heavy metal-ED × 365 (2190)ED × 365 (9125)9125
IRinhInhalation ratem3 d−17.62020
PEFParticulate emission factorm3 kg−11.36 × 1091.36 × 1091.36 × 109
SAExposed skin areacm2269939503950
AFSkin adhesive factormg cm−2 d−10.20.070.07
ABSSkin absorption factor-1 × 10−31 × 10−31 × 10−3
Table 2. Summary statistics of selected physicochemical properties of the soils.
Soil Parameter Calcisols (N = 16)
MinMaxMean ± SDCV (%)
Clay (%)17.543.529.1 ± 8.428.9
Silt (%)34.054.542.4 ± 6.114.3
Sand(%)12.046.027.8 ± 11.641.7
CEC (cmol kg−1)19.125.723.8 ± 1.87.5
pH7.48.17.8 ± 0.22.5
EC (dS m−1)0.71.00.8 ± 0.219.5
OM (%)0.63.12.0 ± 1.135.3
CCE (%)14.534.027.6 ± 5.419.4
Cambisols (10)
Clay (%)44.050.047.1 ± 2.55.2
Silt (%)31.534.032.6 ± 1.13.2
Sand(%)17.024.020.3 ± 2.713.1
CEC (cmol kg−1)19.822.121.1 ± 0.94.2
pH7.67.87.7 ± 0.11.3
EC (dS m−1)0.620.750.7 ± 0.046.2
OM (%)3.61.32.6 ± 0.325.8
CCE (%)4.513.010.6 ± 3.835.6
Fluvisols (12)
Clay (%)24.046.033.8 ± 8.625.5
Silt (%)26.046.535.5 ± 6.919.6
Sand(%)25.040.030.7 ± 4.414.3
CEC (cmol kg−1)21.031.225.0 ± 3.313.1
pH7.48.07.7 ± 0.22.8
EC (dS m−1)0.71.20.8 ± 0.220.9
OM (%)1.35.23.0 ± 0.727.8
CCE (%)10.033.021.1 ± 7.736.4
Regosols (N = 12)
Clay (%)20.028.524.3 ± 3.212.1
Silt (%)31.540.036.5 ± 2.98.1
Sand(%)33.047.539.3 ± 4.611.8
CEC (cmol kg−1)14.225.018.8 ± 3.921.1
pH7.47.97.7 ± 0.22.0
EC (dS m−1)0.71.00.8 ± 0.219.5
OM (%)0.99.63.2 ± 2.3105.2
CCE (%)8.544.525.1 ± 12.449.3
CEC—Cation Exchangeable Capacity; EC—Electrical Conductivity; OM—Organic Matter; CCE—Calcium Carbonate Equivalent; SD—Standard Deviation; CV—Coefficient of Variation.
Table 3. Summary statistics of heavy metal concentrations of the soils.
Calcisols (N = 16)
Heavy MetalMinMaxMean ± SDCV (%)
Zn (mg kg−1)59.8118.377.7 c ± 17.122.0
Cu (mg kg−1)18.2850.3834.45 b ± 8.4314.5
Cd (mg kg−1)0.540.980.76 a ± 0.1347.1
Pb (mg kg−1)24.2899.5551.69 a ± 22.9252.3
Ni (mg kg−1)12.58120.3861.16 a ± 41.9918.6
Cambisols (10)
Zn (mg kg−1)75.6110.887.8 b ± 15.017.1
Cu (mg kg−1)13.156.338.7 b ± 17.114.2
Cd (mg kg−1)0.50.90.7 a ± 0.244.5
Pb (mg kg−1)25.966.643.0 c ± 18.643.3
Ni (mg kg−1)15.4113.141.9 b ± 22.022.5
Fluvisols (12)
Zn (mg kg−1)57.4284.996.6 a ± 60.436.5
Cu (mg kg−1)26.8221.461.1 a ± 41.918.5
Cd (mg kg−1)0.60.90.8 a ± 0.168.2
Pb (mg kg−1)30.788.053.8 a ± 22.569.7
Ni (mg kg−1)13.3100.445.4 b ± 31.612.5
Regosols (N = 12)
Zn (mg kg−1)56.7125.984.4 b ± 22.827.0
Cu (mg kg−1)10.140.028.8 c ± 8.519.5
Cd (mg kg−1)0.50.80.7 a ± 0.141.4
Pb (mg kg−1)21.977.748.7 b ± 19.249.4
Ni (mg kg−1)10.3122.138.3 c ± 35.613.2
SD—Standard deviation; CV—Coefficient of variation. Values with the same lowercase letters within the means column are not significantly different at p < 0.05.
Table 4. Correlation coefficients of heavy metals and selected soil properties in the soils (* p < 0.05; ** p < 0.01) (N = 50).
ZnCuCdPbNiAl2O3Fe2O3ClaySiltSandpHECOCCEC
Zn1.00
Cu0.261.00
Cd0.47 **0.081.00
Pb0.290.050.61 **1.00
Ni0.230.59 **−0.26−0.221.00
Al2O30.39 *0.34 *0.230.270.58 **1.00
Fe2O0.31 *0.36 *0.210.200.55 **0.89 **1.00
Clay0.150.070.010.020.090.47 *0.43 *1.00
Silt0.05−0.040.02−0.040.050.060.030.29 *1.00
Sand−0.14−0.06−0.03−0.04−0.11−0.29−0.24−0.23−0.071.00
pH−0.05−0.020.000.00−0.03−0.20−0.150.170.00−0.12100
EC0.08−0.05−0.090.00−0.01−0.02−0.030.010.060.09−0.31 *1.00
OC0.32 *0.53 **0.190.160.210.180.160.280.02−0.05−0.200.241.00
CEC0.150.210.04−0.010.000.150.130.41 *0.10−0.07−0.270.000.36 *1.00
Table 5. Results of the principal component analysis (PCA) for heavy metals in the soils.
Principal ComponentsPC1PC2PC3
Eigenvalues2.0201.8041.683
Variance (%)31.61228.1814.684
Cumulative variance (%)31.6059.78174.531
Zn0.140.890.078
Cu−0.080.110.87
Cd0.760.16−0.09
Pb0.81−0.17−0.07
Ni−0.04−0.210.76
Clay−0.19−0.180.23
CEC−0.130.190.21
OM−0.070.140.51
CCE0.370.21−0.08
Table 6. Percentages of class distribution for PI in total soil samples.
Pollution ClassZnCuCdPbNi
Clean-70-2047.5
Low32.525804522.5
Moderate50-2032.510
High12.5--2.520
Very High55---
Clean: PI ≤ 1; Low: 1 < PI ≤ 2; Moderate: 2 < PI ≤ 3; High: 3 < PI ≤ 6; Very High: PI > 6.
Table 7. Percentage of class distribution for PIN in different soil types.
Soil TypeMinMaxMeanPIN Classes (% of Total Sample)
LMH
Calcisols1.813.282.6612.55037.5
Cambisols2.213.122.59------7525
Fluvisols1.876.883.116.758.325
Regosols1.83.312.4912.562.525
L: Low (1 < PIN < 2), M: Moderate (2 < PIN < 3), H: High (PIN > 3).
Table 8. Exposure values of non-carcinogenic risks (HI) for different population groups (N = 50).
Heavy Metal ChildAdults-MaleAdults-Female
IngestionInhalationDermalIngestionInhalationDermalIngestionInhalationDermal
ZnMin2.45 × 10−36.75 × 10−83.2624 × 10−51.91 × 10−42.79 × 10−82.62 × 10−62.23 × 10−53.29 × 10−83.08 × 10−6
Max5.38 × 10−23.39 × 10−71.63 × 10−49.59 × 10−41.40 × 10−71.31 × 10−51.12 × 10−31.65 × 10−71.54 × 10−5
Mean5.22 × 10−31.02 × 10−74.92 × 10−52.89 × 10−44.22 × 10−83.97 × 10−62.77 × 10−44.97 × 10−84.65 × 10−6
SD8.20 × 10−34.38 × 10−82.11 × 10−51.24 × 10−41.81 × 10−81.70 × 10−61.86 × 10−42.13 × 10−82.00 × 10−6
CuMin5.93 × 10−31.62 × 10−75.25 × 10−54.61 × 10−46.72 × 10−84.23 × 10−65.39 × 10−47.91 × 10−84.96 × 10−6
Max1.79 × 10−11.96 × 10−66.36 × 10−45.58 × 10−38.14 × 10−75.12 × 10−56.53 × 10−39.58 × 10−76.01 × 10−5
Mean1.91 × 10−23.77 × 10−71.22 × 10−41.07 × 10−31.56 × 10−79.84 × 10−61.25 × 10−31.83 × 10−71.15 × 10−5
SD2.98 × 10−23.67 × 10−71.19 × 10−41.04 × 10−31.52 × 10−79.57 × 10−61.22 × 10−31.78 × 10−71.12 × 10−5
CdMin6.89 × 10−31.91 × 10−73.70 × 10−45.35 × 10−47.84 × 10−82.94 × 10−56.25 × 10−49.22 × 10−83.45 × 10−5
Max1.58 × 10−13.49 × 10−76.76 × 10−49.9 × 10−41.45 × 10−75.44 × 10−51.15 × 10−31.70 × 10−76.38 × 10−5
Mean1.38 × 10−22.72 × 10−75.31 × 10−47.33 × 10−41.07 × 10−74.03 × 10−58.57 × 10−41.26 × 10−74.73 × 10−5
SD2.37 × 10−24.71 × 10−89.11 × 10−51.33 × 10−41.95 × 10−87.33 × 10−61.56 × 10−42.29 × 10−88.60 × 10−6
PbMin9.01 × 10−22.46 × 10−61.58 × 10−37.47 × 10−41.02 × 10−61.27 × 10−48.18 × 10−31.19 × 10−61.49 × 10−4
Max3.071.00 × 10−56.48 × 10−32.87 × 10−24.20 × 10−65.22 × 10−43.35 × 10−24.92 × 10−66.12 × 10⁻⁴
Mean2.74 × 10−25.24 × 10−63.41 × 10−31.36 × 10−22.15 × 10−62.68 × 10−41.72 × 10−22.52 × 10−63.14 × 10−4
SD4.62 × 10−12.15 × 10−61.77 × 10−37.19 × 10−38.95 × 10−71.11 × 10−47.16 × 10−31.05 × 10−61.31 × 10−4
NiMin8.65 × 1032.46 × 10−79.08 × 10−56.72 × 10−49.56 × 10−86.85 × 10−67.85 × 10−41.12 × 10−78.03 × 10−6
Max6.75 × 10−12.08 × 10−67.69 × 10−46.16 × 10−38.77 × 10−76.28718 × 10−57.20 × 10−31.03 × 10−67.37 × 10−5
Mean5.38 × 10−21.12 × 10−64.04 × 10−42.73 × 10−33.89 × 10−72.79 × 10−53.19 × 10−34.57 × 10−73.27 × 10−5
SD1.03 × 10−16.24 × 10−72.3 × 10−41.82 × 10−32.59 × 10−71.85 × 10−52.12 × 10−33.04 × 10−72.17 × 10−5
Table 9. Exposure values of carcinogenic risks (CR) for different population groups (N = 50).
Heavy Metals ChildAdults-MaleAdult-Female
IngestionInhalationDermalIngestionInhalationDermalIngestionInhalationDermal
NiMean5.14 × 10−45.61 × 10−91.23 × 10−63.02 × 10−55.31 × 10−98.33 × 10−85.3 × 10−57.81 × 10−91.46 × 10−7
SD4.02 × 10−43.99 × 10−91.07 × 10−63.11 × 10−54.61 × 10−98.58 × 10−83.48 × 10−55.17 × 10−99.68 × 10−8
Max1.28 × 10−31.61 × 10−83.40 × 10−69.96 × 10−51.51 × 10−82.74 × 10−71.21 × 10−41.78 × 10−83.34 × 10−7
Min1.03 × 10−41.42 × 10−94.11 × 10−88.02 × 10−61.23 × 10−92.21 × 10−81.32 × 10−51.94 × 10−93.64 × 10−8
PbMean1.85 × 10−44.88 × 10−94.56 × 10−71.44 × 10−52.11 × 10−95.47 × 10−81.68 × 10−52.48 × 10−94.66 × 10−8
SD7.74 × 10−52.25 × 10−92.41 × 10−76.009 × 10−68.80 × 10−103.77 × 10−86.97 × 10−61.03 × 10−91.93 × 10−8
Max3.62 × 10−49.95 × 10−99.61 × 10−72.81 × 10−54.12 × 10−91.77 × 10−73.28 × 10−54.85 × 10−99.08 × 10−8
Min8.84 × 10−51.26 × 10−92.36 × 10−86.86 × 10−61.005 × 10−91.88 × 10−88.02 × 10−61.18 × 10−92.21 × 10−8
CdMean1.41 × 10−43.69 × 10−95.41 × 10−71.1 × 10−51.61 × 10−93.02 × 10−81.28 × 10−51.89 × 10−93.5 × 10−8
SD2.56 × 10−59.15 × 10−105.54 × 10−71.99 × 10−62.92 × 10−105.50 × 10−92.32 × 10−63.44 × 10−106.45 × 10−9
Max1.91 × 10−45.24 × 10−93.45 × 10−61.4847 × 10−52.17 × 10−94.08 × 10−81.73 × 10−52.55 × 10−94.79 × 10−8
Min1.03 × 10−41.43 × 10−92.68 × 10−88.02 × 10−61.17 × 10−92.21 × 10−89.38 × 10−61.38 × 10−92.59 × 10−8
Disclaimer/Publisher’s Note: The statements, opinions and data contained in all publications are solely those of the individual author(s) and contributor(s) and not of MDPI and/or the editor(s). MDPI and/or the editor(s) disclaim responsibility for any injury to people or property resulting from any ideas, methods, instructions or products referred to in the content.

