
Analyzing Driving Safety on Prairie Highways: A Study of Drivers’ Visual Search Behavior in Varying Traffic Environments


Abstract
1. Introduction
- Different types of traffic environments influence drivers’ visual distribution and transfer modes;
- An increase in environmental elements along both sides of the road intensifies the difficulty of obtaining visual information and broadens the driver’s visual search range;
- An increase in traffic environment information expedites the driver’s visual search behavior, often resulting in decreased visual stability.
2. Materials and Methods
2.1. Real Vehicle Experiment
2.1.1. Experimental Road
2.1.2. Experimental Participants
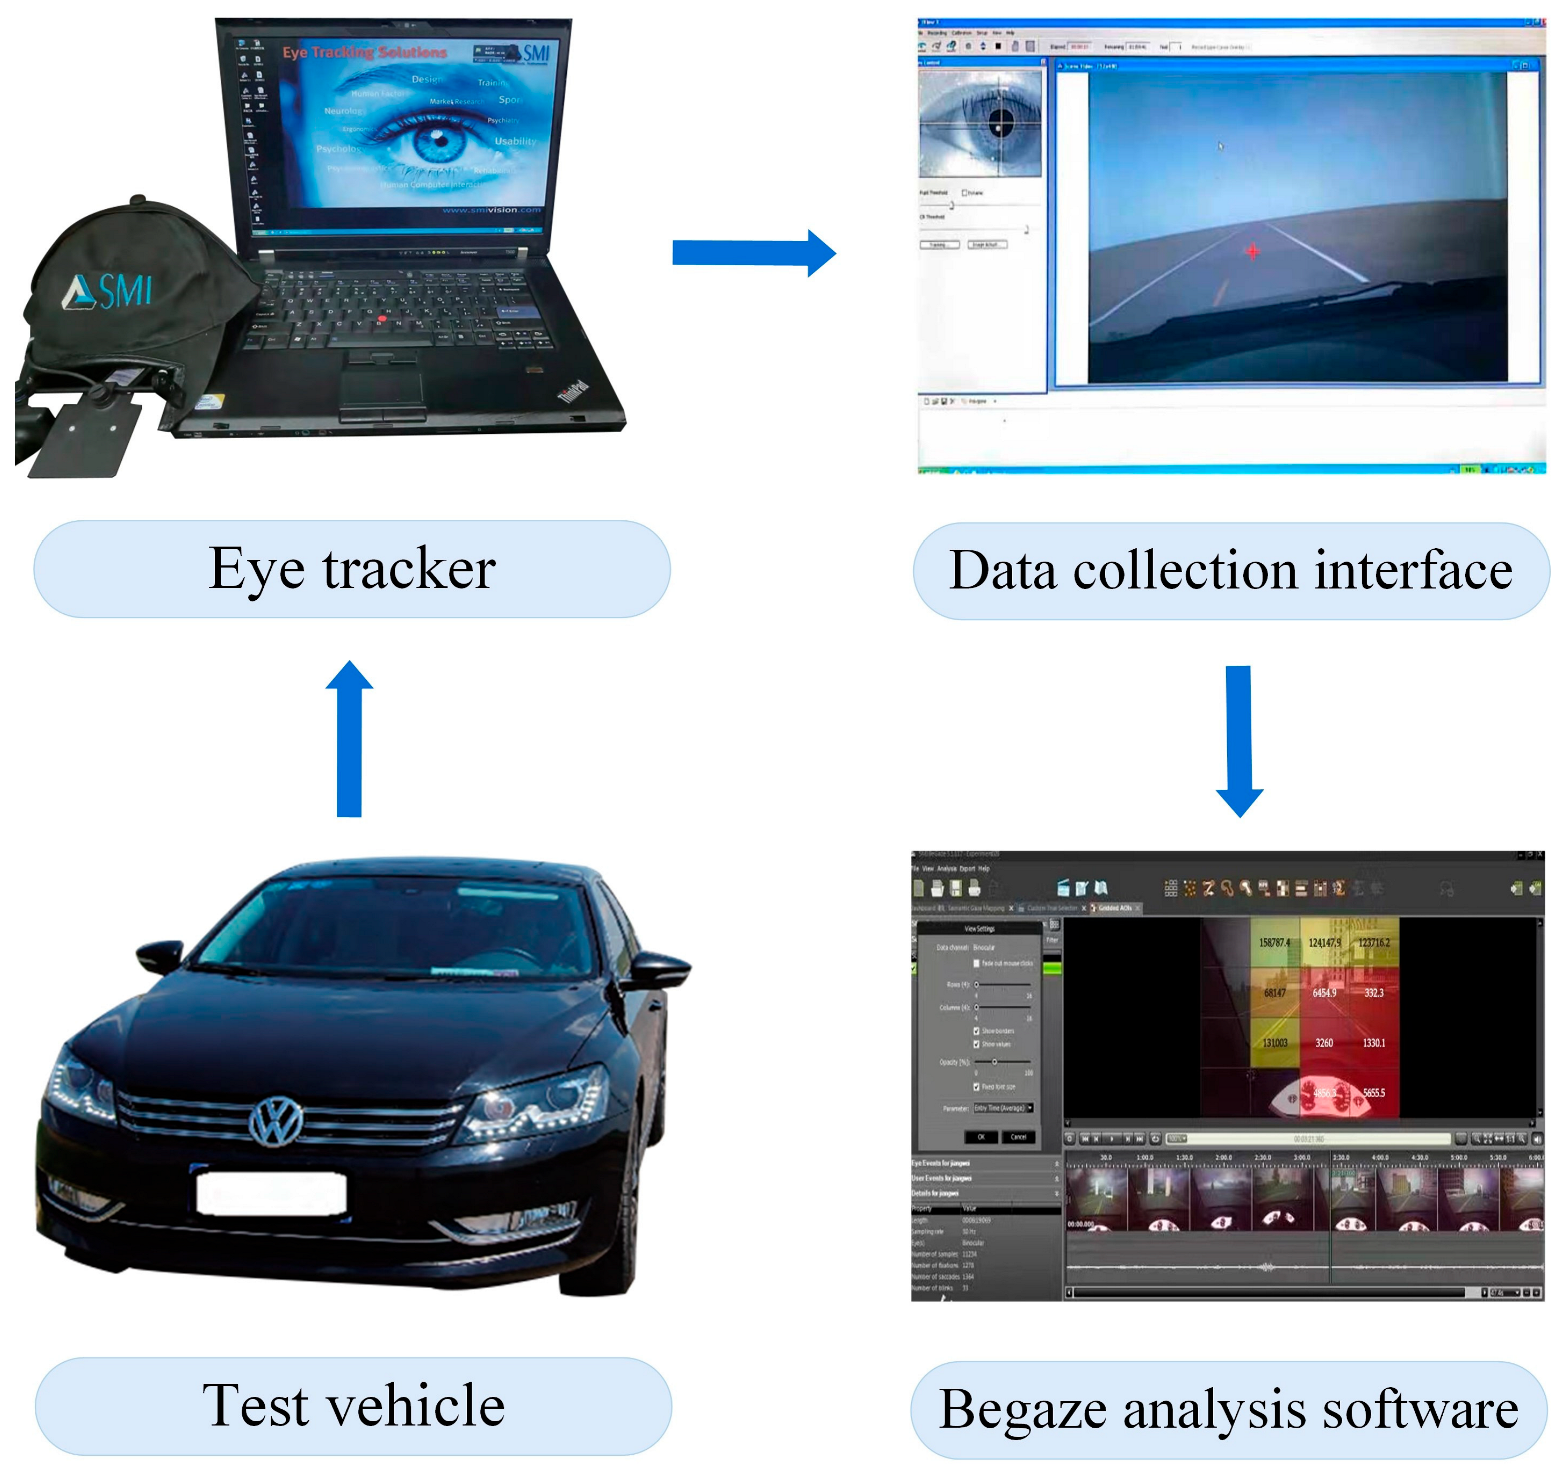
2.1.3. Experimental Equipment
2.1.4. Experimental Procedure
- Test preparation: Staff members explained the test content and process to the subjects and briefly introduced the test conditions, asking them to carefully read and fill out the written informed consent form.
- Adaptability training: The subjects entered the test vehicle, completed the seat adjustment, and cooperated with the researchers to wear the eye tracker correctly. Subsequently, the subjects performed 10 min of actual driving training to drive the test vehicle to the starting point of the test road to adapt to the wearing of the eye tracker and driving environment and performed 5 min of static measurement of eye movement data at the starting point.
- Formal test: The subjects drove the test vehicle to a designated destination along a planned route. They were required to control the vehicle according to their usual driving habits while adhering to traffic rules and speed limits. During the driving process, the observer continuously monitored the platform interface for recording eye movement data. If any interruption or loss in the data collection process was detected, the participant was promptly notified and asked to adjust the test equipment to ensure the quality of test data.
- Data summary: After the test, the subjects’ basic information and eye movement data were promptly collated and summarized.
2.1.5. Data Extraction and Processing
Traffic Environment Division
- The test road was a typical prairie highway with a two-lane design in both directions. Due to the lack of median strip and roadside guardrail facilities, the driving process was vulnerable to the interference of opposing traffic flows and the roadside environment.
- There were no signal controls at the intersections of the test section, and vehicles on the main road had priority. The traffic operations of the main road were disturbed by lateral traffic flows of the branch, which posed a safety hazard.
- Limited to insufficient traffic control, the test road had complex and diverse vehicle types and discrete speed distribution, and the driving process was vulnerable to the influence of other vehicles in the same direction lane.
Data Processing
2.2. Area of Interest Division
2.3. Visual Search Process Based on Markov Chain
2.3.1. Markov Chain
2.3.2. One-Step Transition Probability Matrix of Fixation Points
2.3.3. Stationary Distribution of Fixation Points
2.4. Visual Search Behavior Indicators
2.4.1. Information Entropy of Fixation Distribution
2.4.2. Main Area of Visual Search
2.4.3. Peak-to-Average Ratio of Saccade Velocity
2.5. Improved CRITIC Method
- (1)
- Construct the initial data matrix. Suppose there are evaluation objects and evaluation indicators, form an initial data matrix:where represents the th initial data input value of the th evaluation indicator.
- (2)
- Normalization of data. The initial indicator data are normalized as follows:where is the normalized indicator datum.
- (3)
- Contrast intensity analysis. The variation coefficient is used to characterize the contrast intensity of the evaluation indicators, with the larger variation coefficient reflecting the more significant fluctuations in the indicator data and greater contrast intensity. The variation coefficient is calculated using Equation (11):where is the standard deviation and is the mean value.
- (4)
- Conflict degree analysis. The conflict degree between the evaluation indicators is measured by the correlation coefficient, with a stronger correlation reflecting a higher degree of information overlap between the indicators and a lower conflict degree. To eliminate the influence of negative correlation coefficients, the correlation coefficients are taken as absolute values in the calculation of the conflict degree of indicators. The improved equation for calculating the indicator conflict degree is as follows:where is the Pearson correlation coefficient between the th and th indicators, and and represent the mean values of indicators and , respectively.
- (5)
- Information quantity analysis. The information quantity carried by the indicator is measured by considering the contrast intensity and conflict degree; the information quantity is calculated as shown in Equation (14). A larger means that the th indicator carries more information and the corresponding weight is larger.
- (6)
- Objective weighting of indicators. The objective weight is assigned according to the information quantity contained in the indicator, defining weight of each indicator, as shown in Equation (15):
2.6. VIKOR Method
- (1)
- Decision-making matrix construction. Construct the decision-making matrix composed of evaluation objects and evaluation indicators after normalizing the initial indicator data, as shown in Equation (16).
- (2)
- Determine the positive ideal solution and negative ideal solution for each evaluation indicator based on the decision-making matrix , as shown in Equation (17):where and are the collections of positive and negative indicators, respectively.
- (3)
- Calculate the group utility value and individual regret value of each evaluation object, as shown in the following equation:where denotes the weight coefficient of the evaluation indicator.
- (4)
- Calculate the decision-making value of each evaluation object, as shown in Equation (20):where , , , and . Further, denotes the decision-making mechanism coefficient, which can be adjusted according to the actual situation of the study object; denotes that the decision-making focused on maximizing group utility, which belongs to the risk preference type; denotes that the decision-making focused on minimizing individual regret, which belongs to the risk aversion type. Generally, , which means that the compromise decision-making is made by weighing group utility and individual regret.
- (5)
- Determine evaluation object ranking and obtain the optimal compromise solution. Evaluation objects are ranked in ascending order based on the , , and values, with smaller values indicating better evaluation objects. If the following two criteria are satisfied simultaneously, the evaluation objects are ranked directly according to the value, and the evaluation object with the minimum value is optimal. Assuming that the evaluation objects ranked first and second in ascending order of value are and , respectively.
- Criterion 1 (acceptable advantage): .
- Criterion 2 (acceptable stability): The or values of the evaluation object is ranked ahead of those of .
3. Results
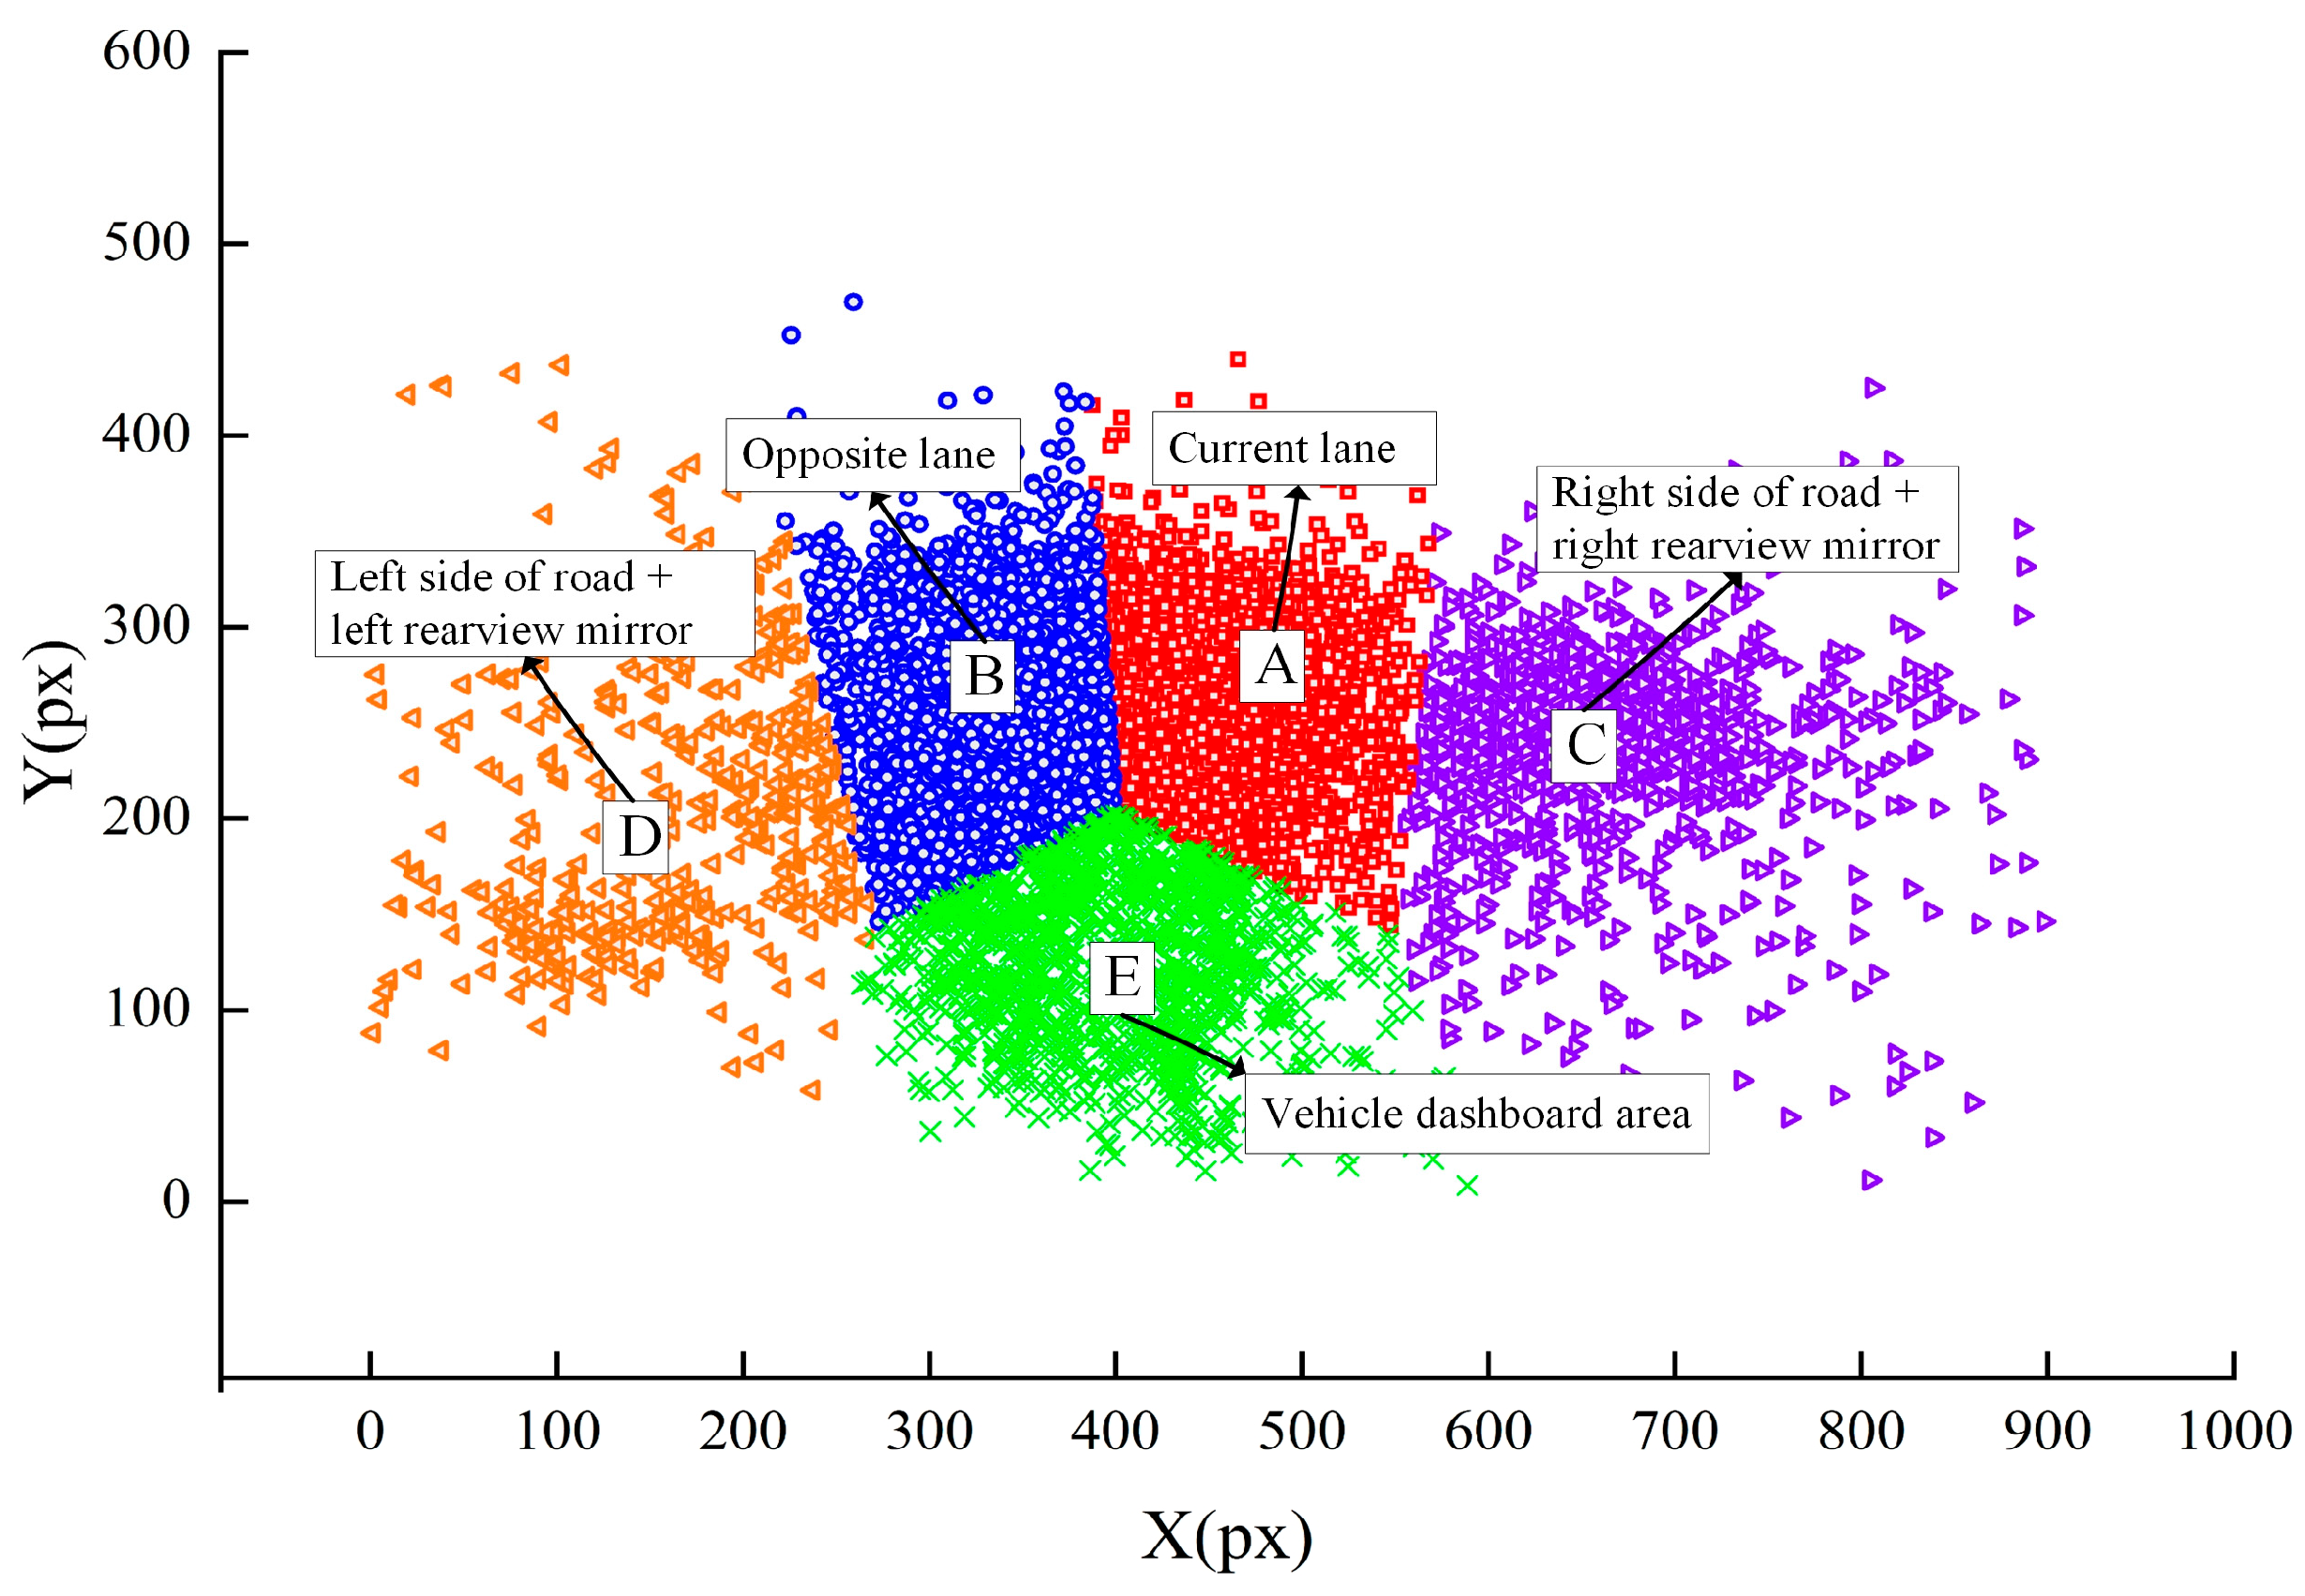
3.1. Cluster Analysis of Fixation Points
3.2. Information Entropy Based on Markov Chain
3.2.1. Analysis of Visual Transfer Modes
- (1)
- During vehicle-following, the drivers’ fixation transition probability and recurring fixation probability in area E increase significantly, indicating that drivers need to continually monitor the driving state of the vehicle in front and adjust their speed to maintain a safe following distance. Consequently, they pay more attention to the vehicle’s dashboard, obtaining speed information through multiple repeated fixations (see Figure 6b).
- (2)
- When encountering an oncoming vehicle, drivers’ fixation transition probability and recurring fixation probability in area B increase significantly. As prairie highways often lack a median strip and traffic control, driving speeds are typically higher than the road design speed. When vehicles approach from the opposite lane, particularly large and medium-sized trucks, drivers divert part of their attention to these oncoming vehicles to maintain a safe lateral distance (see Figure 6c).
- (3)
- When the rear overtaking vehicles borrow the opposite lane to cut in front of the test vehicle, drivers’ fixation transition probability and recurring fixation probability in areas B and D increase significantly. Drivers must continually monitor the overtaking vehicle’s state from the moment it is observed in the opposite lane or left rearview mirror until it crosses the road centerline and cuts in front of the test vehicle. This is because the safety distance and driving speed of both vehicles mutually restrict each other. Therefore, drivers must continually monitor the overtaking vehicle to adjust their driving strategy and behavior, ensuring safe vehicle operation (see Figure 6d).
- (4)
- When random risk points appear on the road’s right side, the transition probability and recurring fixation probability significantly increase in area C (where the risk points appear) and area E. Drivers need to continually monitor the dynamic information of risk points and implement certain braking measures to deal with the unpredictable changes in the risk points’ motion states (see Figure 6e).
- (5)
- When the test vehicle drives straight through an intersection, the distribution of drivers’ fixation points is relatively dispersed, and the fixation transition probability and recurring fixation probability significantly increase in areas C and D. Given that prairie highway intersections prioritize main road traffic, drivers collect traffic information from multiple areas such as the intersection center and the branches on both sides before reaching the intersection. This is done to ensure safe passage through an intersection (see Figure 6f).
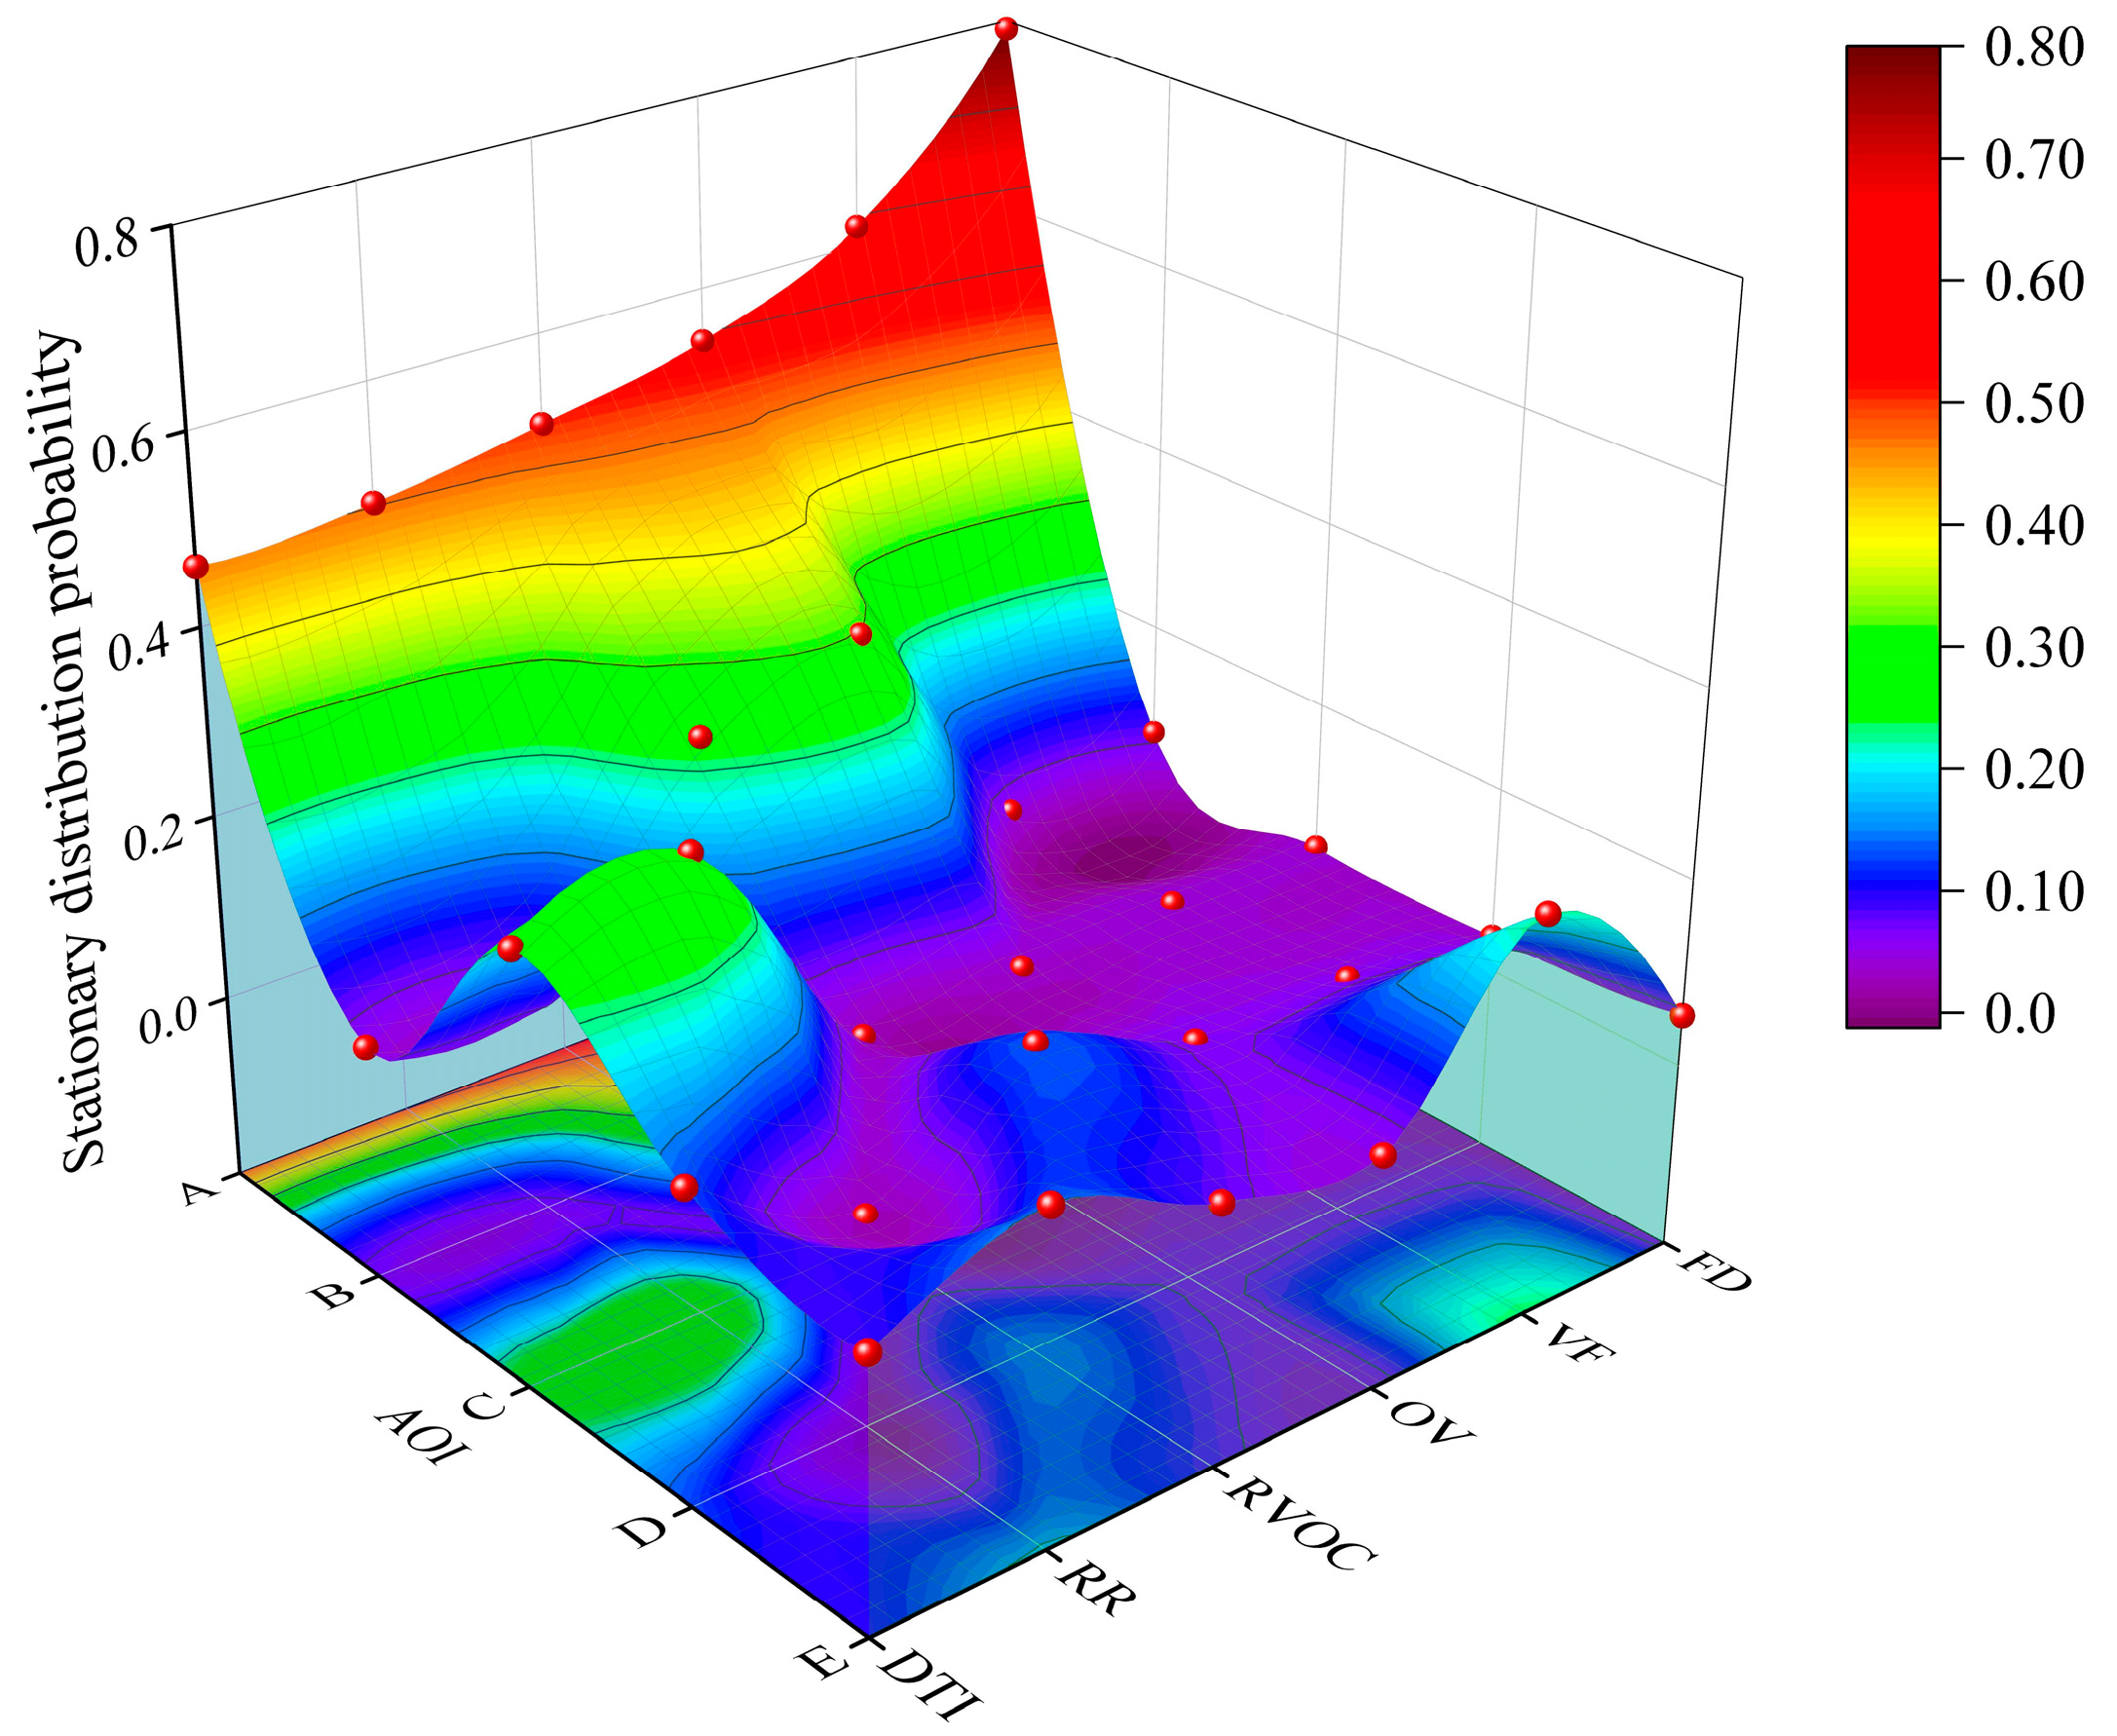
3.2.2. Analysis of Visual Stationary Distribution
3.2.3. Comparative Analysis of Information Entropy of Fixation Distribution (IEFD)
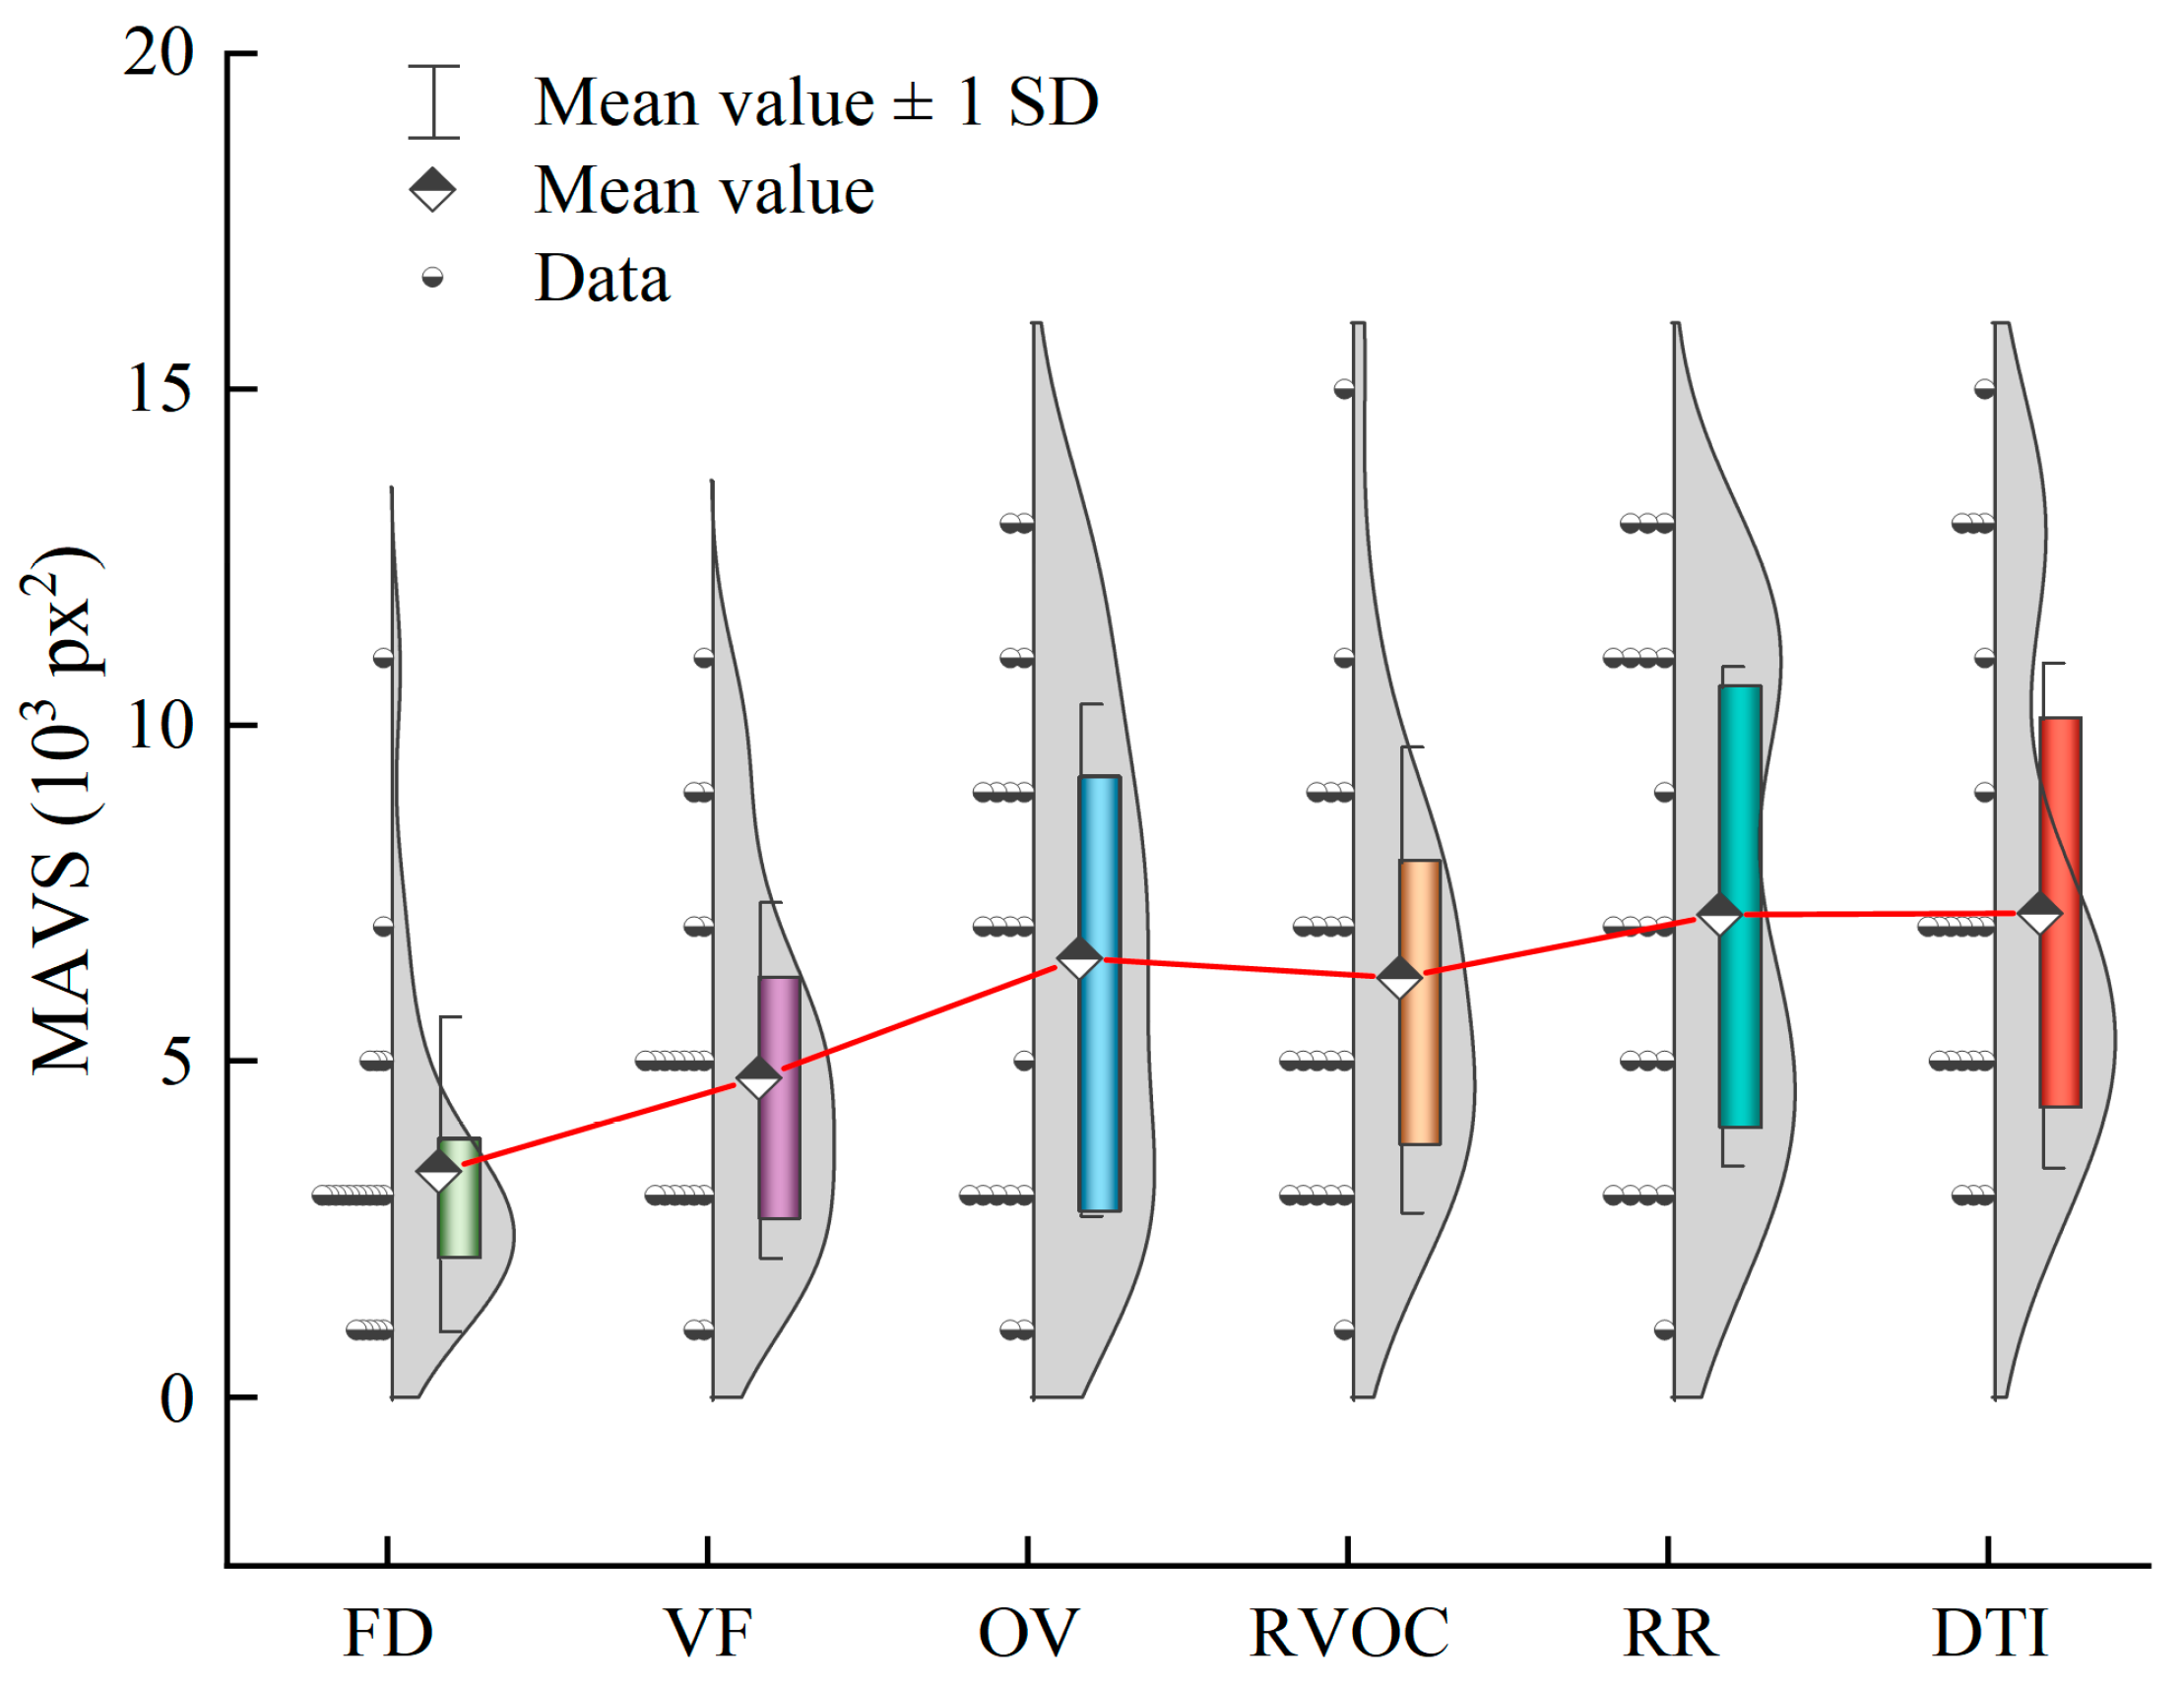
3.3. Comparative Analysis of Main Area of Visual Search (MAVS)
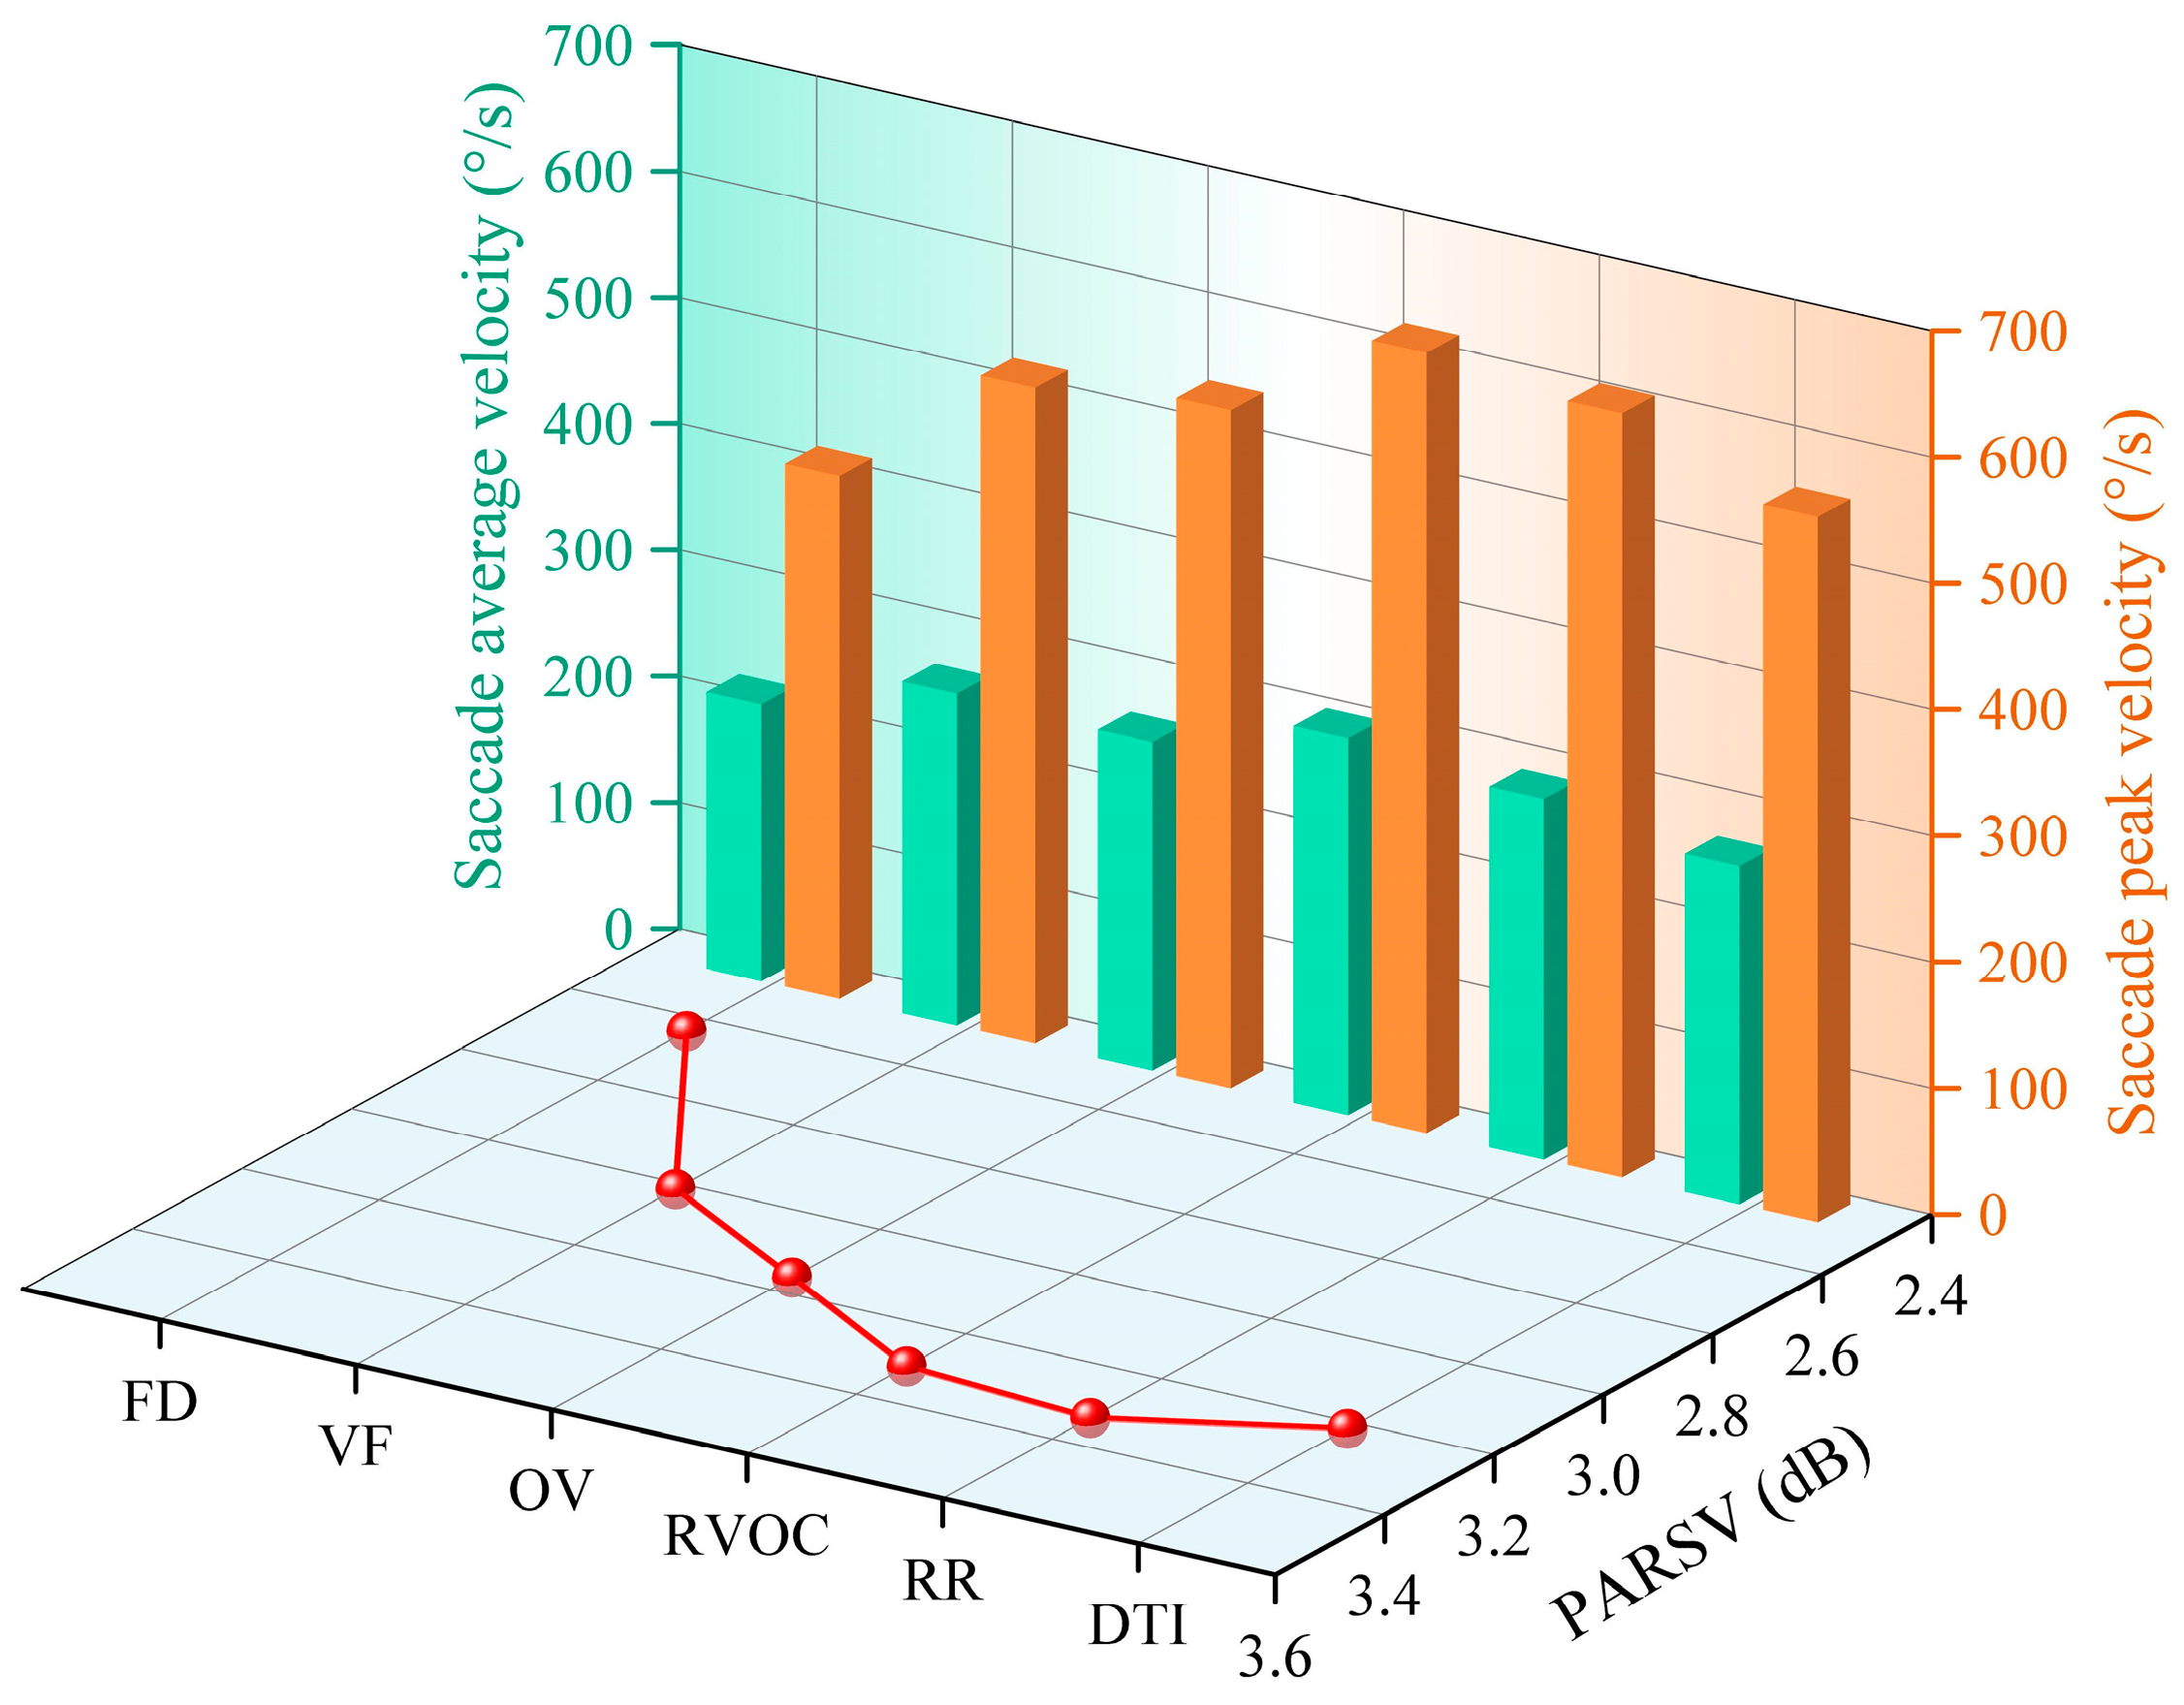
3.4. Comparative Analysis of Peak-to-Average Ratio of Saccade Velocity (PARSV)
3.5. Evaluation of Driving Safety Based on Visual Search Load
4. Discussion
- Since the site of the real vehicle test was located in a vast prairie area far from urban areas, the implementation of the test was limited by safety, cost, and time, so the sample size for completing the test was not sufficient, and the data collection process cannot accurately control the consistency of the test conditions, and the test results may have certain errors. Future research can increase the test scenarios in combination with simulated driving and carry out a total-factor analysis by taking into account individual attribute characteristics such as the driver’s gender and driving experience on the basis of expanding the sample size;
- The collection of drivers’ eye movement data in the test was based on a head-mounted eye tracker. Although the instrument has a high measurement accuracy, long-term wearing may cause fatigue and discomfort to the drivers. Therefore, the next step could be equipped with a remote eye tracker (RED) to improve our study. The RED installed in the vehicle will improve the driving safety during the test and bring the driving behavior closer to the real state;
- In this study, the analysis of driving safety only considered the driver’s visual behavioral characteristics, but the recognition effect of different types of indicators on driving safety may be different. Future research can increase the evaluation indicators of psychology, operation reaction, and other aspects, deeply analyze the applicable scenarios and sensitivity of the indicators, and combine the multi-featured parameters to comprehensively analyze driving safety to improve the scientific validity of the research.
5. Conclusions
- (1)
- The distribution and transfer of drivers’ visual attention differ according to the traffic environments on prairie highways. However, the current lane consistently remains the main search area for drivers to obtain traffic information. During free driving, drivers primarily focus on the current lane area, and their visual attention is highly concentrated. In contrast, as the components elements of the traffic environment increase, drivers tend to shift their attention to multiple AOIs to supplement information acquisition. The selection of AOIs largely depends on the location and motion state of the target that affects driving safety, which reduces attention to the current lane.
- (2)
- IEFD, PARSV, and MAVS analyze drivers’ visual search characteristics in terms of visual search complexity, stability, and visual field range, respectively. Mathematical statistics results show that these visual evaluation indicators demonstrate significant statistical differences with changes in the driving environment. Evidently, increased information about the traffic environment prompts drivers to expand their main visual search area, thereby increasing the complexity of visual information processing and decreasing visual stability.
- (3)
- The concept of visual search load was introduced for a comprehensive evaluation of driving safety. The analysis showed that drivers’ visual search load is the lowest during free driving, resulting in relatively high driving safety. In contrast, the emergence of roadside risks considerably affects drivers’ visual search behavior, leading to increased visual search load and significantly reduced driving safety. Sensitivity analysis verifies that the evaluation results of visual search load are not affected by decision-making tendency and exhibit robust decision-making stability. Hence, the roadside environment is a critical factor affecting driving safety on prairie highways. To improve driving safety on these highways, attention should be focused on assessing roadside safety hazards and targeting the construction of safety facilities and traffic management.
Author Contributions
Funding
Institutional Review Board Statement
Informed Consent Statement
Data Availability Statement
Conflicts of Interest
References
- Kumeda, B.; Zhang, F.; Alwan, G.M.; Owusu, F.; Hussain, S. A hybrid optimization framework for road traffic accident data. Int. J. Crashworthiness 2021, 26, 246–257. [Google Scholar] [CrossRef]
- Cheng, Y.; Gao, L.; Zhao, Y.; Du, F. Drivers’ visual characteristics when merging onto or exiting an urban expressway. PLoS ONE 2016, 11, e0162298. [Google Scholar] [CrossRef] [PubMed]
- Farooq, D.; Moslem, S.; Duleba, S. Evaluation of driver behavior criteria for evolution of sustainable traffic safety. Sustainability 2019, 11, 3142. [Google Scholar] [CrossRef]
- Baldo, N.; Marini, A.; Miani, M. Drivers’ braking behavior affected by cognitive distractions: An experimental investigation with a virtual car simulator. Behav. Sci. 2020, 10, 150. [Google Scholar] [CrossRef] [PubMed]
- Wang, X. Traffic Safety Analyses; Tongji University Press: Shanghai, China, 2022; pp. 1–26. [Google Scholar]
- Kircher, K.; Ahlstrom, C. Minimum required attention: A human-centered approach to driver inattention. Hum. Factors 2017, 59, 471–484. [Google Scholar] [CrossRef]
- Liu, C.; Wang, Z.; Nacpil, E.J.C.; Hou, W.; Zheng, R. Analysis of visual risk perception model for braking control behaviour of human drivers: A literature review. IET Intell. Transp. Syst. 2022, 16, 711–724. [Google Scholar] [CrossRef]
- Zhang, D.; Chen, F.; Zhu, J.; Wang, C.; Cheng, J.; Zhang, Y.; Bo, W.; Zhang, P. Research on drivers’ hazard perception in plateau environment based on visual characteristics. Accid. Anal. Prev. 2022, 166, 106540. [Google Scholar] [CrossRef]
- Konstantopoulos, P.; Crundall, D. The driver prioritisation questionnaire: Exploring drivers’ self-report visual priorities in a range of driving scenarios. Accid. Anal. Prev. 2008, 40, 1925–1936. [Google Scholar] [CrossRef] [PubMed]
- Zhang, W.; Dai, J.; Pei, Y.; Li, P.; Yan, Y.; Chen, X. Drivers’ visual search patterns during overtaking maneuvers on freeway. Int. J. Environ. Res. Public Health 2016, 13, 1159. [Google Scholar] [CrossRef]
- Dukic, T.; Broberg, T. Older drivers’ visual search behaviour at intersections. Transp. Res. Part F Traffic Psychol. Behav. 2012, 15, 462–470. [Google Scholar] [CrossRef]
- Ponnambalam, C.T.; Donmez, B. Searching for street parking: Effects on driver vehicle control, workload, physiology, and glances. Front. Psychol. 2020, 11, 574262. [Google Scholar] [CrossRef]
- Crundall, D.; Shenton, C.; Underwood, G. Eye movements during intentional car following. Perception 2004, 33, 975–986. [Google Scholar] [CrossRef]
- Sun, Q.C.; Xia, J.C.; He, J.B.; Foster, J.; Falkmer, T.; Lee, H. Towards unpacking older drivers’ visual-motor coordination: A gaze-based integrated driving assessment. Accid. Anal. Prev. 2018, 113, 85–96. [Google Scholar] [CrossRef]
- Stahl, P.; Donmez, B.; Jamieson, G.A. Eye glances towards conflict-relevant cues: The roles of anticipatory competence and driver experience. Accid. Anal. Prev. 2019, 132, 105255. [Google Scholar] [CrossRef] [PubMed]
- Lemonnier, S.; Desire, L.; Bremond, R.; Baccino, T. Drivers’ visual attention: A field study at intersections. Transp. Res. Part F Traffic Psychol. Behav. 2020, 69, 206–221. [Google Scholar] [CrossRef]
- Qin, Y.; Yang, N.; Xie, J.; Zhao, S.; Qian, Z. Analysis of drive’s visual differences in typical sections of low-grade highways in mountainous areas. J. Saf. Environ. 2022, 22, 3235–3243. [Google Scholar]
- Li, G.; Wang, Y.; Zhu, F.; Sui, X.; Wang, N.; Qu, X.; Green, P. Drivers’ visual scanning behavior at signalized and unsignalized intersections: A naturalistic driving study in China. J. Saf. Res. 2019, 71, 219–229. [Google Scholar] [CrossRef]
- Wu, F.; Fu, R.; Wang, X.; Liu, J. Influence of cut-in situation on driving behavior of the following car drivers. Lect. Notes Electr. Eng. 2020, 576, 653–660. [Google Scholar]
- Yuan, W.; Fu, R.; Guo, Y.; Wu, F. Analysis on drivers’ dynamic visual characters in different road conditions. In Proceedings of the International Conference on Communication and Vehicular Technology (ICCVT), Hanoi, Vietnam, 30–31 December 2010. [Google Scholar]
- Chung, J.; Lee, H.; Moon, H.; Lee, E. The static and dynamic analyses of drivers’ gaze movement using VR driving simulator. Appl. Sci. 2022, 12, 2362. [Google Scholar] [CrossRef]
- Du, J.; Ren, G.; Liu, W.; Li, H. How is the visual working memory load of driver influenced by information density of traffic signs? Transp. Res. Part F Traffic Psychol. Behav. 2022, 86, 65–83. [Google Scholar] [CrossRef]
- Hu, J.B.; Wang, R.H. Classification of driving workload affected by highway alignment conditions based on classification and regression tree algorithm. Traffic Inj. Prev. 2018, 19, 214–218. [Google Scholar] [CrossRef] [PubMed]
- Ringhand, M.; Siebke, C.; Baumler, M.; Petzoldt, T. Approaching intersections: Gaze behavior of drivers depending on traffic, intersection type, driving maneuver, and secondary task involvement. Transp. Res. Part F Traffic Psychol. Behav. 2022, 91, 116–135. [Google Scholar] [CrossRef]
- Miller, K.A.; Chapman, P.; Sheppard, E. A cross-cultural comparison of where drivers choose to look when viewing driving scenes. Transp. Res. Part F Traffic Psychol. Behav. 2021, 81, 639–649. [Google Scholar] [CrossRef]
- Lyu, Z.; Qi, C.; Zhu, S. Driver’s attention allocation and mental workload at different random hazard points on prairie highway. J. Adv. Transp. 2022, 2022, 3837509. [Google Scholar] [CrossRef]
- Zhang, Y.; Zhu, S. Study on the effect of driving time on fatigue of grassland road based on EEG. J. Healthc. Eng. 2021, 2021, 1–9. [Google Scholar] [CrossRef]
- Li, H.; Xie, S.; Yang, F.; Lu, Y.; Zhu, S. Utilization of drivers’ dynamic visual characteristics to find the appropriate information quantity of traffic engineering facilities on straight roads of grassland highways. Front. Neurosci. 2022, 16, 3837509. [Google Scholar] [CrossRef] [PubMed]
- Peng, Z.; Rong, J.; Wu, Y.; Zhou, C.; Yuan, Y.; Shao, X. Exploring the different patterns for generation process of driving fatigue based on individual driving behavior parameters. Transp. Res. Rec. 2021, 2675, 408–421. [Google Scholar] [CrossRef]
- Liu, Y.; Zhao, X.; Wu, Y. Study on the effectiveness of driving fatigue prevention safety facility on grassland highway based on driving simulation. In Proceedings of the ASCE International Conference on Transportation and Development (ASCE ICTD), Seattle, WA, USA, 26–29 May 2020; pp. 264–274. [Google Scholar]
- Li, X.; Han, L.; Zhu, S.; Gao, M. Information quantity of traffic signs in grassland highways based on visual load. J. Comput. Methods Sci. Eng. 2021, 21, 2077–2091. [Google Scholar] [CrossRef]
- Wang, F.; Li, X.; Guo, H.; Hu, J. Optimization of straight segment index between highway curves of desert grassland based on driver’s visual interest region. J. Jilin Univ. 2020, 50, 114–120. [Google Scholar]
- Wu, Y.B.; Kihara, K.; Takeda, Y.; Sato, T.; Akamatsu, M.; Kitazaki, S.; Nakagawa, K.; Yamada, K.; Oka, H.; Kameyama, S. Eye movements predict driver reaction time to takeover request in automated driving: A real-vehicle study. Transp. Res. Part F Traffic Psychol. Behav. 2021, 81, 355–363. [Google Scholar] [CrossRef]
- Gemonet, E.; Bougard, C.; Masfrand, S.; Honnet, V.; Mestre, D.R. Car drivers coping with hazardous events in real versus simulated situations: Declarative, behavioral and physiological data used to assess drivers’ feeling of presence. PLoS ONE 2021, 16, e0247373. [Google Scholar] [CrossRef]
- Dowiasch, S.; Wolf, P.; Bremmer, F. Quantitative comparison of a mobile and a stationary video-based eye-tracker. Behav. Res. Methods 2020, 52, 667–680. [Google Scholar] [CrossRef]
- Qin, L.; Shi, Y.; He, Y.; Zhang, J.; Zhang, X.; Li, Y.; Deng, T.; Yan, H. ID-YOLO: Real-time salient object detection based on the driver’s fixation region. IEEE Trans. Intell. Transp. Syst. 2022, 23, 15898–15908. [Google Scholar] [CrossRef]
- Greenberg, A.S.; Rosen, M.; Cutrone, E.; Behrmann, M. The effects of visual search efficiency on object-based attention. Atten. Percept. Psychophys. 2015, 77, 1544–1557. [Google Scholar] [CrossRef] [PubMed]
- Li, S.; Ji, B.; Sun, W.; Wang, L.; Yang, Z. Study on the influence of driving experience on visual characteristic. Adv. Mech. Eng. 2013, 2013, 790813. [Google Scholar] [CrossRef]
- Xu, Q.; Guo, T.; Shao, F.; Jiang, X. Division of area of fixation interest for real vehicle driving tests. Math. Probl. Eng. 2017, 2017, 3674374. [Google Scholar] [CrossRef]
- Shang, T.; Qi, H.; Huang, A.; Liu, T. A comparative driving safety study of mountainous expressway individual tunnel and tunnel group based on eye gaze behavior. PLoS ONE 2022, 17, e0263835. [Google Scholar] [CrossRef] [PubMed]
- Peng, J.S.; Wang, C.W.; Fu, R.; Yuan, W. Extraction of parameters for lane change intention based on driver’s gaze transfer characteristics. Saf. Sci. 2020, 126, 104647. [Google Scholar] [CrossRef]
- Blazejczyk, P.; Magdziarz, M. Stochastic modeling of Levy-like human eye movements. Chaos 2021, 31, 104647. [Google Scholar] [CrossRef]
- Shang, T.; Lu, H.; Wu, P.; Lu, X. Method of setting exit advance guide signs in highway tunnels based on the driver’s eye movement with markov chains. IEEE Access 2021, 9, 24079–24092. [Google Scholar] [CrossRef]
- Sammaknejad, N.; Pouretemad, H.; Eslahchi, C.; Salahirad, A.; Alinejad, A. Gender classification based on eye movements: A processing effect during passive face viewing. Adv. Cogn. Psychol. 2017, 13, 232–240. [Google Scholar] [CrossRef]
- Wang, Y.; Wang, L.; Lin, S.; Cong, W.; Xue, J.; Ochieng, W. Effect of working experience on air traffic controller eye movement. Engineering 2021, 7, 488–494. [Google Scholar] [CrossRef]
- Roy, S. Quantifying interactions among car drivers using information theory. Chaos 2020, 30, 104647. [Google Scholar] [CrossRef]
- Miura, A.; Tomoeda, A.; Nishinari, K. Formularization of entropy and anticipation of metastable states using mutual information in one-dimensional traffic flow. Physica A 2020, 560, 125152. [Google Scholar] [CrossRef]
- Wang, S.; Du, Z.; Feng, S.; Jiao, F.; Xu, F. Research on effectiveness of visual guiding system in entrance zone of freeway tunnel. J. Traffic Transp. Eng. 2021, 21, 267–277. [Google Scholar]
- Yang, J.; Liu, C.; Chu, P.; Wen, X.; Zhang, Y. Exploration of the relationships between hazard perception and eye movement for young drivers. J. Adv. Transp. 2021, 2021, 6642999. [Google Scholar] [CrossRef]
- Wang, H.; Ding, X.; Wang, C. Risk assessment of distracted driving behavior based on visual stability coefficient. J. Adv. Transp. 2023, 2023, 2111532. [Google Scholar] [CrossRef]
- Ali, J. A novel score function based CRITIC-MARCOS method with spherical fuzzy information. Comput. Appl. Math. 2021, 40, 280. [Google Scholar] [CrossRef]
- Mishra, A.R.; Bullet, P.R.; Pandey, K. Fermatean fuzzy CRITIC-EDAS approach for the selection of sustainable third-party reverse logistics providers using improved generalized score function. J. Ambient Intell. Humaniz. Comput. 2022, 13, 295–311. [Google Scholar] [CrossRef]
- Torkayesh, A.E.; Ecer, F.; Pamucar, D.; Karamasa, C. Comparative assessment of social sustainability performance: Integrated data-driven weighting system and CoCoSo model. Sustain. Cities Soc. 2021, 71, 102975. [Google Scholar] [CrossRef]
- Liu, X.; Wang, Z.; Zhang, S.; Chen, Y. Investment decision making along the B&R using CRITIC approach in probabilistic hesitant fuzzy environmen. J. Bus. Econ. Manag. 2020, 21, 1683–1706. [Google Scholar]
- Xu, F.; Liu, J.; Lin, S.; Yuan, J. A VIKOR-based approach for assessing the service performance of electric vehicle sharing programs: A case study in Beijing. J. Clean Prod. 2017, 148, 254–267. [Google Scholar] [CrossRef]
- Katanalp, B.Y.; Eren, E.; Alver, Y. An integrated solution to identify pedestrian-vehicle accident prone locations: GIS-based multicriteria decision approach. J. Transp. Saf. Secur. 2023, 15, 137–176. [Google Scholar] [CrossRef]
- Alemdar, K.D.; Kaya, O.; Codur, M.Y. A GIS and microsimulation-based MCDA approach for evaluation of pedestrian crossings. Accid. Anal. Prev. 2020, 148, 102975. [Google Scholar] [CrossRef]
- Drissi, M.; Oumsis, M.; Aboutajdine, D. A multi-criteria decision framework for network selection over LTE and WLAN. Eng. Appl. Artif. Intell. 2017, 66, 113–127. [Google Scholar] [CrossRef]
- Munoz, M.; Reimer, B.; Lee, J.; Mehler, B.; Fridman, L. Distinguishing patterns in drivers’ visual attention allocation using Hidden Markov Models. Transp. Res. Part F Traffic Psychol. Behav. 2016, 43, 90–103. [Google Scholar] [CrossRef]
- Li, X.; Meng, F.; Zheng, X.; Ren, Y.; Yan, J. Driver’s visual characterization based on stress response. J. Jilin Univ. 2017, 47, 1403–1410. [Google Scholar]


| Road and Traffic Parameters | Value or Characteristic |
|---|---|
| Road length (km) | 150 |
| Road speed limit (km/h) | 80 |
| Number of two-way lanes (lines) and width (m) | 2/3.5 |
| Hard shoulder width (m) | 1 |
| Ratio of straight-line segment (%) | 80 |
| Pavement type | Asphalt pavement |
| Intersection control method | Main road priority control |
| Technical Parameters | Parameter Value |
|---|---|
| Model | Iview X HED |
| Sampling frequency (Hz) | 200 |
| Tracking resolution (°) | 0.1 |
| Fixation positioning accuracy (°) | 0.5–1 |
| Tracking angle (°) | Horizontal angle: +/−30 Vertical angle: +/−25 |
| Traffic Environment | Definition | Data Window |
|---|---|---|
| Free driving (FD) | During driving, the field of view is free of other traffic participants, roadside risks, intersections, and related safety facilities. | Combined with the test process and data fluctuations, the data window for vehicle-following and free driving is 20 s. |
| Vehicle-following (VF) | Since the test vehicle cannot overtake the vehicles traveling in the same lane, maintaining a safe following distance is necessary. | |
| Oncoming vehicles (OV) | Vehicles are approaching from the opposite lane. | Starts when the subject’s fixation point falls on the vehicle in the opposite lane for the first time until the meeting is completed. |
| Rear vehicles overtaking cut-in (RVOC) | The rear vehicles in the same lane overtake and cut in front of the test vehicle. | Starts when the subject first detects the rear lane-changing vehicles from the left rearview mirror or the opposite lane until they cross the road centerline and cut in front of the test vehicle. |
| Roadside risks (RR) | Random roadside risks of prairie highways include animals, parked vehicles, pedestrians, etc. | Starts when the subject’s fixation point falls on the random risk points on the right side of the driving lane for the first time until the test vehicle passes. |
| Driving through intersections (DTI) | The test vehicle proceeds straight through intersections. | We noted that subjects typically began seeking traffic information when they were approximately 8 seconds’ driving distance from the intersection. Consequently, we focused our study on the 8 s period before the test vehicle crossed the intersection. |
| Category | Clustering Area | Clustering Center | Percentage of Fixation Points (%) |
|---|---|---|---|
| A | Current lane | (453.58, 257.46) | 47.85 |
| B | Opposite lane | (339.21, 249.17) | 22.03 |
| C | Right side of road and right rearview mirror | (666.58, 236.34) | 14.09 |
| D | Left side of road and left rearview mirror area | (161.34, 208.17) | 4.52 |
| E | Vehicle dashboard area | (397.83, 126.34) | 11.50 |
| Indicator | Comparison of Traffic Environment | Value | ||
|---|---|---|---|---|
| IEFD | FD | VF | 3.272 | 0.022 |
| OV | 5.623 | 2.814 × 10⁻⁶ | ||
| RVOC | 3.168 | 0.031 | ||
| RR | 5.993 | 5.527 × 10⁻⁷ | ||
| DTI | 5.849 | 1.047 × 10⁻⁶ | ||
| Indicator | Comparison of Traffic Environment | Value | ||
|---|---|---|---|---|
| MAVS | FD | VF | 1.654 | 1.000 |
| OV | 3.774 | 0.004 | ||
| RVOC | 3.426 | 0.014 | ||
| RR | 4.549 | 2.385 × 10⁻⁴ | ||
| DTI | 4.571 | 2.192 × 10⁻⁴ | ||
| Indicator | Comparison of Traffic Environment | Value | ||
|---|---|---|---|---|
| PARSV | FD | VF | 2.997 | 0.052 |
| OV | 4.144 | 0.001 | ||
| RVOC | 5.319 | 1.039 × 10⁻⁵ | ||
| RR | 5.495 | 4.908 × 10⁻⁶ | ||
| DTI | 4.601 | 1.946 × 10⁻⁴ | ||
| Visual Search Indicator | Contrast Intensity | Conflict Degree | Information Quantity | Weight Coefficient |
|---|---|---|---|---|
| IEFD | 0.482 | 1.474 | 0.710 | 0.374 |
| MAVS | 0.359 | 1.417 | 0.509 | 0.268 |
| PARSV | 0.415 | 1.639 | 0.680 | 0.358 |
| Traffic Environment | Ranking | |||
|---|---|---|---|---|
| FD | 0.000 | 0.000 | 0.000 | 1 |
| VF | 0.496 | 0.204 | 0.522 | 2 |
| OV | 0.842 | 0.351 | 0.891 | 4 |
| RVOC | 0.745 | 0.347 | 0.836 | 3 |
| RR | 0.999 | 0.374 | 1.000 | 6 |
| DTI | 0.933 | 0.365 | 0.955 | 5 |
Disclaimer/Publisher’s Note: The statements, opinions and data contained in all publications are solely those of the individual author(s) and contributor(s) and not of MDPI and/or the editor(s). MDPI and/or the editor(s) disclaim responsibility for any injury to people or property resulting from any ideas, methods, instructions or products referred to in the content. |
© 2023 by the authors. Licensee MDPI, Basel, Switzerland. This article is an open access article distributed under the terms and conditions of the Creative Commons Attribution (CC BY) license (https://creativecommons.org/licenses/by/4.0/).
Share and Cite
Ding, X.; Wang, H.; Wang, C.; Guo, M. Analyzing Driving Safety on Prairie Highways: A Study of Drivers’ Visual Search Behavior in Varying Traffic Environments. Sustainability 2023, 15, 12146. https://doi.org/10.3390/su151612146
Ding X, Wang H, Wang C, Guo M. Analyzing Driving Safety on Prairie Highways: A Study of Drivers’ Visual Search Behavior in Varying Traffic Environments. Sustainability. 2023; 15(16):12146. https://doi.org/10.3390/su151612146
Chicago/Turabian StyleDing, Xu, Haixiao Wang, Chutong Wang, and Min Guo. 2023. "Analyzing Driving Safety on Prairie Highways: A Study of Drivers’ Visual Search Behavior in Varying Traffic Environments" Sustainability 15, no. 16: 12146. https://doi.org/10.3390/su151612146
APA StyleDing, X., Wang, H., Wang, C., & Guo, M. (2023). Analyzing Driving Safety on Prairie Highways: A Study of Drivers’ Visual Search Behavior in Varying Traffic Environments. Sustainability, 15(16), 12146. https://doi.org/10.3390/su151612146