Article

Technological Cohesion and Convergence: A Main Path Analysis of the Bioeconomy, 1900–2020

Economic Geography Group, Institute of Geography, Heidelberg University, 69120 Heidelberg, Germany
*
Author to whom correspondence should be addressed.
Sustainability 2023, 15(16), 12100; https://doi.org/10.3390/su151612100
Submission received: 4 July 2023 / Revised: 2 August 2023 / Accepted: 3 August 2023 / Published: 8 August 2023
(This article belongs to the Section Bioeconomy of Sustainability)

Abstract

:
The bioeconomy comprises a range of industries that are related through their reliance on biomass and their use of biotechnology, such as agriculture, food processing, and parts of the life sciences. While the bioeconomy has received increasing attention in the context of innovation policy, the internal structure of its underlying technological field remains opaque, and little is known about the long-term processes through which its subdomains have co-evolved. It is precisely the structure (cohesion) of this field and its evolution (convergence) over the course of more than a century of technological development that this article seeks to disentangle. For this purpose, we draw on a dataset of more than 1.5 million patent families and use bibliometric methods and main path analysis to assess the internal and external cohesion of the field and trace its long-term technological development. Our analysis supports two main findings: First, instead of becoming more closed as a field, the cohesion of technologies within the bioeconomy with external technologies has increased over time. Second, the bioeconomy technological field shows clear signs of structural convergence over the second half of the 20th century, with the biochemical domain absorbing most of the trajectories of technological knowledge originating in the traditional application areas. As such, the study illustrates the long-term processes of technological cross-fertilization through which the bioeconomy, as an example of a heterogeneous technological field, developed its ‘backbone’ of technological knowledge.

1. Introduction

Both national governments as well as international organizations increasingly rely on economic strategies and policies targeted not at individual technologies, but instead at large-scale technological fields spanning multiple sectors and industries (see e.g., the EU’s target investment areas [1], currently comprising ‘deep and digital technologies’, ‘clean technologies’, and ‘bio technologies’). Such strategies offer at least three advantages compared with more specific alternatives: First, they avoid having to predict the next big breakthrough and thus hedge against betting on the ‘wrong’ technology. Second, they have lower requirements regarding the technical evaluation of specific alternatives in the context of funding decisions. Third, they can exploit synergies and second-order effects in technological fields, which are understood to be internally coupled in some capacity, and thus lead to positive externalities.
However, technological fields are often only vaguely defined, and both their external boundaries, as well as their internal structures, are often contentious, which hampers precise policy support and risks inefficient allocation of resources. Furthermore, technological fields evolve along unstable trajectories as their member technologies evolve through recombination [2,3,4,5]. The bioeconomy technological field is a prime example of these issues: Demarcations of the bioeconomy often comprise both traditional industries, such as agriculture or forestry, as well as more recent, high-tech sectors, such as the life sciences or biosynthetic materials [6,7]. Similar breadth is also inherent to the technological and scientific knowledge bases underlying these sectors, which span the biological, chemical, and engineering sciences, and which have evolved as field-integrating technologies from different points of origin [8]. Despite or maybe because of this heterogeneity, the bioeconomy has become a nexus for different visions of a more sustainable future, often combining novel resources, novel technologies, and novel business models [9].
In this paper, we are interested in the historical emergence of the technological field underlying the modern bioeconomy. More specifically, we use patent data and bibliometric methods to study the structural evolution of the bioeconomy technological field and the underlying emergent patterns of technological cohesion across its subdomains over a period of more than 100 years. In doing so, we especially focus on (a) the degree of cohesion in the field, (b) the positions that different subdomains take in the overall structure of the field, and (c) the historical trajectory along which the current manifestation of the field has developed. The paper is structured as follows: Section 2 discusses the literature on technological trajectories and fields and the processes through which they evolve. It also introduces the bioeconomy technological field. Section 3 presents the patent database used for empirical analysis and the bibliometric methods used to investigate structural evolution. Section 4 presents the results of the analysis and Section 5 discusses the findings and conclusions of the paper.

2. Evolution of Heterogeneous Technological Fields

2.1. From Technological Trajectories to Technological Fields

In the dominant stream of research, technological evolution has been theorized as following technological trajectories that are embedded into overarching technological paradigms [2,10]: technologies receive incremental improvements in the context of a given paradigm, as exemplified by the increasing miniaturization of computer chips [11], while the fundamental approach towards the problem at hand remains the same. This process of incremental improvement produces relatively stable technological trajectories, which Dosi [10], p. 152, defines as “the pattern of ‘normal’ problem-solving activity (i.e., of ‘progress’) on the ground of a technological paradigm”. Trajectories can, in turn, be disrupted through paradigm shifts, i.e., changes to the fundamental solution approach [12]. While this conceptualization is a powerful representation of technological development, it invites (but by no means necessitates) investigations of individual technological trajectories and paradigms [12,13,14,15]. We take the broader perspective of the technological field as our starting point, which we define as the set of all technologies that are connected by either (a) common outputs, (b) common inputs, or (c) common processes. This purposefully broad conceptualization accommodates a variety of definitions of technological fields found in both scientific studies as well as policy roadmaps: It allows for technological fields that are characterized by a common overall purpose of its member technologies (i.e., by a common output). An example is the field of life sciences [16], in which all member technologies have the overall goal of improving human health. It also allows for fields where technologies do not share a common purpose but instead make use of a common resource (or class of resources), or a common set of techniques. This is also the case for the bioeconomy technological field, which cannot easily be characterized by its output as it produces a variety of them, ranging from foods over pharmaceuticals to biobased materials, but which is instead usually defined through its use of biomass inputs [17] or its use and development of biological and biotechnological techniques [18,19]. Given the fact that this definition can encompass a heterogeneous set of technologies, the ways in which individual technological trajectories and paradigms interact to shape the overall trajectory of the field become of central interest.

2.2. Processes of Technological Field Evolution

Processes of technological evolution that involve the flow of knowledge across industries and scientific domains have become increasingly prevalent, with many studies highlighting how the recombination of existing technologies at different degrees of similarity can provide a competitive advantage for firms [3,20] and shape technological trajectories and transitions [21]. Even 30 years ago, Kodama [22] sketched out the disruptive potential of technological convergence that was taking place in Japan’s optical, electronic, and communication technology industries—hitherto largely separate sectors—which gave rise to fiber-optical communication technologies and liquid crystal displays. Since then, the study of technological convergence has proliferated: Research in the area has distinguished convergence at different levels, from basic science to whole industries [23,24], has investigated the breadth of convergence processes across industries [25], and studied its relationship to standardization processes [26,27] and firm-level absorptive capacity [28]. Research has also established empirical measurement procedures to trace convergence, often based on patent data [29,30]. Based on such conceptual and methodological approaches, case studies have focused on convergence in a broad range of industries such as electronics [31] and ICT [27,32,33], (nano)biotechnology [30,34], electric vehicles [35], robotics [36], and printed electronics [37].
This paper investigates technological convergence across the subdomains of the bioeconomy technological field. It explicitly foregoes both the study of convergence at the market or industry level [24] and an analysis of the larger societal processes that are at play when considering the bioeconomy as the playground for a socio-technical transition [38], as these likely follow different processes and mechanisms. Instead, the paper takes a long-term perspective to identify processes of convergence in the main trajectories of technological knowledge within and across the subdomains of the field and to assess its cohesion with technologies outside the field.

2.3. The Bioeconomy Technological Field and Its Subdomains

While there is no agreed-upon list of industrial sectors or technological domains that constitute the bioeconomy, most definitions include reliance on biomass as an industrial input and the use of biological, biochemical, or biotechnological processes as defining features [6,7,19]. Additionally, the bioeconomy is often associated with notions of circularity [39,40,41] and a more sustainable economy [42]. In the following, without any claim on completeness, we give a brief overview of some of the most frequently encountered bioeconomy subdomains. Closest to the biomass source are agriculture and forestry-related industries: For the former, a major promise of modern biotechnology is in the engineering of crops to improve yield [43,44] and create more resistant crops [45], but also, e.g., in the use of biorefineries to produce improved fertilizers [46,47]. Wood-processing industries, on the other hand, are expected to play an important role as providers of cellulose, which is increasingly relevant not only in the paper industry but also for other fiber-based applications such as the textile industry [48,49], and as feedstock for fuels and chemicals [50], e.g., for the production of bioplastics [51,52]. While probably the original application field of biotechnological processes, the food industry is also one of the core domains of a modern bioeconomy, touching on topics from fermentation, yeasts, and dairy cultures, to improvements of food quality or modifications of taste or nutritional value [53,54]. However, the food industry is linked with other bioeconomy domains not only through its reliance on biotechnology but also through questions of competing land and water use [55,56,57]. This is especially the case for the energy sector, for which the production of biofuels from agricultural feedstocks is seen as enabling a transition towards a biobased alternative to fossil fuels [58,59]. Finally, as the source of modern biotechnology [8], the life sciences constitute one of the core domains of the bioeconomy and represent the origin of many of today’s bioeconomy policy efforts. While early medical applications focused especially on the production of antibiotics, the ‘new biotechnology’ of the 1970s saw major breakthroughs in recombinant DNA technology, leading, among others, to the approval and production of insulin [8]. These breakthroughs facilitated further downstream progress, e.g., in enzyme technologies, which in turn percolated into other application fields, such as detergents [60,61], and triggered large-scale shifts in industry structure and the dominant innovation model [4]. Today, biotechnology is in widespread use across a range of medical domains such as pharmaceutical discovery [62] and pharmacogenomics [63], and emergent approaches such as gene therapy [64].
Based on the practical and theoretical considerations outlined above, the goal of the paper is to assess structural patterns of cohesion and convergence in the bioeconomy technological field. In pursuit of this goal, it addresses the following research questions: First, does the bioeconomy constitute a cohesive technological field and what structural positions do its subdomains occupy? Second, to what degree is the bioeconomy connected with outside technologies and does the field close over time? Third, are there patterns of convergence within and across the bioeconomy subdomains and how do these unfold over time? In the next section, we present an empirical delineation of the bioeconomy and its subdomains based on patent data and discuss methods for assessing structural cohesion and its evolution across the bioeconomy technological field.

3. Data and Methods

3.1. Mapping the Bioeconomy with Patent Data

We draw on patent data for empirical analysis, following common practices in research on technological trajectories and technological convergence [15,29,30,37]. Patent data are a uniquely suited database for this purpose due to their combination of breadth and depth: In terms of breadth, patents are available in standardized form for most industries (although industries differ with respect to patenting intensity), are available on a global scale (although heavily biased towards the core markets of the US, the EU, Japan, and more recently China), and go back more than a century. As such they allow for global and historical tracing of innovation activity across industries. In terms of depth, high-resolution hierarchical classification schemes (such as the Cooperative Patent Classification, CPC) allow for detailed delineations of technological domains, while citations of related state of the art (i.e., related previous patents) can be used as a measure of the flow of technological knowledge over time and across domains. To delineate the bioeconomy technological field and its subdomains, we depart from the list of CPC technology classes contained in the narrow definition of the bioeconomy presented in Wackerbauer et al. [65] and reproduced in Table 1.
Using this list, we obtain a total of 4,096,554 patent applications containing at least one of the listed CPC labels from the PATSTAT database (autumn 2022 edition). These applications reduce to 1,525,980 patent families after accounting for multiple applications referring to the same technology, e.g., in the context of applications in multiple jurisdictions. In terms of splitting the bioeconomy technological field into subdomains, we deviate slightly from the four groups presented in Wackerbauer et al. [65]: First, we separate agriculture and fertilizers from foods (and, much less frequently, tobacco), as the latter constitutes a large domain in itself and is conceptually distinct from the former in terms of the contained technologies. Second, we split the very broad chemistry category into a more focused biochemistry/biotechnology category and a more application-specific category containing especially technologies related to the production of detergents and natural dyes, resins, and fats. Notably, the energy sector is missing from the reference list. This could be a consequence of biofuels receiving decreasing policy attention due to a shift towards electromobility and public attention towards issues of food security that arise with the use of crops for energy purposes [56]. Table 2 contains an overview of the CPC class labels used to distinguish the resulting six domains as well as their sizes in terms of technologies and associated patent families.

3.2. Co-Classification and Patent Citations

Based on the selection of patents and the distinction of bioeconomy domains presented in the last section, the paper first relies on co-classification as a static measure of cohesion at the technology level, represented by 8-digit CPC maingroups. Two technologies (i.e., CPC maingroups) are connected through co-classification to the degree that they appear on the same patents. To give an example, patent EP3853359A1, applied for by the biotech firm Novozymes and claiming an animal feed product containing polypeptides with lysozyme activity, carries a total of 14 subgroups contained in maingroups C12N9 and C12Y (both classifying enzymes), A23K10 (animal feedstuffs), A23K20 (accessory factors for animal feedstuffs), and A23K50 (feedstuffs specially adapted for particular animals). In the co-classification matrix of all technologies at the maingroup level, the cells corresponding to the pairs of these five technologies would each be incremented by one through this patent. All five of these technologies are furthermore considered bioeconomy technologies because they are descendants of one of the CPC labels listed in Table 1. Overall, 8079 CPC maingroups appear as classifiers on the patents in the dataset, of which only 535 directly belong to the bioeconomy.
A second, more dynamic representation of cohesion can be obtained from patent citations. Patent citations arise during the process of examination and contain references to previous patents (and other representations of the ‘state of the art’, such as scientific publications) that are in some way related to the technology to be protected by the examined patent. As such, they are often taken to indicate knowledge flow [15,66]. These citations can then be combined into citation networks that have an inherent temporal structure, where ‘backward citations’ imply that a patent builds on earlier technologies and ‘forward citations’ (i.e., citations received from subsequent patents) indicate influence on future technologies. We aggregate citations at the family level and eliminate all citations into the future, which can arise due to applications belonging to two families overlapping in time. Furthermore, the direction of citation edges is reversed to represent the forward flow of knowledge. The resulting network is then a directed acyclical graph, which is a necessary requirement for methods such as main path analysis. In total, this procedure results in a citation network of 1,525,980 nodes and 5,952,648 edges; however, 446,106 nodes are isolates, i.e., they do not cite and are not cited by any other patents in the dataset.

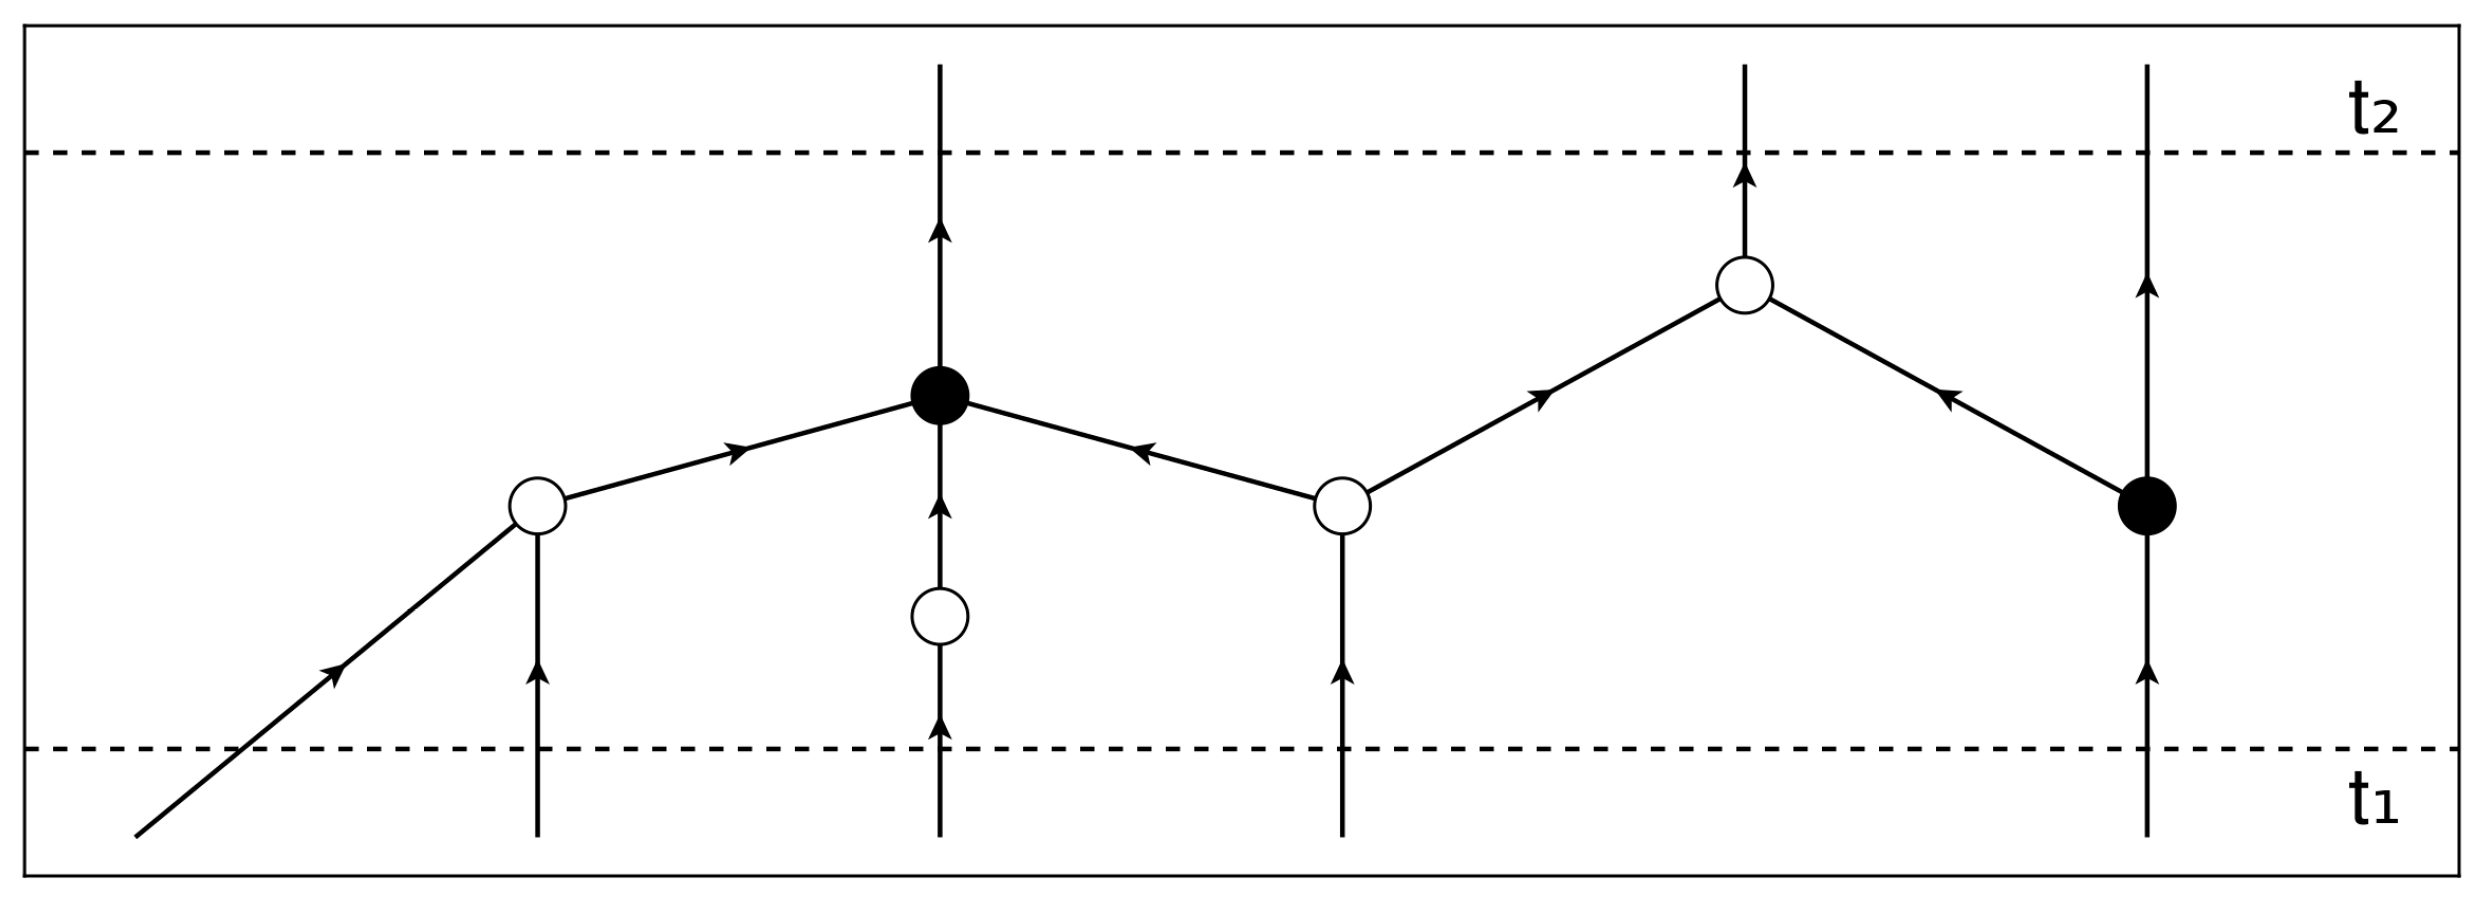
3.3. Measuring Convergence Based on Main Path Networks

To measure convergence, we employ main path analysis [67,68], a bibliometric method, to extract the most relevant chains of citations, i.e., main paths, from a citation network. Main path analysis typically involves two steps: First, the computation of some flow measure that captures the importance of individual nodes or edges in the overall network. We use Search Path Count (SPC) edge weights [69], which count the total number of shortest paths from all source nodes to all sink nodes in the citation network that contain a given edge. The SPC method relies on topological sorting of the vertices, which is possible due to a citation network’s nature as a directed acyclical graph (DAG). This in turn enables an efficient algorithm that is linear in the number of edges and allows for the analysis of very large networks [69]. Second, after weights have been computed, a set of start nodes is selected; this selection can follow different heuristics and could, e.g., include all source nodes, nodes in a specified period or domain, or nodes with high flow weights. Departing from all start nodes, the citation graph is traversed forward, backwards, or both, following the highest-weight outgoing (or incoming) edge(s), based on the weights computed in step one. As such, the variant of main path analysis used here implements a greedy priority-first search algorithm [67]. Depending on the selection of start nodes and the structure of the original citation network, the resulting main path networks can be simple or complex, both in terms of size as well as structure. We create main path networks for each domain by taking the top 5% vertices as measured by their SPC vertex weight as start positions and then perform forward and backward traversal to capture both trajectories leading to these high-impact technologies as well as the subsequent developments building on them. Due to the large sizes of the original domains, this still leads to relatively large (in the order of 10,000s of nodes) and structurally complex main path networks. Compared with, e.g., forward traversal initialized at early source nodes, an ‘endogenous’ selection of start nodes based on flow weights combined with bi-directional traversal has a series of advantages: First, it allows for more focus to be put on periods that spawned highly relevant innovations (as indicated by high SPC vertex weights). Second, it enables more structural variation, as backward traversal can produce branches in the final main path network that are unlikely to occur purely based on forward traversal. Third, it allows for backward paths to deviate from the source domain of its starting points and thus reveal the existence of origins in a different domain.
Based on such a representation of major technological pathways, we conceptualize convergence as a function of time: For a given period, structural convergence can be measured as the absolute or relative reduction in parallel paths that occurred during that period (Figure 1). In the example in Figure 1, a total of five paths enter the period at t1, while only three paths remain at t2 due to a series of merges (but also branches) that take place during the period, amounting to a total reduction of two or a convergence rate of 60%. The same approach could also indicate divergence, represented by an increase in parallel paths. To additionally account for whether convergence takes place within the same technology or domain, or whether a shift to a different domain is occurring, we record the domains of the patents from which the outgoing paths in a given period originate. In the above example, then, two out of three outgoing paths originating from a new domain (represented by filled nodes) would indicate a majority domain shift and thus indicate inter-domain convergence. In the following, we split the full observation period, starting in 1900 and ending in 2020, into 24 five-year periods and record the above network statistics for visualization and analysis. All data analysis has been performed using the Julia programming language and its package ecosystem.

4. Results

4.1. Internal and External Cohesion of the Bioeconomy Technological Field

The bioeconomy is a heterogeneous technological field: it comprises both traditional sectors, such as agriculture, foods, or textiles, as well as more recent advances, e.g., in biotechnology or modern medicine. Inspecting yearly patent counts since the start of the 20th century, different levels of innovation activity and especially different growth trajectories become visible across these domains (Figure 2): Detergents and dyes, textiles, paper, and wood processing technologies, and food-related technologies exhibit already comparatively high patent counts at the outset and show consistent but comparatively slower growth throughout the observation period. In contrast, the life sciences bioeconomy domain produced negligible patent counts until the 1950s; however, this was followed by explosive growth throughout the second half of the century. While already at a non-negligible patenting rate at the start of the 1900s, the biochemistry domain has similarly experienced accelerated growth throughout the second half of the observation period, in line with the rise of biotechnology, of which it is one of the most important components.
In this context of technological heterogeneity and differently-paced growth, we examine technological cohesion based on co-classification. Figure 3A,B display the main component of the aggregated co-classification network of all 8-digit (maingroup) CPC classes featuring in one of the 1,525,980 initially selected patents, dichotomized at a minimum of 30 co-classified patents. This main component contains a total of 2030 technologies (i.e., CPC maingroups) and 27,388 linkages. Of these technologies, 535 are themselves bioeconomy technologies and form the network in Figure 3B,C after removing all non-bioeconomy technologies. This juxtaposition hints at two structural features of the bioeconomy technological field: First, it is not closed with respect to other technologies but integrates strongly with technologies outside of the scope of the bioeconomy as delineated in [65]. Second, its internal cohesion is not homogeneous across its subdomains; whereas developments in (bio)chemistry and life sciences (but also food technologies, which form a separate but still closely related cluster) seem to be strongly interconnected, this is much less the case for wood, paper and textile technologies.
They are instead strongly interlinked with non-bioeconomy technologies but are much less connected to the other technologies within the field and even to other technologies in their own domain.
Figure 4 offers a reduced-form overview of the application domains’ internal cohesion with the field-defining biochemistry domain as well as their external cohesion with technologies outside the field over the course of the observation period. Three major trends become apparent. First, there is a shift in the main applications of biochemical technologies: while in the first two periods, more co-classifications connect biochemistry to the food and the textiles, paper, and wood domains than the life sciences (which at this stage are still small), this pattern began to invert in the 1960s and the life sciences has since become the dominant domain connecting with biochemical knowledge. Second, notwithstanding this relative shift, the use of biochemical techniques in the traditional domains has also increased over time, with biochemistry co-classification rates at less than 1% in the first period for all application fields (except for life science technologies, which are always co-classified with biochemistry at close to 100%) but having increased to 7.4% (detergents and dyes), 7.0% (foods), 4.4% (textiles, paper, and wood), and 16.5% (agriculture and fertilizers) by the latest period. Third, instead of becoming more closed over time, the bioeconomy technological field has increasingly integrated with non-bioeconomy technologies, as indicated by the rising shares of non-bioeconomy CPC classes (with the exception of the agriculture domain, which also started at a much higher level than the other domains). This coincides with an increase in the average number of CPC classes received by a patent, which could indicate an overall increase in technological complexity and connectivity but which could also be an artifact of changed classification practices over the course of the observation period. In sum, these findings indicate an increase in both external and internal technological cohesion, with a shift towards the life sciences as the main driver of development in the integrative biochemistry domain.

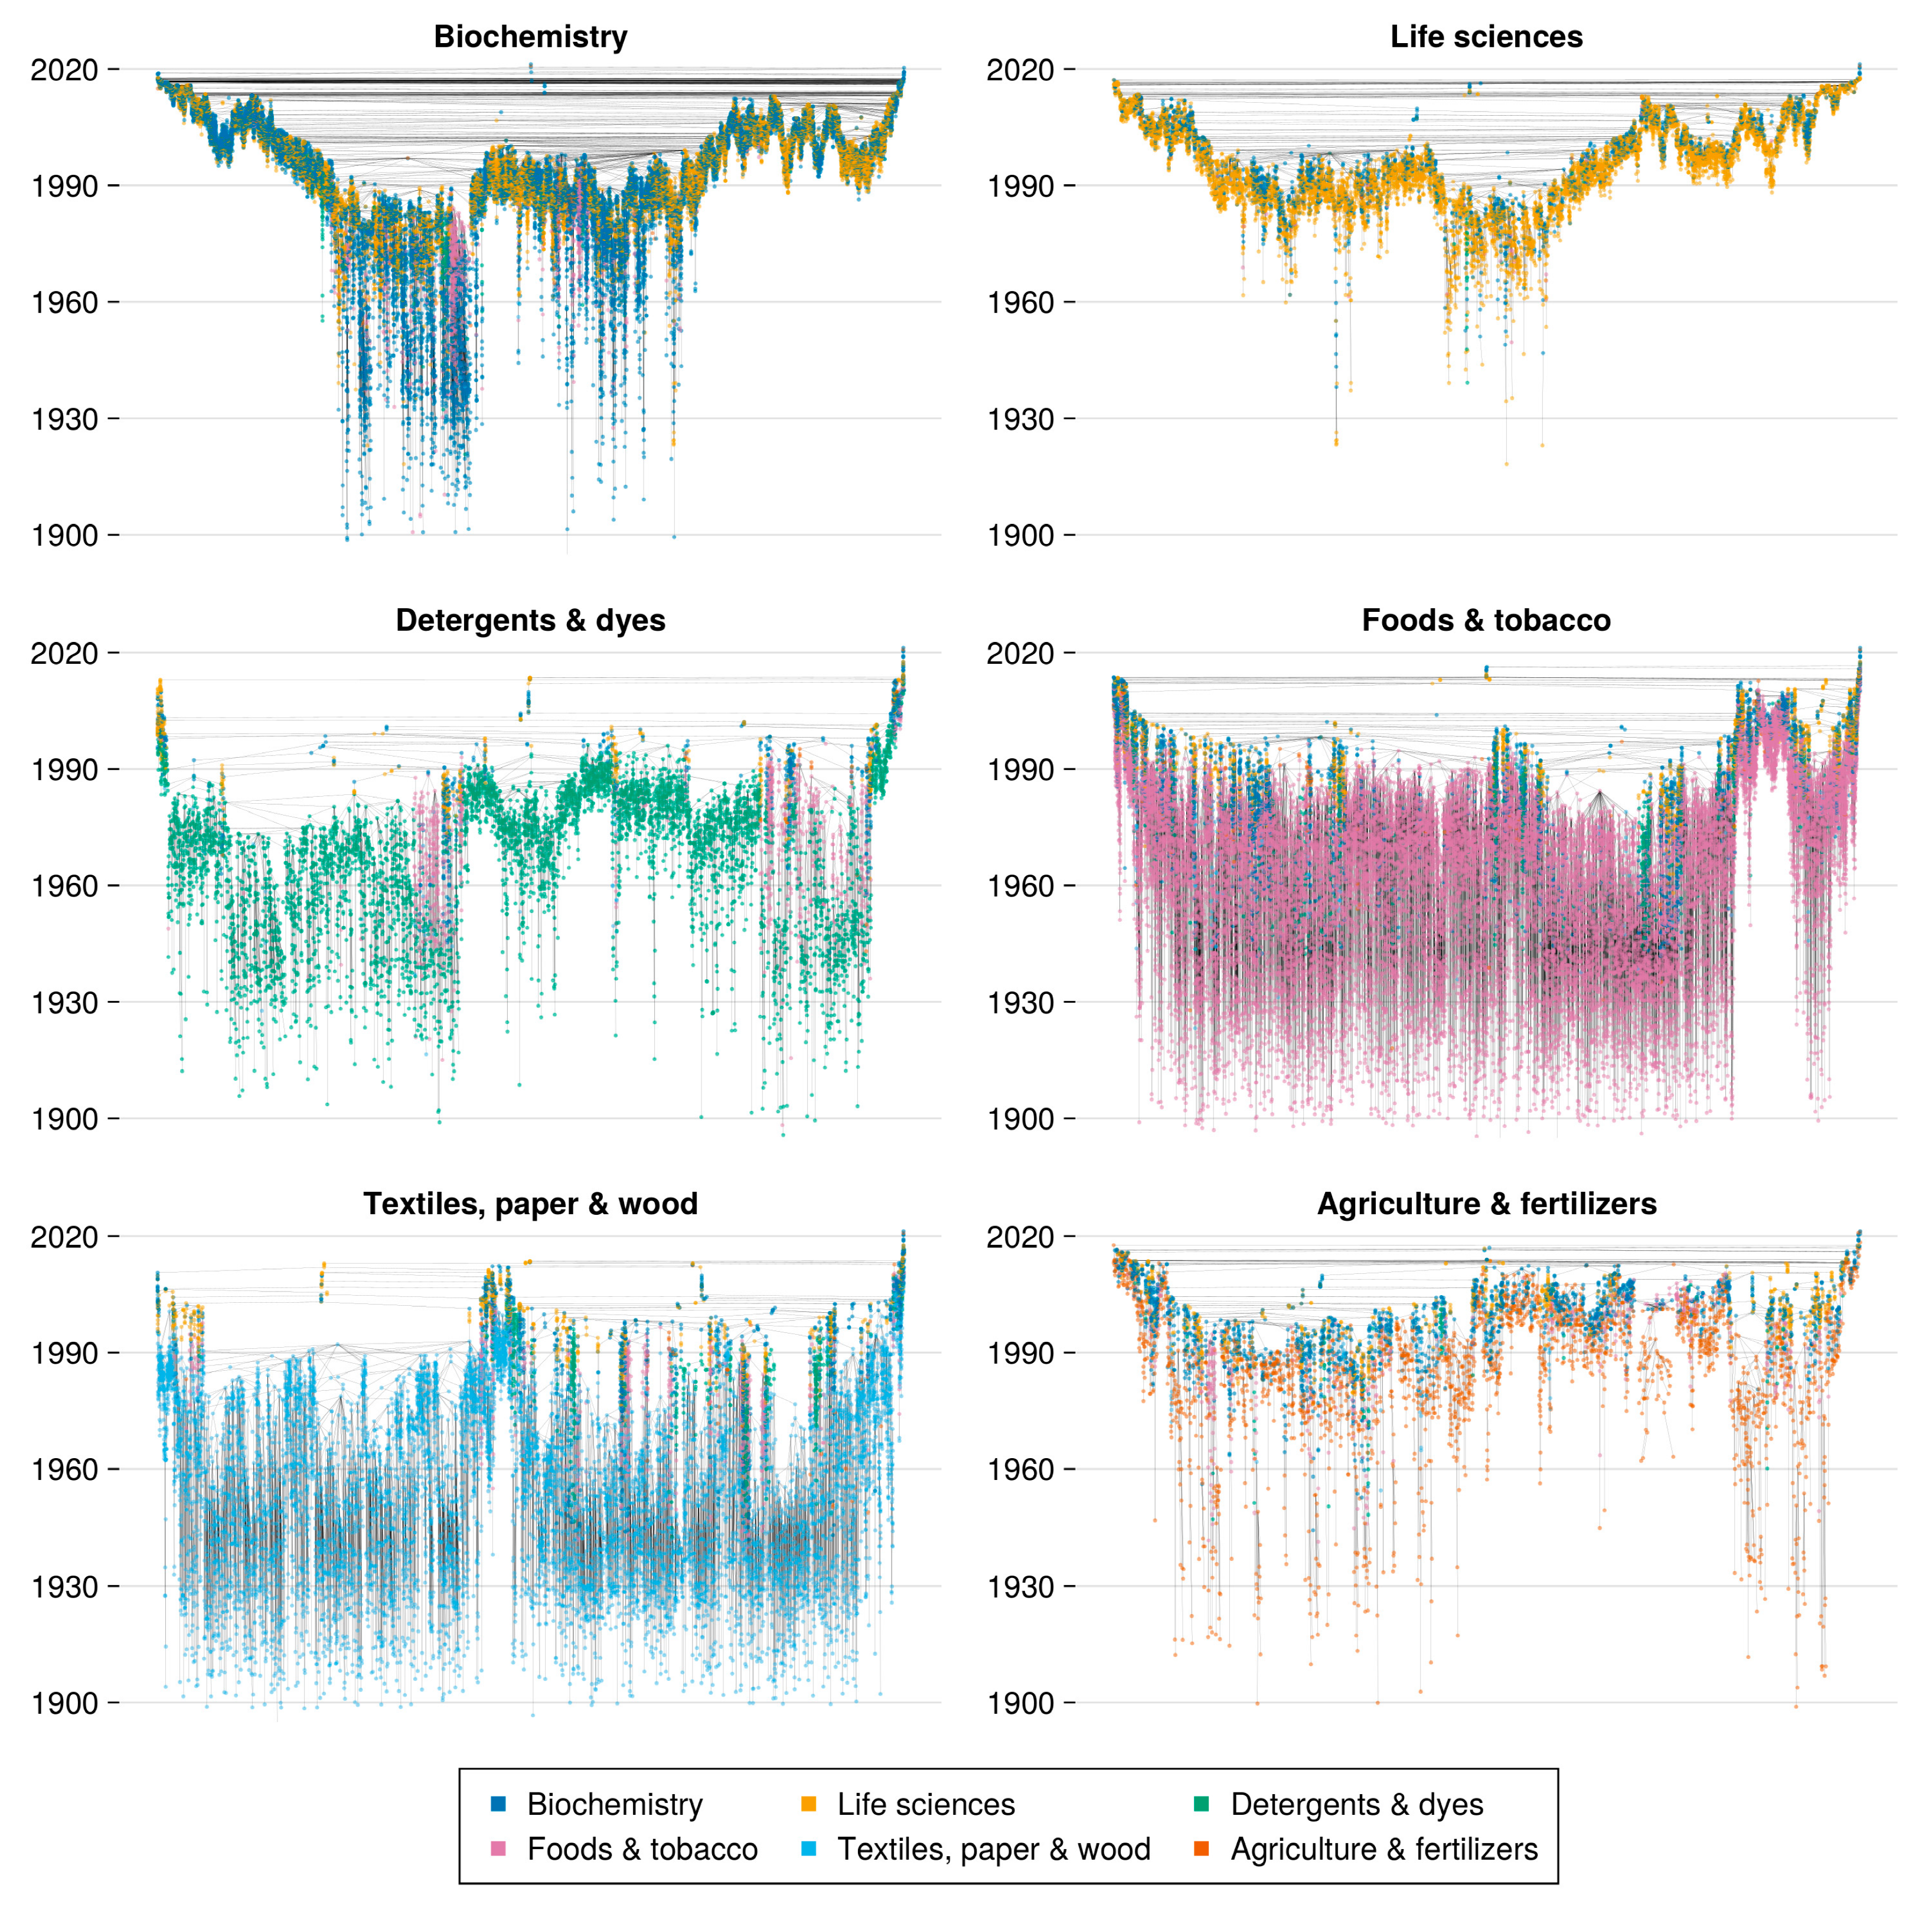
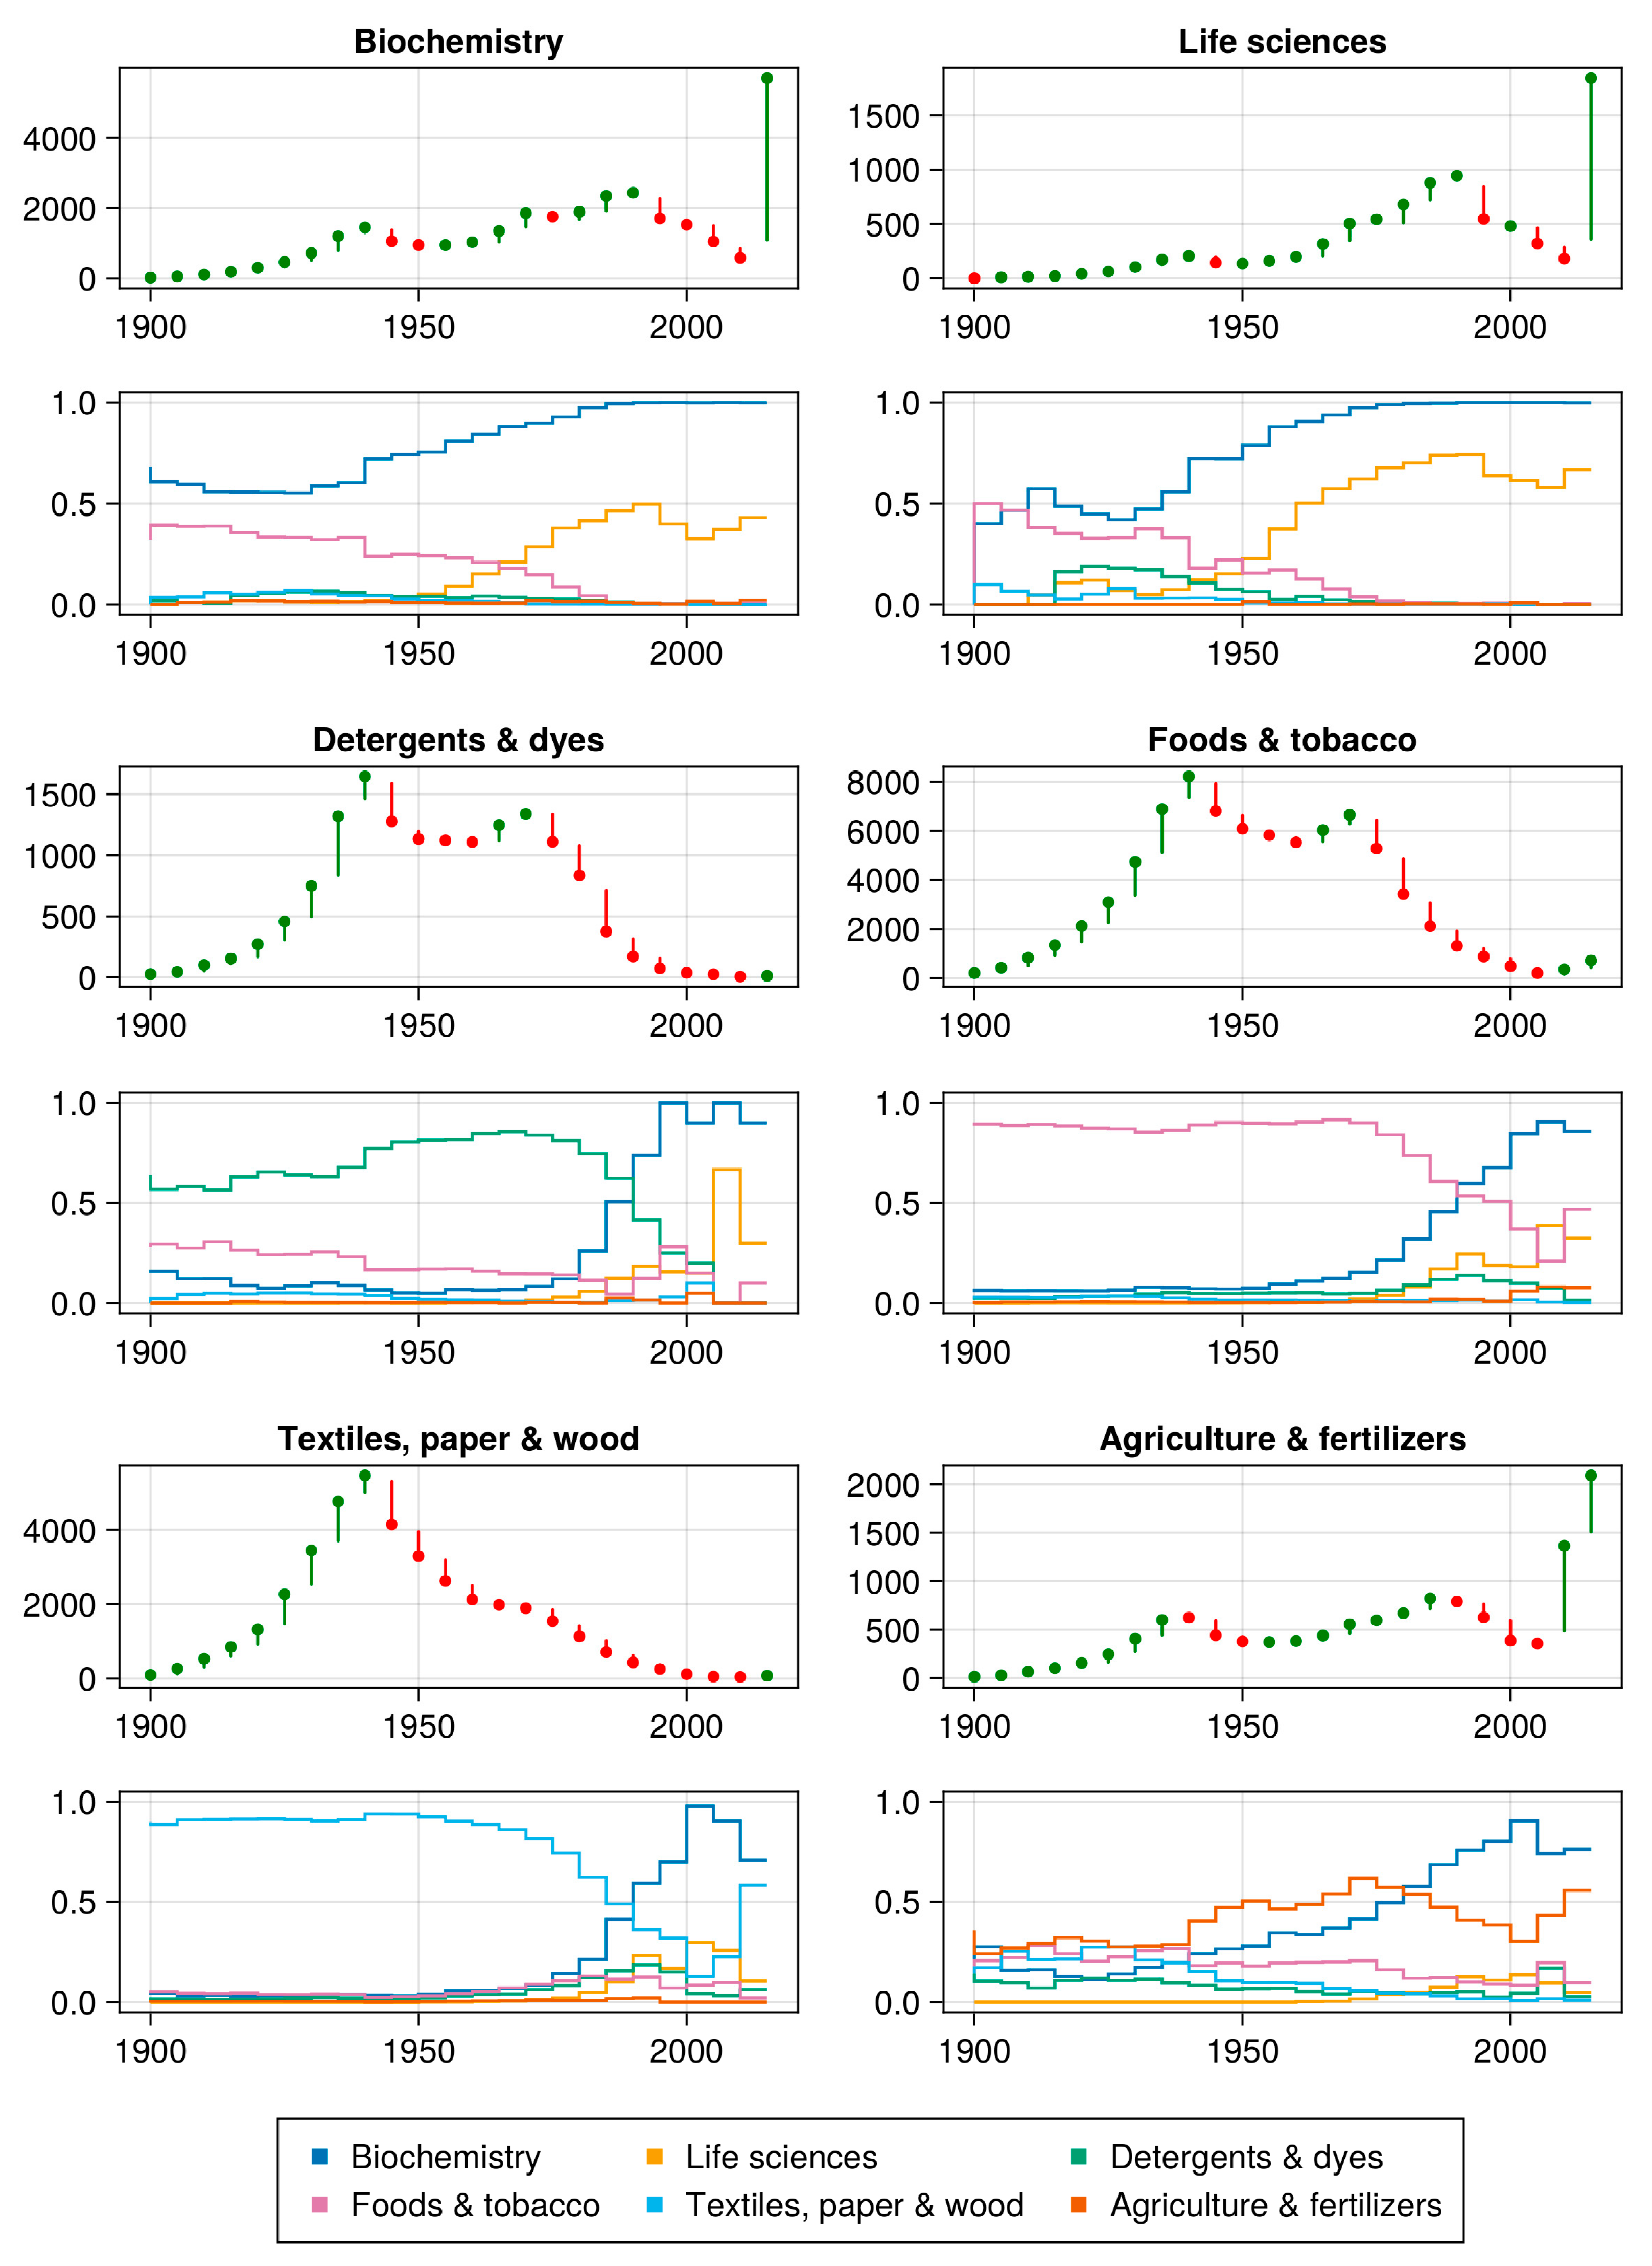
4.2. Intra- and Inter-Domain Convergence of Main Paths

As a next step, we use main path analysis to assess the degree of structural convergence of the major pathways of technological knowledge within and across the bioeconomy subdomains. We construct separate main path networks for each domain by initializing a forward–backward traversal departing at the top 5% of all nodes in terms of SPC vertex weight for each domain and extracting the main component. Figure 5 contains a visual representation of these main path networks (only forward trajectories are shown to facilitate readability) and indicates some basic differences in the timing of high-impact innovations across the fields. In particular, the foods and textiles domains exhibit a larger amount of early high-impact start patents (leading to visually longer paths) than the other domains, whereas life sciences and biochemistry start patents are much more recent, on average. There are also some common trends: The ragged top indicates structural convergence of main paths, i.e., the merging of parallel chains of citations. The differences in horizontal position and the depth of these ‘valleys’ indicate differences in the timing of convergence events. The fact that many of the main paths at some point culminate in dark blue (biochemistry) and yellow (life sciences) nodes further hints at inter-domain convergence, a trend which is visible, to some degree, for most domains.
Convergence patterns become more obvious when applying the procedure described in Section 3 to 5-year windows over the full observation period. Figure 6 displays the amount by which the number of parallel paths increases or decreases in a given period for all domain main paths (structural convergence, top panel).
Note that an increase in parallel paths can arise due to branching/divergence but also due to the first appearances of nodes that have no earlier citations in the dataset, which is especially the case in the earlier periods. It also shows, for each domain, the share of patents originating an outgoing path in a given period that belongs to that domain, which serves as a measure of inter-domain convergence. All domains show signs of structural convergence after an initial growth phase, indicated by subsequent reductions in parallel paths. They differ in terms of timing and intensity: Whereas the textiles, paper, and wood domain experienced a first period of convergence in the 1940s followed by a second period in the 1970s, the detergents and foods domains only started to converge in this second period. For the life sciences, biochemistry and agriculture domains, convergence occurred only throughout the 1990s and was generally much less pronounced for the latter than for the other application fields. Comparisons across the six domains reveal some more interesting patterns. First, especially for the textile domain and to a lesser extent for detergents and foods, early reduction in parallel paths was not accompanied by increased outward traversal into other domains, indicating an early phase of intra-domain convergence. The second, stronger phase of structural convergence, however, is associated with a domain switch, indicated by the increased share of outward paths connected to biochemistry patents. Whereas convergence with the biochemistry trajectory occurred in all of the four application fields (excluding the life sciences), it varied in timing and started earlier for agriculture than for the others. Finally, looking at the life sciences and biochemistry trajectories, their intricate co-evolution becomes apparent: both of them show considerable shares of patents in the respective other domain (with a high degree of co-classification) and both of them share a common origin in food technologies, as indicated by high shares of food patents among the outgoing paths in the first half of the observation period. The timing of the increasing co-evolution of biochemistry and the life sciences is in line with major medical breakthroughs in the 1970s, such as recombinant DNA technology, which enabled the industrial production of insulin and thus the treatment of diabetes [70].
To summarize, the technical evolution of the bioeconomy technological field has been characterized by clear signs of structural convergence of its major technological trajectories over the second half of the 20th century, with biochemical and biotechnological trajectories absorbing most of the trajectories originating in the traditional application fields. However, the biochemistry trajectory, which forms the backbone of the field and was itself strongly coupled to advances in the life sciences later on, at least partly originated from advances in food technologies in the early 20th century.

5. Discussion and Conclusions

In this paper, we have investigated technological cohesion and the structural convergence of major technological trajectories across the subdomains of the bioeconomy technological field. Using patent co-classification as a measure of technological cohesion, our analysis first shows that, over time, the bioeconomy technological field has become more interrelated with technologies external to the field, instead of becoming more closed.
This might go against expectations regarding field evolution at first sight, when considered from the perspective of a field that increasingly revolves around a common technological backbone and thus might become increasingly ‘self-sufficient’. However, there are multiple plausible explanations for increasing external connectivity instead of closure: First, it could reflect the increasing relevance of bioeconomy technologies beyond the confines of the field as delineated here, or, vice versa, the increased relevance of technologies outside the field for advancements of bioeconomy technologies, both of which are plausible. Second, increased connectivity across field boundaries can also be an effect of an overall increase in technological complexity induced by more and more innovations relying on recombination beyond local technological neighborhoods [5,20]. Third, increased cohesion as measured by patent co-classification might to a certain extent be an artifact of increasing complexity in the classification itself or of changed practices in the examination process, which ultimately gives rise to classification data. Discerning these explanations fully might be difficult, but studies focusing on, e.g., comparisons of field closure across multiple fields, more sophisticated indicators of field closure that take global trends into account, and historical analyses of the evolution of patenting systems would prove valuable for the validation of classification indicators as a stable data source.
Consistent with historical accounts [8], a simple measure of convergence based on main path analysis shows how the development of modern biochemistry (as the core of biotechnology) absorbed earlier technological trajectories, especially in food technologies, and became the technological backbone of the overall field trajectory. This increasing dominance of the biochemistry trajectory is closely linked to the rise of biotechnological life sciences in the 1970s, which witnessed a series of technological breakthroughs that stimulated the development of a range of downstream applications [8]. This pattern of initial emergence from food technologies and the subsequent co-evolution of biochemistry and the life sciences indicates a pattern of demand-driven innovation [71]—both industrialized foods and life sciences represent high-impact ‘carrier applications’ that provided a vehicle for the development of integrative, cross-sectional technologies in biochemistry in the historical contexts where they had major societal impacts.
The approach outlined here also has some limitations. So far, the use of main path analysis has been largely descriptive, and while this analysis has aimed to provide some more systematic investigation of the structural features exhibited by main paths, it is no different in that regard. Theoretical models that specify, e.g., under which conditions or by which stimulants general-purpose technologies can branch from their origin applications and attach to new applications are currently underdeveloped. They would, however, make for a valuable contribution in that they could provide a much-needed foundation for future applications of main path methods. More generally, both empirical and theoretical contributions that directly relate convergence of technological fields, or other evolutionary patterns, for that matter, to changes in industrial organization [4] would make for a good basis not only for future research but also for policy that seeks to assess and diversify risk arising from fast-paced technological change.
Furthermore, despite the many advantages of patents as a data source for assessing technological development, it is not always clear to what degree variation in patenting activity reflects variation in the underlying innovation rates or in the proclivity to file patents for those innovations. Because main path analysis focuses on structural aspects instead of application rates and ‘filters’ a corpus of patents by selecting only chains of high-impact patents, it is presumably somewhat more robust against differences in patenting activity over time or industries [15]. However, the precise relationships between structural aspects of main paths, patenting rates, and innovation rates are still speculative, a fact that would need to be remedied to unlock the full potential of main path analysis as a tool for historical analysis.

Author Contributions

Conceptualization, J.H.; Data curation, J.H.; Formal analysis, J.H.; Funding acquisition, J.G.; Investigation, J.H.; Methodology, J.H.; Project administration, J.H. and J.G.; Resources, J.H.; Software, J.H.; Supervision, J.G.; Validation, J.H.; Visualization, J.H. Writing—original draft, J.H.; Writing—review and editing, J.H. and J.G. All authors have read and agreed to the published version of the manuscript.

Funding

The authors acknowledge funding support by the German Federal Ministry of Education and Research (BMBF) as part of the BIOTEXFUTURE project (FKZ: 031B1349B).

Institutional Review Board Statement

Not applicable.

Informed Consent Statement

Not applicable.

Data Availability Statement

Data and code can be obtained from the authors upon request.

Conflicts of Interest

All authors declare no conflict of interest.

References

  1. European Commission Target Investment Areas. Available online: https://commission.europa.eu/strategy-and-policy/eu-budget/strategic-technologies-europe-platform/target-investment-areas_en (accessed on 30 June 2023).
  2. Dosi, G.; Nelson, R.R. Technical Change and Industrial Dynamics as Evolutionary Processes. In Handbook of the Economics of Innovation; Hall, B.H., Rosenberg, N., Eds.; Elsevier: Amsterdam, The Netherlands, 2010; Volume 1, pp. 51–127. [Google Scholar]
  3. Hargadon, A.; Sutton, R.I. Technology Brokering and Innovation in a Product Development Firm. Adm. Sci. Q. 1997, 42, 716–749. [Google Scholar] [CrossRef]
  4. Mazzucato, M.; Dosi, G. Knowledge Accumulation and Industry Evolution: The Case of Pharma-Biotech; Cambridge University Press: Cambridge, UK, 2006; ISBN 978-0-521-85822-9. [Google Scholar]
  5. Strumsky, D.; Lobo, J. Identifying the Sources of Technological Novelty in the Process of Invention. Res. Policy 2015, 44, 1445–1461. [Google Scholar] [CrossRef] [Green Version]
  6. McCormick, K.; Kautto, N. The Bioeconomy in Europe: An Overview. Sustainability 2013, 5, 2589–2608. [Google Scholar] [CrossRef] [Green Version]
  7. Staffas, L.; Gustavsson, M.; McCormick, K. Strategies and Policies for the Bioeconomy and Bio-Based Economy: An Analysis of Official National Approaches. Sustainability 2013, 5, 2751–2769. [Google Scholar] [CrossRef] [Green Version]
  8. Buchholz, K.; Collins, J. The Roots—A Short History of Industrial Microbiology and Biotechnology. Appl. Microbiol. Biotechnol. 2013, 97, 3747–3762. [Google Scholar] [CrossRef]
  9. D’Adamo, I.; Gastaldi, M.; Morone, P.; Rosa, P.; Sassanelli, C.; Settembre-Blundo, D.; Shen, Y. Bioeconomy of Sustainability: Drivers, Opportunities and Policy Implications. Sustainability 2022, 14, 200. [Google Scholar] [CrossRef]
  10. Dosi, G. Technological Paradigms and Technological Trajectories. A Suggested Interpretation of the Determinants and Directions of Technical Change. Res. Policy 1982, 11, 147–162. [Google Scholar] [CrossRef]
  11. Epicoco, M. Knowledge Patterns and Sources of Leadership: Mapping the Semiconductor Miniaturization Trajectory. Res. Policy 2013, 42, 180–195. [Google Scholar] [CrossRef] [Green Version]
  12. Martinelli, A. An Emerging Paradigm or Just Another Trajectory? Understanding the Nature of Technological Changes Using Engineering Heuristics in the Telecommunications Switching Industry. Res. Policy 2012, 41, 414–429. [Google Scholar] [CrossRef] [Green Version]
  13. Aaldering, L.J.; Song, C.H. Tracing the Technological Development Trajectory in Post-Lithium-Ion Battery Technologies: A Patent-Based Approach. J. Clean. Prod. 2019, 241, 118343. [Google Scholar] [CrossRef]
  14. Huenteler, J.; Ossenbrink, J.; Schmidt, T.S.; Hoffmann, V.H. How a Product’s Design Hierarchy Shapes the Evolution of Technological Knowledge—Evidence from Patent-Citation Networks in Wind Power. Res. Policy 2016, 45, 1195–1217. [Google Scholar] [CrossRef]
  15. Verspagen, B. Mapping Technological Trajectories as Patent Citation Networks: A Study on the History of Fuel Cell Research. Adv. Complex Syst. 2007, 10, 93–115. [Google Scholar] [CrossRef] [Green Version]
  16. Powell, W.W.; White, D.R.; Koput, K.W.; Owen-Smith, J. Network Dynamics and Field Evolution: The Growth of Interorganizational Collaboration in the Life Sciences. Am. J. Sociol. 2005, 110, 1132–1205. [Google Scholar] [CrossRef] [Green Version]
  17. Bioeconomy Council Sustainable Bioeconomy. Available online: https://www.biooekonomierat.de/en/bioeconomy-council/sustainable-bioeconomy.php (accessed on 1 July 2023).
  18. El-Chichakli, B.; von Braun, J.; Lang, C.; Barben, D.; Philp, J. Policy: Five Cornerstones of a Global Bioeconomy. Nature 2016, 535, 221–223. [Google Scholar] [CrossRef] [PubMed] [Green Version]
  19. OECD. The Bioeconomy to 2030: Designing a Policy Agenda; Organization for Economic Co-Operation and Development: Paris, France, 2009; ISBN 978-92-64-03853-0. [Google Scholar]
  20. Kaplan, S.; Vakili, K. The Double-Edged Sword of Recombination in Breakthrough Innovation. Strateg. Manag. J. 2015, 36, 1435–1457. [Google Scholar] [CrossRef]
  21. Frenken, K.; Izquierdo, L.R.; Zeppini, P. Branching Innovation, Recombinant Innovation, and Endogenous Technological Transitions. Environ. Innov. Soc. Transit. 2012, 4, 25–35. [Google Scholar] [CrossRef] [Green Version]
  22. Kodama, F. Harvard Business Review; Elsevier: Amsterdam, The Netherlands, 1992. [Google Scholar]
  23. Curran, C.-S.; Bröring, S.; Leker, J. Anticipating Converging Industries Using Publicly Available Data. Technol. Forecast. Soc. Change 2010, 77, 385–395. [Google Scholar] [CrossRef]
  24. Sick, N.; Preschitschek, N.; Leker, J.; Bröring, S. A New Framework to Assess Industry Convergence in High Technology Environments. Technovation 2019, 84–85, 48–58. [Google Scholar] [CrossRef]
  25. Jeong, S.; Kim, J.-C.; Choi, J.Y. Technology Convergence: What Developmental Stage Are We In? Scientometrics 2015, 104, 841–871. [Google Scholar] [CrossRef]
  26. Gauch, S.; Blind, K. Technological Convergence and the Absorptive Capacity of Standardisation. Technol. Forecast. Soc. Change 2015, 91, 236–249. [Google Scholar] [CrossRef]
  27. Han, E.J.; Sohn, S.Y. Technological Convergence in Standards for Information and Communication Technologies. Technol. Forecast. Soc. Change 2016, 106, 1–10. [Google Scholar] [CrossRef]
  28. Bröring, S.; Leker, J. Industry Convergence and Its Implications for the Front End of Innovation: A Problem of Absorptive Capacity. Creat. Innov. Manag. 2007, 16, 165–175. [Google Scholar] [CrossRef]
  29. Caviggioli, F. Technology Fusion: Identification and Analysis of the Drivers of Technology Convergence Using Patent Data. Technovation 2016, 55–56, 22–32. [Google Scholar] [CrossRef]
  30. Curran, C.-S.; Leker, J. Patent Indicators for Monitoring Convergence—Examples from NFF and ICT. Technol. Forecast. Soc. Change 2011, 78, 256–273. [Google Scholar] [CrossRef]
  31. Gambardella, A.; Torrisi, S. Does Technological Convergence Imply Convergence in Markets? Evidence from the Electronics Industry. Res. Policy 1998, 27, 445–463. [Google Scholar] [CrossRef]
  32. Duysters, G.; Hagedoorn, J. Technological Convergence in the IT Industry: The Role of Strategic Technology Alliances and Technological Competencies. Int. J. Econ. Bus. 1998, 5, 355–368. [Google Scholar] [CrossRef] [Green Version]
  33. Jung, S.; Kim, K.; Lee, C. The Nature of ICT in Technology Convergence: A Knowledge-Based Network Analysis. PLoS ONE 2021, 16, e0254424. [Google Scholar] [CrossRef] [PubMed]
  34. No, H.J.; Park, Y. Trajectory Patterns of Technology Fusion: Trend Analysis and Taxonomical Grouping in Nanobiotechnology. Technol. Forecast. Soc. Change 2010, 77, 63–75. [Google Scholar] [CrossRef]
  35. Feng, S.; An, H.; Li, H.; Qi, Y.; Wang, Z.; Guan, Q.; Li, Y.; Qi, Y. The Technology Convergence of Electric Vehicles: Exploring Promising and Potential Technology Convergence Relationships and Topics. J. Clean. Prod. 2020, 260, 120992. [Google Scholar] [CrossRef]
  36. Kose, T.; Sakata, I. Identifying Technology Convergence in the Field of Robotics Research. Technol. Forecast. Soc. Change 2019, 146, 751–766. [Google Scholar] [CrossRef]
  37. Kim, E.; Cho, Y.; Kim, W. Dynamic Patterns of Technological Convergence in Printed Electronics Technologies: Patent Citation Network. Scientometrics 2014, 98, 975–998. [Google Scholar] [CrossRef]
  38. Sanz-Hernández, A.; Esteban, E.; Garrido, P. Transition to a Bioeconomy: Perspectives from Social Sciences. J. Clean. Prod. 2019, 224, 107–119. [Google Scholar] [CrossRef] [Green Version]
  39. Giampietro, M. On the Circular Bioeconomy and Decoupling: Implications for Sustainable Growth. Ecol. Econ. 2019, 162, 143–156. [Google Scholar] [CrossRef]
  40. Kakadellis, S.; Rosetto, G. Achieving a Circular Bioeconomy for Plastics. Science 2021, 373, 49–50. [Google Scholar] [CrossRef]
  41. Muscat, A.; de Olde, E.M.; Ripoll-Bosch, R.; Van Zanten, H.H.E.; Metze, T.A.P.; Termeer, C.J.A.M.; van Ittersum, M.K.; de Boer, I.J.M. Principles, Drivers and Opportunities of a Circular Bioeconomy. Nat. Food 2021, 2, 561–566. [Google Scholar] [CrossRef] [PubMed]
  42. Lewandowski, I. (Ed.) Bioeconomy: Shaping the Transition to a Sustainable, Biobased Economy; Springer International Publishing: Cham, Switzerland, 2018; ISBN 978-3-319-68151-1. [Google Scholar]
  43. Bahaji, A.; Li, J.; Sánchez-López, Á.M.; Baroja-Fernández, E.; Muñoz, F.J.; Ovecka, M.; Almagro, G.; Montero, M.; Ezquer, I.; Etxeberria, E.; et al. Starch Biosynthesis, Its Regulation and Biotechnological Approaches to Improve Crop Yields. Biotechnol. Adv. 2014, 32, 87–106. [Google Scholar] [CrossRef] [PubMed]
  44. Bailey-Serres, J.; Parker, J.E.; Ainsworth, E.A.; Oldroyd, G.E.D.; Schroeder, J.I. Genetic Strategies for Improving Crop Yields. Nature 2019, 575, 109–118. [Google Scholar] [CrossRef] [Green Version]
  45. Sharma, H.C.; Crouch, J.H.; Sharma, K.K.; Seetharama, N.; Hash, C.T. Applications of Biotechnology for Crop Improvement: Prospects and Constraints. Plant Sci. 2002, 163, 381–395. [Google Scholar] [CrossRef] [Green Version]
  46. Jiao, G.-J.; Peng, P.; Sun, S.-L.; Geng, Z.-C.; She, D. Amination of Biorefinery Technical Lignin by Mannich Reaction for Preparing Highly Efficient Nitrogen Fertilizer. Int. J. Biol. Macromol. 2019, 127, 544–554. [Google Scholar] [CrossRef]
  47. Santamaría-Fernández, M.; Molinuevo-Salces, B.; Lübeck, M.; Uellendahl, H. Biogas Potential of Green Biomass after Protein Extraction in an Organic Biorefinery Concept for Feed, Fuel and Fertilizer Production. Renew. Energy 2018, 129, 769–775. [Google Scholar] [CrossRef]
  48. Kallio, A.M.I. Wood-Based Textile Fibre Market as Part of the Global Forest-Based Bioeconomy. For. Policy Econ. 2021, 123, 102364. [Google Scholar] [CrossRef]
  49. Morland, C.; Schier, F. Modelling Bioeconomy Scenario Pathways for the Forest Products Markets with Emerging Lignocellulosic Products. Sustainability 2020, 12, 10540. [Google Scholar] [CrossRef]
  50. Rajesh Banu, J.; Preethi; Kavitha, S.; Tyagi, V.K.; Gunasekaran, M.; Karthikeyan, O.P.; Kumar, G. Lignocellulosic Biomass Based Biorefinery: A Successful Platform towards Circular Bioeconomy. Fuel 2021, 302, 121086. [Google Scholar] [CrossRef]
  51. Esposti, M.D.; Morselli, D.; Fava, F.; Bertin, L.; Cavani, F.; Viaggi, D.; Fabbri, P. The Role of Biotechnology in the Transition from Plastics to Bioplastics: An Opportunity to Reconnect Global Growth with Sustainability. FEBS Open Bio 2021, 11, 967–983. [Google Scholar] [CrossRef] [PubMed]
  52. Rosenboom, J.-G.; Langer, R.; Traverso, G. Bioplastics for a Circular Economy. Nat. Rev. Mater. 2022, 7, 117–137. [Google Scholar] [CrossRef] [PubMed]
  53. Barbosa, J.; Teixeira, P. Biotechnology Approaches in Food Preservation and Food Safety. Foods 2022, 11, 1391. [Google Scholar] [CrossRef] [PubMed]
  54. Shetty, K. (Ed.) Food Biotechnology, 2nd ed.; CRC Press: Boca Raton, FL, USA, 2006; ISBN 978-0-8247-5329-0. [Google Scholar]
  55. Hertel, T.; Steinbuks, J.; Baldos, U. Competition for Land in the Global Bioeconomy. Agric. Econ. 2013, 44, 129–138. [Google Scholar] [CrossRef]
  56. Lewandowski, I. Securing a Sustainable Biomass Supply in a Growing Bioeconomy. Glob. Food Secur. 2015, 6, 34–42. [Google Scholar] [CrossRef]
  57. Rosegrant, M.W.; Ringler, C.; Zhu, T.; Tokgoz, S.; Bhandary, P. Water and Food in the Bioeconomy: Challenges and Opportunities for Development. Agric. Econ. 2013, 44, 139–150. [Google Scholar] [CrossRef]
  58. Golembiewski, B.; Sick, N.; Bröring, S. Patterns of Convergence within the Emerging Bioeconomy—The Case of the Agricultural and Energy Sector. Int. J. Innov. Technol. Manag. 2015, 12, 1550012. [Google Scholar] [CrossRef]
  59. Zilberman, D.; Kim, E.; Kirschner, S.; Kaplan, S.; Reeves, J. Technology and the Future Bioeconomy. Agric. Econ. 2013, 44, 95–102. [Google Scholar] [CrossRef]
  60. Gupta, R.; Beg, Q.; Lorenz, P. Bacterial Alkaline Proteases: Molecular Approaches and Industrial Applications. Appl. Microbiol. Biotechnol. 2002, 59, 15–32. [Google Scholar] [CrossRef] [PubMed]
  61. Paul, T.; Das, A.; Mandal, A.; Halder, S.K.; Jana, A.; Maity, C.; DasMohapatra, P.K.; Pati, B.R.; Mondal, K.C. An Efficient Cloth Cleaning Properties of a Crude Keratinase Combined with Detergent: Towards Industrial Viewpoint. J. Clean. Prod. 2014, 66, 672–684. [Google Scholar] [CrossRef]
  62. Muttenthaler, M.; King, G.F.; Adams, D.J.; Alewood, P.F. Trends in Peptide Drug Discovery. Nat. Rev. Drug Discov. 2021, 20, 309–325. [Google Scholar] [CrossRef] [PubMed]
  63. Evans, W.E.; Relling, M.V. Moving towards Individualized Medicine with Pharmacogenomics. Nature 2004, 429, 464–468. [Google Scholar] [CrossRef]
  64. Dunbar, C.E.; High, K.A.; Joung, J.K.; Kohn, D.B.; Ozawa, K.; Sadelain, M. Gene Therapy Comes of Age. Science 2018, 359, eaan4672. [Google Scholar] [CrossRef] [Green Version]
  65. Wackerbauer, J.; Rave, T.; Dammer, L.; Piotrowski, S.; Jander, W.; Grundmann, P.; Wydra, S.; Schmoch, U. Ermittlung Wirtschaftlicher Kennzahlen Und Indikatoren Für Ein Monitoring Des Voranschreitens Der Bioökonomie; Ifo Institut: München, Germany, 2019. [Google Scholar]
  66. Jaffe, A.B.; Trajtenberg, M.; Henderson, R. Geographic Localization of Knowledge Spillovers as Evidenced by Patent Citations. Q. J. Econ. 1993, 108, 577–598. [Google Scholar] [CrossRef]
  67. Hummon, N.P.; Doreian, P. Connectivity in a Citation Network: The Development of DNA Theory. Soc. Netw. 1989, 11, 39–63. [Google Scholar] [CrossRef]
  68. Liu, J.S.; Lu, L.Y.Y.; Ho, M.H.C. A Few Notes on Main Path Analysis. Scientometrics 2019, 119, 379–391. [Google Scholar] [CrossRef]
  69. Batagelj, V. Efficient Algorithms for Citation Network Analysis. arXiv 2003, arXiv:cs/0309023v1. [Google Scholar]
  70. Govender, T.; Naicker, T. Insulin as a Catalyst to Recombinant DNA Technology. Nat. Catal. 2023, 6, 454–455. [Google Scholar] [CrossRef]
  71. Freeman, C. The Economics of Technical Change. Camb. J. Econ. 1994, 18, 463–514. [Google Scholar] [CrossRef]
Figure 1. Structural convergence in main path networks. Filled and blank nodes represent patents belonging to different domains.
Sustainability 15 12100 g001
Figure 2. Development of patenting activity across bioeconomy subdomains.
Sustainability 15 12100 g002
Figure 3. (A) Full co-classification network with bioeconomy technologies (CPC maingroups) marked red and non-bioeconomy technologies marked grey. (B) Co-classification matrix permuted by bioeconomy (left, bottom) and non-bioeconomy technologies. Brighter color indicates higher degree of coclassification. (C,D) Same as A and B but showing the bioeconomy induced subgraph with nodes color-coded and matrix permuted according to the six subdomains.
Sustainability 15 12100 g003
Figure 4. Internal and external cohesion in the bioeconomy. Edge weights indicate co-classification counts, node sizes are scaled according to patent counts, and percentages connected to dashed lines indicate the average share of field-external CPC maingroups for a patent of the given domain.
Sustainability 15 12100 g004
Figure 5. Main path networks for the six domains. Only forward paths originating from start nodes are shown to facilitate visualization. Main paths used for convergence analysis also contain backwards paths.
Sustainability 15 12100 g005
Figure 6. Intra- and inter-domain convergence. Top panels show the number of incoming and outgoing paths for each period (green indicates a positive change, red a negative change). Bottom panels show the shares of patents originating outgoing paths that are associated with each of the six domains. Because patents can belong to multiple domains, shares do not necessarily add to 1.
Sustainability 15 12100 g006
Table 1. CPC labels used for selecting bioeconomy patents.
IPC Technology ClassDescription
Agriculture, foods
A01HNew plants
A01PChemical agents for the regulation of plant growth
A21DConservation of flour and dough for baking
A23 (excluding A23N, A23P)Foods
A24BTobacco
A43B,CShoewear
C05FOrganic fertilizer
C13Sugar industry
F23G7/02,10Burning of organic matter
Life sciences
A61K38Drugs containing peptides
A61K39Drugs containing antigens or antibodies
A61K48Drugs containing genetic material
G01N33/44-98Analyzing biological materials
Wood, paper, textiles
B27KTreatment of wood
B27NManufacturing articles from wood chips or fibers
D21B,C,DCellulose for papermaking
C14Hides, skins, leather
D01B,C,DTreatment of natural fibers and filaments
D01F02,04Filaments from natural materials
Chemistry
C02F3; C02F11/02,04Biological treatment of water and sludge
C07G11-15Antibiotics, vitamins, and hormones
C07KPeptides
C08CTreatment of rubber
C08HDerivatives of natural macromolecular compounds
C08BPolysaccharides
C08L 01,03,05,07,13,15,17,
19,21,87,89,91,93,97,99
Compounds based on natural macromolecular compounds
C09D 11/04,06,08Inks based on natural substances
C09D103,105,107,113,115,117, 119,121,189,191,193,197,199Coating agents based on natural substances
C09FNatural resins
C09H01Natural substances for the production of glue
C09J 101,103,105,107,113,115,
117,119,121,189,191,193,197,199
Natural dyes
C11B,C,DNatural fats, waxes, cleaning agents
C12Biochemistry
G01N 33/2-14,44,46Analyzing natural substances
Source: Translated adaptation of Table 3 in Wackerbauer et al. [65].
Table 2. Bioeconomy subdomains.
DomainCPC Class (3-Digit)N MaingroupsN Families
1 BiochemistryC12, C07, C08263686,837
2 Life sciencesA61, G014128,782
3 Detergents and dyesC11, C0953116,851
4 Foods and tobaccoA23, A21, A24, C1398482,997
5 Textiles, paper and woodA43, D01, D21, B27, C1483208,176
6 Agriculture and fertilizersA01, C05, C02, F2331109,347
Note: The selection of bioeconomy patents is based on Table 1, which in many cases relies on CPC labels under the ‘class’ 3-digit and accordingly not all patents belonging to the classes listed here are included in the final selection of patents.
Disclaimer/Publisher’s Note: The statements, opinions and data contained in all publications are solely those of the individual author(s) and contributor(s) and not of MDPI and/or the editor(s). MDPI and/or the editor(s) disclaim responsibility for any injury to people or property resulting from any ideas, methods, instructions or products referred to in the content.

