1. Introduction
Given the current Anthropocene era, there is a compelling need to embrace nature-based solutions as a means to address the increasingly pressing issues of climate change and biodiversity loss. In cities, improving green space areas has emerged as a crucial tool to mitigate the adverse impacts of rapid urban development. Urban green space, including parks, gardens, and green walls, contributes to cooling cities [
1,
2], enhancing urban health [
3,
4], supporting the economy [
5,
6,
7], and benefiting ecosystems [
8]. Psychological research also highlights the non-physical benefits of urban greenery, as green spaces with amenities can encourage outdoor activities and interactions among residents and, thus, reduce negative emotions such as sadness, fear, and stress arousal [
9,
10,
11]. Providing opportunities and venue for social activities and interaction, green spaces also contribute to social cohesion [
12]. Attributes such as proximity, accessibility, size, and the quality of equipment, on the one hand, and interpersonal interaction and exchange, on the other, play significant roles in the effect green areas have on their immediate urban environments [
13,
14,
15].
While numerous studies declare consensus about high-quality green spaces as a tool to mitigate climate change [
16,
17,
18,
19,
20] and improve the health and well-being of urban dwellers [
21,
22,
23], the most critical aspect is improving the social relevance of green spaces. In other words, while improvement and/or preservation of green spaces has positive effects on their ecological quality, it is very delicate to assess the effect of either advancement or continuous maintenance of green spaces on the social structures inhabiting their catchment areas [
24,
25,
26]. On the one hand, green areas with newly improved infrastructure and facilities can easily lead to the so-called ‘greentrification’ (green gentrification) [
27,
28,
29,
30], forcing original dwellers to move out of their residences due to improved catchment green areas. On the other hand, in the already existing green areas (especially community gardens), it is complicated to implement the values of social inclusion and social equity while preserving cultural diversity [
31,
32]: what prevails in these areas is a specific sense of belonging which includes some community members (usually long-term residents), but certainly not all. Therefore, the critical challenge is translating the omnipresent debate on green cities into implementable actions that will boost the overall quality of life [
33,
34,
35].
Some scholars argue that the lack of guidance in transforming the green cities principles into practice is partly due to the generalization of different types of green spaces in planning policies without considering their specific characteristics or quality [
36]. Others point to the overwhelming emphasis on the physical attributes of green spaces over their immaterial features [
37]. Against this background and using the case study of Zurich, Switzerland, and, more specifically, looking into the neighborhoods currently undergoing significant densification (hence posing a threat to green spaces), this study examines the extent to which ‘green urban agenda’ policy priorities defined at various scales (federal, cantonal, municipal) have been translated and implemented at the local level, e.g., neighborhoods. More precisely, attending to the physical green space attributes (e.g., location, size, connectivity, design, equipment) but also looking at the dominant activities in green areas and people’s behavior (as immaterial green space attributes), the paper offers a critical evaluation of the current practice of the green space planning and design against the dominant policy narratives, pointing to the underestimated aspects and attributes as a base for further research and planning interventions.
The paper is structured as follows. The introductory section precedes a brief overview of the global and European territorial and urban planning policies highlighting the principles of the ‘green urban agenda’. The paper continues with a brief explanation of the methodological strategy applied to then provide a multi-layered analysis of: (1) the national policy instruments, (2) green spaces in Altstetten–Albisrieden (distribution, types, size, and mutual connectivity) as a district undergoing densification yet with a variety of green spaces, and (3) four selected green space clusters and the dominant activities emerging there. The discussion unveils the relations between the priorities proclaimed in the policy framework and their implementation in practice. The conclusion offers the lessons learned compared to the current studies, highlights the research limitations, and emphasizes the future directions for similar studies.
2. Towards Green Cities: Overview of Meta-Trends
Informed by the
United Nations’ 2030 Agenda for Sustainable Development [
12] as the overall framework and, in particular, Sustainable Development Goal (SDG) 11 (sustainable cities and communities), SDG 13 (climate action), and SDG 15 (life on land), and based on the previous authors’ research [
38], the following topical meta-trends are identified under the umbrella narrative of ‘green urban agenda’: (a) green city, (b) climate adaptation and mitigation, (c) densification/infill development, (d) resilience, and (e) sustainable development. To operationalize the above, rather abstract meta-trends, it is necessary to comprehend how leading international policies recognize the benefits of green space on individual and community well-being, all covered under the umbrella term ‘green urban agenda’.
The United Nations’ Sustainable Development Goal 11 aims at providing universal access to safe and inclusive urban green and public spaces by 2030 [
39].
New Urban Agenda [
40] emphasizes the need for compact, connected, and inclusive cities that prioritize environmental sustainability, green infrastructure, and the preservation and enhancement of natural and cultural heritage. The World Health Organization encourages cities to adopt policies and strategies that prioritize health and well-being, including the provision of green spaces, active transport infrastructure, and measures to address environmental determinants of health [
41]. Many cities within the C40 network have adopted sustainability and climate action plans that include strategies to reduce carbon emissions, enhance green spaces, and improve urban resilience. In Europe, the
New Leipzig Charter’s [
42] Green City Dimension emphasizes the transformative potential of cities in addressing climate change challenges and enhancing environmental change. Cities are called to protect and regenerate ecosystems, using nature-based solutions and design, and connect green and blue spaces to ensure access to high-quality and urban environments for all. Finally, one of the thematic axes of the New European Bauhaus (NEB), launched in September 2021, focuses on ‘reconnecting with nature’ to move from a human-centered to a life-centered perspective [
43]. Finally, the European Green Deal recognizes the importance of greening urban areas and promoting sustainable urban mobility, energy efficiency, circular economy practices, and nature-based solutions as part of the overall agenda [
44].
Table 1 summarizes the findings from key global and European territorial and urban development policy documents published recently (i.e., within the last ten years), pointing out the major principles in line with the meta-trends. Such an overview serves to provide the background information for a similar analysis conducted within the case study, i.e., a documentary analysis of multi-scale policy toolkits in Switzerland.
3. Methodology and Data
Examining the extent to which the principles ingrained into the ‘green urban agenda’ have been implemented in a specific case study’s urban design and planning practice demands a three-fold methodological strategy. Firstly, it is necessary to situate the ‘green urban agenda’ narrative into the Swiss context of primary policy toolkits, i.e., to identify the central tenets used to reflect the previously introduced policy trends and associated major principles. Secondly, it is vital to examine green spaces—their provision, types, size, and mutual connectivity—in Zurich’s neighborhoods of Altstetten and Albisrieden. Lastly, informed by the previous step, it is crucial to determine green space attributes and dominant activities within smaller sites, i.e., the so-called green space clusters in the mentioned neighborhoods. The methods used in each analytical step have been presented in the following subsections.
3.1. Situating the ‘Green Urban Agenda’ Narrative in Switzerland
To situate the narrative on ‘green urban agenda’ in Switzerland, a multi-scale documentary analysis was conducted. Firstly, the most important, currently standing, strategic and regulatory documents (federals strategies, federal laws, cantonal structural plans, master plans, and urban strategies) relevant for various territorial scales (federal, cantonal, and municipal) have been identified including: strategic documents at the federal level—
Sustainable Development Strategy 2030 [
50],
Action Plan 2021–2023 for Sustainable Development Strategy 2030 [
51],
Megatrends and Spatial Development in Switzerland [
52],
Trends and Challenges: Figures and Background on the Swiss Spatial Strategy [
53], and
Swiss Spatial Concept [
54]; regulatory documents at the federal level—Planning and Construction Law PBG (2013) [
55], Spatial Planning Law RPG (2019) [
56]; strategic documents at the cantonal level—
Cantonal Structural Plan Zurich 2035 [
57],
Long-term Spatial Development Strategy of Canton Zurich [
58]; and strategic documents at the city level—
Regional Structural Plan [
59],
Communal Structural Plan [
60], and
Strategies Zurich 2035 [
61]. Secondly, the content analysis was conducted, attending to the principles previously identified in the global and European policies (
Section 2). Such an analysis aims to reveal to what extent the globally recognized ‘green urban agenda’ principles have been covered in various national documents.
3.2. Examining Green Spaces in Altstetten and Albisrieden
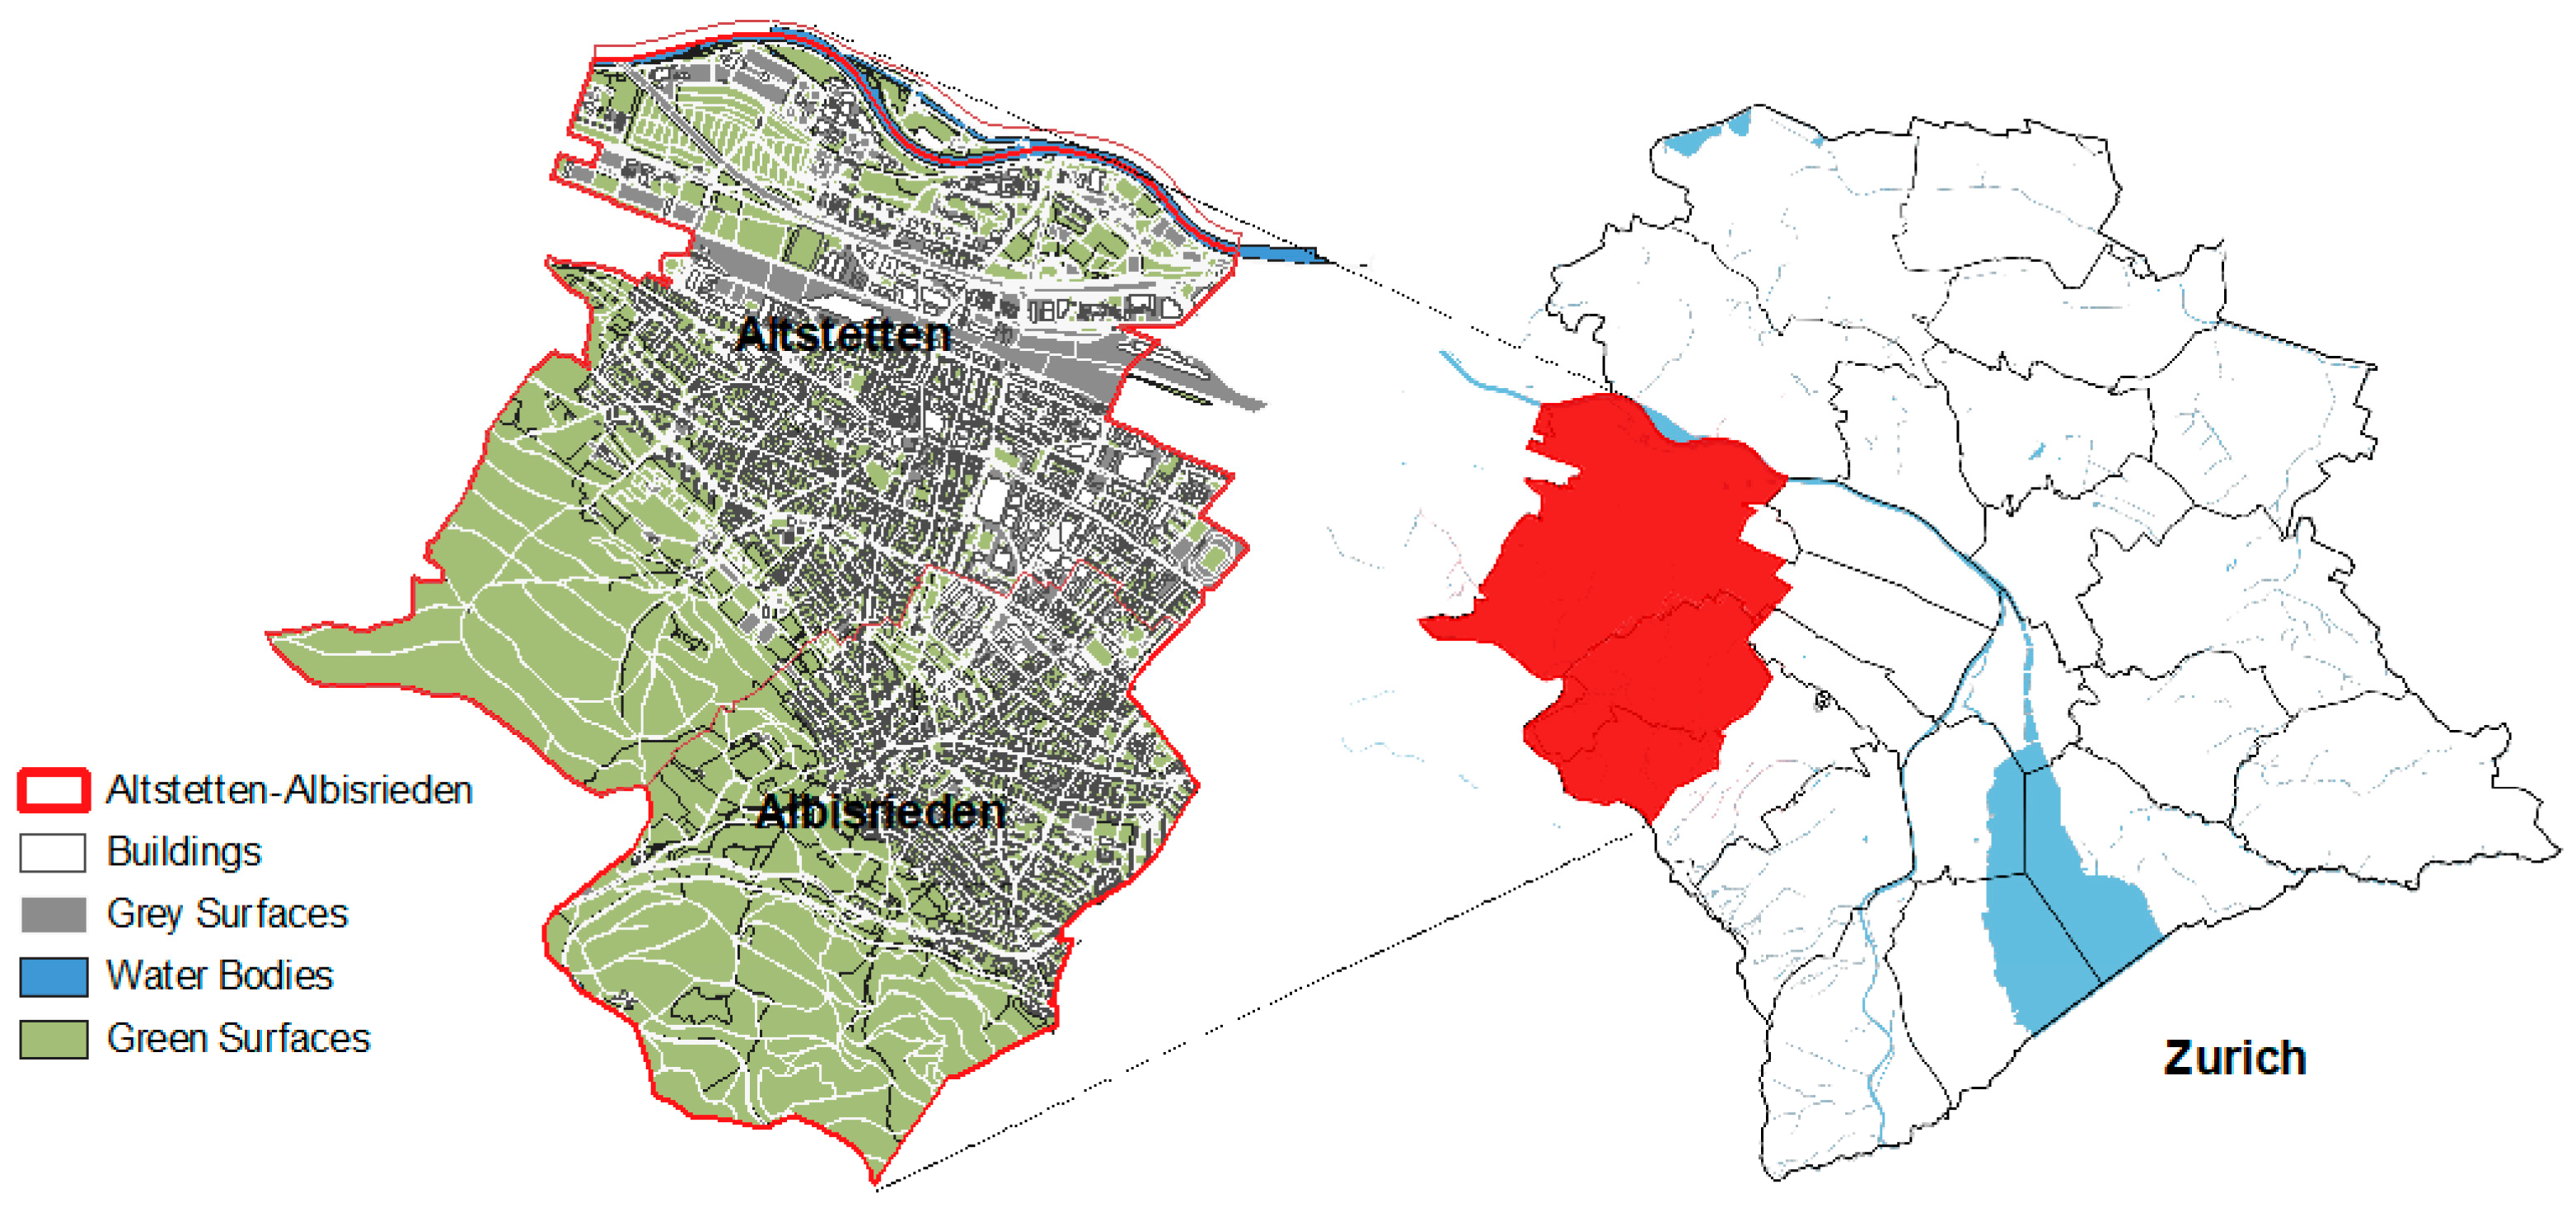
To examine green spaces in Zurich’s neighborhoods of Altstetten and Albisrieden (
Figure 1), a mixed-method approach was applied. Altstetten and Albisrieden have rich sources of greenery due to their natural geographic conditions. The large surface of closed-off woods, intensive agricultural fields, pastures, and residential green areas extend from the hill foot of Uetliberg in the south to the Limmat River in the north. Additionally, Altstetten and Albisrieden showcase building typologies and urban forms of different development ages. Community centers with farmhouses erected at the beginning of the 20th century, single-family houses and multi-family buildings constructed around the 1940s, and cooperative residential projects developed in recent decades generate the diversity of urban fabric and greenery structures crossing the whole district. As a prominent residential district, the demographic composition of Altstetten–Albisrieden represents the overall situation of Zurich in terms of gender and age groups and provides various cultural and economic backgrounds [
62]. To examine green spaces in Altstetten and Albisrieden—their provision, types, size, and mutual connectivity—the following methods were applied.
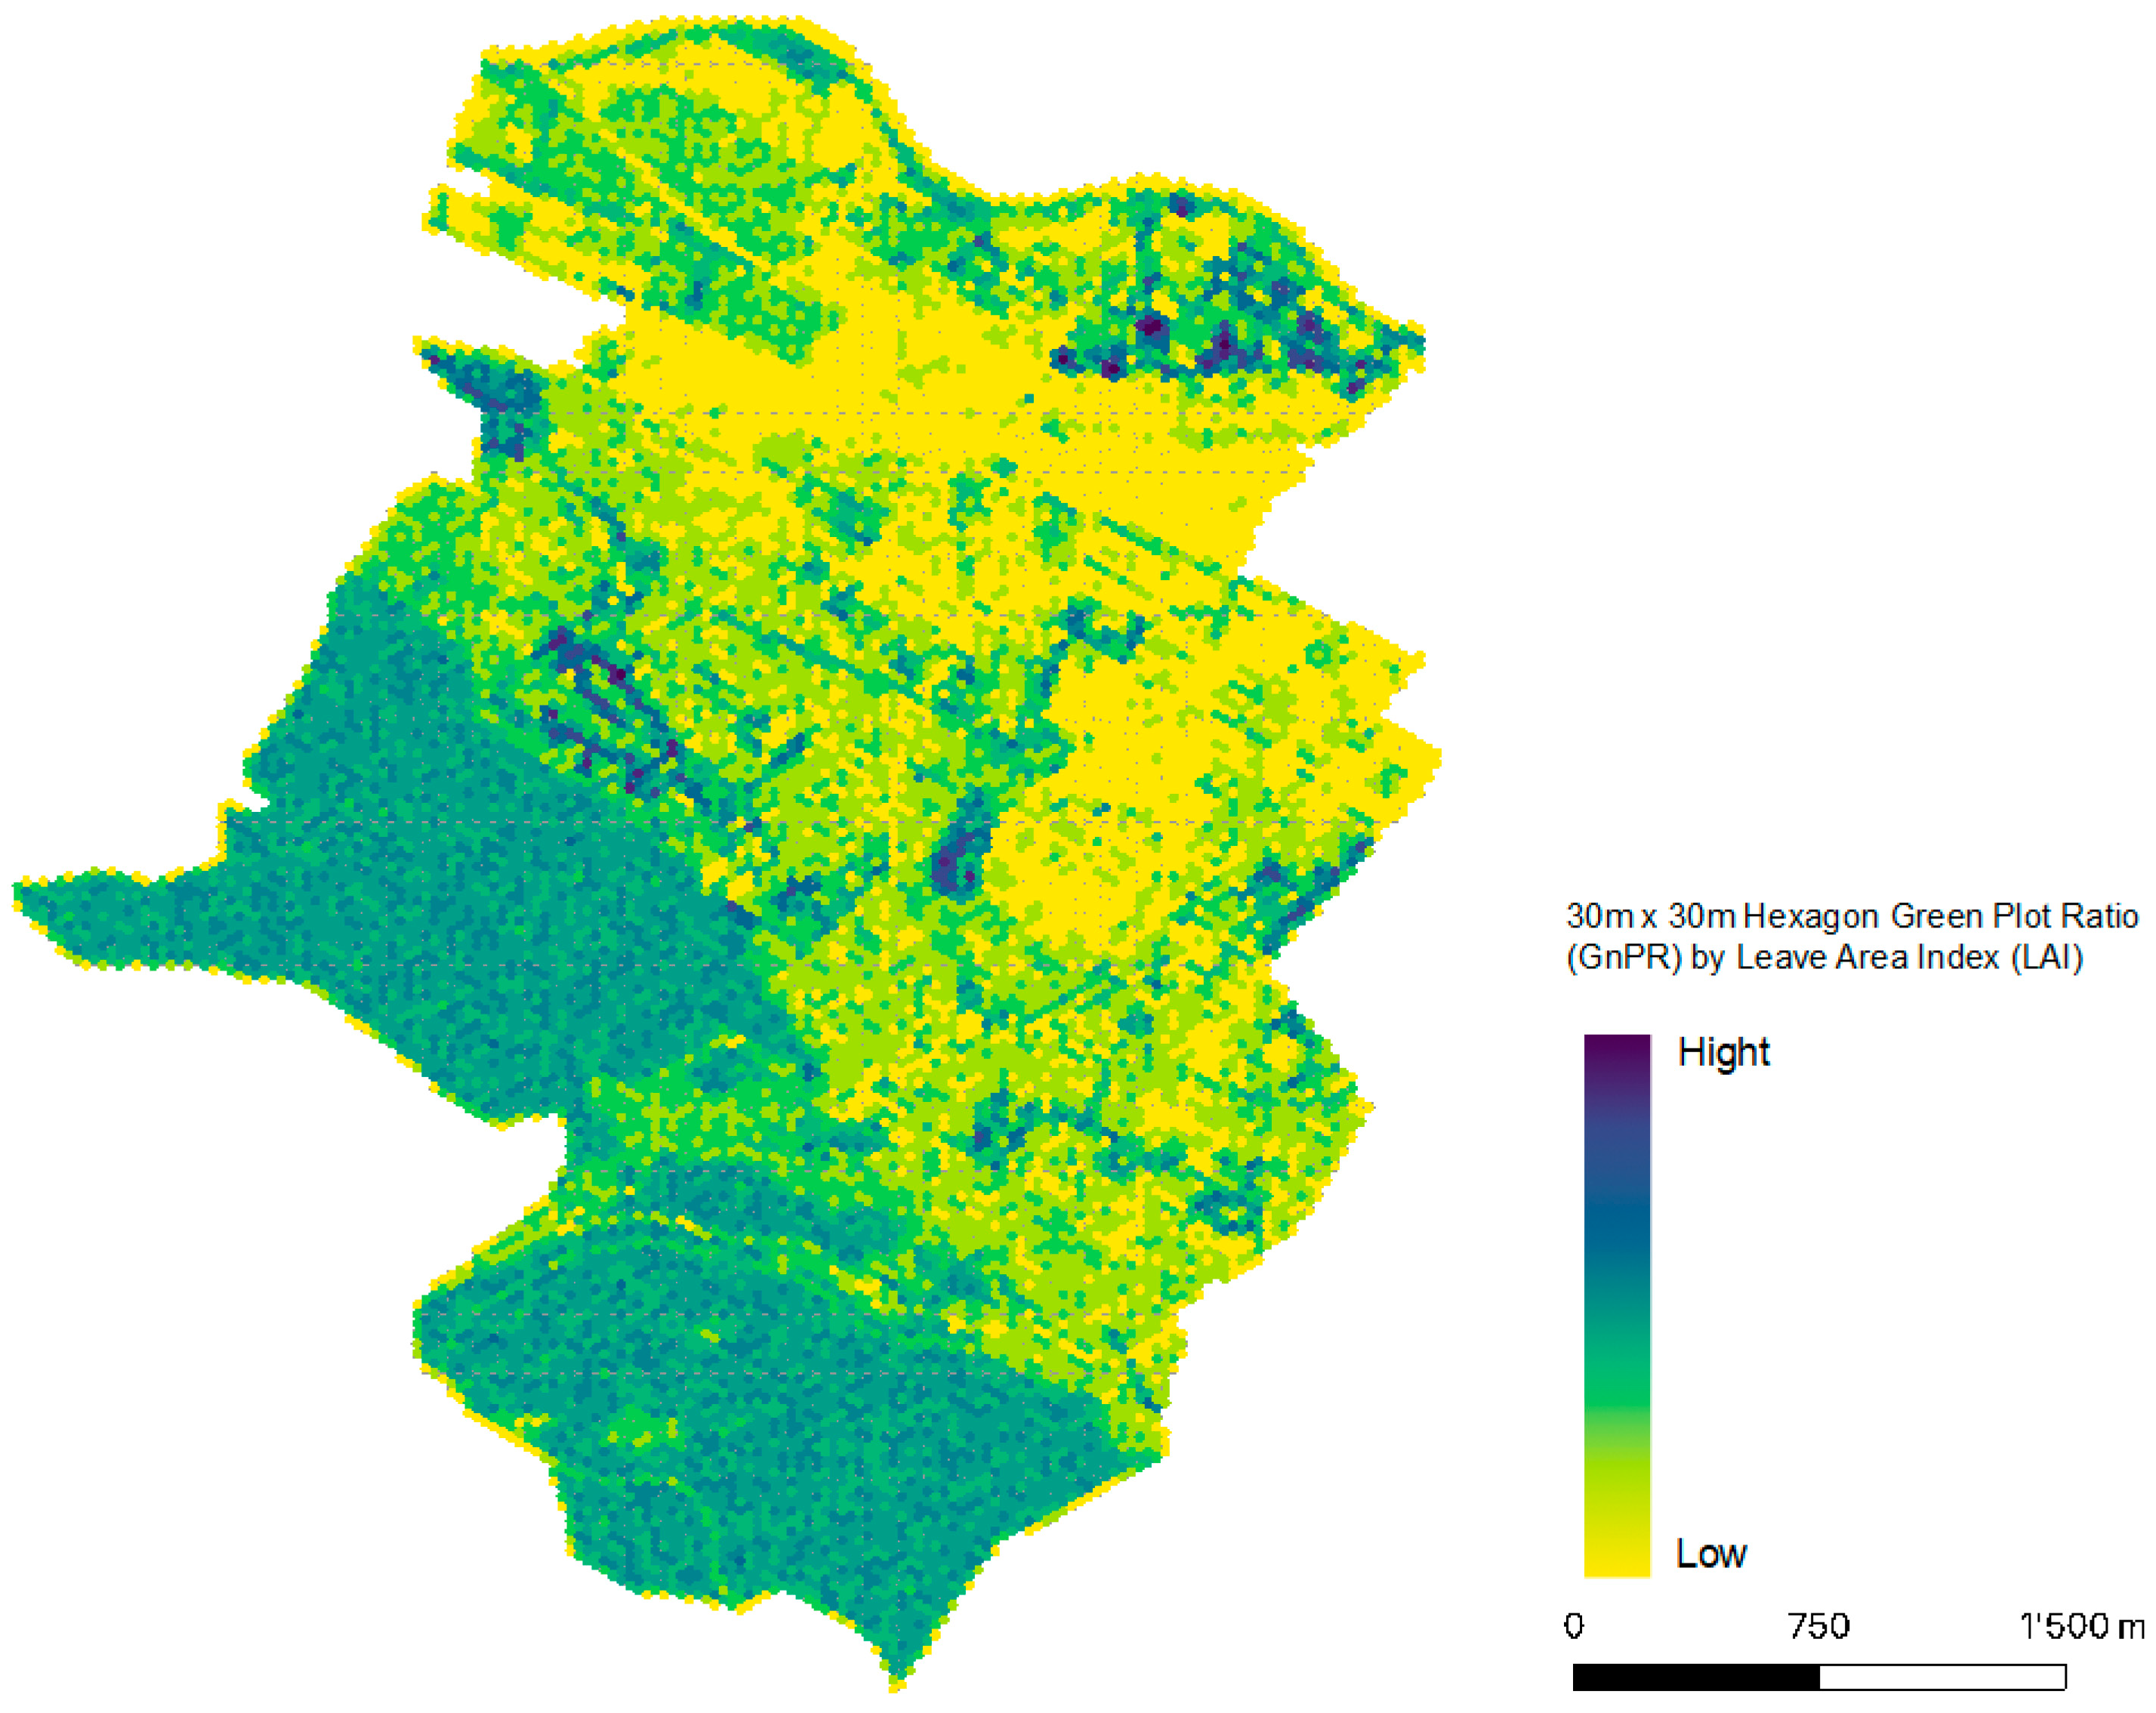
To investigate green space provision, two measurement methods were applied: green surface ratio (GsPR), measuring the physical surface area of green space in each plot and demonstrating the provision of green space on the ground; and green plot ratio (GnPR), calculating three-dimensional greenery volume through Leaf Area Index (LAI), thus, indicating the greenery intensity of the site. Introduced by Dr Boon Lay Ong, the GnPR guides the provision of greenery in an urban setting, an indicator based on the building floor area ratio, demonstrating the intensity of building development. The GnPR estimates a three-dimensional quantification of the greenery of a site through the deployment of a leaf area index (LAI). In this paper, LAI values are introduced from the official documents,
LEAF Assessment self-evaluation form 2016, by National Parks of Singapore (NParks):
https://www.nparks.gov.sg/florafaunaweb (accessed on 15 July 2023). LAI values vary among plant types according to canopy shapes, density, plant structure, and measuring methods (
Table 2). This study deployed the general LAI values suggested by the National Parks of Singapore (NParks) as follows:
To classify green space, the geographic information on green space types from the open-source data of the City of Zurich, specifically Open Street Map of Zurich, was used. Accordingly, the green spaces in Zurich were classified into eleven types based on three primary parameters: (1) the types of ground and flora, including forests, meadows, and swamps; (2) the functions served, such as agricultural fields, sports fields, and cemeteries; and (3) the locations, including street greenery and greenery surrounding residential facilities. Two additional parameters, ownership and accessibility, were incorporated, verified through on-site observation and archival reading. As a result, green spaces were categorized into four main types: (1) public green spaces—owned and maintained by the city and accessible without restrictions; (2) community green spaces—the areas within neighborhood settlements shared and maintained by a particular community; (3) private green spaces—gardens belonging to individual households accessible only to household members or guests; and (4) other reserved green spaces—the areas restored for some particular use and functions. Some sub-groups were defined by management (for public green spaces) and function (for private and reserved green spaces).
To determine connectivity among various green spaces, the distance matrices and nearest-neighborhood tools in QGIS within an 800-m radius were applied, based on two preliminary findings of a pre-observation study in the whole district. Notably, in the SDG Indicator 11.7.1 Training Module: Public Space, public open space is categorized based on size and coverage area. The training module defines the service coverage radius for city public open spaces as 800 m and neighborhood green spaces as 400 m [
63]. The tool further applies the Nearest Neighbor Index which express the ratio of the Observed Mean Distance to the Expected Mean Distance, where the expected distance is the average distance between neighbors in a hypothetical random distribution. These findings brought to the following premises applied in the study: (1) when illustrating space service coverage and connectivity, the study applied 800-m (a 10-min walk) and 400-m (a 5-min walk) radii to identify valuable connections and the area of subsite cases; (2) as people rarely moved between community and private green spaces, space users’ paths between the three green spaces were usually public-public, public-community, and public-private.
The calculation of the connectivity counted pedestrian paths towards public green spaces at three levels: from main entrances of buildings (including private green spaces) to public green spaces within the 800-m walk distance; from community green spaces to public green spaces within the 800-m walk distance; and between public green spaces within the 800-m walk distance. These paths were accumulated and demonstrated the significance of each public green space in the urban fabric of the district.
3.3. Identifying Green Space Clusters in Altstetten and Albisrieden
Informed by the previous analysis and to select representative green space clusters, the study applied a 400-m (a 5-min walk) radius to identify valuable connections and the area of subsite cases. To analyze the use of space (i.e., dominant activities), on-site observation in the four clusters were applied. Each cluster was divided into 2–3 parts to set up spots for non-participant observation. Observed activities were recorded and marked as point features in QGIS, including detailed information, such as start time and end time, activity types, interactions with others, users’ gender, and their approximate age groups. Photos and videos were used as supplements during the observation for data validation and recording of some activities.
The details of space users were transformed into variables associated with dominant activities in specific green space clusters, as shown in
Table 3. The observation covered all public green spaces, including areas with playgrounds or exercise facilities, as well as most community green spaces in the four cluster cases. However, due to restrictions on access permits and privacy concerns, activities in most private green spaces could not be observed. The observation periods were from 14:00 to 18:30 on two typical weekdays (Tuesday, Wednesday, or Thursday) and Sundays, chosen to ensure similar weather conditions and outdoor temperatures. The observation was conducted in the early summer of 2022, spanning two weeks, and was repeated for another two weeks in the early autumn of 2022.
4. The ‘Green Urban Agenda’ in Zurich: A Multi-Level Analysis
The following section presents the results of the analysis conducted at three levels: (1) policy analysis to identify the critical tenets associated with the ‘green urban agenda’ covering a range of policy documents at different scales (federal, cantonal, and local), with a particular outlook on the case of Zurich, (2) analysis of green space in Zurich’s district 9 (Alstetten and Albisrieden) to determine their provision, types, size, and mutual connectivity, and (3) analysis of green space in the selected clusters of the mentioned district to identify the main activities.
4.1. Situating the ‘Green Urban Agenda’ Narrative in Switzerland
As informed by the policy analysis at the global scale (provided in
Section 2), the analysis of the core, standing strategic, and regulatory documents in Switzerland through the lens of the ‘green urban agenda’ is presented in
Table 4.
The principles such as urban greening, combining high density areas with open spaces, protection of natural areas, and preservation of open and recreation spaces are spread across the range of the Swiss policies, including both strategic and regulatory instruments. Looking more closely to the local (city of Zurich) level, the following principles promote the development and protection of green spaces and their attributes:
Preservation of city nature: This principle emphasizes the protection and conservation of natural elements within urban environments, including green spaces, urban forests, and water bodies. It aims to maintain and enhance biodiversity, ecosystem services, and the overall ecological health of the city.
High-quality open public spaces: This principle focuses on creating and maintaining high-quality open public spaces such as parks, plazas, and recreational areas. It recognizes the importance of providing accessible and well-designed spaces for social interaction, recreation, and ecological functions.
‘Kurze Wege’ (short distances): This principle promotes the idea of compact and connected urban environments where essential services, amenities, and facilities, as well as green spaces, are within short distances from residential areas. It aims to reduce the need for long-distance travel and promote walkability, cycling, and public transportation.
Garden city: This principle draws inspiration from the Garden City movement, which promotes the integration of green spaces, landscaping, and planned garden areas. It also aims to create balanced and sustainable communities that combine urban living with the benefits of nature and open spaces.
Social inclusion coupled with natural preservation: This principle promotes the balance between the needs of the community and the enhancement of the natural environment, considering social equity, cultural diversity, and improving the quality of life as essential measures to boost the immaterial green space attributes.
These principles will be tested in the empirical case (the district 9 and four clusters within the district), through the concrete attributes, such as provision, type, size, and connectivity—as presented in
Section 4.2, and main activities—as presented in
Section 4.3.
4.2. Examining Green Spaces in Altstetten and Albisrieden
This subsection presents the results of the analysis of green spaces in Alstetten and Albisrieden, looking into their provision, type, size, and connectivity.
Using the previous classification of green spaces (as introduced in the methodological section),
Table 5 indicates four types of green spaces, their main subtypes, and their size, as identified in the neighborhoods mentioned above.
The richness of green spaces in Altstetten and Albisrieden aligns with the urban development concept of a Garden City promoted since the beginning of the last century [
64]. This richness has been demonstrated from three perspectives. As shown in the table above, considering that the entire area covered by district 9 is 12,068,034 m
2, it means that green areas of various types occupy almost 62 percent (7,419,503 m
2) of the entire district’s areas. The total resident population in the district amounts to 57,077 inhabitants [
62]. On average, residents of Altstetten and Albisrieden can access more than 40 m
2 of green spaces. Besides 7.90 m
2 of collective spaces, such as parks, gardens, sports fields and traffic greenery, each resident can access more than 32 m
2 of green spaces near their houses for daily use. Except for intensively built industrial and commercial zones, development projects usually contribute more than 40 percent of their site to greenery (GsPR > 40%) (
Figure 2). Given Leaf Area Index (LAI) as a factor to indicate the intensity of greenery, dense greenery extends and covers the whole residential area (
Figure 3). Public utilities, such as city parks, schools, and sports fields, are critical in providing high-quality greenery in the urban area.
In terms of connectivity between the green spaces in Altstetten and Albisrieden, public green spaces are spread over the district so that residents can access at least one of these places within a ten-minute walk. People usually visit public green spaces on foot and rarely use community gardens in other neighborhoods. However, each community garden is equipped with similar facilities and furniture. As shown in
Figure 4, each centroid on the map symbolizes individual public green spaces. The range of colors, progressing from yellow to dark green, indicates the varying accumulated number of pedestrian paths to each centroid, ranging from fewer to greater connections. The black lines abstract the connections between public green spaces within an 800-m walking distance.
4.3. Identifying Green Space Clusters in Altstetten and Albisrieden
Based on the previous analysis, the collective paths leading to public green spaces highlight the significance of each space in the overall spatial arrangement of the urban area. Notably, public green spaces located in the central part of the district exhibit a higher number of connections, indicating the presence of four distinct clusters of green spaces with greater importance. Each cluster, namely Grünau, Lindenplatz, Bachwiesen, and Süsslerenanlage, has one or more public green spaces in the center. Combined with physical boundaries, such as streets and property fences, these clusters and their 400-m coverage areas shaped four cases (
Figure 5) for further study of the activities within these areas.
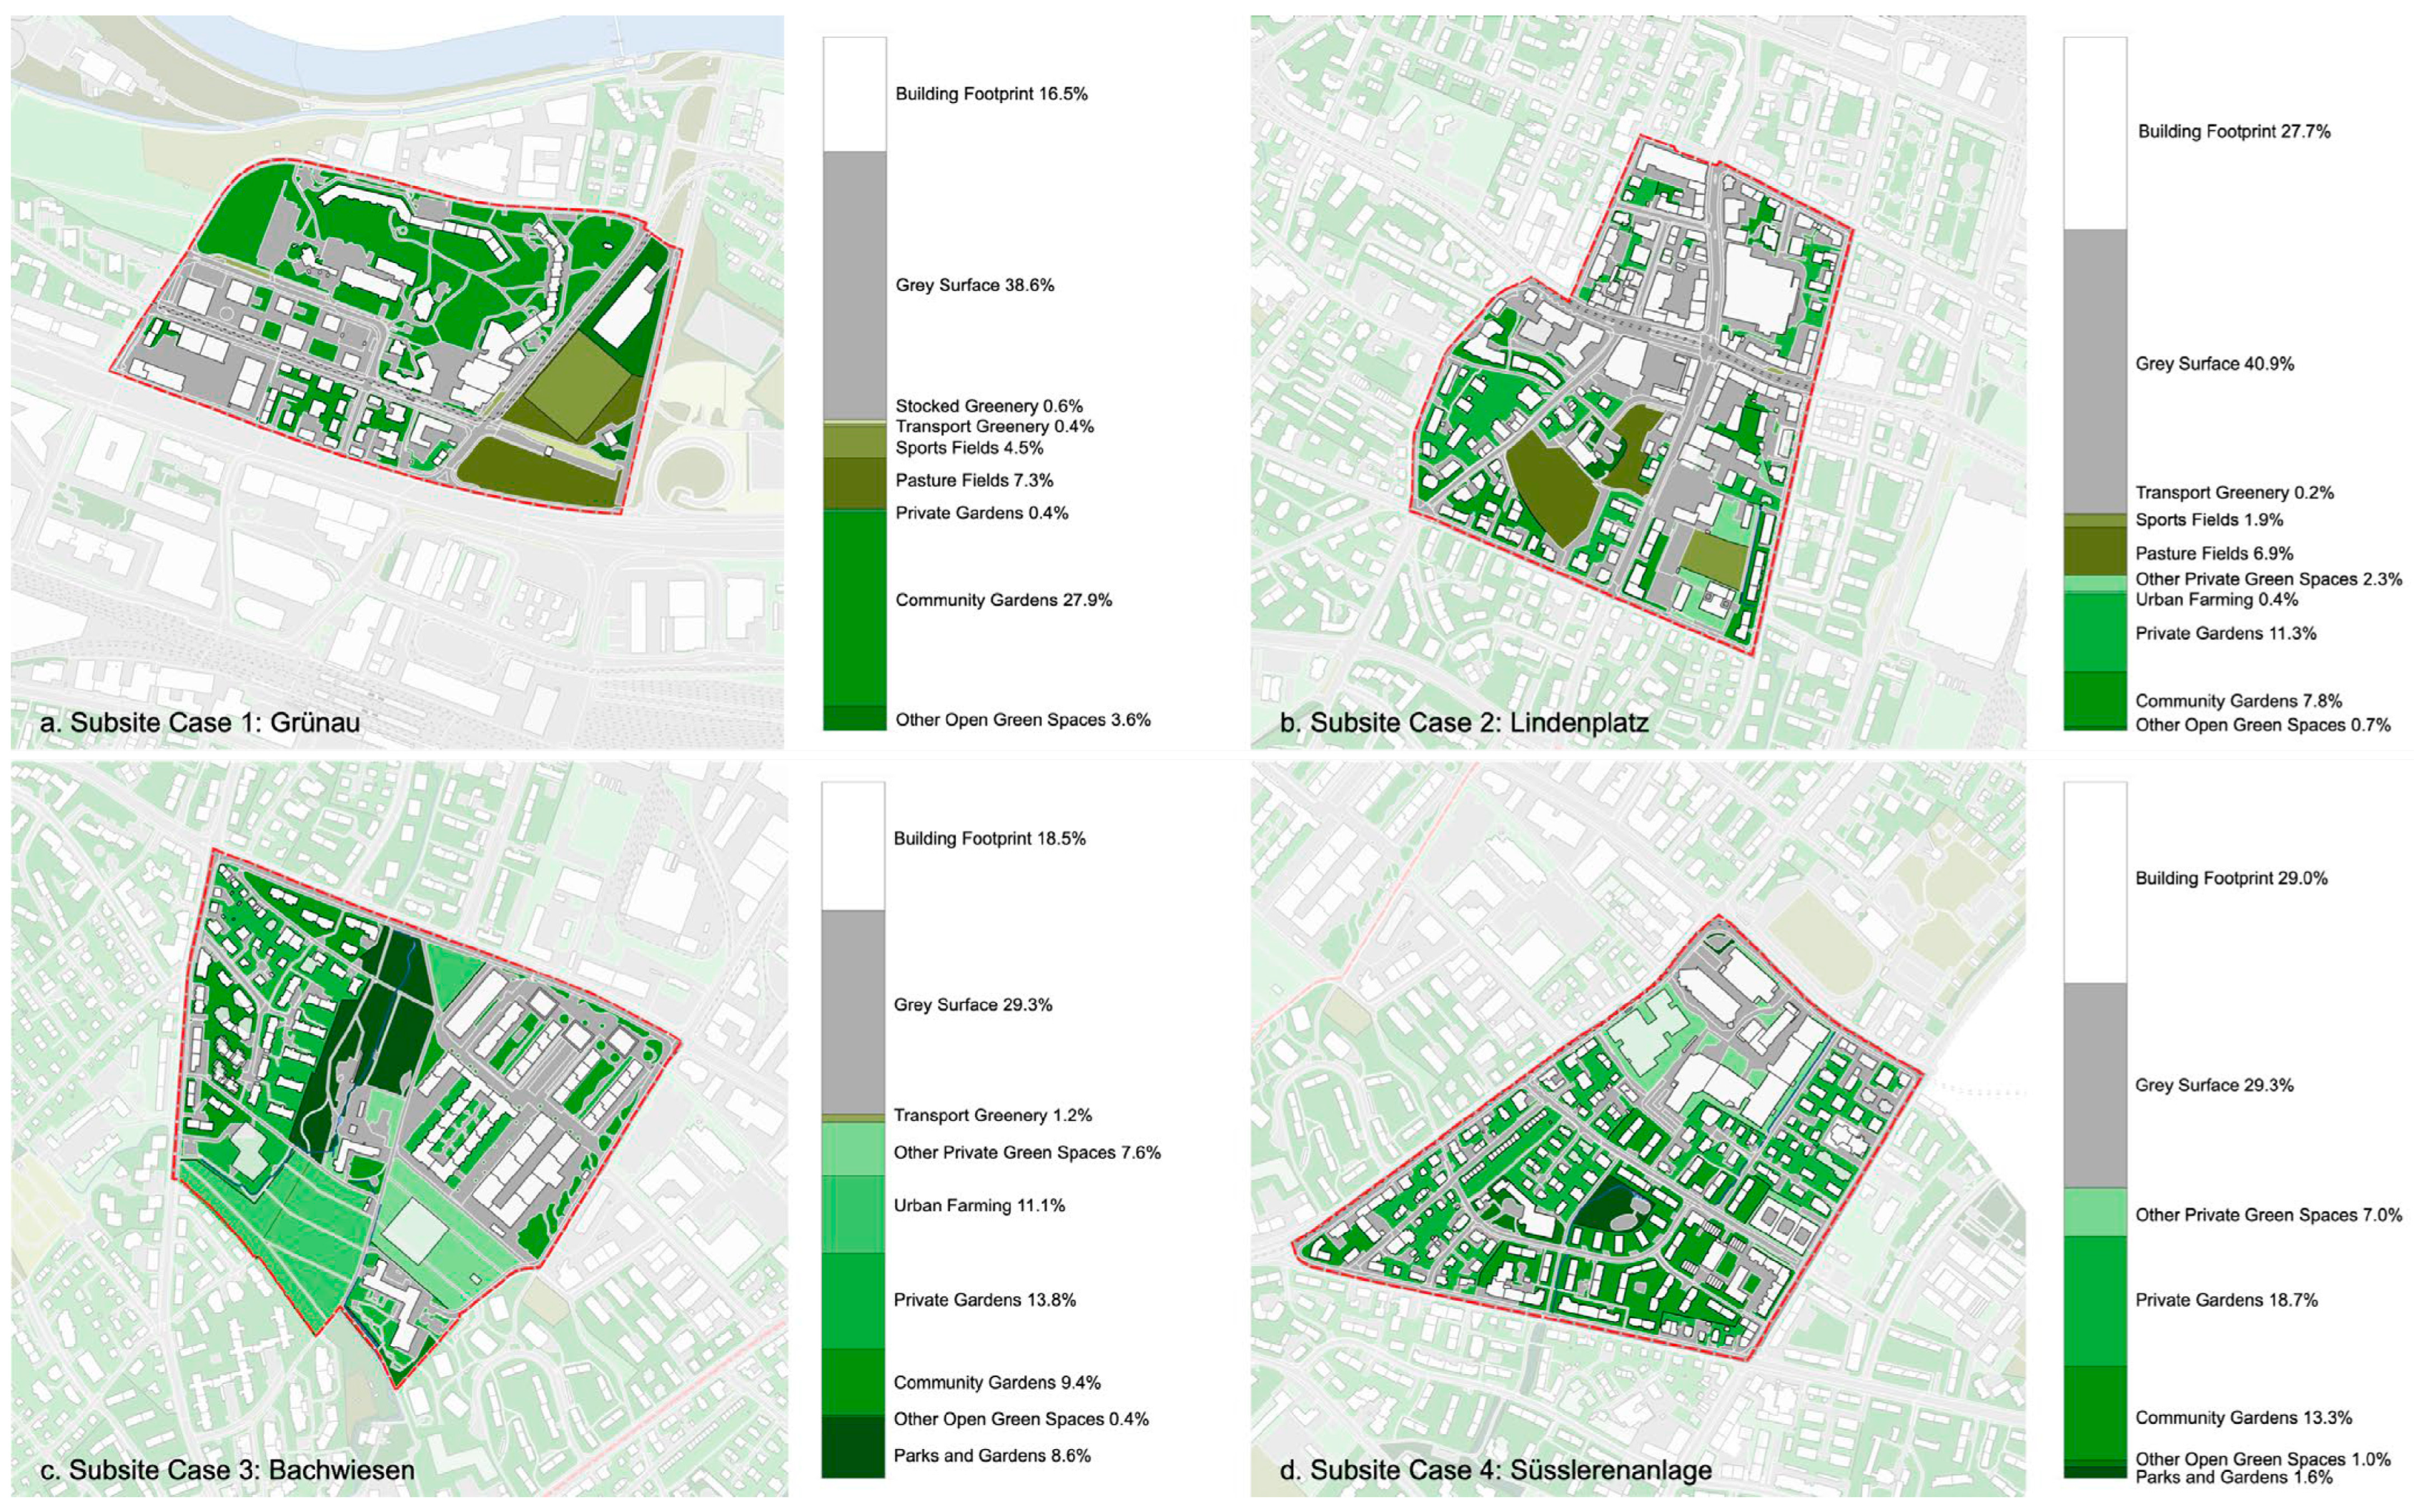
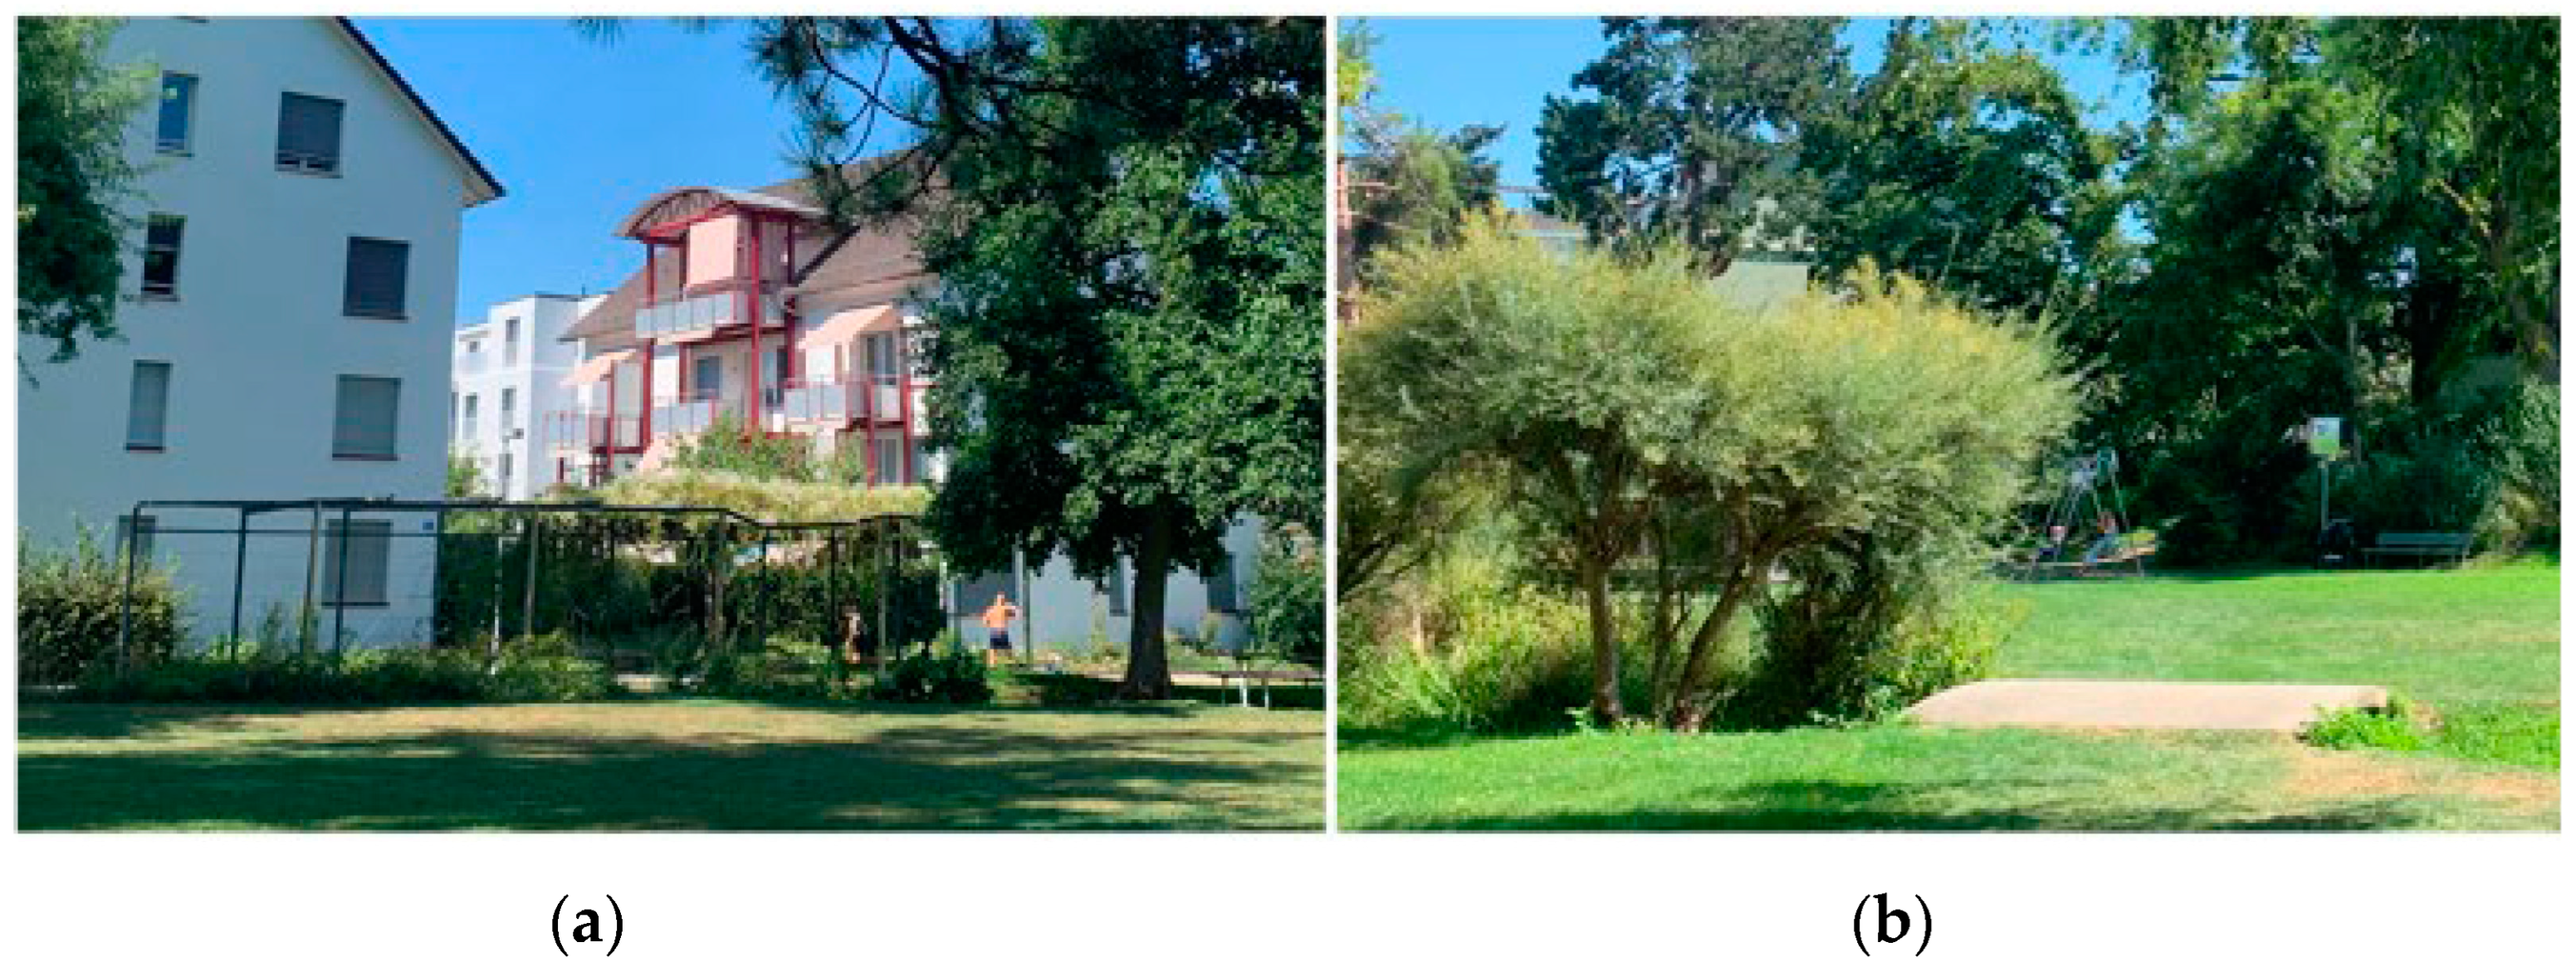
Grünau (
Figure 6a) is located near the intersection between Europabrücke and the A1H Motorway and is close to the Limmat River. The area covers a large cooperative housing project called Grünau, a recent housing development, multi-family residential buildings, and public utilities, such as a primary school, nursing house, and commercial facilities. The green spaces in the area consist of the community garden of Grünau, some public open green spaces, and a football field covering a surface of about 8 hectares, as indicated in
Table 6.
Lindenplatz (
Figure 6b) has served as a cultural and commercial hub in Altstetten since the 1910s. This area encompasses retail establishments and residential buildings spanning up to six floors. Positioned in the central part of the area is a public square with paved surfaces, adorned with trees, and a spacious meadow near the Altstetten church is adjacent to it. A significant portion of the area’s greenery is attributed to a substantial field situated across from the original community hall. Additionally, there are smaller green patches, including secluded courtyards, community gardens, and private gardens, scattered around the periphery of the area covering a surface of about 4 hectares.
Bachwiesen (
Figure 6c) contains the unique city park, Bachwiesenpark, and the green corridor linking the administrative zones of Altstetten and Albisrieden in the center covering a surface of about 4.5 hectares. The area also covers one of the most significant high-density residential areas, Freilager, a multi-family housing neighborhood, and some urban farming fields. One-third of the green surfaces are used privately by communities or individual households.
Süsslerenanlage (
Figure 6d) is located in the middle of Albisrieden. The urban fabric of the area is characterized by single-family houses, detached houses, and low-rise multi-family buildings. Nestled amidst these residential structures, there is a relatively small public garden located adjacent to the Neue Kirche (New Church) of Albisrieden covering a surface of about 3 hectares. The majority of the green spaces in the area are comprised of community and private gardens, which often take the form of enclosed courtyards.
Activities in the Four Cluster Areas of Green Space
When applying the previously introduced pattern of variables associated with dominant activities in four green space clusters, the following findings were derived (
Table 6).
Table 6 indicates the overall similarity between the clusters observed. In all the clusters, green spaces are larger than grey surfaces, except in Bachwiesen, where the grey surface is slightly larger. The distances to the buildings across clusters are similar, ranging slightly below 200 m, while only in Bachwiesen that distance amounts to ca. 215 m. In general, activities last 80 min in the observed areas, whereas in Grünau and Bachwiesen, people tend to stay half an hour longer than the other two clusters. Gender difference among space users is insignificant. The dominant users across clusters are mainly adults (30–60 years old) and children younger than ten, except in Lindenplatz, where adults are dominant users (61%). Across all the observed clusters, more than 90 percent of space users enjoy green spaces with their families or friends, and a larger group of solo users (21%) is identified only in Lindenplatz. Swiss citizens contribute to over two-thirds, while people with various cultural backgrounds compose the rest of the observed population.
The main activities identified across the clusters are the following eight activities: resting, chatting, gathering (e.g., organizing events), playing, walking, walking dogs, exercising, and cycling. Their distribution (the total of 1113 activities observed) across the clusters and per activity is indicated in
Table 7. A more specific description of the activities identified in each cluster is given below.
In Grünau, casual football games and family gatherings around a high-rise residential tower dominate the space, while some short playing activities are scattered across some playgrounds around the case area (
Figure 7a). Neighbors crossing an extensive age range gather to play football with children, chat with each other, or celebrate birthdays and similar family events (
Figure 7b). Due to the high international profile of the Grünau neighborhood, cultural and social diversity prevail in the cluster, too.
Lindenplatz hosts many leisure and commercial activities due to its vital role in the district (
Figure 8a). Cafetieres, restaurants, and shops attract people to stay for a rest, one hour on average. Youths prefer chatting, reading, or practicing music on the lawn next to the church for the whole afternoon. On Saturday mornings, local farmers and food producers hold a free market on the square (
Figure 8b). The highest diversity of users is perceived in the open public (square) and green (park) spaces, while the community gardens accommodate mostly the local population.
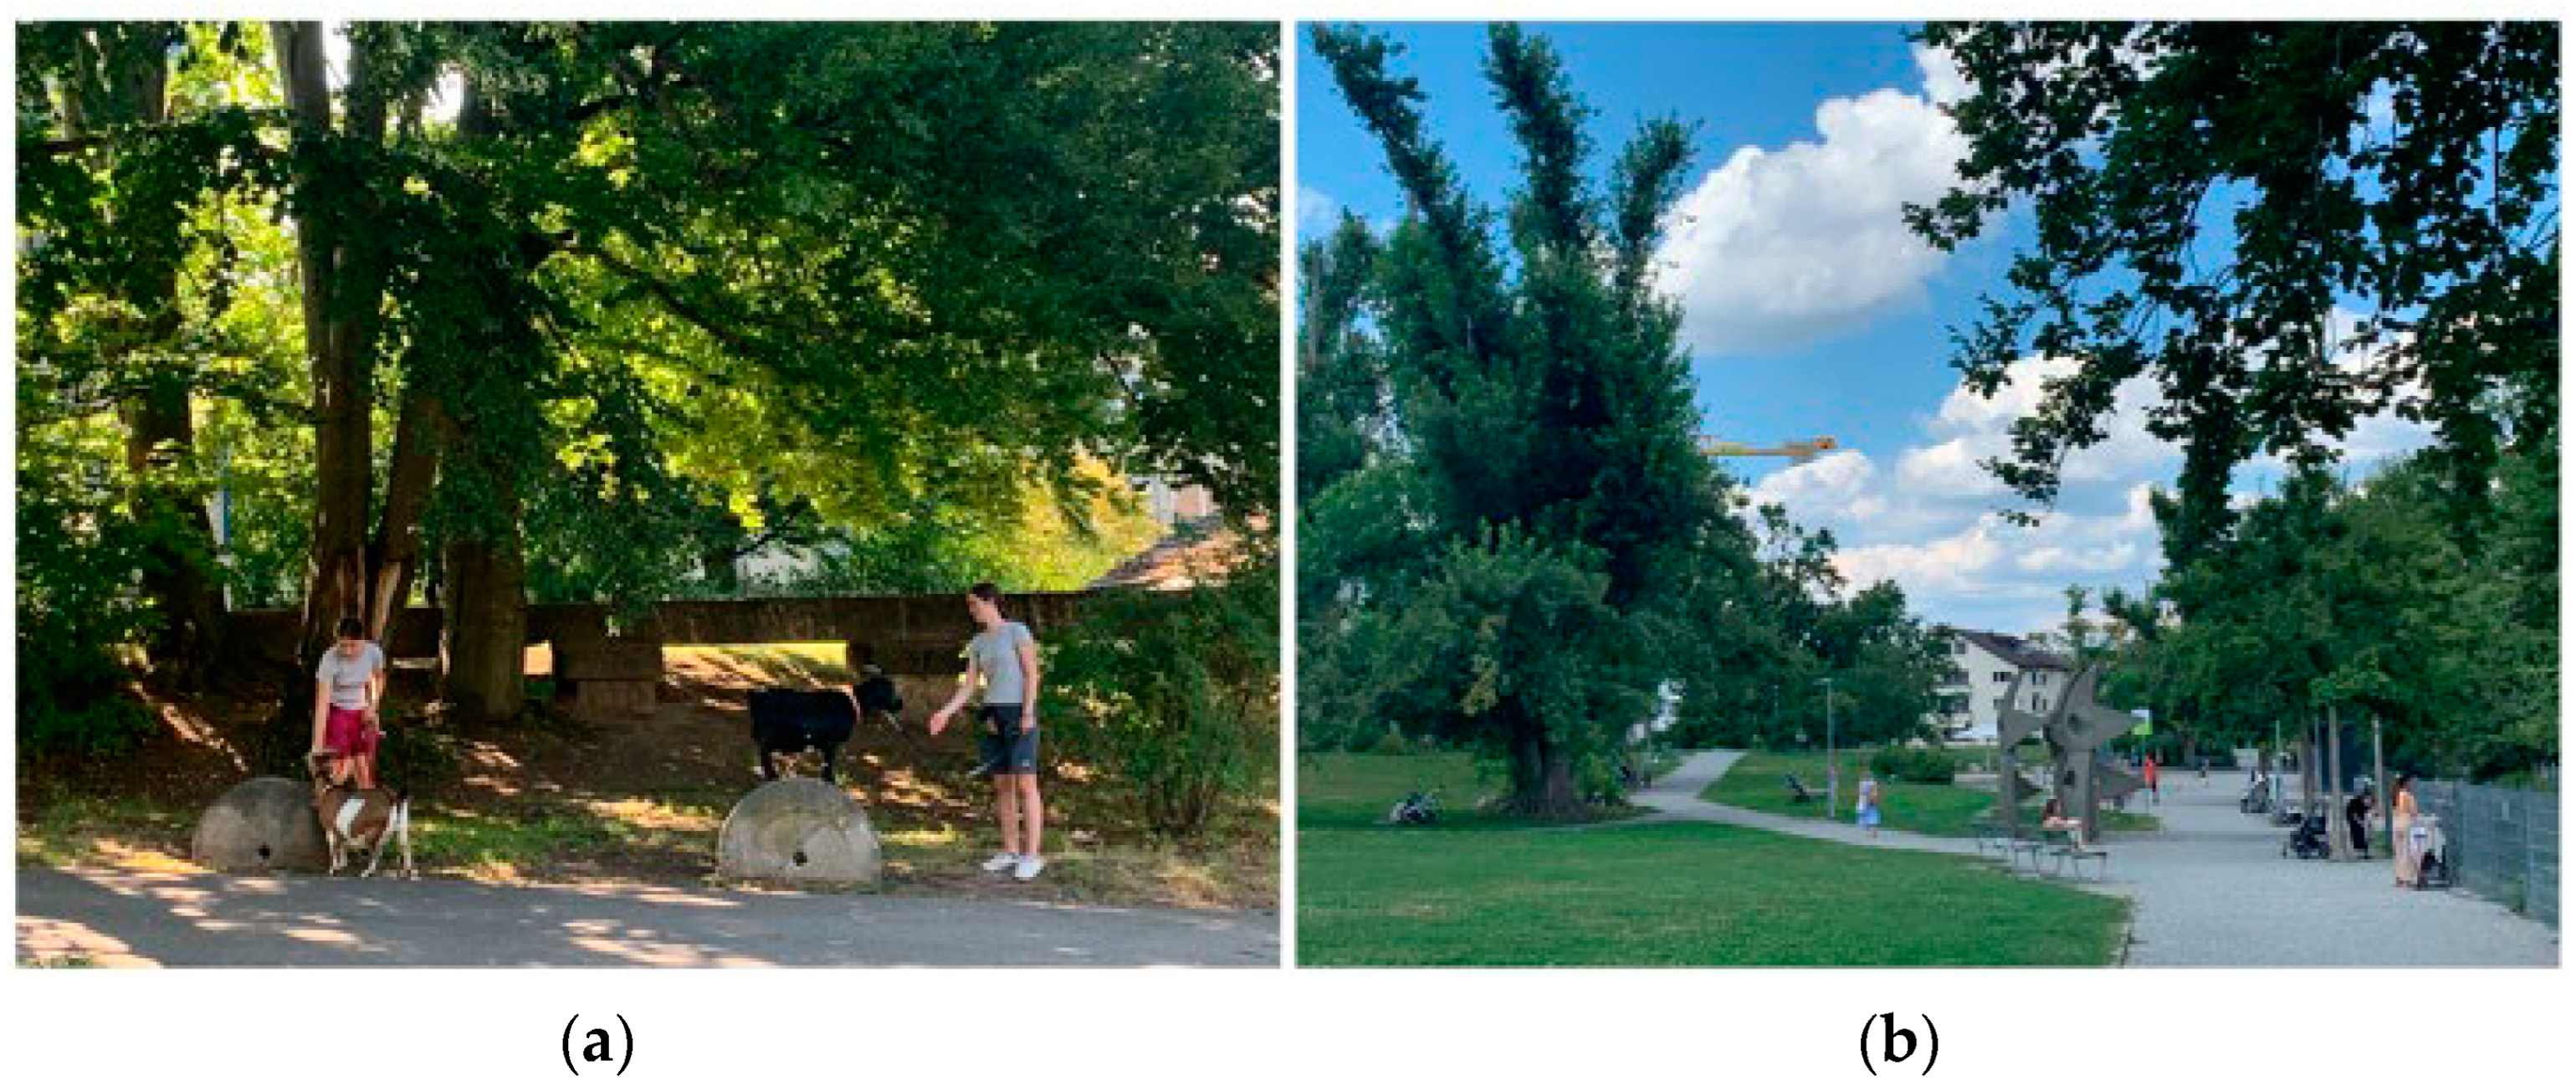
In Bachwiesen, surrounded by several residential and one industrial zone, green space activities are concentrated in Bachwiesen Park (
Figure 9a) and open spaces in the Freilager residential area, with more activities observed on weekdays than at the weekend. Large and various green space types (e.g., the park with meadows, playgrounds, a bird park, the community zoo, and the community club, connected by paths, bushes, and creeks; the Freilager area with the cycling and scooter paths and tennis courts) supported diverse activities for different ages, including also resting, suntanning, yoga, family gatherings, playing, and cycling (
Figure 9b). Most people come to the area with their families. Bachwiesen is open to local residents and visitors from other parts of the city, hosting the highest percentage of internationals.
In Süsslerenanlage, the size and type of green spaces differ from the other clusters due to the highest percentage of private gardens among green spaces. As a result, the entire area exhibits a tranquil and peaceful atmosphere, with a few individuals utilizing the public green spaces and spending less than an hour on average within these areas (
Figure 10a). On-site observation of activities and interactions shows that users of these spaces are mostly acquaintances, and there is limited promotion of cultural diversity. The local language, Swiss German, dominated in almost all observed activities, while speaking in foreign languages tends to attract attention from the balconies and windows facing the green spaces. Young children use public green spaces more than adults (
Figure 10b).
5. Discussion: The ‘Green Urban Agenda’ in Zurich—A Policy Proclamation or Real Implementation?
As introduced in
Section 4.1, five main policy priorities can generally be grouped into three comprehensive groups. The first one covers the overall attitude towards natural environments; the second one covers the aspects related to the physical structure of green spaces (their size, main ecological features, equipment, design, and connectivity); the last group emphasizes the social dimension of the ‘green urban agenda’, i.e., how green spaces are used and by whom, highlighting the balance between urban lifestyles and natural environments. The following section critically discusses how the results from the quantitative and qualitative analysis of size, uses, connectivity, and activities within the four sites provide insights on the uptake of the five policy priorities for a ‘green urban agenda’.
Preservation of city nature. Although this study does not engage with an in-depth analysis of the ecological quality or biodiversity of the sites, the application of this principle is starkly evidenced in the entire district 9. Namely, the area covered by Altstetten and Albisrieden has two natural borders: one of four Zurich’s hills—Uetliberg, stretches on the south side, while the Limmat River makes the natural border to the district on the northern side. The proximity of natural environments to urban areas can create opportunities to protect biodiversity and ecosystem services. Looking more closely, Bachwiesenpark represents an excellent counterbalance to the densely built residential area of Freilager. Overall, many activities in observed green clusters, which are not considered famous for their attractiveness in the broader city area, indicate the generally strong bond of people to the natural environments, which may drive sustainable behavior and cooperation that contribute to the quality of green spaces.
High-quality open public spaces. The case study area and, particularly, four cluster green spaces indicate a wide variety of green areas within the observation perimeter. Public green spaces and community green spaces usually provide accessible and well-designed areas for diverse types of activities—from areas for relaxation to playgrounds. The variety and good quality of public equipment are particularly evidenced in the case of the Bachwiesen area, which contains the park (Bachwiesenpark), a large residential area (multi-family housing), and extensive community gardens. In contrast, Grünau, the cluster with the vast community garden (covering almost 30 percent of the entire green areas in the cluster), is equipped with facilities serving for the smooth organization of events in open areas, yet lacks well-designed and well-connected playgrounds. Namely, four playgrounds situated in Grünau at considerable distances from each other do not lead to an increased attraction of children or equitable distribution of users. Instead, one playground remains crowded, while the other three experience infrequent usage. The clusters with a higher percentage of private gardens (e.g., Lindenplatz and Süsslerenanlage) are characterized by less well-designed community gardens and public green spaces, although these spaces are mainly used for playing by younger generations. Activities that demand more active human engagement (walking, cycling, exercising) are not well-represented in any of the four areas except in Bachwiesen, suggesting that all other clusters may have to be better equipped with the appropriate facilities and surfaces (e.g., turf) specifically designed for the mentioned activities. The urban design, streetscape, the presence and distribution of infrastructure and services, the quality of the public realm, and access to retail areas heavily influence the quality, accessibility, and use of green spaces.
‘Kurze Wege’ (short distances). Observed through the lens of green spaces, the entire district area shows a satisfying implementation of the ‘short distances’ and ‘green corridors’ principles. This is particularly evident in the central district’s area, with the highest connectivity rate among various green areas. City parks and other public green spaces are strategically distributed across the district, ensuring that residents can reach at least one such space within a ten-minute walking distance. Looking more closely at the four cluster areas, the average distance from any building to the closest green space is 200 m (taking approximately two minutes), which is considered excellent accessibility to green space.
Garden city. As previously mentioned, the neighborhoods of Altstetten and Albisrieden were designed as part of the ‘Garden City’ concept in Greater Zurich, and this concept is still evident in two aspects. Firstly, an overview of green space provision in the district reveals that the average green space area per resident is significantly higher compared to other districts in Zurich, excluding private forests, agricultural fields, and urban farming areas, as according to the Zurich statistical data: Green Space per Inhabitant in the City of Zurich in 2018,
https://www.statista.com/statistics/860599/green-areas-per-inhabitant-in-zurich-in-switzerland/ (accessed on 15 July 2023). Secondly, the connectivity analysis of public green spaces considers the accumulated connections towards community gardens, private gardens, and individual buildings. The variation in connections suggests that the significance of each green space, as shown in
Figure 4, does not necessarily align with the size of specific green areas depicted in
Figure 11. This disconnection between space significance and its size may explain why some public green spaces struggle to attract visitors. Some spaces may be large and underused, such as Grünau, which is also situated near riverbanks, a sports center, and a motorway, while others may be too small to adequately serve nearby residents. A well-thought-out plan that takes into account the size and location of green spaces within the urban structure is essential to fully utilize their potential.
- 5.
Social inclusion coupled with natural preservation. Social equity and cultural diversity across observed green space clusters vary. For example, Bachwiesen has unequivocal boundaries between adjacent properties while remarkably accepting cultural diversity. Hearing more than ten foreign languages is usual, and this is significantly higher than in the other clusters. One of the reasons for such diversity may be that Freilager (a sizeable residential zone in Bachwiesen) brought many international residents to the area. The social diversity of Bachwiesen is also reflected in various activities across the site. Such a combination of green and grey spaces enables almost all outdoor activities, fulfils many visitors’ needs, and, ultimately, contributes to the balance between urban lifestyles and natural environments. In Grünau, as a highly international area too, cultural diversity is evident, but the atmosphere differs from that of the Bachwiesen area—a variety of different ethnic groups is perceivable; however, their integration or using green space except for family gatherings is rare. In Lindenplatz, the square and park are vivid and full of diverse users, mainly on weekends. The Süsslerenanlage cluster faces the lowest cultural and social diversity, as individual housing and private gardens in traditional communities are considered a specific place value.
In a nutshell, the residents in the observed clusters enjoy their environment and appreciate spending time in nature. Furthermore, observed from the perspective of material green space attributes, the green areas in the vicinity of the new residential zones have recently undergone significant improvements to accommodate various needs and activities of different users. In other clusters, it is necessary to better acknowledge the usual residential behaviors and visitors’ needs and improve the quality and connectivity among the green spaces. Finally, greater social diversity is expected in many community gardens, which can serve as a building block for creating a community’s identity and where people should be invited to develop a sense of belonging to specific neighborhoods.
6. Conclusions
By focusing on the specific case of Switzerland and analyzing the actual implementation of the ‘green urban agenda’ policy principles, the study investigated the degree to which the mentioned policy principles have been put into practice in urban planning and design in Zurich’s district 9 and in the green space clusters within the mentioned district. The findings reveal that most policy objectives—preservation of city nature, high-quality open public spaces, good connectivity, and high average green space area per resident—are implemented to a high extent in practice. However, more intangible attributes of green spaces, such as social equity and cultural diversity, are yet to advance to fully increase social inclusion in green spaces. Compared to contemporary studies on similar topics, such research findings align with the prevailing perspectives in the body of literature: physical attributes of green spaces are easiest to effectively apply, while making green spaces to be used by all is the most challenging aspect to implement [
31,
32]. Zurich’s case clearly shows that despite the abundance of community gardens, which by their definition should serve all the community members, it is very difficult to achieve meaningful interaction between groups with various cultural, language, and ethnic backgrounds.
Furthermore, while green spaces and associated facilities are provided in the district, a careful consideration of location, size, and the role of green spaces in the broader urban context would be essential to ensure an effective application of the principles. Finally, an in-depth understanding of the local community, including the recognition of various local users’ needs and of other potential users will improve the access, use, quality, and social inclusion benefits of green spaces. Such an approach can ultimately increase awareness about the natural environment among urban dwellers.
However, the study does encounter certain limitations, mostly stemming from the research methodology employed. Firstly, the researchers used some approximations, particularly concerning the age groups of green and open space users. This limitation could have been addressed by utilizing additional tools, such as surveys, to obtain more precise data. Nevertheless, it is worth noting that the central age group was broadly defined, encompassing users aged between 30 and 60 years old, which should minimize significant deviations from the research findings. Using surveys could have also provided a better understanding of the language used by the participants. However, it is important to acknowledge that only 10 percent of the observed individuals engaged in solo activities, making any additional findings related to language use somewhat negligible. Moreover, the study could have benefitted from more detailed demographic information about the participants in the four clusters, such as nationality, family status, and employment. This additional data could have shed light on the effect of green spaces on different social groups. Furthermore, to provide a more accurate reflection of the actual situation, the analysis of activities in green spaces could have been enhanced by gathering additional on-site observation data over various periods. Lastly, using qualitative methods elucidates better the people’s perceptions of green space, their feelings, and habits, thus adding more to understanding the immaterial green space attributes and complementing the current findings.
Despite these limitations, the study remains valuable for its comprehensive multi-scale overview, offering a solid foundation for further research on the ‘implementation gap’ in the planning and design of urban green spaces in diverse settings worldwide. Future studies investigating the factors that influence the uptake of the ‘green urban agenda’ principles could integrate and develop the methodology of this study to overcome the above-mentioned limitations. Moreover, as current studies place a growing emphasis on collective well-being, social diversity and inclusion as essential aspects of healthy cities, future research could explore the skills, attitudes, and incentives of the stakeholders involved in policy implementation and management of green spaces, as well as the political, institutional and social contexts influencing both policy implementation and people’s behavior. This would contribute to understanding the relevance of stakeholders’ involvement and integrating their needs and preferences in designing and implementing policies and green space projects.
Author Contributions
Conceptualization, A.P. and Y.J.; methodology, A.P.; software, Y.J.; validation, A.P. and Y.J.; formal analysis, A.P. and Y.J.; investigation, A.P. and Y.J.; resources, A.P. and Y.J.; data curation, A.P. and Y.J.; writing—original draft preparation, A.P. and Y.J; writing—review and editing, A.P. and L.R.; visualization, Y.J.; supervision, S.M.; project administration, Y.J. and S.M.; funding acquisition, S.M. All authors have read and agreed to the published version of the manuscript.
Funding
This research was conducted at the Future Cities Lab Global at ETH Zurich. Future Cities Lab Global is supported and funded by the National Research Foundation, Prime Minister’s Office, Singapore under its Campus for Research Excellence and Technological Enterprise (CREATE) programme and ETH Zurich (ETHZ), with additional contributions from the National University of Singapore (NUS), Nanyang Technological University (NTU), Singapore and the Singapore University of Technology and Design (SUTD).
Institutional Review Board Statement
Not applicable.
Informed Consent Statement
Not applicable.
Data Availability Statement
The data presented in this study are available on request from the corresponding author. The data are not publicly available due to privacy reasons.
Conflicts of Interest
The authors declare no conflict of interest.
References
- Park, J.; Kim, J.-H.; Lee, D.K.; Park, C.Y.; Jeong, S.G. The influence of small green space type and structure at the street level on urban heat island mitigation. Urban For. Urban Green. 2017, 21, 203–212. [Google Scholar] [CrossRef]
- Santamouris, M.; Ban-Weiss, G.; Osmond, P.; Paolini, R.; Synnefa, A.; Cartalis, C.; Muscio, A.; Zinzi, M.; Morakinyo, T.E.; Ng, E.; et al. Progress in Urban Greenery Mitigation Science—Assessment Methodologies, Advanced Technologies and Impact on Cities. J. Civ. Eng. Manag. 2018, 24, 638–671. [Google Scholar] [CrossRef]
- Maas, J. Vitamin G: Green Environments—Healthy Environments. Doctoral Dissertation, Universiteit Utrecht, Utrecht, The Netherlands, 2009. Available online: https://www.nivel.nl/sites/default/files/bestanden/Proefschrift-Maas-Vitamine-G.pdf (accessed on 22 June 2022).
- Vienneau, D.; de Hoogh, K.; Faeh, D.; Kaufmann, M.; Wunderli, J.M.; Röösli, M. More than clean air and tranquillity: Residential green is independently associated with decreasing mortality. Environ. Int. 2017, 108, 176–184. [Google Scholar] [CrossRef]
- Belcher, R.N.; Chisholm, R.A. Tropical Vegetation and Residential Property Value: A Hedonic Pricing Analysis in Singapore. Ecol. Econ. 2018, 149, 149–159. [Google Scholar] [CrossRef]
- Dubová, L.; Macháč, J. Improving the quality of life in cities using community gardens: From benefits for members to benefits for all local residents. GeoScape 2019, 13, 68–78. [Google Scholar] [CrossRef]
- Panduro, T.E.; Veie, K.L. Classification and valuation of urban green spaces—A hedonic house price valuation. Landsc. Urban Plan. 2013, 120, 119–128. [Google Scholar] [CrossRef]
- Oh, R.R.Y.; Richards, D.R.; Yee, A.T.K. Community-driven skyrise greenery in a dense tropical city provides biodiversity and ecosystem service benefits. Landsc. Urban Plan. 2018, 169, 115–123. [Google Scholar] [CrossRef]
- Dadvand, P.; Nieuwenhuijsen, M. Green Space and Health. In Integrating Human Health unto Urban and Transport Planning: A Framework; Nieuwenhuijsen, M., Khreis, H., Eds.; Springer International Publishing AG: Cham, Switzerland, 2018; pp. 409–423. [Google Scholar]
- Gascon, M.; Sánchez-Benavides, G.; Dadvand, P.; Martínez, D.; Gramunt, N.; Gotsens, X.; Cirach, M.; Vert, C.; Molinuevo, J.L.; Crous-Bou, M.; et al. Long-term exposure to residential green and blue spaces and anxiety and depression in adults: A cross-sectional study. Environ. Res. 2018, 162, 231–239. [Google Scholar] [CrossRef] [PubMed]
- Van den Berg, A.E.; Maas, J.; Verheij, R.A.; Groenewegen, P.P. Green space as a buffer between stressful life events and health. Soc. Sci. Med. 2010, 70, 1203–1210. [Google Scholar] [CrossRef] [PubMed]
- Swanwick, C.; Dunnett, N.; Woolley, H. Nature, Role and Value of Green Space in Towns and Cities: An Overview. Built Environ. 2013, 29, 94–106. [Google Scholar] [CrossRef]
- Dempsey, N.; Brown, C.; Bramley, G. The key to sustainable urban development in UK cities? The influence of density on social sustainability. Prog. Plan. 2012, 77, 89–141. [Google Scholar] [CrossRef]
- Jennings, V.; Bamkole, O. The Relationship between Social Cohesion and Urban Green Space: An Avenue for Health Promotion. Int. J. Environ. Res. Public Health 2019, 16, 452. [Google Scholar] [CrossRef] [PubMed]
- Rasidi, M.H.; Jamirsah, N.; Said, I. Urban Green Space Design Affects Urban Residents’ Social Interaction. Procedia-Soc. Behav. Sci. 2012, 68, 464–480. [Google Scholar] [CrossRef]
- Gill, S.; Handley, J.; Ennos, R.; Nolan, P. Planning for Green Infrastructure: Adapting to Climate Change. In Planning for Climate Change; Davoudi, S., Crawford, J., Mehmood, A., Eds.; Routledge: London, UK, 2009; pp. 273–285. [Google Scholar]
- Vanuytrecht, E.; Van Mechelen, C.; Van Meerbeek, K.; Willems, P.; Hermy, M.; Raes, D. Runoff and Vegetation Stress of GreenRoofs under Different Climate Change Scenarios. Landsc. Urban Plan. 2014, 122, 68–77. [Google Scholar] [CrossRef]
- Nakamura, F. (Ed.) Green Infrastructure and Climate Change Adaptation: Function, Implementation and Governance (Ecological Research Monographs); Springer Nature: Singapore, 2022. [Google Scholar]
- Matthews, T.; Lo, A.Y.; Byrne, J.A. Reconceptualizing Green Infrastructure for Climate Change Adaptation: Barriers to Adoption and Drivers for Uptake by Spatial Planners. Landsc. Urban Plan. 2015, 138, 155–163. [Google Scholar] [CrossRef]
- Salata, K.-D.; Yiannakou, A. Green Infrastructure and climate change adaptation. TeMA J. Land Use Mobil. Environ. 2016, 9, 7–24. [Google Scholar]
- Grant, M. Planning for Healthy Cities. In Integrating Human Health into Urban and Transport Planning: A Framework; Nieuwenhuijsen, M., Khreis, H., Eds.; Springer: Cham, Switzerland, 2019; pp. 221–250. [Google Scholar]
- Pineo, H. Healthy Urbanism: Designing and Planning Equitable, Sustainable and Inclusive Places; Palgrave: London, UK, 2022. [Google Scholar]
- De Vries, S.; van Dillen, S.M.E.; Groenewegen, P.P.; Spreeuwenberg, P. Streetscape greenery and health: Stress, social cohesion and physical activity as mediators. Soc. Sci. Med. 2013, 94, 26–33. [Google Scholar] [CrossRef]
- Taguchi, V.J.; Weiss, P.T.; Gulliver, J.S.; Klein, M.R.; Hozalski, R.M.; Baker, L.A.; Finlay, J.C.; Keeler, B.L.; Nieber, J.L. It is not easy being green: Recognizing unintended consequences of green stormwater infrastructure. Water 2020, 12, 522. [Google Scholar] [CrossRef]
- Rice, J.; Cohen, D.; Long, J.; Jurjevich, J. Contradictions of the climate-friendly city: New perspectives on eco-gentrification and housing justice. Int. J. Urban Reg. Res. 2019, 44, 145–165. [Google Scholar] [CrossRef]
- Miller, J.T. Is urban greening for everyone? Social inclusion and exclusion along the Gowanus Canal Urban Forest. Urban For. Urban Green. 2016, 19, 285–294. [Google Scholar] [CrossRef]
- Checker, M. Wiped out by the “greenwave”: Environmental gentrification and the paradoxical politics of urban sustainability. City Soc. 2011, 23, 210–229. [Google Scholar] [CrossRef]
- Anguelovski, I.; Connolly, J.J.; Masip, L.; Pearsall, H. Assessing green gentrification in historically disenfranchised neighborhoods: A longitudinal and spatial analysis of Barcelona. Urban Geogr. 2018, 39, 458–491. [Google Scholar] [CrossRef]
- Quinton, J.; Nesbitt, L.; Sax, D. How well do we know green gentrification? A systematic review of the methods. Prog. Human Geogr. 2022, 46, 960–987. [Google Scholar] [CrossRef] [PubMed]
- Gould, K.; Lewis, T. Green Gentrification: Urban Sustainability and the Struggle for Environmental Justice; Routledge: London, UK, 2017. [Google Scholar]
- Cucca, R.; Thaler, T. Social Justice in the Green City. Urban Plan. 2023, 8, 279–282. [Google Scholar] [CrossRef]
- Bryson, J. The nature of gentrification. Geogr. Compass 2013, 7, 578–587. [Google Scholar] [CrossRef]
- Dooling, S. Ecological gentrification: A research agenda exploring justice in the city. Int. J. Urban Reg. Res. 2009, 33, 621–639. [Google Scholar] [CrossRef]
- Cucca, R.; Friesenecker, M.; Thaler, T. Green Gentrification, Social Justice, and Climate Change in the Literature: Conceptual Origins and Future Directions. Urban Plan. 2023, 8, 283–295. [Google Scholar] [CrossRef]
- Bentsen, P.; Lindholst, A.C.; Konijnendijk, C.C. Reviewing eight years of Urban Forestry & Urban Greening: Taking stock, looking ahead. Urban For. Urban Green. 2010, 9, 273–280. [Google Scholar]
- Lennon, M.; Douglas, O.; Scott, M. Green Space Attributes for Enhancing Health and Well-being. In Review of World Planning Practice, Volume 18: Towards Healthy Cities: Urban Governance, Planning and Design for Human Well-Being; Perić, A., Alraouf, A., Cilliers, J., Eds.; ISOCARP (International Society of City and Regional Planners): The Hague, The Netherlands, 2022; pp. 177–188. [Google Scholar]
- Rigolon, A.; Németh, J. Green gentrification or “just green enough”: Do park location, size, and function affect whether a place gentrifies or not? Urban Stud. 2020, 57, 402–420. [Google Scholar] [CrossRef]
- Perić, A.; De Blust, S.; Jiang, Y.; Guariento, N.; Wälty, S. Urban Strategies for Dense and Green Zurich: From Healthy Neighbourhoods towards Healthy Communities? In Search of a New Planning Agenda for Urban Health, Socio-Spatial Justice and Climate Resilience (Proceedings of the 58th ISOCARP World Planning Congress); Enlil, Z., Belpaire, E., Schuett, R., Morgado, S., Eds.; ISOCARP (International Society of City and Regional Planners): The Hague, The Netherlands, 2022; pp. 1654–1667. [Google Scholar]
- United Nations (UN). Transforming Our World: The 2030 Agenda for Sustainable Development; UN Publishing: New York, NY, USA, 2015. [Google Scholar]
- United Nations (UN). New Urban Agenda; Habitat III Secretariat: Quito, Ecuador, 2017. [Google Scholar]
- World Health Organization (WHO). Urban Greenspaces and Health: A review of Evidence; WHO Regional Office for Europe: Copenhagen, Denmark, 2016. [Google Scholar]
- EU Ministers. The New Leipzig Charter—The Transformative Power of Cities for the Common Good. In Proceedings of the Informal Ministerial Meeting on Urban Matters, Leipzig, Germany, 30 November 2020. [Google Scholar]
- European Commission (EC). New European Bauhaus Progress Report; Office for Official Publications of the European Communities: Brussels, Belgium, 2023. [Google Scholar]
- European Commission (EC). A European Green Deal; Office for Official Publications of the European Communities: Brussels, Belgium, 2020. [Google Scholar]
- EU Ministers. Urban Agenda 2.0—Ljubljana Agreement. In Proceedings of the Informal Meeting of EU Ministers responsible for Urban Development, Ptuj, Slovenia, 26 November 2022. [Google Scholar]
- EU Ministers. Territorial Agenda 2030: A Future for All Places. Agreed at the Informal Meeting of EU Ministers Responsible for Spatial Planning and Territorial Development and/or Territorial Cohesion, Germany, 1 December 2020. Available online: https://www.citiesforum2023.eu/docs/Territorial/Territorial%20Agenda%202030.pdf (accessed on 22 June 2022).
- European Commission (EC). Urban Agenda for EU; Office for Official Publications of the European Communities: Brussels, Belgium, 2016. [Google Scholar]
- European Commission (EC). Integrated Sustainable Urban Development—Cohesion Policy 2014–2020; Office for Official Publications of the European Communities: Brussels, Belgium, 2014. [Google Scholar]
- EU Ministers. Territorial Agenda 2020: Towards an Inclusive, Smart and Sustainable Europe of Diverse Regions. In Proceedings of the Informal Meeting of EU Ministers Responsible for Spatial Planning and Territorial Development, Gödöllő, Hungary, 19 May 2011. [Google Scholar]
- Federal Council. Sustainable Development Strategy 2030; Federal Council: Berne, Switzerland, 2021. [Google Scholar]
- Federal Council. Action Plan 2021–2023 for Sustainable Development Strategy 2030; Federal Council: Berne, Switzerland, 2021. [Google Scholar]
- Council for Spatial Planning (ROR). Megatrends and Spatial Development in Switzerland; ROR: Berne, Switzerland, 2019. [Google Scholar]
- Office for Spatial Development (ARE). Trends and Challenges: Figures and Background on the Swiss Spatial Strategy; ARE: Berne, Switzerland, 2018. [Google Scholar]
- Federal Council. Swiss Spatial Concept; Federal Council: Berne, Switzerland, 2012. [Google Scholar]
- Planning and Construction Law PBG, 2013. (OS 68, 189; ABl 2011, 1161).
- Spatial Planning Law RPG, 2019.
- Cantonal Council. Cantonal Structural Plan Zurich 2035; Cantonal Council: Zurich, Switzerland, 2019. [Google Scholar]
- Cantonal Council. Long-term Spatial Development Strategy of Canton Zurich; Cantonal Council: Zurich, Switzerland, 2014. [Google Scholar]
- City of Zurich. Regional Structural Plan; City of Zurich: Zurich, Switzerland, 2017. [Google Scholar]
- City of Zurich. Communal Structural Plan; City of Zurich: Zurich, Switzerland, 2021. [Google Scholar]
- City of Zurich. Strategies Zurich 2035; City of Zurich: Zurich, Switzerland, 2016. [Google Scholar]
- Stadt Zürich Statistik. Quartierspeigel Alstetten 2023; Stadt Zürich Präsidialdepartement, Statistik Stadt Zürich: Zürich, Switzerland, 2023; Available online: https://www.stadt-zuerich.ch/prd/de/index/statistik/publikationen-angebote/publikationen/Quartierspiegel/QUARTIER_092.html (accessed on 15 July 2023).
- United Nations Human Settlement Programme (UN-Habitat). SDG Indicator 11.7.1 Training Module: Public Space; UN-Habitat: Nairobi, Kenya, 2018; Available online: https://unhabitat.org/sites/default/files/2020/07/indicator_11.7.1_training_module_public_space.pdf (accessed on 15 July 2023).
- Kurz, D. Die Disziplinierung der Stadt: Moderner Städtebau in Zürich 1900 bis 1940 (Studienausgabe); gta Verlag: Zurich, Switzerland, 2021. [Google Scholar]
Figure 1.
Zurich’s district 9 (in red) composed of Altstetten and Albisrieden neighborhoods. Source: authors.
Figure 1.
Zurich’s district 9 (in red) composed of Altstetten and Albisrieden neighborhoods. Source: authors.
Figure 2.
Density of green areas in Altstetten and Albisrieden: green surface plot ratio (GsPR). Source: authors.
Figure 2.
Density of green areas in Altstetten and Albisrieden: green surface plot ratio (GsPR). Source: authors.
Figure 3.
Intensity of greenery in Altstetten and Albisrieden: Leaf Area Index (LAI). Source: authors.
Figure 3.
Intensity of greenery in Altstetten and Albisrieden: Leaf Area Index (LAI). Source: authors.
Figure 4.
Connectivity between identified public green spaces in Altstetten and Albisrieden: Source: authors.
Figure 4.
Connectivity between identified public green spaces in Altstetten and Albisrieden: Source: authors.
Figure 5.
Four clusters (subsites) in Altstetten and Albisrieden: Source: authors.
Figure 5.
Four clusters (subsites) in Altstetten and Albisrieden: Source: authors.
Figure 6.
The structure of green spaces in four clusters in Altstetten and Albisrieden: (a) Grünau; (b) Lindenplatz; (c) Bachwiesen; (d) Süsslerenanlage. Source: authors.
Figure 6.
The structure of green spaces in four clusters in Altstetten and Albisrieden: (a) Grünau; (b) Lindenplatz; (c) Bachwiesen; (d) Süsslerenanlage. Source: authors.
Figure 7.
Grünau: (a) short and scattered playground activities; (b) a family gathering with a group of children resting. Source: authors.
Figure 7.
Grünau: (a) short and scattered playground activities; (b) a family gathering with a group of children resting. Source: authors.
Figure 8.
Lindenplatz: (a) activities in a weekday afternoon; (b) free market on Saturdays. Source: authors.
Figure 8.
Lindenplatz: (a) activities in a weekday afternoon; (b) free market on Saturdays. Source: authors.
Figure 9.
Bachwiesen: (a) goats from the Community Zoo walking around Bachwiesenpark; (b) typical weekday afternoon activities. Source: authors.
Figure 9.
Bachwiesen: (a) goats from the Community Zoo walking around Bachwiesenpark; (b) typical weekday afternoon activities. Source: authors.
Figure 10.
Süsslerenanlage: (a) exercising workshop; (b) swinging. Source: authors.
Figure 10.
Süsslerenanlage: (a) exercising workshop; (b) swinging. Source: authors.
Figure 11.
Distribution of public green spaces in Altstetten and Albisrieden (the size of the circle represents the area). Source: authors.
Figure 11.
Distribution of public green spaces in Altstetten and Albisrieden (the size of the circle represents the area). Source: authors.
Table 1.
The ‘green urban agenda’ principles of major global and European territorial and urban development policy documents. Source: authors based on [
38].
Table 1.
The ‘green urban agenda’ principles of major global and European territorial and urban development policy documents. Source: authors based on [
38].
| Documents | Cross-Cutting Principles |
|---|
2030 Agenda for Sustainable Development
[39] | resilience and adaptive capacity to climate-related hazards capacity of local communities to pursue sustainable livelihood opportunities the importance of green spaces
|
New Urban Agenda
[40] | balanced, sustainable and integrated urban and territorial development, planning and design resilience and responsiveness to natural and human-made hazards mitigation of and adaptation to climate change compact, connected and inclusive cities environmental sustainability green infrastructure preservation and enhancement of natural heritage
|
Ljubljana Agreement
[45] | greening cities mitigation of and adaptation to climate change climate neutrality by 2050 integrated and sustainable development
|
Territorial Agenda 2030
[46] | better ecological livelihoods (nature-based solutions, green-blue infrastructure) climate-neutral and resilient towns, cities and regions rehabilitation and reutilization of the built environment
|
New Leipzig Charter
[42] | integrated urban development compact cities, urban regeneration, brownfield development management and conversion of existing built environment green city (high quality of green and recreational spaces, climate-resilient and carbon-neutral buildings, net-zero carbon city)
|
Urban Agenda for the EU
[47] | |
Integrated sustainable urban development—Cohesion policy 2014–2020
[48] | |
Territorial Agenda of the European Union 2020
[49] | |
Table 2.
Leaf Area Index (LAI) values for different plant types. Source: Leaf Assessment Criteria for Developments, Nparks, Singapore.
Table 2.
Leaf Area Index (LAI) values for different plant types. Source: Leaf Assessment Criteria for Developments, Nparks, Singapore.
| Plant Types | LAI Value |
|---|
| tree | open canopy: 2.5
intermediate canopy: 3
dense Canopy: 4
intermediate columnar canopy: 3 |
| shrubs | monocot: 3.5
dicot: 4.5 |
| turf | turf: 2 |
Table 3.
Variables associated with dominant activities in selected green space clusters. Source: authors.
Table 3.
Variables associated with dominant activities in selected green space clusters. Source: authors.
| Variable | |
|---|
| location | approximate areas where activities occurred in QGIS |
| area size (m2) | geometric areas of each type of surface in QGIS |
| average distance to buildings (m) | average walk distance from the main entrance of each building of the subsite case to the geometric center of the parks, gardens, or open space |
| duration (min.) | start time and end time of each recorded space use activity
mean
min.
max. |
| gender | female
male
unknown: toddlers and some special cases |
| age | <10: young children and toddlers
10–20: adolescents
20–30: young adults
30–60: adults
>60: senior people |
| user types | solo visitors
group visitors |
| language | local languages: Swiss German and Swiss French
European languages: German, French, Italian, English, etc.
Asian languages: Indian, Chinese, etc.
other languages: languages that cannot be identified |
Table 4.
The ‘green urban agenda’ principles of major federal, cantonal, and local (city of Zurich) urban development policy documents. Source: authors.
Table 4.
The ‘green urban agenda’ principles of major federal, cantonal, and local (city of Zurich) urban development policy documents. Source: authors.
| Documents | Cross-Cutting Principles |
|---|
Sustainable Development Strategy 2030
[24] | sustainable and resilient planning and design of the built environment
coping with climate change effects |
Action Plan 2021-2023 for Sustainable Development Strategy 2030
[25] | |
Megatrends and Spatial Development in Switzerland
[26] | new urban/regional centers
infill development
densification
city greening
higher urbanity: combining higher density and green/open areas |
Trends and Challenges: Figures and Background on the Swiss Spatial Strategy
[27] | sustainable development
climate adaptation and mitigation
infill development/densification within the already built environment
compact and diverse settlements to allow more open space and optimal use of public infrastructure
space-saving urban design |
Swiss Spatial Concept
[28] | infill development
brownfield redevelopment
protection of natural areas
upgrade of settlements and landscapes |
| Planning and Construction Law PBG [29] | |
Spatial Planning Law RPG
[30] | infill development (Art. 1)
compact settlements (Art. 1) |
Cantonal Structural Plan Zurich 2035
[31] | sustainable planning
dense and compact settlements |
Long-term Spatial Development Strategy of Canton Zurich
[32] | infill development
place-specific densification
nurture of open and recreational spaces |
Regional Structural Plan
[33] | district-specific development and diverse densification
preservation of landscape and recreational areas
energy-saving and climate-neutral urban renewal |
Communal Structural Plan
[34] | diverse and ‘smart’ (preserving identity) densification
high-quality open public spaces
preservation of city nature
‘kurze Wege’
environmentally friendly development
garden city
ecological corridors |
Strategies Zurich 2035
[35] | sustainable growth
social inclusion coupled with natural preservation
high-quality densification
high-quality recreational spaces |
Table 5.
Green spaces (types, subtypes, and size) in Altstetten and Albisrieden. Source: authors.
Table 5.
Green spaces (types, subtypes, and size) in Altstetten and Albisrieden. Source: authors.
| Green Space Type | Green Space Subtype | Size |
|---|
| public green spaces | parks and gardens
other open green spaces | 36,820 m2
108,670 m2 |
| community green spaces | community gardens | 1,085,065 m2 |
| private green spaces | private gardens
urban farming
other private green spaces | 650,877 m2
405,720 m2
355,240 m2 |
| other reserved green spaces | closed forest
pasture fields
intensive agriculture fields
sports fields
transport greenery
cemeteries
stocked fields
other greenery | 3,489,788 m2
709,485 m2
53,340 m2
235,069 m2
70,912 m2
124,914 m2
80,170 m2
13,433 m2 |
Table 6.
Sample statistics for each cluster. Source: authors.
Table 6.
Sample statistics for each cluster. Source: authors.
| | Total | Grünau | Lindenplatz | Bachwiesen | Süsslerenanlage |
|---|
area size (m2)
green spaces
grey surface | 318,605
193,388
125,217 | 119,091
79,166
39,925 | 67,300
39,384
27,916 | 92,250
45,527
46,723 | 39,964
29,311
10,653 |
| average distance to buildings | | 188.8 m | 190.0 m | 213.5 m | 194.0 m |
duration (min)
mean
min.
max. |
80
2
270 |
111
10
270 |
58
5
255 |
96
5
270 |
57
2
210 |
gender
female
male
unknown |
47%
51%
2% |
47%
52%
1% |
43%
57%
|
52%
45%
3% |
42%
58%
|
age
<10
10 to 20
20 to 30
30 to 60
>60 |
30%
4%
12%
42%
11% |
33%
7%
6%
35%
19% |
8%
8%
11%
61%
12% |
44%
1%
10%
34%
11% |
40%
3%
26%
27%
3% |
user types
group
solo |
90%
10% |
94%
6% |
79%
21% |
97%
3% |
96%
4% |
language
local languages
European languages
Asian languages
other languages
(blank) * |
726
135
25
211
16 |
57
44
22
1 |
279
45
18
35
|
273
43
7
153
15 |
117
3
1
|
Table 7.
Activities identified in each cluster. Source: authors.
Table 7.
Activities identified in each cluster. Source: authors.
| | Total | Grünau | Lindenplatz | Bachwiesen | Süsslerenanlage |
|---|
activity type
resting
chatting
gathering (events incl.)
playing
walking
walking dogs
exercising
cycling |
444
110
67
420
28
13
6
25 |
21
20
23
58
2 |
325
6
17
27
2
|
94
53
36
273
1
8
3
23 |
4
31
8
72
3
3
|
| total observed activities | 1113 | 124 | 337 | 491 | 121 |
| Disclaimer/Publisher’s Note: The statements, opinions and data contained in all publications are solely those of the individual author(s) and contributor(s) and not of MDPI and/or the editor(s). MDPI and/or the editor(s) disclaim responsibility for any injury to people or property resulting from any ideas, methods, instructions or products referred to in the content. |
© 2023 by the authors. Licensee MDPI, Basel, Switzerland. This article is an open access article distributed under the terms and conditions of the Creative Commons Attribution (CC BY) license (https://creativecommons.org/licenses/by/4.0/).


