Article

Synthesis and Characterization of a Quercetin-Based Nanocomposite and Its Ameliorating Impacts on the Growth, Physiological, and Biochemical Parameters of Ocimum basilicum L. under Salinity Stress

1
Department of Plant Science, Faculty of Biological Science, University of Kharazmi, Tehran 1571914911, Iran
2
Department of Biology, Faculty of Science, University of Mohaghegh Ardabili, Ardabi 13131561991, Iran
*
Author to whom correspondence should be addressed.
Sustainability 2023, 15(15), 12059; https://doi.org/10.3390/su151512059
Submission received: 28 June 2023 / Revised: 31 July 2023 / Accepted: 2 August 2023 / Published: 7 August 2023

Abstract

:
Quercetin (Qu), as an essential flavonoid in plants with antioxidant properties, scavenges environmental stress-induced ROS. Quercetin-based nanocomposites (QNCs) with the same and adequate properties were designed and synthesized for effective Qu delivery in Ocimum basilicum. QNCs were synthesized using the coacervation method, and their effect on the growth, physiological, biochemical, and phytochemical traits of O. basilicum under salinity stress was investigated. Various treatments, including selected concentrations of Qu (0.01 mg/mL) and QNCs (0.01 mg/mL), and four concentrations of NaCl (0, 50, 100, 150 mM) at the vegetative stages, were applied. Results showed that stress markers (Electrolyte leakage, malondialdehyde, hydrogen peroxide) increased with increasing salinity levels. Conversely, salinized plants showed a reduction in plant growth parameters (seed germination, root and shoot length, fresh and dry weight of shoot and root, and plant height) and physiological and photosynthetic parameters (Relative water content, photosynthesis rate, stomatal conductance, photosynthetic pigments, and chlorophyll fluorescence), while application of Qu and QNCs increased these critical parameters. Furthermore, Qu and QNCs enhanced O. basilicum’s tolerance to salinity by increasing compatible solutes content such as glycine betaine, proline, total free amino acids, and soluble carbohydrates; increasing antioxidant enzyme activity; increasing antioxidants content like anthocyanins, tannins, phenols, and flavonoids; and decreasing proteins content and stress markers in plant tissues. Our study suggests that treatment with Qu and QNCs is an effective strategy that can be used to enhance the salt tolerance of O. basilicum plants, and QNCs treatment had a better effect than treatment with Qu.

Graphical Abstract

1. Introduction

Nanotechnology is technology related to the production of materials in the size of one to 100 nanometers, which can lead to significant changes in the physical and chemical properties of materials [1]. Nanotechnology plays a considerable role in improving product management techniques, and advanced nanomaterials may be used as a new agricultural tool to manage stresses, diagnose diseases, and increase the ability to absorb and transport nutrients, thereby increasing the quality and quantity of crops [2,3,4]. Increasing access to nanoparticles with a precise and small size, high stability, high solubility, desired surface, multiple shapes and functions, free distribution, and diffusion has increased the attention to nanocomposites [5,6,7]. In nanocomposite synthesis technology, different carriers are used to deliver the material to the target cell and release it continuously and in a balanced way inside the cell [8,9]. Polymers such as polyethylene glycol and polylactic glycolic acid are used to make nanocomposites with different properties as carriers. Natural polysaccharide polymers, such as cellulose and its derivatives chitosan, dextran, and starch, are feasible alternatives to other classic polymers due to their high biocompatibility, biodegradability, non-toxicity, and cost-effectiveness [7]. Among different polysaccharides, cellulose has the greatest potential due to its abundance, outstanding biodegradability, and high biocompatibility. However, the insufficient solubility of cellulose in water and many organic solvents, as well as its low reactivity, makes it hard to use it to make other beneficial substances. Instead, cellulose derivatives can overcome these disadvantages [10]. Carboxymethyl cellulose (CMC) (a derivative of cellulose polysaccharide) is used in biology and pharmacy as a nanocarrier of drugs and chemicals [11]. Due to its polar groups, such as carboxymethyl (–CH2COOH), which can chelate and increase solubility in water, CMC can be used as a suitable carrier to increase the solubility of low-soluble materials as well as aid the continuous and balanced release of these materials [12,13]. Further, the hydroxyl and carboxyl groups of CMC can react with other reactants to make steady nanopolymers [11].
Quercetin (Qu), a type of natural flavonoid found in fruits (apples and berries), vegetables (onions and broccoli), wine, and tea, works as an antioxidant. Qu significantly reduces adverse effects of various stresses, such as osmotic or oxidative stress in wheat and tomato plants [14,15]. However, the use of Qu is limited in physiological environments due to its hydrophobicity, instability, poor bioavailability, low permeability, and rapid metabolism [16,17]. Researchers have tried to improve its solubility by complexing it with liposomes and polymers such as polylactic acid, or placing it in suitable carriers such as chitosan [18].
Basil (Ocimum basilicum L.) is a valuable medicinal plant. It is an annual, perennial herb, and belongs to the Lamiaceae family, which is traditionally used in the treatment of headaches, coughs, diarrhea, and constipation, and has sedative, antiseptic, digestive, anti-parasitic, and appetizing effects; it also increases breast milk [19,20]. In addition, this aromatic plant is used as a spice, flavoring, and vegetable for culinary purposes, and is widely cultivated in many countries [19].
Salinity is one of the main non-biological facets in restricting the growth of plants, which reduces production [15]. Ocimum species are sensitive to cold and water shortages, and its growth is limited due to ion toxicity [20]. Salinity reduces germination percentage and speed, reduces seedling growth by decreasing the osmotic potential of the growth environment and the toxicity of some ions, and disrupts plant biochemical and physiological activities, such as photosynthesis, protein synthesis, and lipid metabolism [21]. Thus, plants try to prevent osmotic and ionic stress via various means, such as osmotic regulation, regulating stomatal movements, and limiting cell division. Salinity is also accountable for the overproduction of reactive oxygen species (ROS), and therefore induces oxidative stress in plants, damaging cellular structures including proteins, lipids, nucleic acids, and the cell membrane structure [22]. Reports indicate that the genetic defense capacity cannot protect the plant from the harm caused by salinity stress in most cases. Therefore, the use of chemicals as protectors to strengthen the antioxidant defense system has recently received much attention. Researchers are currently examining various chemicals such as phytohormones, essential nutrients, antioxidants, and other secondary metabolites as plant protection [23]. Some phenolic compounds eliminate ROS and work as an antioxidant to save the plant from stress damage. The production of these compounds is necessary to increase plant tolerance against high salt stress conditions [24]. Several experiments have been done on the plant’s response to salinity; however, reports on the external applications of flavonoids is still limited in the Ocimum species and other plants, because Qu has the potential to reduce the effects of salinity in plants by improving plant defense mechanisms. Therefore, in this study, we treated basil plants under salinity stress with Qu and Quercetin-based nanocomposites (QNCs) and examined their response in terms of growth and physiological and biochemical properties. Based on our knowledge, this is the first report to determine the effect of Qu and QNCs on the salinity tolerance of basil.

2. Materials and Methods

2.1. Preparation of Quercetin-Based Nanocomposites

Exactly 20 mL of Qu solution in ethanol with a concentration of 2 mg/mL was prepared and placed in a heat-free ultrasonic bath for 10 min. In another container, 4 mg CMC in 10 mL of distilled water were slowly dissolved, and the resulting solution was placed in an ultrasonic bath at 60 °C for 15 min. Then, the organic phase (dissolved Qu in ethanol) was slowly added drop by drop to the aqueous phase (dissolved CMC in water) in an ultrasonic bath at 60 °C. The resulting solution was placed in a magnetic stirrer at 50 °C for 10 min, and then kept in an ultrasonic bath at 60 °C for 20 min. The solution was then centrifuged at 8000 rpm for 20 min, and the supernatant solution was poured into a Petri dish and dried. The resulting material was collected after drying, and various tests including scanning electron microscope (SEM), Fourier-transform infrared spectrometer (FTIR), thermogravimetric analysis (TGA), and dynamic light scattering (DLS) were performed to identify the size, morphology, and nature of the synthesized nanocomposites [25].

2.2. Materials

Greenhouse experiments were conducted in 2021 at the Faculty of Science of Mohaghegh Ardabili University. Quercetin and carboxymethyl cellulose were purchased from Sigma-Aldrich, Darmstadt, Germany. Perlite and cocopeat were used for planting. O. ciliatum seeds were purchased from Pakan Bazr in Isfahan, Iran and the Hoagland solution was used for irrigation.

2.3. Growth Parameters

A randomized experiment with ten replications was performed to study the effect of Qu and QNCs on seed germination and the growth traits of basil. First, the seeds were disinfected with a 5% sodium hypochlorite solution for 10 min and washed three times with distilled water. Ten sterilized seeds were placed inside each Petri dish on filter paper. The seeds then germinated under 28 different treatments. These treatments included control treatment (distilled water) and Qu and QNCs treatment with 0.001, 0.01, and 1 mg/mL concentrations and NaCl treatment in 4 concentrations of 0, 50, 100, and 150 mM. Petri dishes were treated with 2 mL of solution every day for seven days. The seeds were washed every other day with distilled water to reduce the accumulation of salt and related chemicals, and the solutions were added to the Petri dishes immediately after washing. The germination index for all seeds was 2 mm. At the end of the seventh day, shoot and root length were measured using a line gauge after counting the germinated seeds. The following equation was used to calculate the germination percentage [26]. In this formula, GP is germination percentage, n is the number of germinated seeds, and N is the total number of sown seeds.
GP = (n/N) × 100
After new basil seeds were germinated, healthy seedlings with a root length of 15 to 20 mm were transferred to plastic pots containing coco peat and perlite in a ratio of 3: 1. Seven plants in each pot and ten pots for each treatment were placed in greenhouse conditions with a temperature of about 25 ± 4 °C, a light intensity of 5000 lux, and light period of 16 h light and 8 h darkness. The pots were irrigated every 2 days with 30% Hoagland solution until they reached the six-leaf stage (approximately 40 days) [27]. Then for 20 days, every other day, Qu and QNCs treatments (0.01 mg/mL), as well as different salinity treatments (0, 50, 100, 150 mM) were applied to the pots with Hoagland solution. Distilled water was added to the pots every week (until the water comes out from under the pots) to reduce the accumulation of salt and other related chemicals. The preliminary test was performed in the form of the ISTA standard germination test [26] to optimize the concentration of Qu and QNCs, and according to the maximum germination percentage and seedling growth, 0.01 mg/mL was selected between concentrations. Finally, after 60 days (before flowering), the plants were harvested to measure growth parameters (the fresh weight (FW) of shoot and root, dry weight (DW) of shoot and root, and plant height). The relative water content (RWC) of the leaves was also determined by Ritchie et al. [28], and was measured using the following equation. In this formula, FW is the fresh weight of the leaf immediately after sampling, SW is the saturated weight of the leaf after being placed in distilled water, and DW is the dry weight of the leaf after being placed in the oven.
RWC (%) = [(FW − DW)/(SW − DW)] × 100

2.4. Photosynthetic and Gas Exchange Parameters

To calculate the photosynthetic pigments, fresh leaves (0.5 g) were homogenized in 20 mL of 80% acetone, and after centrifugation (6000 rpm, 10 min), its absorption was read with a spectrophotometer (PG Instrument, Leicestershire, UK) at wavelengths of 663, 645, and 470 nm. The amount of chlorophyll a, chlorophyll b, total chlorophyll (chlorophyll a + b), and carotenoids were determined based on the following formulas [29]. In this equation, V and W mean the volume of solution and the fresh weight of the sample, respectively.
Chlorophyll a = (12.7 × A663 − 2.69 × A645) V/1000 W
Chlorophyll b= (12.7 × A645 − 4.68 × A663) V/1000 W
Chlorophyll a + b = (20.21 × A645 + 8.02 × A663) V/1000 W
Carotenoids = (100A470 − 1.82 chlorophyll a − 85.02 chlorophyll b)/198
A fluorimeter (PEA, Hansatech Instrument Ltd., Norfolk, UK) was used to measure the minimum fluorescence, maximum fluorescence, and maximum photosystem II quantum efficiency (Fv/Fm). According to ALKahtani et al. [30], the measurement was performed after 20 min of matching with the darkness on fully developed leaves. The relative chlorophyll content of chlorophyll index (SPAD) was assessed using a portable chlorophyll meter (Hansatech, model CL-01, Norfolk, UK) in young and fully developed leaves.
Photosynthesis rates of leaves were measured using a portable photosynthesis device (Walz, IRGA model 1010, Effeltrich, Germany) under a constant light intensity of 800 µmol m−2 s−1 and CO2 concentration of 500 mg L−1. An AP4porometer (Delta-T Devices Ltd., Cambridge, UK) was used to measure the stomatal conductance on the youngest mature leaves.

2.5. Stress Markers (Electrolyte Leakage, Malondialdehyde, and Hydrogen Peroxide)

Electrolyte leakage as an indicator of stress damage was determined according to Lutts et al. [31]. Samples were kept in falcons containing 5 mL of distilled water at 25 °C, and shaken for 24 h. The primary electrical conductivity (EC1) of the solution was measured by an EC meter (Mi 180 Bench meter). The falcons were then placed in a hot water bath at 85 °C for 90 min. Then, the solution was cooled at room temperature, and the final electrical conductivity (EC2) was measured. Electrolyte leakage was calculated with this formula:
Electrolyte leakage = EC1/EC2 × 100
Malondialdehyde concentration was measured by Stewart and Stewart’s [32] method. Fresh leaves (0.1 g) were ground in 1 mL of 0.1% trichloroacetic acid (TCA) and centrifuged (1000 rpm, 10 min). 4 mL of 20% TCA containing 0.5% thiobarbituric acid was added to 1 mL of the supernatant and kept in a hot water bath at 95 °C for 15 min and then rapidly cooled in an ice bath. The malondialdehyde content was determined at two wavelengths of 532 and 600 nm. An extinction coefficient of 155 mM−1 cm−1 was used to calculate the malondialdehyde concentration.
Hydrogen peroxide (H2O2) content was measured based on the reaction of H2O2 with potassium iodide (KI), and was conducted using the method of Alexiva et al. [33]. Fresh plant tissue (1 g) was homogenized in 1% TCA, and the leaf extract was centrifuged (12,000 rpm, 15 min). Then, 0.5 mL of 10 Mm potassium phosphate buffer (pH 6.5) and 1 mL of 1 M KI were added to 0.5 mL of the leaf extract supernatant. The reaction was developed for 1 h in darkness, and the absorbance was measured at 390 nm by spectrophotometer. The amount of hydrogen peroxide was determined using a standard curve prepared with known concentrations of H2O2.

2.6. Compatible Solutes (Proline and Glycine Betaine)

Proline content of the basil leaf was measured using the Bates et al. [34] method. Fresh leaves (0.5 g) were homogenized in 5 mL of 3% sulfosalicylic acid solution in an ice bath. After centrifugation (1000 rpm, 4 °C), 2 mL of ninhydrin acid reagent and 2 mL of glacial acetic acid were added to the supernatant and heated at 100 °C for 60 min. The reaction was stopped in an ice water bath, and finally, 4 mL of toluene was added and mixed for 30 s by the vortex. The samples were kept at room temperature for a few minutes until the two phases were completely separated. Finally, the absorbance of the upper phase was read using a spectrophotometer at 520 nm.
Glycine betaine measurement was performed according to Grieve and Grattan’s [35] method. Fresh plant tissue (0.25 g) was homogenized with 20 mL of distilled water and incubated for 24 h at 25 °C. The samples were filtered and mixed with 0.5 mL of 2 N sulfuric acid. 0.25 mL of the solution was transferred to the falcons and incubated in an ice bath for 1 h. 0.1 mL of cold iodine-potassium iodide (I2-KI) reagent was added to each sample, gently mixed, and the falcons were stored at 4 °C for 24 h. After centrifugation (1000 rpm, 30 min), the supernatant was carefully aspirated, and periodide crystals were dissolved in 9 mL of 1, 2 dichloroethane and shaken at room temperature for 24 h. The absorbance was measured spectrometrically at 365 nm, and the amount of glycine betaine was reported according to the standard curve related to pure glycine betaine.

2.7. Biochemical Parameters (Antioxidant Enzymes, Soluble Protein, Free Amino Acids and Soluble Sugar)

Samples of leaves (0.5 g) were crushed using liquid nitrogen and then homogenized in 6 mL of 0.01 M phosphate buffer (pH 6.8). The obtained mixtures were centrifuged (13,000 rpm, 15 min, 4 °C), and supernatants (enzyme extract) were used for the determination of catalase (CAT), ascorbate peroxidase (APX), and polyphenol oxidase (PPO) activity. The activity of CAT was measured using the method of Aebi [36], APX by Nakano and Asada [37], and PPO by Reymond et al. [38].
The total soluble proteins in fresh leaves were estimated by the Bradford method using Coomassie blue dye [39]. The reaction mixture contained 0.1 mL of protein sample (leaf extract) and 5 mL of Bradford reagent. These test tubes were incubated for 15 min in darkness, and then the absorbance was measured at 595 nm.
The free amino acid content was determined using Hwang and Grace’s [40] method. Each sample (0.1 g) was homogenized in 2.5 mL of 50 mM phosphate buffer (pH 6.8), then was centrifuged (3000 rpm, 20 min). The supernatant was treated with a ninhydrin reagent (5 mL), the mixture was incubated for 7 min at 70 °C in the water bath, and then the absorbance of the samples was determined at 570 nm. The free amino acid content was apprised according to the standard curve related to glycin.
The determination of the total soluble sugars was carried out using Roe’s [41] method. Dried ground leaves (0.1 g) were homogenized in 80% ethanol and were filtered and centrifuged. The collected supernatant was heated at 100 °C for 30 min, and then diluted with 2.5 mL of distilled water. Five mL of anthrone reagent was added to 0.1 mL of supernatant, and the mixture was boiled at 90 °C for 15 min then refrigerated in a cool water bath. The absorbance of samples was read at 620 nm.

2.8. Phytochemical Parameters (Flavonoid, Anthocyanin, Tannin and Phenol Content)

Flavonoid content was determined using the colorimetric method [42]. 0.2 g of the samples were homogenized with 10 mL methanol. 0.5 mL of the obtained extracts was diluted with distilled water to reach a volume of 5 mL. Then, 0.3 mL of NaNO2 (5%) and 0.5 mL of AlCl3 were added. Afterward, 2 mL of NaOH (1 M) and 2 mL of distilled water was added, and the mixture was shaken up. The absorption of the supernatant was recorded at 510 nm, and the Flavonoids concentration was determined by plotting the quercetin standard curve.
The total anthocyanin content was determined according to the modified Harborne method [43]. Anthocyanins were extracted from fresh plant tissue by maceration in a methanol:HCl (99:1, v/v) solution at 4 °C for 24 h and then centrifuged (4000 rpm, 10 min). The quantification of anthocyanin was performed spectrophotometrically at 550 nm.
The tannin content was determined according to a modified method by Makkar et al. [44]. Briefly, 1.5 mL of plant extract was dissolved in methanol, in which the total flavonoids were determined, was mixed with 150 mg PVPP, vortexed, kept for 15 min at 4 °C, and then centrifuged (3000 rpm, 15 min). In the clear supernatant, the non-tannin phenolic absorption was recorded at 760 nm, and tannin content was calculated as a difference between total and non-tannin phenolic content.
The total phenolic content in extracts was determined with the Folin–Ciocalteu reagent [45]. A standard curve generated with 50, 100, 150, 200, 250, 300, 350, 400, and 500 mg/L of gallic acid was used for the calculation. A concentration of 2 mg/mL of plant extract was also prepared in methanol (1 mL) and mixed with 0.5 mL of a 10-fold dilute Folin–Ciocalteu reagent and 1 mL of 5% sodium carbonate. The tubes were covered with parafilm and allowed to stand for 30 min at room temperature before the absorbance was read spectrometrically at 725 nm.

2.9. Statistical Analysis

This study was arranged in factorial format with twelve treatments and ten replicates in a completely randomized design manner. All results were exposed to a two-way analysis of variance (ANOVA). Data were analyzed by using SPSS 16.0 software, and a mean comparison was conducted using Duncan’s multiple range test at p ≤ 0.05. The data in the tables were expressed as mean ± standard error, and in all figures, error bars and all tables, ± represents the standard errors of the means.

3. Results

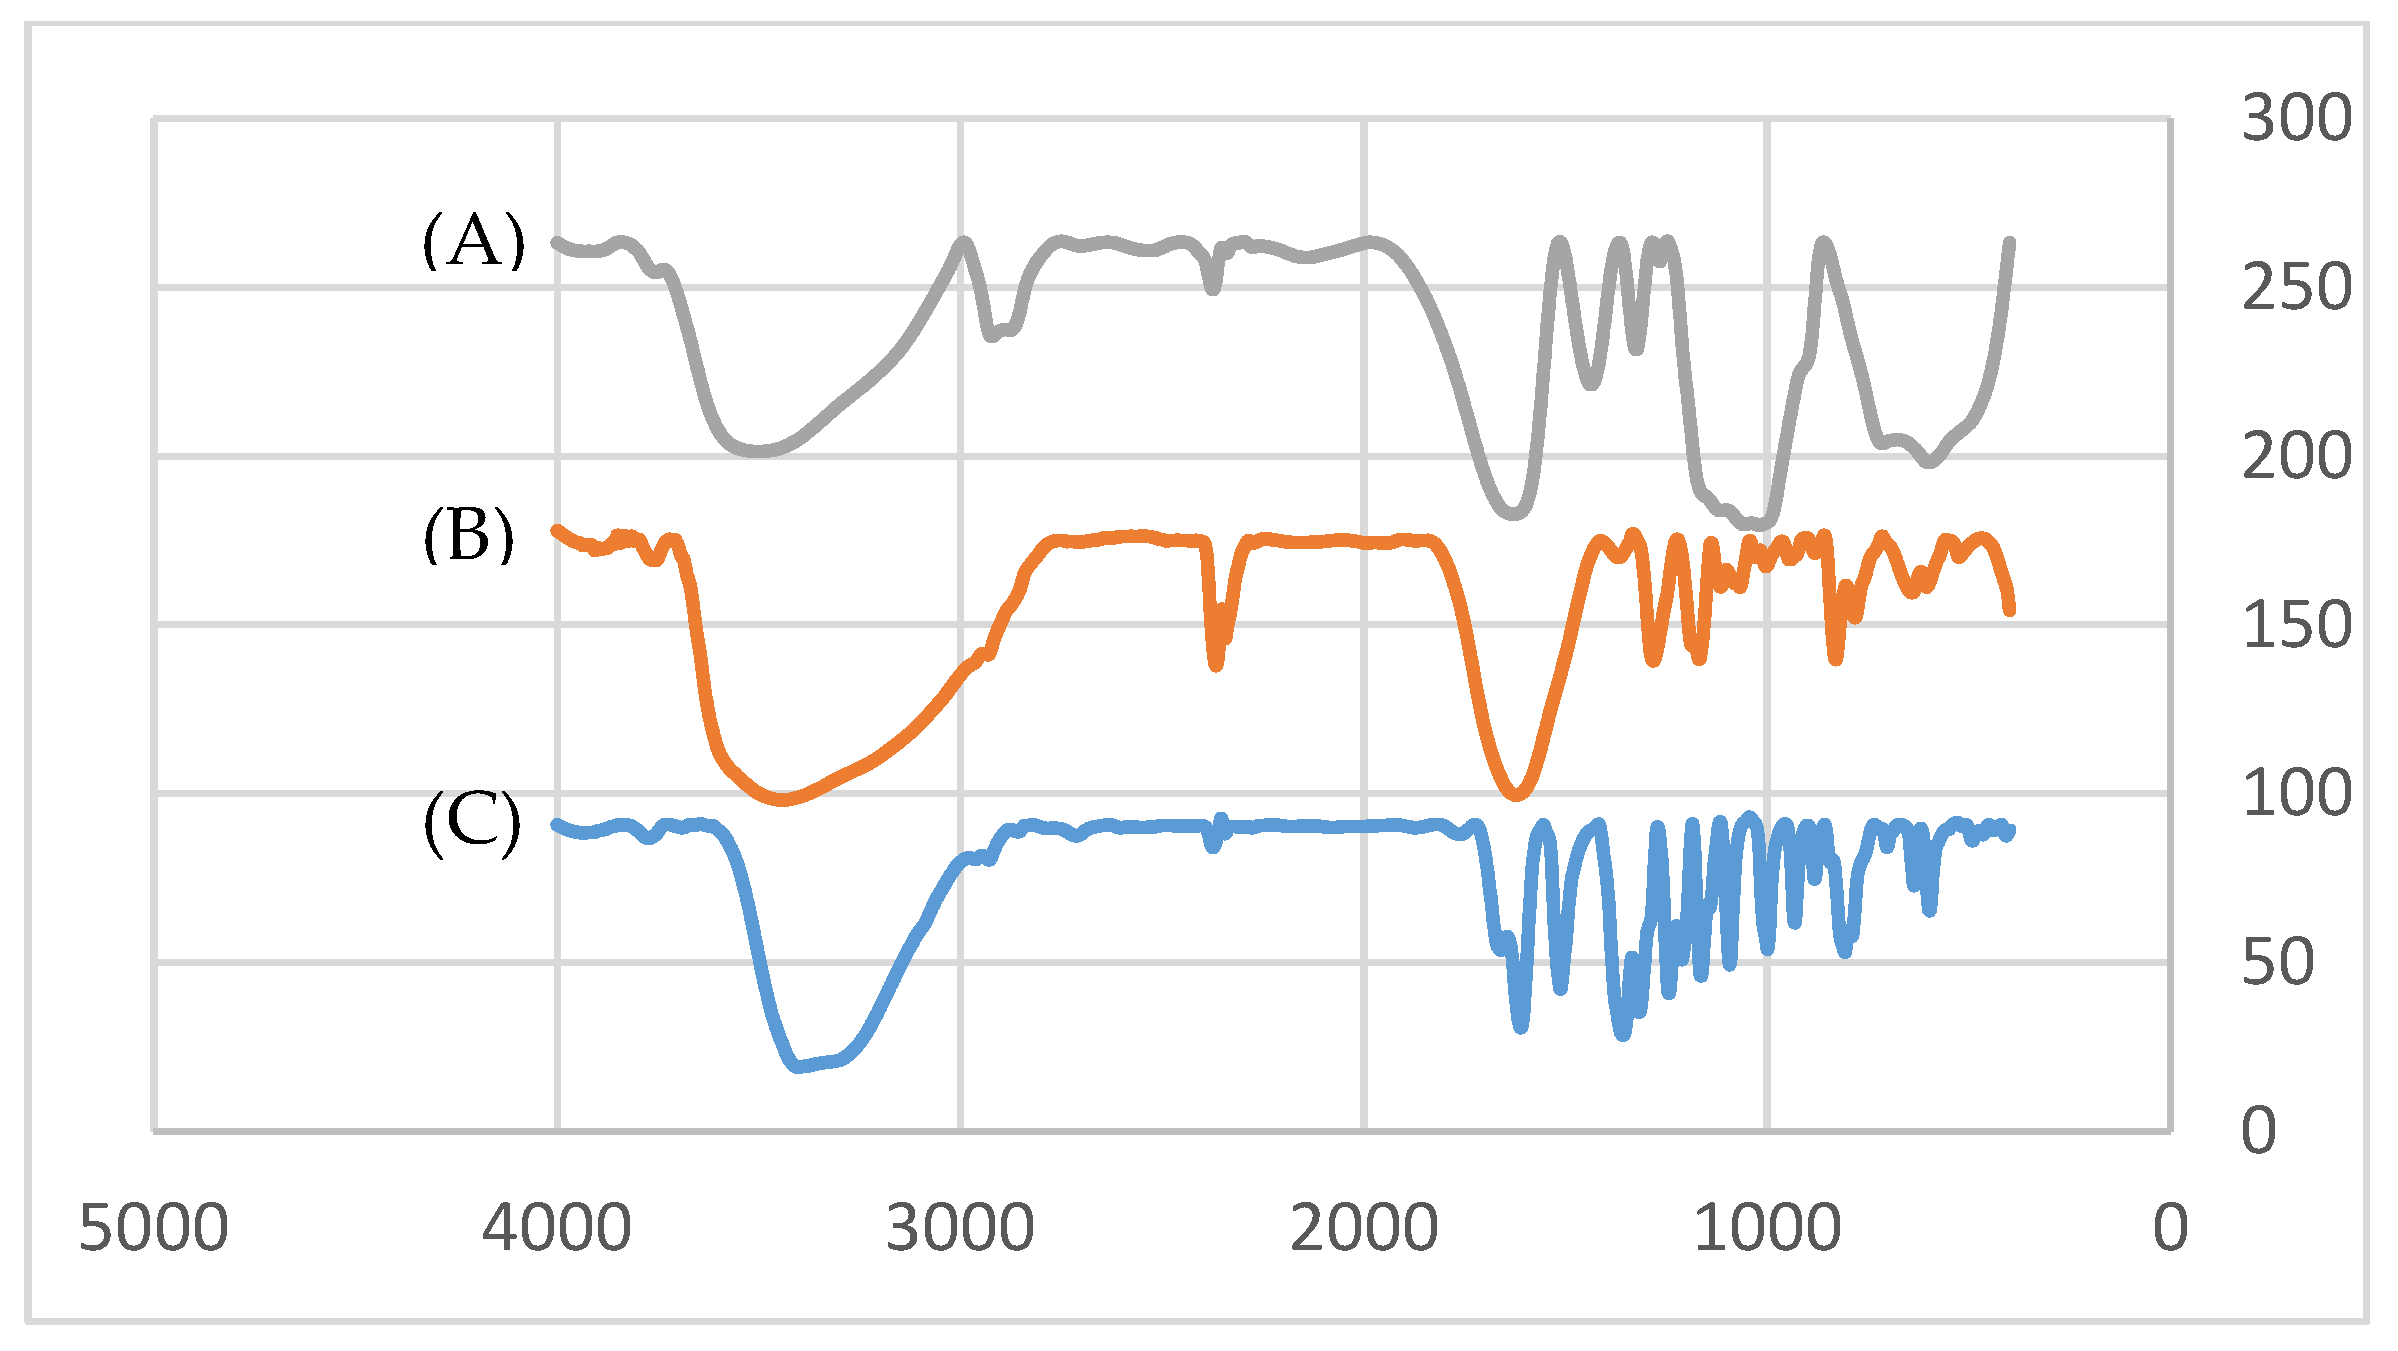
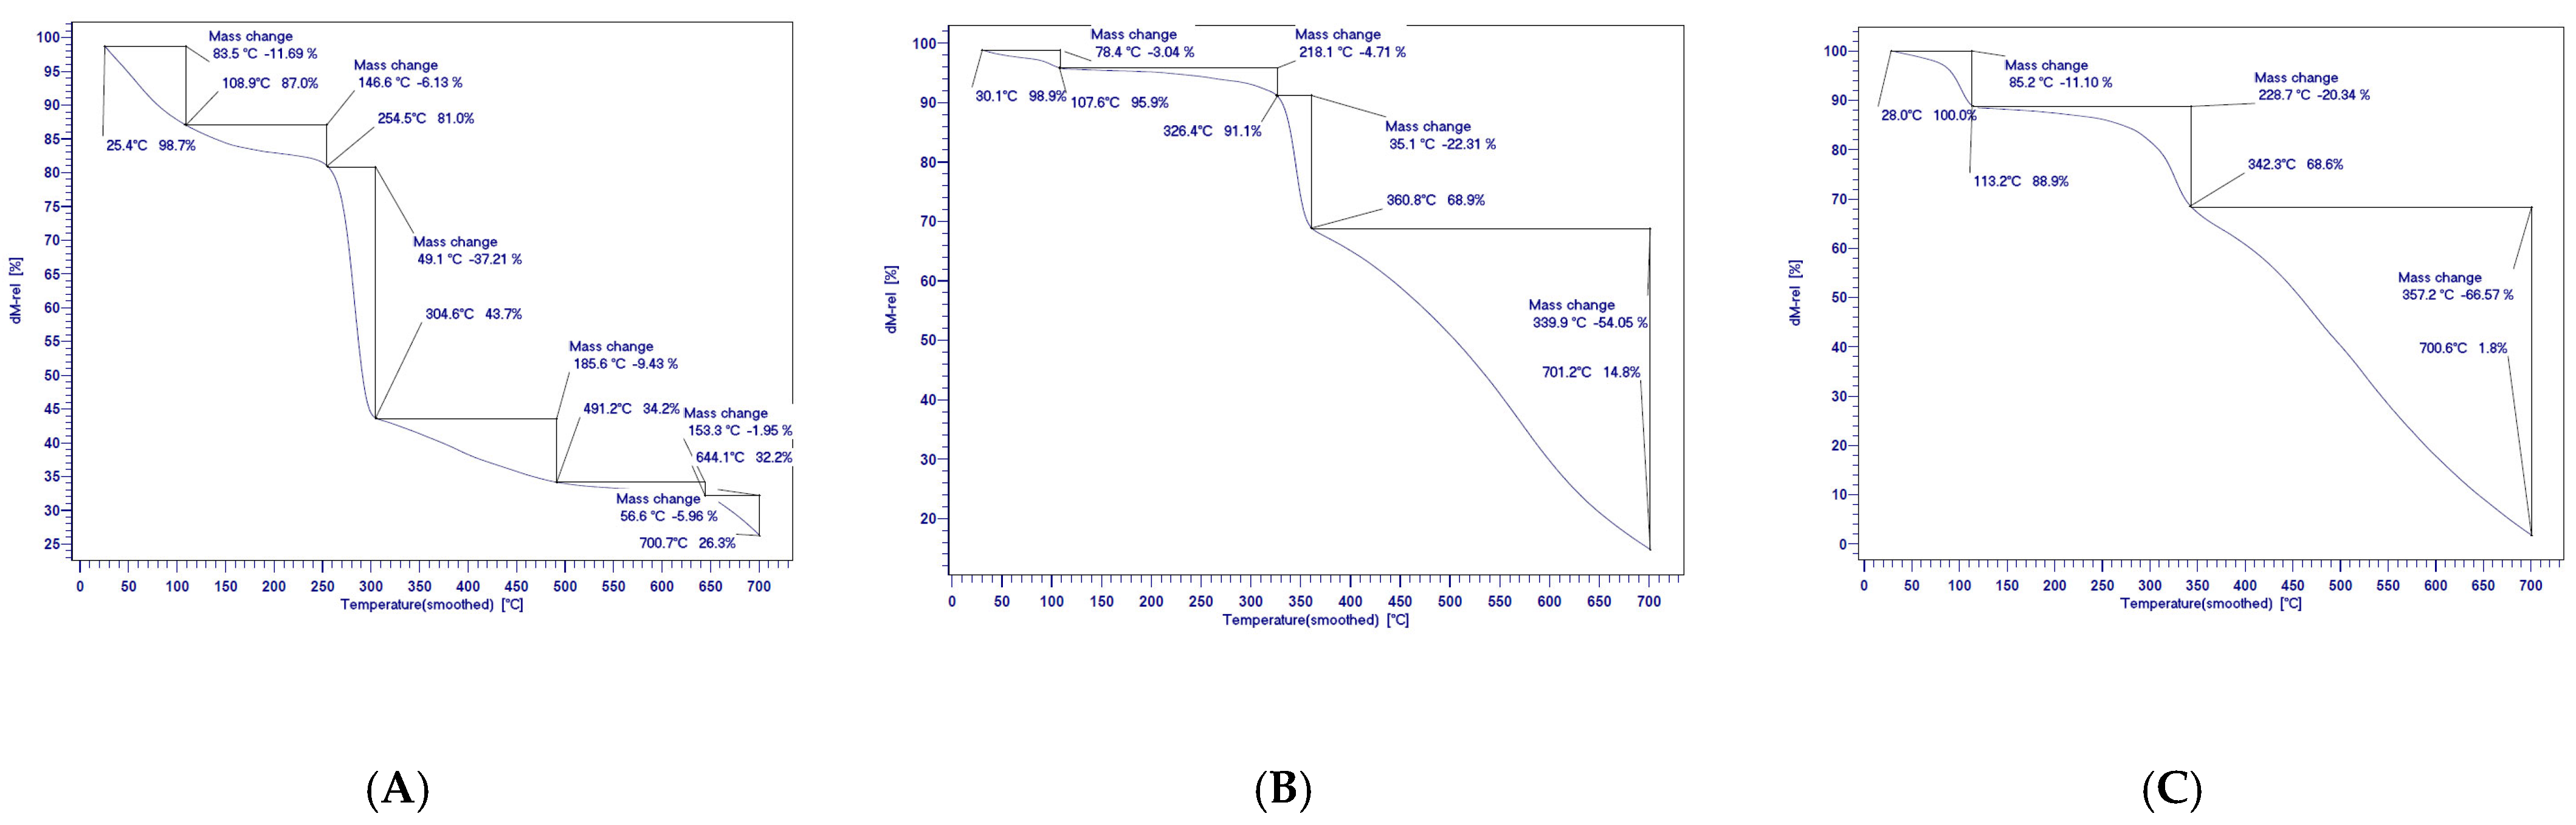
3.1. Synthesis and Characterization of Quercetin-Based Nanocomposites

The FTIR spectra for CMC, Qu, and QNCs are shown in Figure 1. The FTIR spectra of QNCs showed some characteristic peaks at 3401 (–OH stretching vibration) and 1611 cm−1 (C=O absorption) of Qu. However, the peak position slightly shifted, indicating intermolecular interaction between CMC and Qu. It was observed that the frequency of the carbonyl group (C=O) of QU shifted from 1623 cm−1 to 1611 cm−1 in the QNCs, and this is the reason for a hydrogen bond formation between Qu and CMC, which increased the length of the internal carbonyl bond and decreased its frequency. The characteristic peak for Qu shifted from 1370 cm−1 to 1358 cm−1 in the FTIR spectrum of QNCs, indicating the chemical interaction between the hydroxyl of CMC and the carbonyl of Qu.
One important factor in the study of nanoparticles is particle size. Figure 2 shows the particle size distribution obtained for QNCs using DLS. The average size of nanoparticles is 41.5 ± 2.7 nm. The number of particles with a size of 41.6 nm is more than other particles.
To evaluate the thermal stability of QNCs, a TGA test was performed and compared with the results obtained from TGA analysis for pure CMC powder and pure Qu. The TGA curve for CMC, Qu, and QNCs is shown in Figure 3. Five-stage degradation was observed for CMC (Figure 3A). The mild weight loss of less than 100 °C (first stage, about 11%) was related to the evaporation of absorbed moisture. Severe weight loss at a temperature of about 292 °C (third stage, 43%) and higher temperatures can also be attributed to carboxylation and degradation of the CMC structure. As shown in Figure 3, the temperature behavior of CMC in the QNCs changed. Four-stage degradation was observed for Qu (Figure 3B). There was a weight loss in the first stage (30 °C to 107 °C) that may be related to the removal of water that is physically absorbed. The second and third stages (108 ° C to 360 °C) may be related to the melting of Qu, the decomposition of the central C ring, or the loss of one of the two dihydroxylated rings, A and B. The final step, starting at 361 °C, can be attributed to the structural decomposition of Qu. The rate of weight loss increased with the increase in temperature. For QNCs, a weight loss of about 11% at 113 °C (first stage) was observed, relating to moisture removal (Figure 3C). Degradation of CMC and Qu in the range of 343 °C to 700 °C caused severe weight loss (about 66%) in the nanocomposites. The percentage of weight remaining in the QNCs was 1.8%. In the case of CMC and Qu, this value was 16.5% and 14.8%, respectively. These results indicated that Qu was combined with CMC and formed nanocomposites. Of course, the QNCs may have a more volatile nature, the weight of which has been reduced by heat. If the initial weight of the material is available, the weight of CMC and Qu in the nanocomposites can be calculated.
Morphological characteristics of the synthesized nanocomposite particles were imaged using electron microscopy (SEM) (Figure 4). The results showed that the nanocomposite particles were seen in irregular polyhedron shapes and sizes of less than 100 nm.

3.2. Effect of Qu and QNCs on Growth Parameters and RWC

Salt stress in 50, 100, and 150 mM concentrations decreased basil growth. Qu and QNCs treatments improved GP and shoot length at 0.01 mg/mL better than other concentrations (0.001 and 1 mg/mL) (Table 1). The decline rate of GP as well as shoot and root length was more obvious in 150 mM NaCl compared to the control (41%, 85%, and 97% decrease, respectively). The application of Qu and QNCs at 0.01 mg/mL significantly improved GP by 25% and 37.5%, respectively, and shoot length by 128.57% and 181%, respectively, under 150 mM NaCl, but no significant change was observed in root length.
Different concentrations of salt reduced the fresh and dry weight of the shoot, fresh and dry weight of roots, plant height, and RWC compared to untreated control plants, but the application of Qu and QNCs on salt-stressed plants increased this parameter (Figure 5). High salinity (150 mM NaCl) significantly decreased the fresh and dry weight of shoots (66.5% and 61%), fresh and dry weight of roots (61% and 86%), plant height (44.5%), and RWC (39%) compared to the non-saline conditions. Under the 150 mM NaCl condition, Qu and QNCs significantly increased the fresh weight of shoots by 44% and 61%, dry weight of roots by 115% and 155%, the plant height by 34% and 47%, and RWC by 17% and 16%, respectively, but no significant change was observed in shoot dry weight and root fresh weight (Figure 5).

3.3. Effect of Qu and QNCs on Photosynthetic Pigments and Gas Exchange Parameters

Chlorophyll a and chlorophyll b, total chlorophyll, and carotenoid content were improved with Qu and QNCs treatments under saline and non-saline conditions in basil plants. To contrast, 50, 100, and 150 mM of NaCl led to a notable decline in these parameters (Table 2). 150 mM of NaCl significantly decreased chlorophyll a by 63.5%, chlorophyll b by 50%, total chlorophyll by 59%, and carotenoid content by 51%. The application of Qu and QNCs decreased the negative effects of salt stress and significantly improved chlorophyll a by 56% and 83%, chlorophyll b by 26% and 52.5%, total chlorophyll by 46% and 28%, and carotenoid content by 37% and 86.5%, respectively, under 150 mM of NaCl (Table 2).
Severe salinity (150 mM NaCl) significantly increased minimum fluorescence and maximum fluorescence by 7% and 20.5%, and decreased Fv/Fm, SPAD, photosynthesis rate, and stomatal conductance by 11%, 33.5%, 71.5%, and 35.5%, respectively, relative to normal conditions. The exogenous application of Qu and QNCs significantly decreased minimum fluorescence by 15% and 26.69% and maximum fluorescence by 8% and 10%, respectively, and increased Fv/Fm by 6% and 12%, SPAD index by 23.5% and 27%, photosynthesis rate by 24% and 58%, and stomatal conductance by 23% and 49%, respectively, under 150 mM of NaCl (Table 2).

3.4. Effect of Qu and QNCs on Stress Markers and Compatible Solutes

Salinity caused the accumulation of malondialdehyde, proline, glycine betaine, and H2O2, promoting both electrolyte leakage in basil plants. However, applications of Qu and QNCs to plants under stress reversed this response on stress markers and increased it further in compatible solutes (Figure 6). With the induction of 150 mg/mL of NaCl, basil plants’ electrolyte leakage, malondialdehyde, H2O2, proline, and glycine betaine contents were substantially increased by 70%, 97%, 1361%, 357%, and 357%, respectively, relative to non-saline controls. Adding the Qu and QNCs to the nutrient solution significantly reduced electrolyte leakage by 9% and 15%, malondialdehyde by 60.5% and 61%, and H2O2 by 18% and 39.5%, respectively, and increased proline levels by 3.5%, and 5.5%, and glycine betaine levels by 7% and 14%, respectively, with exposure to 150 mM NaCl (Figure 6).

3.5. Effect of Qu and QNCs on Antioxidant Enzymes Activity

Plants use antioxidant systems to eliminate ROS. The application of Qu and QNCs protected the basil plants from oxidative stress by increasing the activity of antioxidant enzymes (CAT, APX, and PPO) under NaCl-stress conditions. CAT, APX, and PPO activities were increased under salinity-induced conditions (Figure 7). In our experiments, high salt (150 mM NaCl) exposure significantly increased CAT, APX, and PPO activity by 29%, 92.5%, and 75%, respectively, compared to normal conditions. Furthermore, exogenous Qu and QNCs significantly increased CAT, APX, and PPO activity under salt conditions so that Qu and QNCs increased CAT by 11.5% and 20% and APX by 24% and 43%, respectively, after exposure to 150 mM of NaCl. QNCs also significantly increased PPO activity (22%), but Qu had no significant effect on the activity of this enzyme under 150 mM of NaCl (Figure 7).

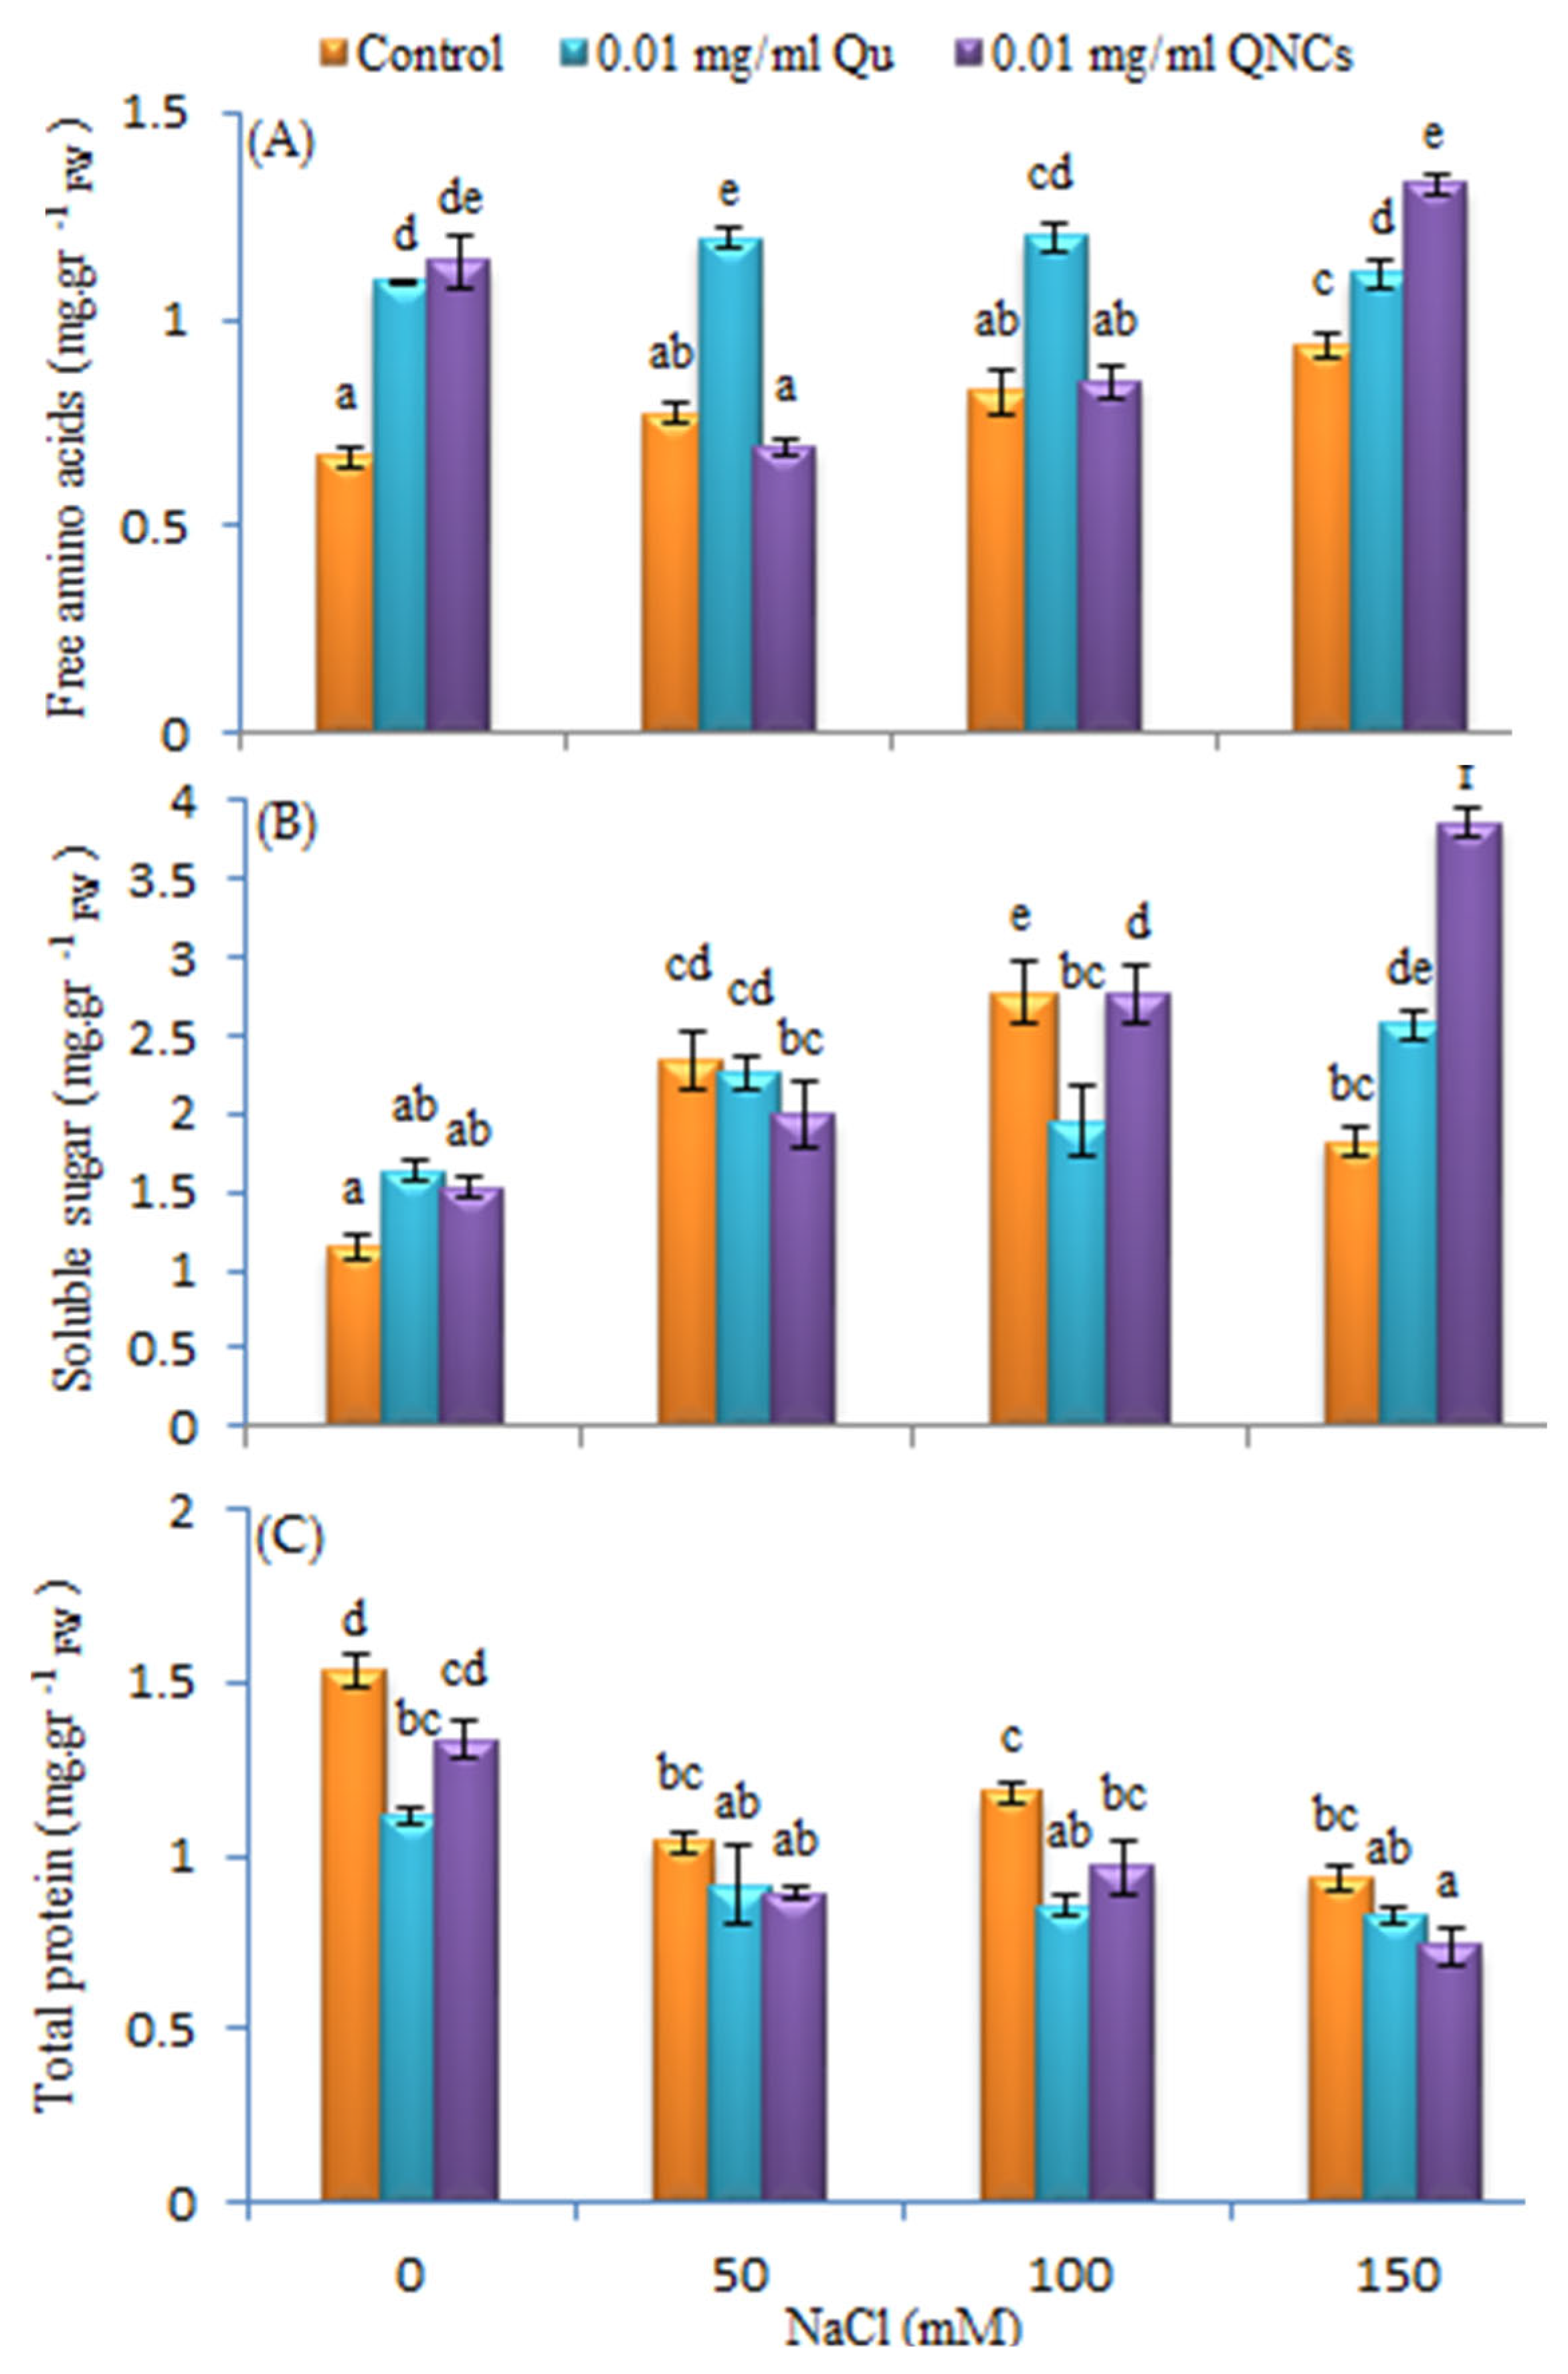
3.6. Effect of Qu and QNCs on Free Amino Acids, Soluble Sugar and Total Protein

Salt stress substantially increased both free amino acid and soluble sugar content, and decreased total protein content in the leaves of basil; the use of Qu and QNCs in salt stress conditions intensified these responses (Figure 8). 150 mg/mL of NaCl significantly increased free amino acid content by 41% and soluble sugar content by 58.5%, and decreased the total protein content by 15% compared to the non-saline control (Figure 8). However, the application of Qu and QNCs resulted in an increase in free amino acids by 18% and 41%, and total soluble carbohydrates by 41.5% and 112%, respectively, and further reduced the total protein content by 12% and 21%, respectively, under high salinity (Figure 8).

3.7. Effect of Qu and QNCs on Flavonoids, Anthocyanins, Tannins, and Phenols Content

Salinity increased total flavonoids, total anthocyanins, total phenols, and total tannins contents in basil plant leaves. Qu and QNCs application increased these parameters even further at different levels of NaCl (Figure 9). 150 mM of NaCl significantly increased flavonoids by 39%, anthocyanins by 32%, tannins by 50%, and phenols by 102%. In high saline conditions (150 mM NaCl), treatment with Qu and QNCs significantly increased flavonoids by 41% and 1%, tannins by 33% and 105%, and phenols content by 18% and 23%, respectively. Anthocyanins also increased significantly under QNCs impact (22%), but the effect of Qu on them was not significant in the 150 mM NaCl treatment (Figure 9).

4. Discussion

One of the typical results of salinity in plants is the reduction of water potential and osmotic stress [46]. Plant vegetative growth is sensitive to water deficiencies because growth is related to turgor, and loss of turgidity reduces cell enlargement and plant size. One sensitive step in plant growth is seed germination and seedling establishment [47]. In the present study, NaCl decreased the germination percentage of seeds and the growth rate of basil. The present results are in agreement with the earlier work of Silva et al. [48], who suggested that basil plants are sensitive to salt stress. The inhibitory impact of NaCl on seed germination may be due to osmotic inhibition, which reduces the seed’s ability to absorb water, Na+ and Cl- ion toxicity, and also impaired absorption of nutrient ions such as Ca2+ and K+ [49]. Ismail et al. [50] reported that the exogenous application of rutin enhances K+ preservation and boosts the rate of Na+ exit from the cell, thus reducing the harmful effects of salinity on bean plants. Based on our results, Qu and QNCs play a critical role in triggering the germination percentage and growth traits under healthy and stressful environments, and researchers suggested that this might be due to a Qu-induced lower ratio of Na+/K+ [24]. Qu and QNCs may be able to improve the cytosolic Na+/K+ ratio by improving the K+ retention and increasing the Na+ efflux from the cell, which plays a key role in salinity stress tolerance. In concordance with our results, Parvin et al. [15] showed that the external application of Qu improves tomato biomass accumulation and seedling growth under salinity and non-salinity stress conditions. Moreover, studies on Apocynum venetum and Apocynum pictum have shown that Qu alleviated the osmotic stress-induced inhibitory effect during seed germination [51].
In response to salinity stress, osmotic adjustment is a physiological adaptation that can be induced by the synthesis of compatible solutes or osmolytes such as proline, glycine betaine, amino acids, and soluble sugar to reduce the osmotic potential. The main function of osmolytes is to sustain cell turgor and thus maximize water uptake [52,53]. Proline and glycine betaine act as cellular osmotic protectors and molecular chaperones to regulate osmosis, inhibit ROS, and stabilize macromolecules, DNA, membranes, and cellular structures; soluble sugar boosts the biosynthesis of proline and function of antioxidant enzymes, which leads to stress-ameliorating results [54,55,56]. In our study, salinity increased the accumulation of proline, glycine betaine, amino acids, and soluble sugar. Also, Qu and QNCs treatments further increased proline, glycine betaine, amino acids, and soluble sugar contents under normal and salinity stress conditions in basil plants. Excessive accumulation of compatible solutes increases water absorption by increasing osmotic pressure, which maintains cell volume and positively affects physiological processes such as photosynthesis and stomatal conductance; it also increases plant growth and toleration to salt stress [57]. In agreement with our findings, researchers showed that Qu increased the proline concentration under salinity stress in tomatoes, which reduced the osmotic stress induced by NaCl [15]. Naringenin application improved the content of glycine betaine and soluble sugar in bean and safflower plants, respectively, under salt stress [58,59]. In this study, salinity reduced RWC, but Qu- and QNCs-treated plants showed higher RWC levels than untreated plants, which indicates that the application of Qu and QNCs plays a significant role in both sustaining excellent water relations and increasing the salinity tolerance of basil plants. The increase in water retention in plants treated with Qu and QNC may be due to the increased content of osmolytes and improved root growth. Parvin et al. [15,60] reported stress-induced lower RWC levels, and Qu and coumarin induced higher RWC levels in tomato plants under salinity.
Excessive concentrations of Na+ with osmotic stress leads to the generation of ROS in cells, inducing oxidation and considerable damage to proteins, DNA, and membranes, as well as decreased growth [61]. The reaction of free radicals with membrane lipids leads to the accumulation of more ROS—especially H2O2—in plants, which leads to lipid peroxidation, damages the membrane system, and thus increases both the content of malondialdehyde and electrolyte leakage [62]. In the present study, salt stress increased enzymatic and non-enzymatic antioxidants, H2O2, malondialdehyde content, and electrolyte leakage, indicating severe oxidative stress. Antioxidant systems, including enzymatic and non-enzymatic antioxidants such as ascorbate peroxidase (APX), catalase (CAT), superoxide dismutase (SOD), ascorbic acid (AsA), carotenoids, glutathione, and phenolic compounds are in plant cells [63]. The role of Qu as an antioxidant compound and ROS scavenger of the plant cell has been studied many years ago. Qu plays a consequential role in reducing ROS concentration and lipid peroxidation, increasing the function of physiological parameters such as the synthesis of photosynthetic pigments and photosynthesis to tolerate environmental stress [24]. In our study, the activities of antioxidant enzymes (CAT, APX, and PPO) were noticeably increased by Qu and QNCs under salinity. Enhancing the gene expression and upregulation of ROS-sweeping enzymes using Qu scavenged the ROS in plant cells under stress conditions [15,51]. Researchers indicated that Qu reduced ROS generation and cell membrane impairment, and improved antioxidant enzyme activities, photosynthesis, and flavonol biosynthesis; as a result, it mitigated growth inhibition under osmotic stress in Apocynum venetum and Apocynum pictum [51]. Aslam et al. [64] also reported that Qu reduced H2O2 and other ROS levels in Trigonella corniculata, and decreased oxidative impairment by improving antioxidant enzyme activity under chromium-induced oxidative stress. The seedlings treated with Qu and QNCs in the present study exhibited electrolyte leakage, lipid peroxidation, malondialdehyde content, and H2O2 level reduction, and as a result, had an increased photosynthesis rate. These effects might reflect the increased activity of antioxidant enzymes. The present results are concordant with Parvin et al. [15], who demonstrated that the application of Qu remarkably decreased the ROS content, lipid peroxidation, malondialdehyde content, and electrolyte leakage in salt-treated tomatoes. In addition, Hatamipoor et al. [59] reported that naringenin treatment reduced the malondialdehyde and H2O2 content of Carthamus tinctorius seedlings subjected to salt stress relative to the untreated seedlings. Non-enzymatic defenses include compounds such as phenolic compounds, flavonoids, anthocyanins, tannins, and carotenoids [65]. Polyphenols have antioxidant properties that quench ROS by blocking some enzymes or chelating factors involved in free radical production, and as signaling molecules, have significant molecular and biochemical functions in the defense system [66]. According to our results, Qu and QNCs increase the content of these non-enzymatic antioxidants under salinity stress. Qu derivative application in wheat plants increases total antioxidant capacity and phenolic compounds content in saline conditions [66]. Similarly, the treatment of Sorghum bicolor with coumarin increased the phenolic content under saline conditions [67]. Improved stomatal conductivity by Qu and QNCs was also found in our results. H2O2 has a significant role in the ABA-signaling network and is necessary for closing stomata. Qu reduces the level of H2O2, and thus reduces stomata closure, which allows the plant to increase photosynthesis and withstand stress [24]. Qu reduces the level of H2O2 and diminishes stomatal closure in Ligustrum vulgare leaves, which helps the plants to tolerate salinity stress [68]. Also, Qu derivatives are reported to affect the signaling pathway of ABA and prevent the stomata from closing in tomatoes [69].
One of the main reasons for the limitation of photosynthesis in water shortage stress and salinity is the induction of stomatal closure, and consequently, the restriction of carbon dioxide entry and metabolic processes [70]. The results of the present study show that during salinity stress, the stomatal conductance and photosynthesis rate of basil leaves were significantly reduced. Salt stress also affects the structure and the activity of the photosynthetic apparatus components in plant leaves. The production of ethylene under salinity stress can reduce chlorophyll biosynthesis, activate chlorophyllase, and cause instability in protein-pigment complexes [68]. Shekhalipour et al. [65] also reported that the decomposition of beta-carotene and the reduction of zeaxanthin formation due to salinity decreased the carotenoid pigment content. In saline conditions, ROS reacts with chlorophyll and forms the triplet of chlorophyll, which can rapidly produce singlet oxygen, thus causing damage to photosynthetic complexes and impairing photosynthetic activity [71]. The reduction of chlorophyll and carotenoid content under salinity was also quite evident in our results. In addition, our results show that salinity increased chlorophyll fluorescence and decreased photosystem photochemical efficiency. An increase in minimum fluorescence and maximum fluorescence indicates the degradation and inactivation of the photosystem II electron transfer chain [72]. These conditions show a disorder of the light-collecting complex in photosystem II (LHCII), which ultimately reduces Fv. A reduction in Fv affects reducing the quantum efficiency of photosystem II (Fv/Fm) [73]. Photosystem II photochemical efficiency reduction confirms that PSII physiological functions—and consequently photosynthesis—were limited in the high salt stress [74]. External application of Qu and QNCs in this study significantly increases stomatal conductance, photosynthesis rate, and chlorophyll content under saline conditions. The Qu location in the outer chloroplast envelope membrane indicates its photoprotection roles via activating UV-B screening compounds and ROS scavengers [75]. Qu also may lead to increased transfer energy from PSII to PSI by the changes in thylakoid membrane fluidity, and improves the process of photosynthesis [73]. An increase in chlorophyll content may be related to stimulating chlorophyll synthesis and preventing its degradation due to the free radicals reduction and the increase in the stability of photosynthetic reaction centers because of Qu [75]. Jańczak-Pieniążek et al. [66] showed increased production of chlorophylls, increased photosynthesis rate, and increased stomatal conductance by the Qu-copper complex under salinity, and suggested that this might be due to a Qu-induced lower Na+/K+ ratio and ROS production in wheat plants. In addition, Qu and QNCs incited the chlorophyll fluorescence parameters in basil plants in different salt concentrations. The Fv/Fm is used for measuring the photochemical activity of the photosynthetic apparatus, and an increase in the Fv/Fm ratio indicates an increase in photosynthesis efficiency [66]. The study by Migut et al. [14] showed that the chlorophyll content, Fv/Fm chlorophyll fluorescence parameter, and photosynthesis rate all increased due to the external application of Qu in maize under normal conditions.
Our results showed that QNCs were more effective than Qu in improving physiological and biochemical parameters. Its reason may be better absorption and transport of QNCs than Qu. Due to the high mobility of nanoparticles, their transfer to all parts of the plant is rapid. In addition, the small size and high surface-to-volume ratio of QNCs make them more available than Qu [76].

5. Conclusions

In this experiment, we observed that the preservation and survival of the basil plant under salinity stress can be provided by phenolic compounds such as Qu and QNCs. Additionally, QNCs seem to have played a better role than Qu. Qu and QNCs played a significant role as a potential stress-relieving agent used in saline conditions, mitigating the ionic, osmotic, and oxidative stress generated by salinity. Our results showed that the application of Qu and QNCs in a nutrient solution increased the growth of basil by maintaining higher photosynthetic pigments and raising photosynthetic capacity. Qu and QNCs also enhanced enzymatic and non-enzymatic antioxidant contents and reduced stress markers in leaves, thus decreasing oxidative damage under stress conditions. Qu and QNCs increased the compatible solute content in plants under salinity stresses, which is involved in osmotic stress tolerance. In addition, Qu and QNCs may maintain ionic balance and reduce ion toxicity by minimizing Na+ uptake, increasing intracellular Na+ sequestration, and improving the cytosolic Na+/K+ ratio. The results of this research are exciting, and due to the biodegradability and biocompatibility of QNCs and their ability to be prepared in large volumes, they can be used as potential and efficient bio-components and nutritional supplements in basil plant farms in saline areas to manage crop production. Of course, the exact effect of QNCs on all of the plant’s physiological, biochemical, and phytochemical activities needs further research.

Author Contributions

Conceptualization, H.A., A.S. and S.M.R.; Methodology, H.A. and S.M.R. and M.K.; Formal analysis, H.A.; Investigation, H.A., A.S. and S.M.R.; Writing—original draft preparation, H.A. and S.M.R.; Writing—review and editing, H.A., A.S. and S.M.R.; Visualization, H.A. and M.K.; Supervision, A.S. and S.M.R. All authors have read and agreed to the published version of the manuscript.

Funding

This research received no external funding.

Institutional Review Board Statement

Not applicable.

Informed Consent Statement

Not applicable.

Data Availability Statement

The data presented in this study are available on request from the corresponding author.

Acknowledgments

The authors wish to thank the Biotechnology laboratory, Faculty of Science, Mohaghegh Ardabili University, Iran for providing laboratory space and equipment.

Conflicts of Interest

The authors declare that they have no known competing financial interest or personal relationships that could have appeared to influence the work reported in this paper.

References

  1. Maghsodi, M.; Najafi, N. Effects of Nanomaterial Overdose in Plant Nutrition. J. Land Manag. 2019, 6, 179–195. [Google Scholar]
  2. Ashfaq, M.; Talreja, N.; Chuahan, D.; Srituravanich, W. Polymeric Nanocomposite-Based Agriculture Delivery System: Emerging Technology for Agriculture. In Genetic Engineering: A Glimpse of Techniques and Applications; Intechopen: London, UK, 2020; pp. 1–16. [Google Scholar]
  3. Nair, R.; Varghese, S.H.; Nair, B.G.; Maekawa, T.; Yoshida, Y.; Kumar, D.S. Nanoparticulate material delivery to plants. Plant Sci. 2010, 179, 154–163. [Google Scholar] [CrossRef]
  4. Kumar, R.; Ashfaq, M.; Verma, N. Synthesis of novel PVA–starch formulation-supported Cu–Zn nanoparticle carrying carbon nanofibers as a nanofertilizer: Controlled release of micronutrients. J. Mater. Sci. 2018, 53, 7150–7164. [Google Scholar] [CrossRef]
  5. Jarosiewicz, A.; Tomaszewska, M. Controlled-release NPK fertilizer encapsulated by polymeric membranes. J. Agric. Food Chem. 2003, 51, 413–417. [Google Scholar] [CrossRef]
  6. Paul, D.R.; Robeson, L.M. Polymer nanotechnology: Nanocomposites. Polymer 2008, 49, 3187–3204. [Google Scholar] [CrossRef] [Green Version]
  7. Farrag, Y.; Ide, W.; Montero, B.; Rico, M.; Rodríguez-Llamazares, S.; Barral, L.; Bouza, R. Preparation of starch nanoparticles loaded with quercetin using nanoprecipitation technique. Int. J. Biol. Macromol. 2018, 114, 426–433. [Google Scholar] [CrossRef]
  8. Shi, J.; Kantoff, P.W.; Wooster, R.; Farokhzad, O.C. Cancer nanomedicine: Progress, challenges and opportunities. Nat. Rev. Cancer 2017, 17, 20–37. [Google Scholar] [CrossRef] [Green Version]
  9. Roy, A.; Singh, S.K.; Bajpai, J.; Bajpai, A.K. Controlled pesticide release from biodegradable polymers. Cent. Eur. J. Chem. 2014, 12, 453–469. [Google Scholar] [CrossRef]
  10. Wang, W.; Wang, A. Nanocomposite of carboxymethyl cellulose and attapulgite as a novel pH-sensitive superabsorbent: Synthesis, characterization and properties. Carbohydr. Polym. 2010, 82, 83–91. [Google Scholar] [CrossRef]
  11. Xu, Y.; Ma, X.Y.; Gong, W.; Li, X.; Huang, H.B.; Zhu, X.M. Nanoparticles based on carboxymethylcellulose-modified rice protein for efficient delivery of lutein. Food Funct. 2020, 11, 2380–2394. [Google Scholar] [CrossRef]
  12. Heiba, H.F.; Taha, A.A.; Mostafa, A.R.; Mohamed, L.A.; Fahmy, M.A. Synthesis and characterization of CMC/MMT nanocomposite for Cu2+ sequestration in wastewater treatment. Korean J. Chem. Eng. 2018, 35, 1844–1853. [Google Scholar] [CrossRef]
  13. Saber-Samandari, S.; Saber-Samandari, S.; Heydaripour, S.; Abdouss, M. Novel carboxymethyl cellulose based nanocomposite membrane: Synthesis, characterization and application in water treatment. J. Environ. Manag. 2016, 166, 457–465. [Google Scholar] [CrossRef]
  14. Migut, D.; Jańczak-Pieniążek, M.; Piechowiak, T.; Buczek, J.; Balawejder, M. Physiological response of maize plants (Zea mays l.) to the use of the potassium quercetin derivative. Int. J. Mol. Sceinces 2021, 22, 7384. [Google Scholar] [CrossRef] [PubMed]
  15. Parvin, K.; Hasanuzzaman, M.; Bhuyan, M.H.M.; Mohsin, S.M.; Fujita, M. Quercetin mediated salt tolerance in tomato through the enhancement of plant antioxidant defense and glyoxalase systems. Plants 2019, 8, 247. [Google Scholar] [CrossRef] [Green Version]
  16. Pralhad, T.; Rajendrakumar, K. Study of freeze-dried quercetin–cyclodextrin binary systems by DSC, FT-IR, X-ray diffraction and SEM analysis. J. Pharm. Biomed. Anal. 2004, 34, 333–339. [Google Scholar] [CrossRef]
  17. Ratnam, D.V.; Ankola, D.D.; Bhardwaj, V.; Sahana, D.K.; Kumar, M.R. Role of antioxidants in prophylaxis and therapy: A pharmaceutical perspective. J. Control. Release 2006, 113, 189–207. [Google Scholar] [CrossRef] [PubMed]
  18. Cadena, P.G.; Pereira, M.A.; Cordeiro, R.B.; Cavalcanti, I.M.; Neto, B.B.; Maria do Carmo, C.B.; Santos-Magalhães, N.S. Nanoencapsulation of quercetin and resveratrol into elastic liposomes. Biochim. Et Biophys. Acta (BBA)-Biomembr. 2013, 1828, 309–316. [Google Scholar] [CrossRef] [PubMed] [Green Version]
  19. Dehghani-Samani, J.; Ghasemi Pirbalouti, A.; Malekpoor, F.; Rajabzadeh, F. Chemical composition and yield of essential oil from two sweet basil species (Ocimum ciliatum L. and O. basilicum L.) under different fertilizers. J. Med. Herbs 2021, 12, 27–33. [Google Scholar]
  20. Tolay, I. The impact of different Zinc (Zn) levels on growth and nutrient uptake of Basil (Ocimum basilicum L.) grown under salinity stress. PLoS ONE 2021, 16, e0246493. [Google Scholar] [CrossRef]
  21. De Azevedo Neto, A.D.; Menezes, R.V.; Gheyi, H.R.; Costa Conceicao Silva, P.; Cova, A.M.W.; Ribas, R.F.; de Oliveira Ribeiro, M. Salt-induced changes in solutes, pigments and essential oil of two basil (Ocimum basilicum L.) genotypes under hydroponic cultivation. Aust. J. Crop Sci. 2019, 13, 1856–1864. [Google Scholar] [CrossRef]
  22. Hasanuzzaman, M.; Nahar, K.; Alam, M.M.; Bhuyan, M.B.; Oku, H.; Fujita, M. Exogenous nitric oxide pretreatment protects Brassica napus L. seedlings from paraquat toxicity through the modulation of antioxidant defense and glyoxalase systems. Plant Physiol. Biochem. 2018, 126, 173–186. [Google Scholar] [CrossRef]
  23. Quan, N.T.; Anh, L.H.; Khang, D.T.; Tuyen, P.T.; Toan, N.P.; Minh, T.N.; Xuan, T.D. Involvement of secondary metabolites in response to drought stress of rice (Oryza sativa L.). Agriculture 2016, 6, 23. [Google Scholar] [CrossRef] [Green Version]
  24. Singh, P.; Arif, Y.; Bajguz, A.; Hayat, S. The role of quercetin in plants. Plant Physiol. Biochem. 2021, 166, 10–19. [Google Scholar] [CrossRef]
  25. Joshi, P.N.; Wangnoo, S.; Louis, M. Carboxymethyl cellulose based multifunctional targeted drug delivery platform for pancreatic cancer: Nanotheranostic potential and biocompatibility analysis. World J. Pharm. Sci. 2015, 3, 1347–1359. [Google Scholar]
  26. ISTA. International Rules for Seed Testing; International Seed Testing Association (ISTA): Wallisellen, Switzerland, 2010. [Google Scholar]
  27. Taiz, L.; Zeiger, E.; Møller, I.M.; Murphy, A. Plant Physiology and Development, 6th ed.; Sinauer Associates Incorporated: Sunderland, CT, USA, 2015. [Google Scholar]
  28. Ritchie, S.W.; Nguyen, H.T.; Holaday, A.S. Leaf water content and gas-exchange parameters of two wheat genotypes differing in drought resistance. Crop Sci. 1990, 30, 105–111. [Google Scholar] [CrossRef]
  29. Arnon, D.I. Copper enzymes in isolated chloroplasts. Polyphenoloxidase in Beta vulgaris. Plant Physiol. 1949, 24, 1. [Google Scholar] [CrossRef] [PubMed] [Green Version]
  30. ALKahtani, M.D.; Attia, K.A.; Hafez, Y.M.; Khan, N.; Eid, A.M.; Ali, M.A.; Abdelaal, K.A. Chlorophyll fluorescence parameters and antioxidant defense system can display salt tolerance of salt acclimated sweet pepper plants treated with chitosan and plant growth promoting rhizobacteria. Agronomy 2020, 10, 1180. [Google Scholar] [CrossRef]
  31. Lutts, S.; Kinet, J.M.; Bouharmont, J. NaCl-induced senescence in leaves of rice (Oryza sativa L.) cultivars differing in salinity resistance. Ann. Bot. 1996, 78, 389–398. [Google Scholar] [CrossRef]
  32. Stewart, R.R.; Bewley, J.D. Lipid peroxidation associated with accelerated aging of soybean axes. Plant Physiol. 1980, 65, 245–248. [Google Scholar] [CrossRef] [Green Version]
  33. Alexieva, V.; Sergiev, I.; Mapelli, S.; Karanov, E. The effect of drought and ultraviolet radiation on growth and stress markers in pea and wheat. Plant Cell Environ. 2001, 24, 1337–1344. [Google Scholar] [CrossRef]
  34. Bates, L.S.; Waldren, R.P.; Teare, I.D. Rapid determination of free proline for water-stress studies. Plant Soil 1973, 39, 205–207. [Google Scholar] [CrossRef]
  35. Grieve, C.; Grattan, S. Rapid assay for determination of water soluble quaternary ammonium compounds. Plant Soil 1983, 70, 303–307. [Google Scholar] [CrossRef]
  36. Aebi, H. Catalase. In Methods of Enzymatic Analysis; Academic Press: New York, NY, USA, 1974; pp. 673–684. [Google Scholar]
  37. Nakano, Y.; Asada, K. Hydrogen peroxide is scavenged by ascorbate-specific peroxidase in spinach chloroplasts. Plant Cell Physiol. 1981, 22, 867–880. [Google Scholar]
  38. Raymond, J.; Rakariyatham, N.; Azanza, J.L. Purification and some properties of polyphenoloxidase from sunflower seeds. Phytochemistry 1993, 34, 927–931. [Google Scholar] [CrossRef]
  39. Bradford, M.M. A rapid and sensitive method for the quantitation of microgram quantities of protein utilizing the principle of protein-dye binding. Anal. Biochem. 1976, 72, 248–254. [Google Scholar] [CrossRef] [PubMed]
  40. Hwang, M.N.; Ederer, G.M. Rapid hippurate hydrolysis method for presumptive identification of group B streptococci. J. Clin. Microbiol. 1975, 1, 114–115. [Google Scholar] [CrossRef] [PubMed]
  41. Roe, H.; Joseph, H.R. The determination of sugar in blood and spinal fluid with anthrone reagent. J. Biol. Chem. 1955, 212, 335–343. [Google Scholar] [CrossRef]
  42. Zhishen, J.; Mengcheng, T.; Jianming, W. The determination of flavonoid contents in mulberry and their scavenging effects on superoxide radicals. Food Chem. 1999, 64, 555–559. [Google Scholar] [CrossRef]
  43. Martinez, A.E.; Favret, E.A. Anthocyanin synthesis and lengthening in the first leaf of barley isogenic lines. Plant Sci. 1990, 71, 35–43. [Google Scholar] [CrossRef]
  44. Makkar, H.P.S.; Bluemmel, M.; Borowy, N.K.; Becker, K. Gravimetric determination of tannins and their correlations with chemical and protein precipitation methods. J. Sci. Food Agric. 1993, 61, 161–165. [Google Scholar] [CrossRef]
  45. Pastrana-Bonilla, E.; Akoh, C.C.; Sellappan, S.; Krewer, G. Phenolic content and antioxidant capacity of muscadine grapes. J. Agric. Food Chem. 2003, 51, 5497–5503. [Google Scholar] [CrossRef] [PubMed]
  46. Kayacetin, F.; Efeoglu, B.; Alizadeh, B. Effect of NaCl and PEG-induced osmotic stress on germination and seedling growth properties in wild mustard (Sinapis arvensis L.). Anadolu Ege Tarımsal Araştırma Enstitüsü Derg. 2018, 28, 62–68. [Google Scholar]
  47. Zhang, M.; He, S.; Zhan, Y.; Qin, B.; Jin, X.; Wang, M.; Wu, Y. Exogenous melatonin reduces the inhibitory effect of osmotic stress on photosynthesis in soybean. PLoS ONE 2019, 14, e0226542. [Google Scholar] [CrossRef] [PubMed] [Green Version]
  48. Silva, T.I.D.; Silva, J.D.S.; Dias, M.G.; Martins, J.V.D.S.; Ribeiro, W.S.; Dias, T.J. Salicylic acid attenuates the harmful effects of salt stress on basil. Rev. Bras. Eng. Agrícola E Ambient. 2022, 26, 399–406. [Google Scholar] [CrossRef]
  49. Siddiqui, M.H.; Al-Whaibi, M.H.; Faisal, M.; Al Sahli, A.A. Nano-silicon dioxide mitigates the adverse effects of salt stress on Cucurbita pepo L. Environ. Toxicol. Chem. 2014, 33, 2429–2437. [Google Scholar] [CrossRef] [PubMed]
  50. Ismail, H.; Maksimović, J.D.; Maksimović, V.; Shabala, L.; Živanović, B.D.; Tian, Y.; Shabala, S. Rutin, a flavonoid with antioxidant activity, improves plant salinity tolerance by regulating K+ retention and Na+ exclusion from leaf mesophyll in quinoa and broad beans. Funct. Plant Biol. 2015, 43, 75–86. [Google Scholar] [CrossRef]
  51. Yang, J.; Zhang, L.; Jiang, L.; Zhan, Y.G.; Fan, G.Z. Quercetin alleviates seed germination and growth inhibition in Apocynum venetum and Apocynum pictum under mannitol-induced osmotic stress. Plant Physiol. Biochem. 2021, 159, 268–276. [Google Scholar] [CrossRef]
  52. Hmidi, D.; Abdelly, C.; Athar, H.U.R.; Ashraf, M.; Messedi, D. Effect of salinity on osmotic adjustment, proline accumulation and possible role of ornithine-δ-aminotransferase in proline biosynthesis in Cakile maritima. Physiol. Mol. Biol. Plants 2018, 24, 1017–1033. [Google Scholar] [CrossRef] [PubMed]
  53. Rasool, S.; Hameed, A.; Azooz, M.M.; Siddiqi, T.O.; Ahmad, P. Salt Stress: Causes, Types and Responses of Plants. In Ecophysiology and Responses of Plants Under Salt Stress; Springer: New York, NY, USA, 2013; pp. 1–24. [Google Scholar]
  54. Amist, N.; Singh, N.B. Responses of enzymes involved in proline biosynthesis and degradation in wheat seedlings under stress. Allelopath. J. 2017, 42, 195–206. [Google Scholar] [CrossRef]
  55. De la Torre-González, A.; Montesinos-Pereira, D.; Blasco, B.; Ruiz, J.M. Influence of the proline metabolism and glycine betaine on tolerance to salt stress in tomato (Solanum lycopersicum L.) commercial genotypes. J. Plant Physiol. 2018, 231, 329–336. [Google Scholar] [CrossRef]
  56. Sarkar, M.M.; Pradhan, N.; Subba, R.; Saha, P.; Roy, S. Sugar-terminated carbon-nanodots stimulate osmolyte accumulation and ROS detoxification for the alleviation of salinity stress in Vigna radiata. Sci. Rep. 2022, 12, 17567. [Google Scholar] [CrossRef] [PubMed]
  57. Khan, M.N.; Siddiqui, M.H.; Mohammad, F.; Naeem, M. Interactive role of nitric oxide and calcium chloride in enhancing tolerance to salt stress. Nitric Oxide 2012, 27, 210–218. [Google Scholar] [CrossRef] [PubMed]
  58. Ozfidan-Konakci, C.; Yildiztugay, E.; Alp, F.N.; Kucukoduk, M.; Turkan, I. Naringenin induces tolerance to salt/osmotic stress through the regulation of nitrogen metabolism, cellular redox and ROS scavenging capacity in bean plants. Plant Physiol. Biochem. 2020, 157, 264–275. [Google Scholar] [CrossRef]
  59. Hatamipoor, S.; Shabani, L.; Farhadian, S. Supportive effect of naringenin on NaCl-induced toxicity in Carthamus tinctorius seedlings. Int. J. Phytoremediat. 2023, 25, 889–899. [Google Scholar] [CrossRef]
  60. Parvin, K.; Hasanuzzaman, M.; Mohsin, S.M.; Nahar, K.; Fujita, M. Coumarin improves tomato plant tolerance to salinity by enhancing antioxidant defence, glyoxalase system and ion homeostasis. Plant Biol. 2021, 23, 181–192. [Google Scholar] [CrossRef]
  61. Alharbi, K.; Al-Osaimi, A.A.; Alghamdi, B.A. Sodium chloride (NaCl)-induced physiological alteration and oxidative stress generation in Pisum sativum (L.): A toxicity assessment. ACS Omega 2022, 7, 20819–20832. [Google Scholar] [CrossRef] [PubMed]
  62. Chen, L.; Liu, L.; Lu, B.; Ma, T.; Jiang, D.; Li, J.; Li, C. Exogenous melatonin promotes seed germination and osmotic regulation under salt stress in cotton (Gossypium hirsutum L.). PLoS ONE 2020, 15, e0228241. [Google Scholar] [CrossRef] [Green Version]
  63. Baskar, V.; Venkatesh, R.; Ramalingam, S. Flavonoids (Antioxidants Systems) in Higher Plants and Their Response to Stresses. In Antioxidants and Antioxidant Enzymes in Higher Plants; Springer: Cham, Switzerland, 2018; pp. 253–268. [Google Scholar]
  64. Aslam, M.A.; Ahmed, S.; Saleem, M.; Shah, A.A.; Shah, A.N.; Tanveer, M.; Khan, J. Quercetin ameliorates chromium toxicity through improvement in photosynthetic activity, antioxidative defense system; and suppressed oxidative stress in Trigonella corniculata L. Front. Plant Sci. 2022, 13, 956249. [Google Scholar] [CrossRef]
  65. Sheikhalipour, M.; Esmaielpour, B.; Behnamian, M.; Gohari, G.; Giglou, M.T.; Vachova, P.; Skalicky, M. Chitosan–Selenium Nanoparticle (Cs–Se NP) Foliar Spray Alleviates Salt Stress in Bitter Melon. Nanomaterials 2021, 11, 684. [Google Scholar] [CrossRef]
  66. Jańczak-Pieniążek, M.; Migut, D.; Piechowiak, T.; Buczek, J.; Balawejder, M. The Effect of Exogenous Application of Quercetin Derivative Solutions on the Course of Physiological and Biochemical Processes in Wheat Seedlings. Int. J. Mol. Sci. 2021, 22, 6882. [Google Scholar] [CrossRef]
  67. Sultana, R.; Wang, X.; Azeem, M.; Hussain, T.; Mahmood, A.; Fiaz, S.; Qasim, M. Coumarin-mediated growth regulations, antioxidant enzyme activities, and photosynthetic efficiency of Sorghum bicolor under saline conditions. Front. Plant Sci. 2022, 13, 799404. [Google Scholar] [CrossRef] [PubMed]
  68. Agati, G.; Biricolti, S.; Guidi, L.; Ferrini, F.; Fini, A.; Tattini, M. The biosynthesis of flavonoids is enhanced similarly by UV radiation and root zone salinity in L. vulgare leaves. J. Plant Physiol. 2011, 168, 204–212. [Google Scholar] [CrossRef] [PubMed]
  69. Watkins, J.M.; Hechler, P.J.; Muday, G.K. Ethylene-induced avonol accumulation in guard cells suppresses reactive oxygen species and moderates stomatal aperture. Plant Physiol. 2014, 164, 1707–1717. [Google Scholar] [CrossRef] [Green Version]
  70. El-Sayed, A.I.; El-Hamahmy, M.A.M.; Rafudeen, M.S.; Ebrahim, M.K.H. Exogenous spermidine enhances expression of Calvin cycle genes and photosynthetic efficiency in sweet sorghum seedlings under salt stress. Biol. Plant. 2019, 63, 511–518. [Google Scholar]
  71. Sharma, A.; Shahzad, B.; Rehman, A.; Bhardwaj, R.; Landi, M.; Zheng, B. Response of phenylpropanoid pathway and the role of polyphenols in plants under abiotic stress. Molecules 2019, 24, 2452. [Google Scholar] [CrossRef] [PubMed] [Green Version]
  72. Fatma, M.; Asgher, M.; Masood, A.; Khan, N.A. Excess sulfur supplementation improves photosynthesis and growth in mustard under salt stress through increased production of glutathione. Environ. Exp. Bot. 2014, 107, 55–63. [Google Scholar] [CrossRef]
  73. Hniličková, H.; Hnilička, F.; Martinkova, J.; Kraus, K. Effects of salt stress on water status, photosynthesis and chlorophyll fluorescence of rocket. Plant Soil Environ. 2017, 63, 362–367. [Google Scholar] [CrossRef] [Green Version]
  74. Shin, Y.K.; Bhandari, S.R.; Jo, J.S.; Song, J.W.; Cho, M.C.; Yang, E.Y.; Lee, J.G. Response to salt stress in lettuce: Changes in chlorophyll fluorescence parameters, phytochemical contents, and antioxidant activities. Agronomy 2023, 10, 1627. [Google Scholar] [CrossRef]
  75. Dobrikova, A.G.; Apostolova, E.L. Damage and protection of the photosynthetic apparatus from UV-B radiation. II. Effect of quercetin at different pH. J. Plant Physiol. 2015, 184, 98–105. [Google Scholar] [CrossRef]
  76. Chichiriccò, G.; Poma, A. Penetration and Toxicity of Nanomaterials in Higher Plants. Nanomaterials 2015, 5, 851–873. [Google Scholar] [CrossRef]
Figure 1. Fourier transform infrared spectrometer (FTIR) spectrum: Carboxymethyl cellulose (CMC) (A), Quercetin (Qu) (B) and Qu−based nanocomposites (QNCs) (C).
Sustainability 15 12059 g001
Figure 2. Dynamic light scattering (DLS) size distribution histogram of the as-prepared Qu−based nanocomposites (QNCs).
Sustainability 15 12059 g002
Figure 3. Thermogravimetric analysis (TGA) curves for carboxymethyl cellulose (CMC) (A), quercetin (Qu) (B) and Qu−based nanocomposites (QNCs) (C).
Sustainability 15 12059 g003
Figure 4. Scanning electron microscope (SEM) image of Qu−based nanocomposites (QNCs).
Sustainability 15 12059 g004
Figure 5. Effect of quercetin (Qu) and Qu−based nanocomposites (QNCs) (0.01 mg/mL) on some growth parameters of basil under salt stress (0, 50, 100 and 150 mM NaCl). (A) shoot fresh weight, (B) shoot dry weight, (C) root fresh weight, (D) root dry weight, (E) plant height, (F) relative water content (RWC). Means with similar letter(s) were non-significant (at p < 0.05) to each other. Error bars depict standard errors of the means (n = 10).
Sustainability 15 12059 g005
Figure 6. Effect of quercetin (Qu) and Qu−based nanocomposites (QNCs) (0.01 mg/mL) on stress markers and compatible solutes of basil under salt stress (0, 50, 100 and 150 mM NaCl). (A) electron leakage, (B) malondialdehyde, (C) hydrogen peroxide (H2O2), (D) proline, (E) glycine betaine. Means with similar letter(s) were non-significant (at p < 0.05) to each other. Error bars depict standard errors of the means (n = 10).
Sustainability 15 12059 g006
Figure 7. Effect of quercetin (Qu) and Qu−based nanocomposites (QNCs) (0.01 mg/mL) on some antioxidant enzyme activity of basil under salt stress (0, 50, 100 and 150 mM NaCl). (A) CAT, (B) APX, and (C) PPO. Means with similar letter(s) were non-significant (at p < 0.05) to each other. Error bars depict standard errors of the means (n = 10).
Sustainability 15 12059 g007
Figure 8. Effect of quercetin (Qu) and Qu−based nanocomposites (QNCs) (0.01 mg/mL) on some biochemical parameters of basil under salt stress (0, 50, 100 and 150 mM NaCl). (A) free amino acids, (B) soluble sugar, and (C) total protein. Means with similar letter(s) were non-significant (at p < 0.05) to each other. Error bars depict standard errors of the means (n = 10).
Sustainability 15 12059 g008
Figure 9. Effect of quercetin (Qu) and Qu−based nanocomposites (QNCs) (0.01 mg/mL) on some phytochemical parameters of basil under salt stress (0, 50, 100 and 150 mM NaCl). (A) total flavonoids, (B) anthocyanins, (C) total tannins, and (D) total phenols. Means with similar letter(s) were non-significant (at p < 0.05) to each other. Error bars depict standard errors of the means (n = 10).
Sustainability 15 12059 g009
Table 1. Effect of quercetin (Qu) and Qu−based nanocomposites (QNCs) (0, 0.001, 0.01 and 1 mg/mL) on some growth parameters of basil under salt stress (0, 50, 100 and 150 mM NaCl).
NaCl
(mM)
Qu QNCs
TreatmentsGP
(%)
Shoot Length
(cm)
Root Length
(cm)
TreatmentsGP
(%)
Shoot Length
(cm)
Root Length
(cm)
0Control90 ± 5.77 e14.3 ± 2.01 f40.36 ± 5.12 eControl90 ± 5.77 ef14.3 ± 2.01 f40.36 ± 5.12 e
0.001 mg/mL86.6 ± 8.81 d14 ± 0.82 f37 ± 2.33 de0.001 mg/mL90 ± 3.33 ef14.8 ± 0.93 f38 ± 2.63 de
0.01 mg/mL93.3 ± 3.33 d16.1 ± 0.72 g38.1 ± 1 de0.01 mg/mL96.6 ± 3.33 f16.3 ± 0.59 g45.8 ± 2.1 f
1 mg/mL63.3 ± 6.66 bc12.4 ± 0.54 ef20.33 ± 1.25 bc1 mg/mL63.3 ± 3.33 c12 ± 0.44 de30 ± 1.7 ef
50Control76.6 ± 6.66 cd11.8 ± 0.45 e28.1 ± 4.1 cdeControl76.6 ± 6.6 de11.8 ± 0.45 de33.8 ± 2.36 cde
0.001 mg/mL76.6 ± 8.81 cd12 ± 0.96 e31.2 ± 2.24 cd0.001 mg/mL80 ± 5.77 e12.5 ± 0.84 de39.8 ± 1.87 cd
0.01 mg/mL83.3 ± 6.66 d14 ± 0.64 f34.5 ± 0.94 de0.01 mg/mL90 ± 5.77 ef15.4 ± 0.74 e35.5 ± 3.5 cd
1 mg/mL60 ± 5.77 b9.6 ± 0.49 d3.8 ± 0.9 a1 mg/mL60 ± 5.77 bc10.6 ± 0.55 d15.7 ± 0.49 bc
100Control66.6 ± 8.81 c6.8 ± 1.1 cd6.3 ± 1.07 aControl66.6 ± 8/81 cd6.8 ± 1.1 bc8.5 ± 1.91 b
0.001 mg/mL70 ± 8.81 cd8 ± 0.29 d6.36 ± 1.13 ab0.001 mg/mL76.6 ± 3.3 cd7.3 ± 0.32 cd16.3 ± 0.92 ab
0.01 mg/mL76.6 ± 3.33 cd9.8 ± 0.64 d11.53 ± 2.31 ab0.01 mg/mL83.3 ± 3.33 e9.9 ± 0.71 d16.5 ± 2 ab
1 mg/mL56.6 ± 5.77 b4 ± 0.29 bc1.7 ± 0.7 a1 mg/mL56.6 ± 3.33 bc4.7 ± 0.37 bc4.7 ± 0.27 b
150Control53.3 ± 3.33 a2.1 ± 0.79 a1.3 ± 0.4 aControl53.3 ± 3.33 b2.1 ± 0.79 a1.3 ± 0.33 a
0.001 mg/mL63.3 ± 3.33 bc3 ± 0.57 b3.2 ± 0.57 a0.001 mg/mL53.3 ± 3.33 b3.2 ± 0.62 b3.2 ± 0.17 a
0.01 mg/mL66.6 ± 6.66 c4.8 ± 0.21 c1.7 ± 0.16 a0.01 mg/mL73.3 ± 3.33 d5.9 ± 0.29 c2.3 ± 0.27 a
1 mg/mL50 ± 3.33 a2.3 ± 0.1 a1.1 ± 0.25 a1 mg/mL46.6 ± 3.33 a2.5 ± 0.18 a1.8 ± 0.03 a
Different letters within each column indicate significant differences according to Duncan’s multiple-range test (p ≤ 0.05). All data are expressed as mean ± SE (standard error). GP = germination percentage, mM = millimolar.
Table 2. Effect of quercetin (Qu) and Qu−based nanocomposites (QNCs) (0.01 mg/mL) on photosynthetic and gas exchange parameters of basil under salt stress (0, 50, 100 and 150 mM NaCl).
NaCl
(mM)
TreatmentsChlorophyll a (mg g−1 FW)Chlorophyll b (mg g−1 FW)Total Chlorophyll
(mg g−1 FW)
Carotenoids
(µg g−1 FW)
Minimum
Fluorescence
Maximum
Fluorescence
Fv/FmSPADPhotosynthesis Rate
(µmolm−2s−1)
Stomatal Conductance (mmolm−2s−1)
0Control0.411 ± 0.003 g0.159 ± 0.003 de0.564 ± 0.007 d4. 09 ± 0.039 de402.75 ± 39.5 c2031 ± 182.35 ab0.851 ± 0.016 d5.31 ± 0.44 d12.11 ± 0.32 hi301.6 ± 31.9 bc
0.01 mg/mL Qu0.415 ± 0.004 g0.154 ± 0.004 de0.569 ± 0.004 d4.46 ± 0.023 e355.5 ± 25.72 bc2083.7 ± 86.04 ab0.829 ± 0.01 bc5.55 ± 0.23 de12.35 ± 0.23 i301.3 ± 47.38 bc
0.01 mg/mL QNCs0.436 ± 0.006 g0.176 ± 0.005 e0.613 ± 0.005 e4.59 ± 0.026 e327.2 ± 13.2 ab1998.7 ± 133.9 a0.84 ± 0.037 c6.66 ± 0.2 e13.32 ± 0.32 j355.3 ± 23.95 d
50Control0.339 ± 0.007 e0.155 ± 0.001 de0.49 ± 0.005 cd3.72 ± 0.038 cd462 ± 44 e2381.5 ± 27.57 bcd0/8 ± 0.014 bc4.7 ± 0.23 bc10.33 ± 0.12 f265.3 ± 58.89 b
0.01 mg/mL Qu0.359 ± 0.026 ef0.165 ± 0.006 de0.514 ± 0.01 cd3.95 ± 0.034 cde281.2 ± 85.74 a2186.2 ± 80.22 abc0/801 ± 0.017 a5.05 ± 0.56 c10.8 ± 0.3 fg324.3 ± 12.73 cd
0.01 mg/mL QNCs0.381 ± 0.013 f0.159 ± 0.02 de0.56 ± 0.013 d4.03 ± 0.04 cde344.7 ± 21.7 abc2168.7 ± 33.87 abc0.826 ± 0.06 bc5.18 ± 0.69 cd11.4 ± 0.36 gh329 ± 7.76 bc
100Control0.211 ± 0.001 b0.188 ± 0.001 b0.33 ± 0.001 b2.76 ± 0.021 b446.2 ± 50 de2484 ± 103.89 d0.788 ± 0.04 a4.79 ± 0.74 bc7.74 ± 0.25 d228.6 ± 30.38 ab
0.01 mg/mlQu0.304 ± 0.002 d0.145 ± 0.004 cd0.448 ± 0.002 c3.5 ± 0.32 bc346.7 ± 43.4 abc2151.5 ± 171.4 abc0.804 ± 0.019 b5.38 ± 0.55 d8.44 ± 0.17 de378 ± 16.92 e
0.01 mg/mL QNCs0.309 ± 0.001 d0.148 ± 0.004 d0.458 ± 0.002 c3.66 ± 0.087 bc339 ± 24.18 abc2211.5 ± 48.5 bc0.822 ± 0.026 bc5 ± 0.56 c8.8 ± 0.22 e268.6 ± 3.84 bc
150Control0.15 ± 0.001 a0.08 ± 0.001 a0.23 ± 0.003 a2.01 ± 0.086 a430.75 ± 34 d2449.2 ± 38.09 cd0.759 ± 0.023 a3.53 ± 0.33 a3.45 ± 0.34 a194.3 ± 61.19 a
0.01 mg/mlQu0.234 ± 0.001 b0.101 ± 0.008 b0.335 ± 0.06 b2.75 ± 0.028 b367.7 ± 23.6 bc2249.7 ± 29.13 bc0.804 ± 0.031 b4.36 ± 0.47 b4.29 ± 0.23 b239 ± 48.52 ab
0.01 mg/mL QNCs0.274 ± 0.002 c0.122 ± 0.01 bc0.294 ± 0.08 b3.75 ± 0.099 cd315.7 ± 10.82 ab2207 ± 41.5 bc0.848 ± 0.012 c4.5 ± 0.4 b5.46 ± 0.35 c289.6 ± 2.33 bc
Different letters within each column indicate significant differences according to Duncan’s multiple-range test (p ≤ 0.05). All data are expressed as mean ± standard error (SE). SPAD = chlorophyll index, Fv/Fm = Maximum photosystem II quantum efficiency, mM = millimolar.
Disclaimer/Publisher’s Note: The statements, opinions and data contained in all publications are solely those of the individual author(s) and contributor(s) and not of MDPI and/or the editor(s). MDPI and/or the editor(s) disclaim responsibility for any injury to people or property resulting from any ideas, methods, instructions or products referred to in the content.

