Article

Pollution Level, Ecological Risk Assessment and Vertical Distribution Pattern Analysis of Heavy Metals in the Tailings Dam of an Abandon Lead–Zinc Mine

1
School of Resources and Safety Engineering, Central South University, Changsha 410083, China
2
Institute of Space and Earth Information Science, The Chinese University of Hong Kong, Shatin, Hong Kong, China
*
Author to whom correspondence should be addressed.
Current address: Faculty of Architecture, Civil and Environmental Engineering (ENAC), École Polytechnique Fédérale de Lausanne (EPFL), CH-1015 Lausanne, Switzerland.
Sustainability 2023, 15(15), 11987; https://doi.org/10.3390/su151511987
Submission received: 20 June 2023 / Revised: 19 July 2023 / Accepted: 31 July 2023 / Published: 4 August 2023

Abstract

:
Tailings dams in mining areas frequently experience the phenomenon of haphazard dumping and stacking of a large amount of tailings waste. Under the influence of surface runoff and groundwater infiltration, heavy metals from tailings waste can migrate to the surrounding areas and underground soil, resulting in extensive heavy metal pollution. To analyze the pollution level and ecological risk of heavy metals in an abandoned lead–zinc mine tailings dam, this study first employed X-ray fluorescence analysis to determine the vertical distribution patterns of heavy metals with depth. Then, the pollution levels of heavy metals were analyzed based on the Nemerow comprehensive pollution index and geoaccumulation index. Subsequently, the ecological risk of heavy metal pollution was further assessed using the potential ecological risk (PER) index. Finally, the sources and potential hazards of heavy metal pollution were investigated. The results reveal that (1) heavy metal pollutants are identified as lead (Pb), zinc (Zn), copper (Cu) and arsenic (As), displaying enrichment at the interface layer between the reclaimed zone and tailings layer with the highest concentrations; (2) the pollution degrees in each zone follow the order of interface layer > tailings layer > deep zone > reclaimed zone, and the pollution levels for the four heavy metals in decreasing order are Pb > Zn > As > Cu; (3) after considering the toxic effects of heavy metals, the potential ecological risk in each zone remains consistent with the ranking of pollution levels, and the contribution of the four heavy metals to PER changes to Pb > As > Zn > Cu, corresponding average E r i values of 913.928, 416.900, 96.462 and 47.998, respectively; (4) ecological risk of heavy metals originates from lead–zinc ore extraction, and heavy metal pollution poses potential risks to public water security and surrounding ecological resources.

1. Introduction

Soil is not only a vital resource and ecological condition for human survival and development [1], but it also serves as a reservoir for numerous pollutants. With the demands of socio-economic development, mineral extraction, smelting operations and metal processing are being rapidly advanced. But while mining activities provide an abundance of mineral materials, they also pose serious ecological and environmental challenges [2,3].
Numerous studies have indicated that mining activities release substantial amounts of heavy metals into the surrounding areas, causing widespread soil contamination by heavy metals. In the research of Liu et al. [4], the levels of lead (Pb), zinc (Zn), cadmium (Cd) and arsenic (As) in agricultural soils from the lead–zinc tailings dam in Chenzhou, Hunan, were found to be 1.1–3.6, 1.7–4.0, 13 and 24 times higher than the maximum permissible concentration levels in China, respectively. Li et al. [5] discovered the severe pollution of Pb, Cd, Cu and Zn in vegetable field soils near a lead–zinc mine in Shaoxing, Zhejiang, China, where the concentrations of Pb and Cd exceeded the permissible standards by up to 20 and 30 times, respectively. It was reported that Cd concentrations in cabbage grown in agricultural soil around a non-ferrous metal mine in Baiyin, China, were found to exceed the maximum allowable concentration by 4.5 times [6]. Zhuang et al.’s findings [7] demonstrated that the concentrations of Pb, Cu, Cd and Zn in rice soil near the Dabaoshan mine in Guangdong, were higher than the maximum permissible levels for agricultural soils in China. Similarly, it has been discovered that the soils at the dumping site of the magnesite mine in Jelšava-Lubeník were contaminated by As, magnesium, chromium and manganese, and their concentration levels exceeded the limiting values in Slovakia by several times [8].
Excessive heavy metals in the soil not only alter the physicochemical properties of the soil, posing a threat to biodiversity and reducing crop yields, but they also pose a risk to human health by bioaccumulating in the human body through the food chain [9,10]. For example, exposure to Pb is believed to cause lifelong damage to the human nervous, cardiovascular and hematological systems and may even lead to tumors in multiple organs, particularly the kidney and brain [11]. The heavy metal As has been recognized as a Group I carcinogen by the International Agency for Research on Cancer, and the long-term exposure to it increases the risk of developing bladder, lung and skin cancers [12,13]. While Zn and Cu are essential trace elements for the human body, an excessive intake of these elements can indeed be harmful to the human body [14,15]. Elevated levels of Cu in the body can induce nausea, dizziness, diarrhea and respiratory issues [16]. Likewise, the enrichment of Zn can lead to chills, nausea, vomiting, loss of consciousness and even death. Overall, it can be found that prolonged exposure to heavy metals may result in mental and behavioral disorders and increase the risk of cancer. Therefore, it is necessary to conduct pollution level analysis and ecological risk assessment in areas where heavy metal contamination is likely to exist.
Currently, the widely used methods for analyzing the pollution levels of heavy metals include the single-factor pollution index (SFPI) method, the Nemerow comprehensive pollution index (NCPI) method and the geoaccumulation index (Igeo) method. The SFPI can be applied to identify the main pollutants and determine the pollution level in a given environment [17,18,19]. The pollution index value of the SFPI is calculated based on the concentration of a single pollutant. Chen et al. [20] used the SFPI to evaluate the pollution level of heavy metal elements in soil with a heavy pollution of Cd, clean level of As and mild pollution of Hg, Pb, Ni, Cu, Cr and Zn. In Xu et al.’s research [21], the assessment results of SFPI demonstrated that there was a low ecological risk for Cd and no ecological risk for Hg in countries B and C. The SFPI can provide a simplified depiction of pollution levels, making it easier to interpret and compare across different locations or time periods. However, it puts emphasis on the pollution levels of individual heavy metal elements and therefore fails to provide a comprehensive reflection of the overall soil pollution status.
In comparison, the NCPI can comprehensively reflect the different effects of various metals in the soil [22,23]. This method not only takes into account the average pollution levels of various influencing parameters but also places special emphasis on the most severe pollutant. Moreover, it avoids the influence of subjective factors in the weighting process, overcoming the shortcomings of pollutant apportionment in the average value method. For example, Wang et al. [24] used the NCPI to assess the pollution levels of heavy metals and found that surface soil is more heavily polluted with heavy metals than deep soil, except for a part of surface soil, and the other soil layers were categorized as having a mild pollution level. Huang and Jin’s [25] findings indicated that the pollution levels of heavy metals in agricultural soils can be effectively evaluated using NCPI. The Igeo, proposed by German scientist Muller [26], not only reflects the natural variations in the distribution of heavy metals but also assesses the influence of human activities on the environment. It is widely utilized as a quantitative indicator to study the extent of heavy metal pollution in soil [27,28]. For instance, Jamal et al. [29] adopted Igeo to analyze the heavy metal pollution in the soil around a lead–zinc smelting factory in Iran and discovered that the pollution levels of heavy metals followed the rank of Pb > Zn > Cd > Cu > Ni. Likewise, in the research conducted by Nasirian et al. [30], it can be found that the Shadegan wetland in Iran has been subject to an extremely strong contamination of manganese and iron, with Igeo > 5. In terms of the NCPI method, it mainly focuses on the pollution concentrations of heavy metals and treats all heavy metals equally. Igeo can assess the environmental quality associated with the accumulation of different heavy metals in soil. Overall, while there have been numerous studies on the pollution level of soil heavy metals, most of them give less consideration to the influence of toxic effects of heavy metals on the analysis results. Therefore, this study aims to conduct an ecological risk assessment of heavy metals in the soil, taking into account the toxic effects of heavy metals.
Against this backdrop, we first determined the vertical distribution patterns of heavy metals using X-ray fluorescence analysis. Then, the pollution levels of heavy metals were analyzed based on NCPI and Igeo. Furthermore, the ecological risk of heavy metal pollution was assessed using the potential ecological risk index. Finally, the sources and ecological hazards of heavy metals were explored.

2. Materials and Methods

2.1. Study Area

The tailings dam of the abandoned lead–zinc mine is located in Zixing City, Hunan Province, South-Central China, adjacent to County Road X023, and there is a river flowing through on one side of the dam (Figure 1a,b). Surface runoff is primarily derived from atmospheric precipitation, resulting in noticeable water level fluctuations. The surrounding area of the tailings dam is characterized by a significant presence of farmland and orchards. Field investigations reveal that the local residents primarily focus on cultivating fruit trees for commercial purposes, with the cultivation of vegetables and staple crops as a secondary activity. The water used for irrigating the orchards and crops is typically sourced from nearby streams. The construction of the tailings dam can be traced back to an earlier period, and its design and construction lacked proper standards. The tailings were deposited by directly stacking them within the natural slope, and the dam was constructed using waste rocks and tailings on the lower side of the valley slope. The tailings dam ceased its operations in 2008.

2.2. Sample Collection and Processing

2.2.1. Field Sampling

The sampling points were distributed upstream and downstream of the tailings dam, with a total of 12 points being selected for sampling. Among them, three points were successfully seen for sand and deep soil, numbered Sample 1, Sample 2 and Sample 3, respectively. Thereinto, Sample 1 and Sample 2 were located downstream of the tailings dam, while Sample 3 was situated upstream of the tailings dam (Figure 1c). The sampling depth for all three points was 400 cm, with the range of 0–60 cm representing the reclaimed zone, 60 cm being the interface layer between the reclaimed zone and the tailings layer, 60–250 cm representing the tailings layer, and the depth range of 250–400 cm representing the deep zone. The samples obtained at different depths vary in their composition. Soil samples were collected at depths of 42.5 cm, 250 cm and 400 cm, while tailings samples were taken at depths of 60 cm and 90 cm.

2.2.2. Sampling Processing

The collected tailings and soil samples were air-dried at room temperature in the laboratory and then crushed. They were subsequently passed through a 1 mm aperture nylon sieve to remove gravel, organic residues, and other impurities. The contents of heavy metal elements can be determined using X-ray fluorescence (XRF) analysis. The principle of XRF analysis involves illuminating the sample with X-rays generated by a light source. The elements present in the sample emit fluorescence radiation with different energies. By distinguishing these energy differences, which are color-coded, the presence of specific elements in the sample can be determined by measuring the emitted radiation energy.

2.3. Pollution Level

2.3.1. Nemerow Comprehensive Pollution Index

The Nemerow comprehensive pollution index (NCPI) can be calculated based on the measured and standard concentrations of pollutants of the evaluation objects [31,32,33]. The pollution levels can be categorized into five grades (Table 1). The pollution grades can be determined by comparing NCPI with grade-standard values. The calculation formula is as follows:
P c = ( ( ( C i S i ) m a x ) 2 + ( ( C i S i ) ave ) 2 ) 2
where   P c represents NCPI, C i represents the measured concentration of pollutant i (unit: mg/kg), S i represents the background value of pollutant i (unit: mg/kg), (Ci/Si)max is the maximum value in the pollution index and (Ci/Si)ave is the average value of the pollution index.

2.3.2. Geoaccumulation Index

The geoaccumulation index method takes into account both the influence of background values caused by natural geological processes and the impact of human activities on heavy metal pollution [34,35]. The calculation formula for this method is shown in Equation (2). The pollution levels can be classified into seven grades (Table 2).
I g e o = log 2 C i / 1.5 B N i
where I g e o is the geoaccumulation index, C i is the actual content value of element i in the soil (unit: mg/kg), B N i represents the geochemical background value (unit: mg/kg) and 1.5 is the correction factor that considers the background value variations due to diagenesis.

2.4. Potential Ecological Risk Index

The potential ecological risk (PER) index was proposed by Swedish geochemist Hakanson [36]. This index combines heavy metal concentrations with ecological effects, environmental effects and toxic effects [37,38,39]. It simultaneously considers four influencing factors: heavy metal content, heavy metal toxicity, types of heavy metal pollution and sensitivity to heavy metal pollution, to assess the extent of heavy metal pollution and the ecological risk. The calculation formulas of the PER index are as follows:
C f i = C 0 i / C n i
E r i = T r i C f i
R I = i = 1 n E r i = i = 1 n T r i C f i = i = 1 n T r i C 0 i / C n i
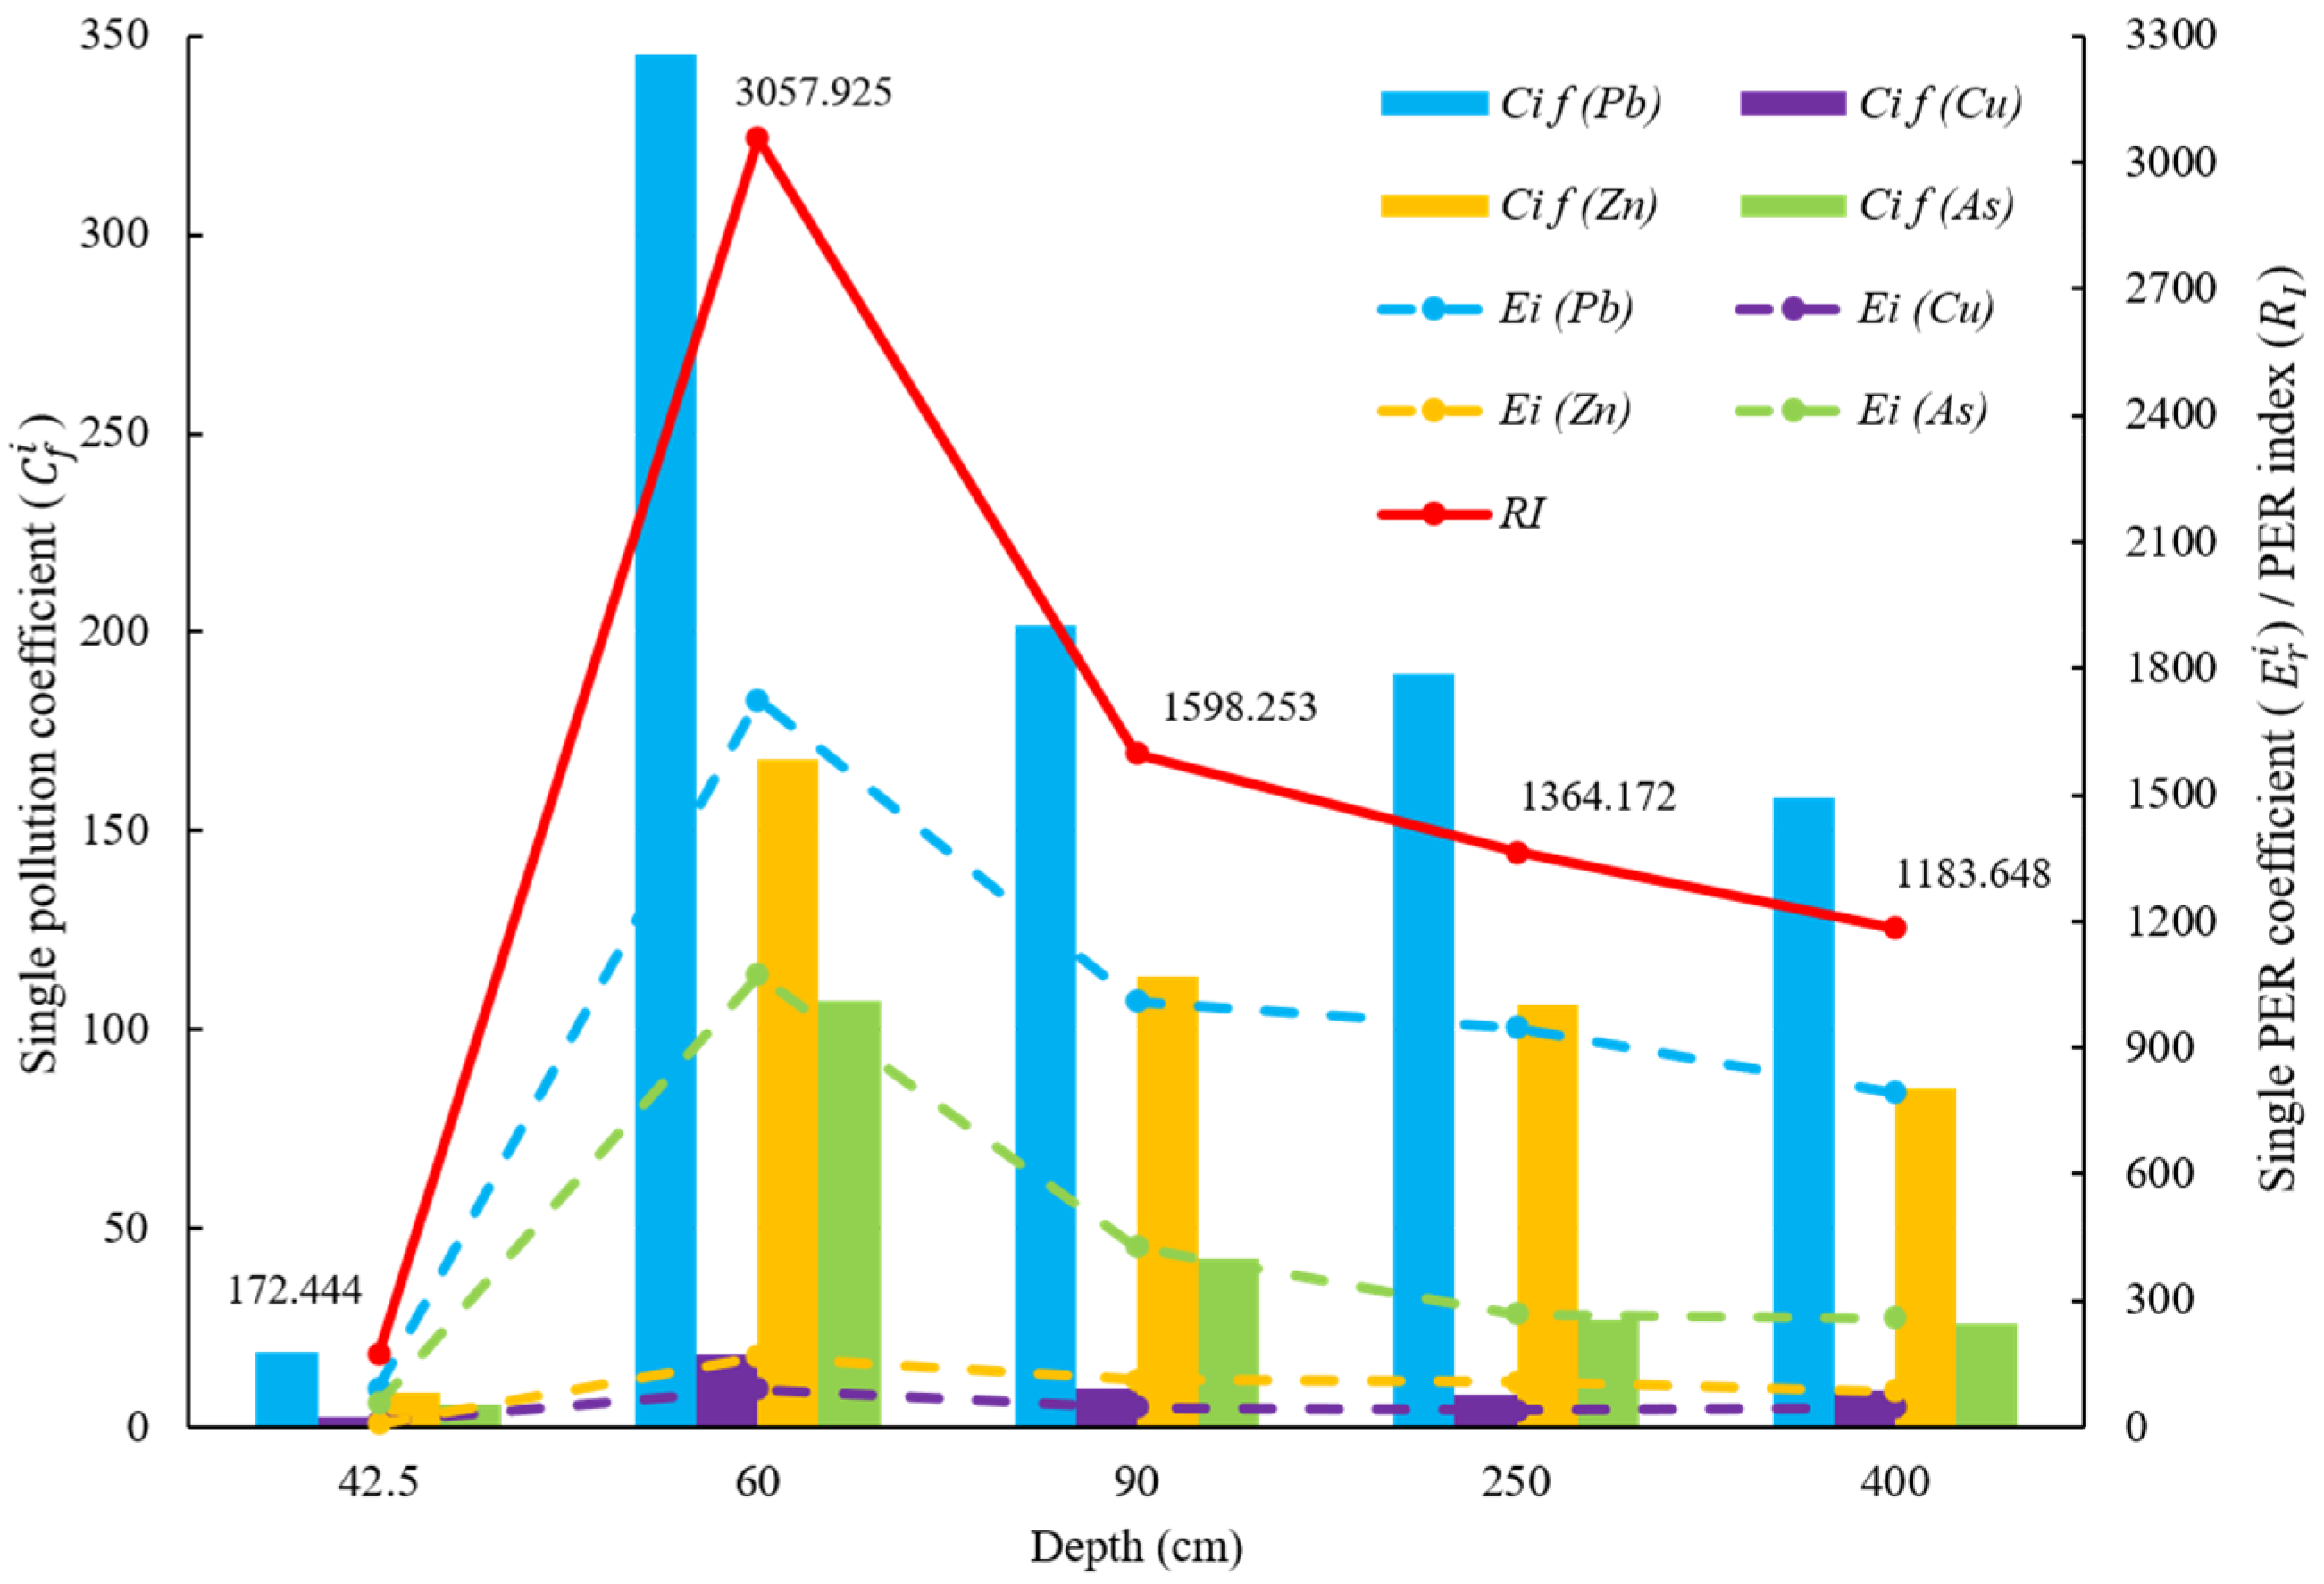
where R I represents the PER index, C f i represents the single pollution coefficient, C 0 i is the measured concentration of heavy metal i (unit: mg/kg), C n i is the reference value of heavy metal i (unit: mg/kg), E r i is the PER coefficient for heavy metal i and T r i is the toxicity response coefficient for heavy metal i. The PER is categorized into different levels as shown in Table 3, based on C f i , E r i and R I .
In this method, Hakanson proposed that the heavy metal toxicity response coefficient includes two aspects: the toxicity to human health and toxicity to the ecosystem. According to the abundance principle, which states that the toxicity of heavy metals is inversely proportional to their abundance, the toxicity levels of various metals can be distinguished. This study determined the toxicity response coefficients for the four heavy metals: As = 10, Pb = 5, Cu = 5 and Zn = 1 [36,40].

2.5. Correlation Analysis

The Pearson correlation coefficient is a statistical method used to describe the degree of correlation between two or more variables [41,42,43]. In the field of soil heavy metal distribution research, correlation analysis has been widely applied by scholars [44]. The specific calculation formula is as follows:
r = X X ¯ Y Y ¯ X X ¯ 2 Y Y ¯ 2 = l X Y l X X l Y Y
l X X = X X ¯ 2 = X 2 X 2 n
l Y Y = Y Y ¯ 2 = Y 2 Y 2 n
l X Y = X X ¯ Y Y ¯ = X Y X Y n
where r represents the correlation coefficient between two variables, X denotes one of the variables, Y represents the other variable, X ¯ and Y ¯ respectively represent the means of X and Y , and n represents the number of variables.
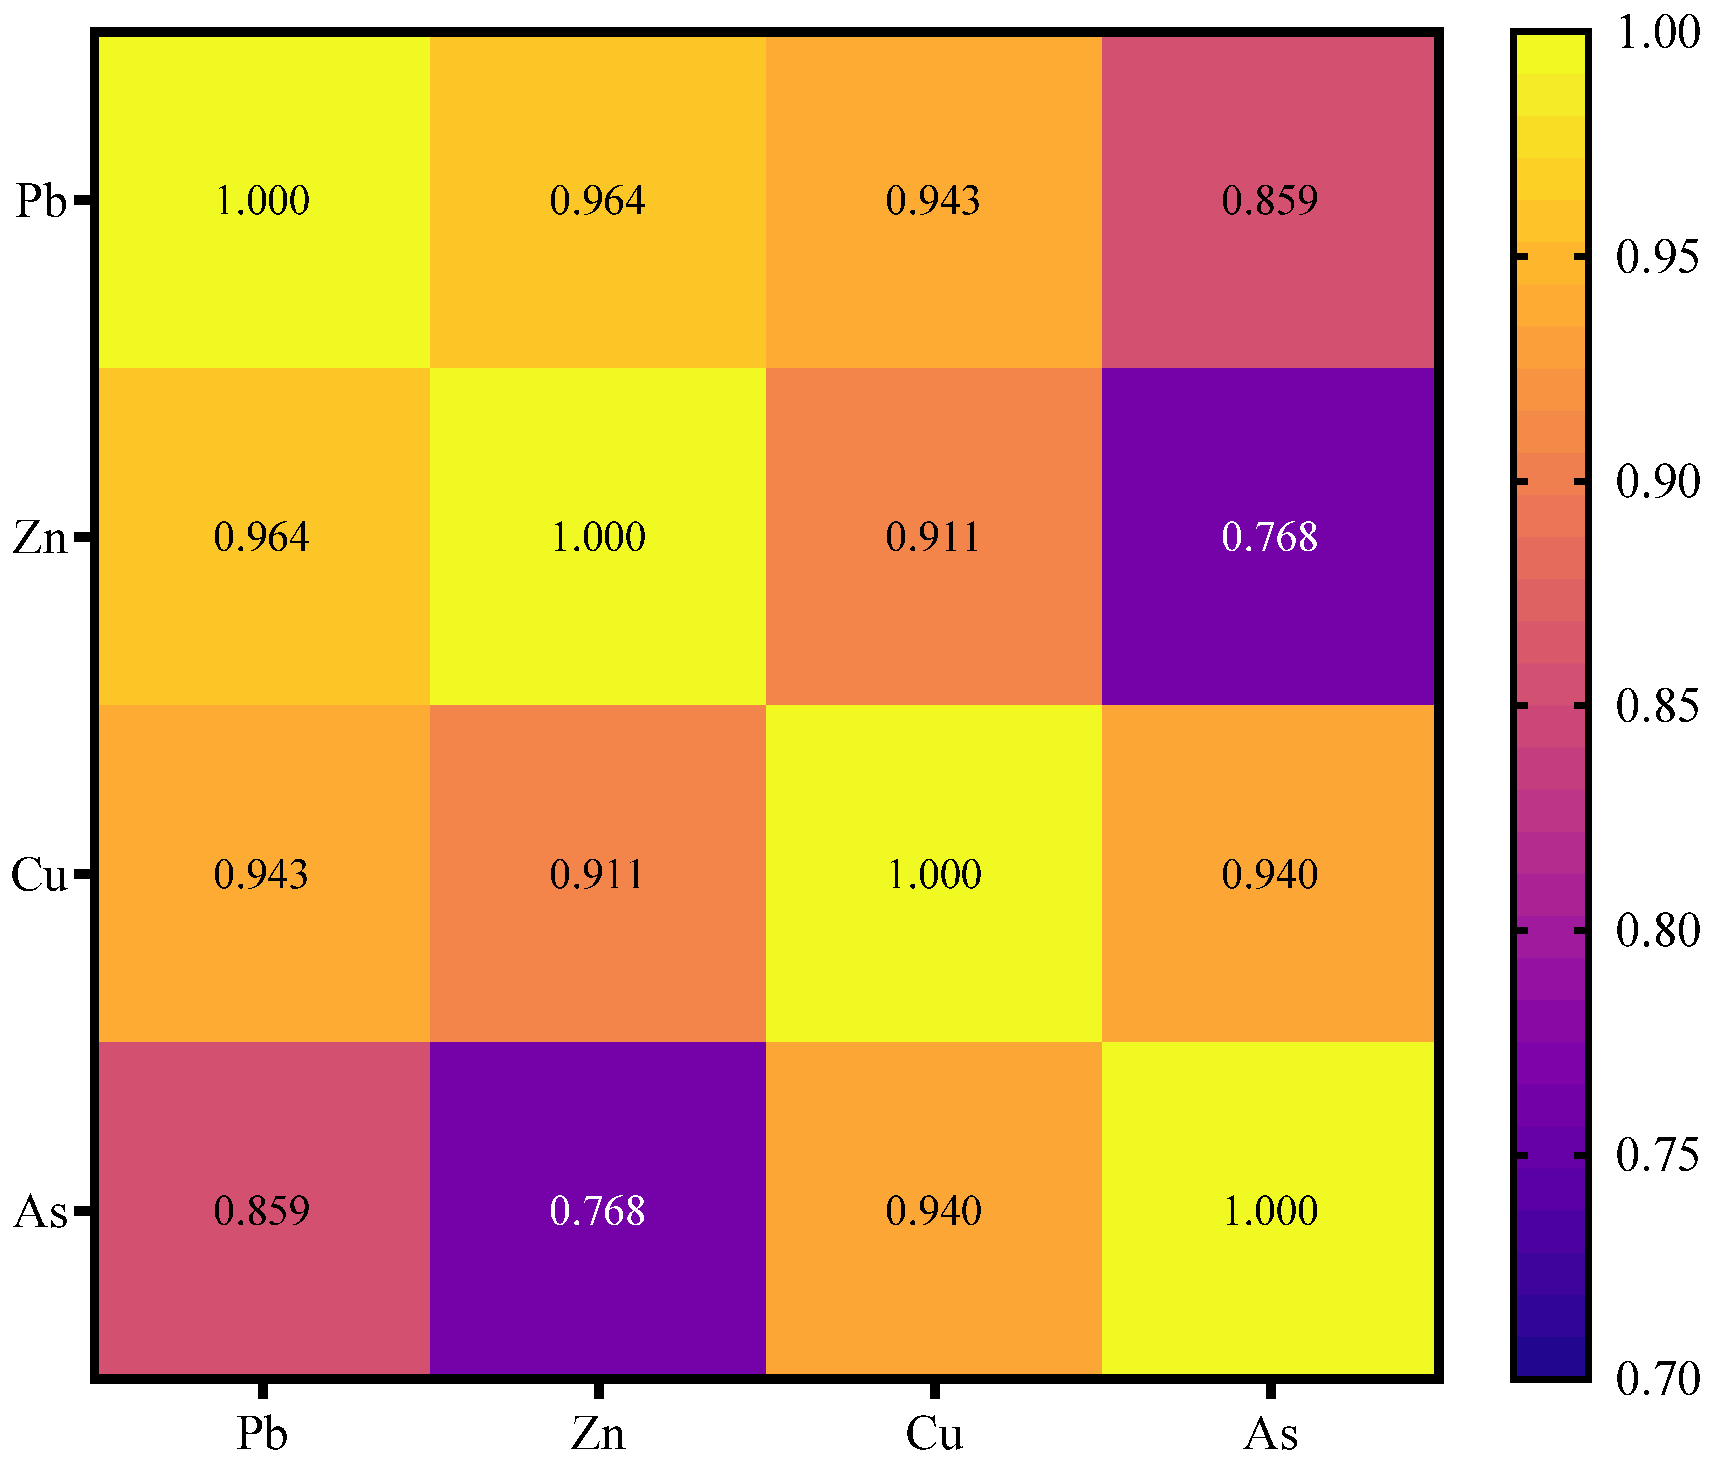
The degree of correlation between two variables can be represented by | r | . As shown in Figure 2, r > 0 indicates a positive correlation, r < 0 indicates a negative correlation, and   r = 0 indicates no correlation. The closer | r | is to 1, the higher the degree of correlation between the two variables, indicating a stronger and more intimate relationship.

3. Results

3.1. The Vertical Distribution of Heavy Metal Concentrations

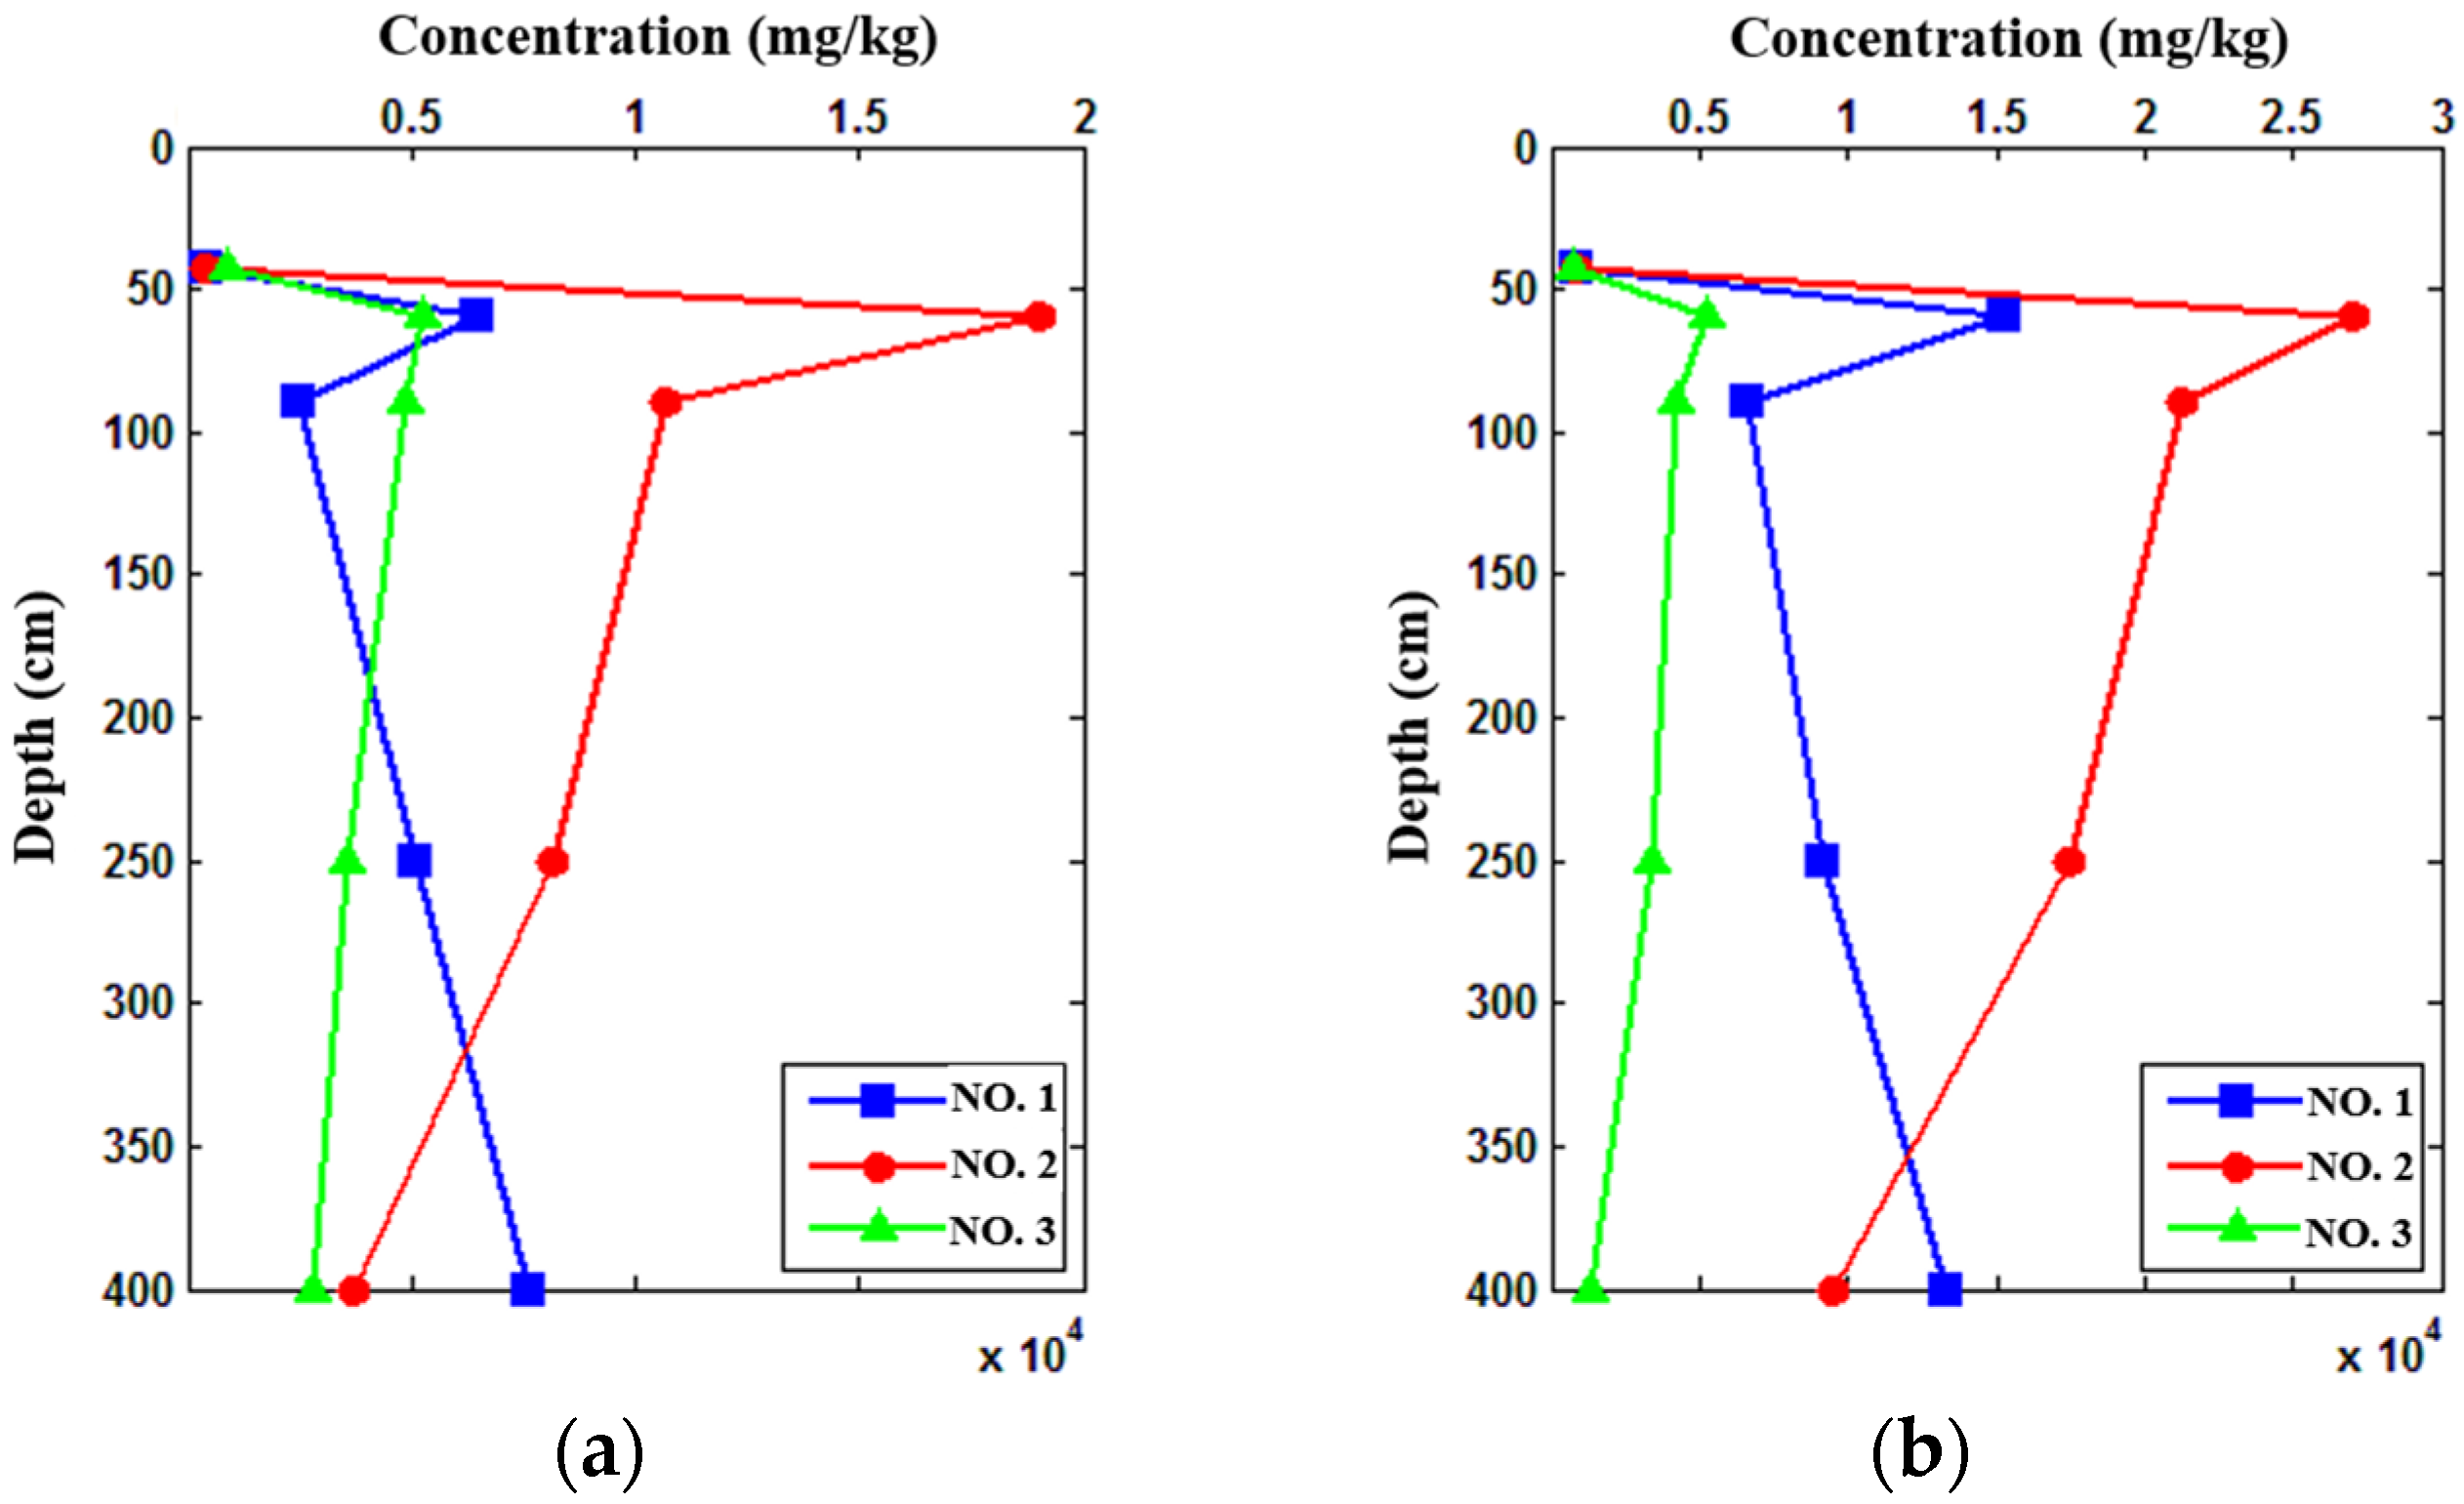
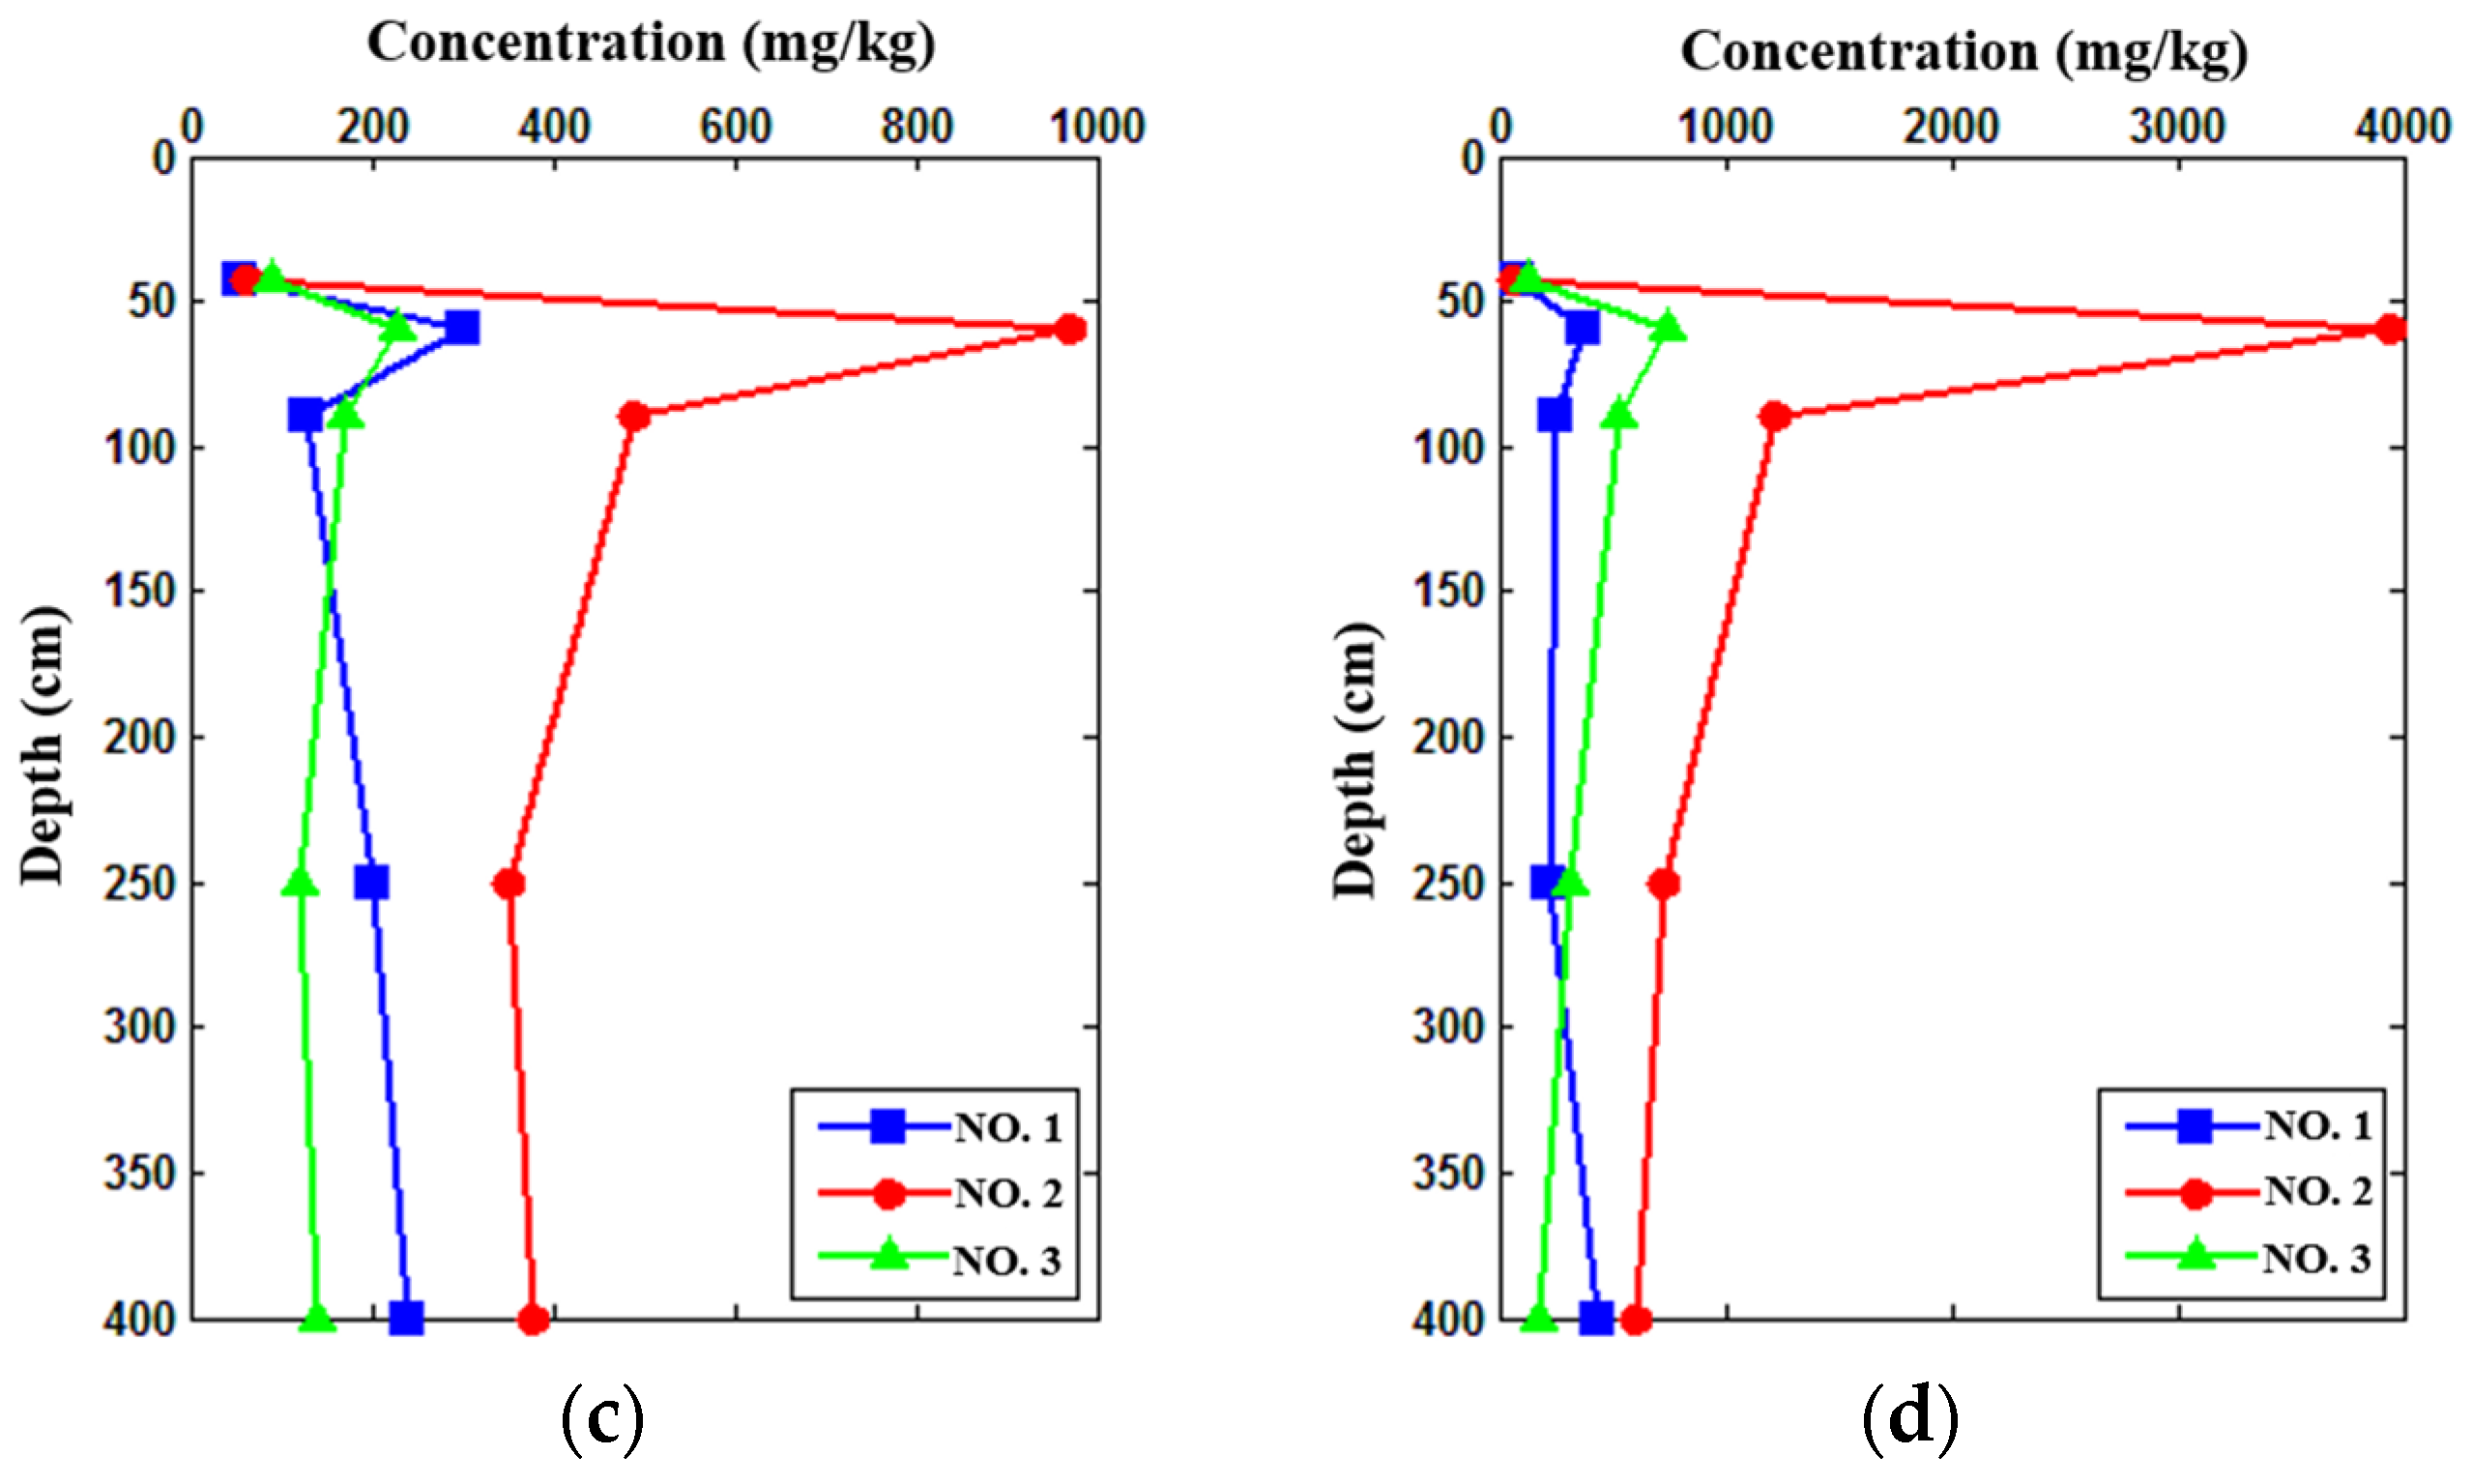
The locations of sampling points were primarily distributed upstream and downstream of the tailings dam. By subjecting the collected tailings samples (Sample 1, Sample 2 and Sample 3) to X-ray irradiation, the emitted radiation energy of the samples was measured [45,46]. Subsequently, the heavy metal elements in the samples were identified as Pb, Zn, Cu and As, and their concentration distributions with depth are depicted in Figure 3. Among the individual metals, Zn has the highest content, followed by Pb, As and Cu. The average contents of Pb and Zn are 4593.333 and 9100.667 mg/kg, respectively, accounting for 93.81% of the total contents of the four heavy metals. The coefficients of variation for Pb, Zn, Cu and As are 1.134, 0.904, 0.954 and 1.504, respectively, which indicate significant spatial variations in the distribution of Pb, As, Zn and Cu.
It can be observed in Figure 3 that there is a significant increasing trend of heavy metal concentrations with depth in the reclaimed zone (0–60 cm). The enrichment of heavy metals occurs at the interface layer between the reclaimed zone and the tailings layer (60 cm). This is mainly attributed to the capillary adsorption and rhizosphere effect caused by plant roots. Capillary adsorption plays a role in the enrichment of heavy metals in the soil through two main mechanisms. (1) Uptake of heavy metals: As plants take up water from the soil, heavy metals dissolved in the soil water can be absorbed by the roots. This is because heavy metal ions can be similar in size and charge to essential nutrients that plants actively uptake, such as calcium, iron or zinc. Consequently, the roots may inadvertently take up heavy metals along with these essential nutrients. (2) Rhizosphere effect: The rhizosphere is the narrow region of soil surrounding the plant roots where various biological, chemical and physical interactions occur. Plant roots release certain compounds and organic substances into the rhizosphere, which can alter the physicochemical properties of the soil. These changes can increase the mobility and availability of heavy metals in the rhizosphere, making it easier for the roots to absorb and accumulate them.
In the tailings layer (60–250 cm), both Samples 2 and 3 exhibit a decreasing trend in heavy metal concentrations, while Sample 1 shows a decrease followed by an increase in heavy metal concentrations. The phenomenon observed in Samples 2 and 3 may be attributed to two main reasons. On the one hand, the capillary adsorption and rhizosphere effect can facilitate the upward migration of soluble heavy metals. A fraction of the heavy metal elements is absorbed by the porous particles, resulting in their precipitation at the interface layer between the reclaimed zone and the tailings layer. Therefore, the concentration of tailings in the layer gradually decreased. On the other hand, under the influence of permeation, the soluble forms of heavy metals progressively move downwards into the soil over time, resulting in a decreasing concentration of heavy metals in the vertical direction. Regarding Sample 1, in addition to the aforementioned processes involving the capillary adsorption of the plant roots, porous precipitation, and permeation, there is a possibility of a higher pH condition in the lower part of the tailings layer. Under alkaline conditions, heavy metals tend to form insoluble precipitates with carbonates and hydroxides, reducing their mobility and availability. This explains the observed pattern of decreasing heavy metal concentrations followed by an increase.
In the deep zone (250–400 cm), Samples 2 and 3 show a decrease in concentrations of Pb, Zn and As, but there is a slight increase in Cu concentration. The concentrations of all four metals are elevated in Sample 1. The situations for Samples 2 and 3 may be caused by two factors: (1) Mobility and leaching: Pb, Zn and As are typically more mobile and prone to leaching from the soil. As a result, they can migrate downwards over time, leading to lower concentrations in the deep zone. On the other hand, Cu tends to have lower mobility and may exhibit limited downward movement, resulting in a relatively higher concentration in the deep zone compared to the other elements. (2) Adsorption and retention: Certain soil properties and mineral interactions can influence the adsorption and retention of different heavy metals. It is possible that in the deep zone, the soil has a higher affinity for Pb, Zn and As, causing these elements to be adsorbed and retained more effectively, leading to their decreased concentrations. Conversely, Cu may have weaker interactions with the soil components, resulting in a lesser decrease or even a slight increase in concentration.
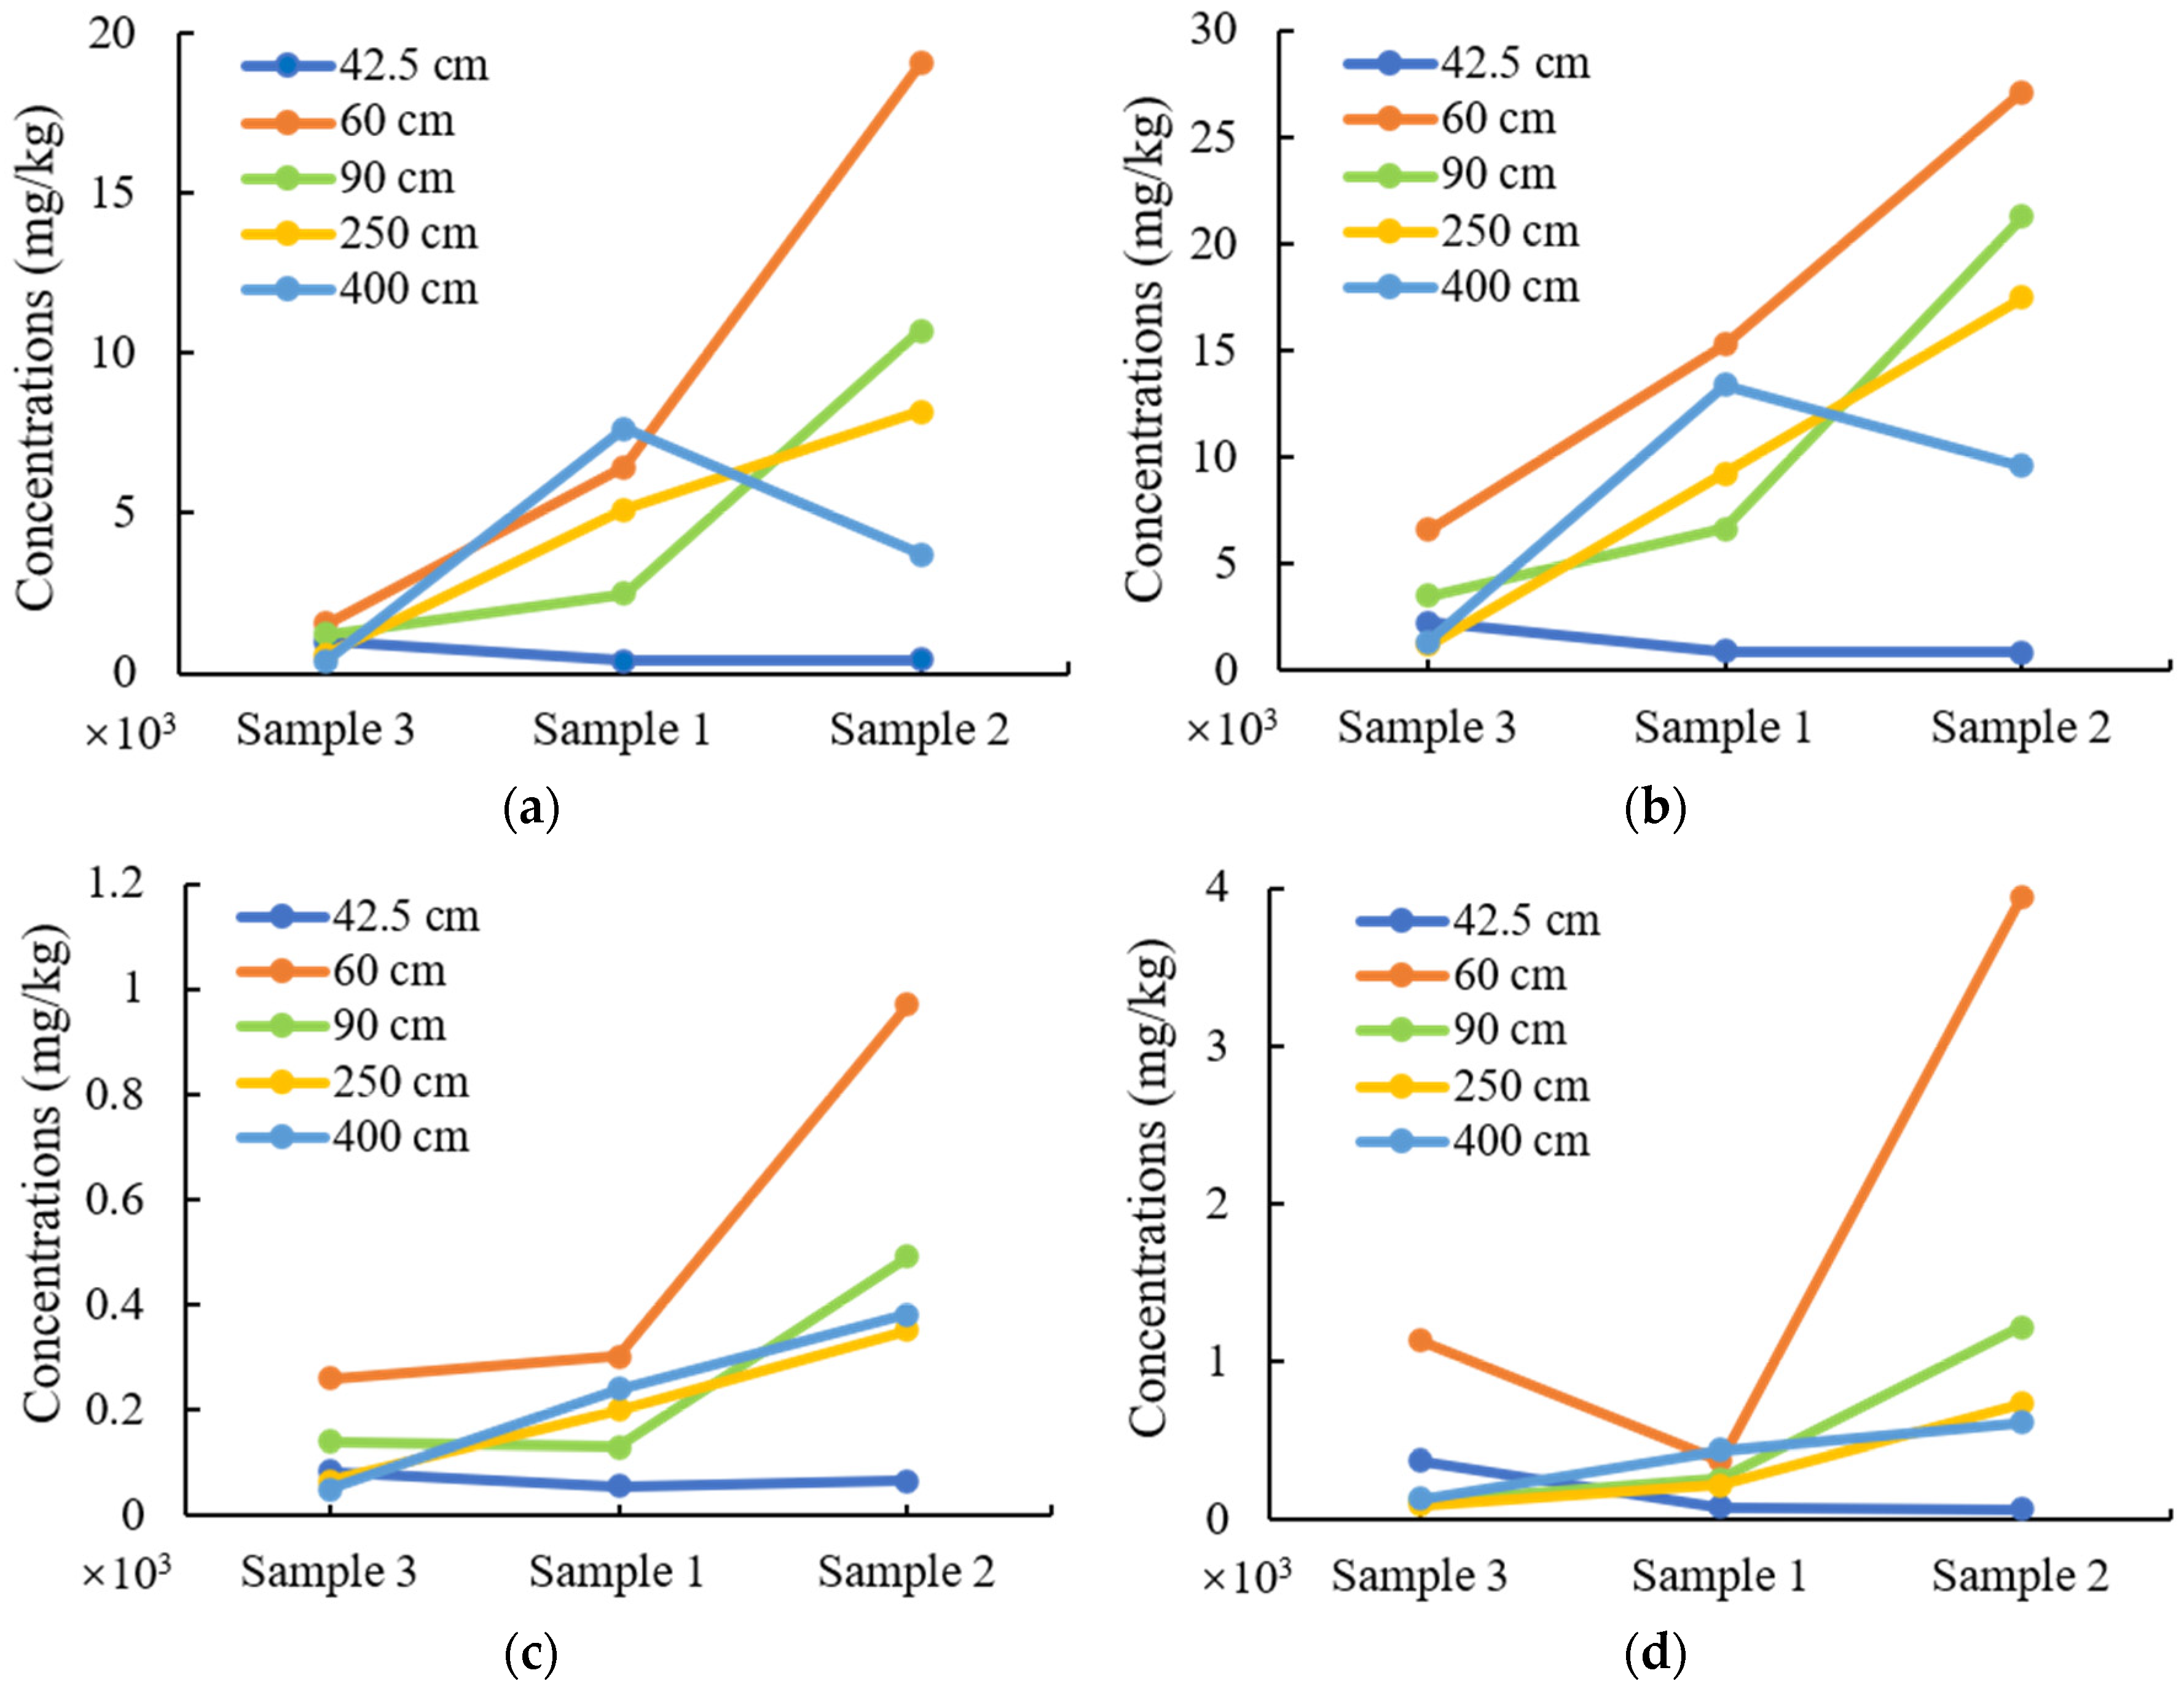
At the same depth, the downstream sampling points have higher concentrations of heavy metals compared to the upstream sampling points (Figure 4), indicating the migration and diffusion of heavy metals towards the downstream under the leaching effect of underflow and atmospheric precipitation.

3.2. Pollution Level Analysis

3.2.1. Nemerow Comprehensive Pollution Index

The pollution situation of the tailings dam was evaluated using the Nemerow comprehensive pollution index (NCPI). As shown in Table 4, it can be observed that NCPI values for the four heavy metal elements (Pb, Cu, Zn and As) are significantly higher than the strong pollution index value of 3 in four zones, indicating that both the upper and lower parts of the tailings dam have suffered from strong heavy metal pollution. The pollution severity varied at different depths of the tailings dam, with the order being the interface layer between the reclaimed zone and the tailings layer > tailings layer > deep zone > reclaimed zone. In terms of vertical distribution within the entire tailings dam, Pb contamination was the most severe, followed by Zn, then As, and the least severe was Cu (Pb > Zn > As > Cu).

3.2.2. Geoacculumation Index

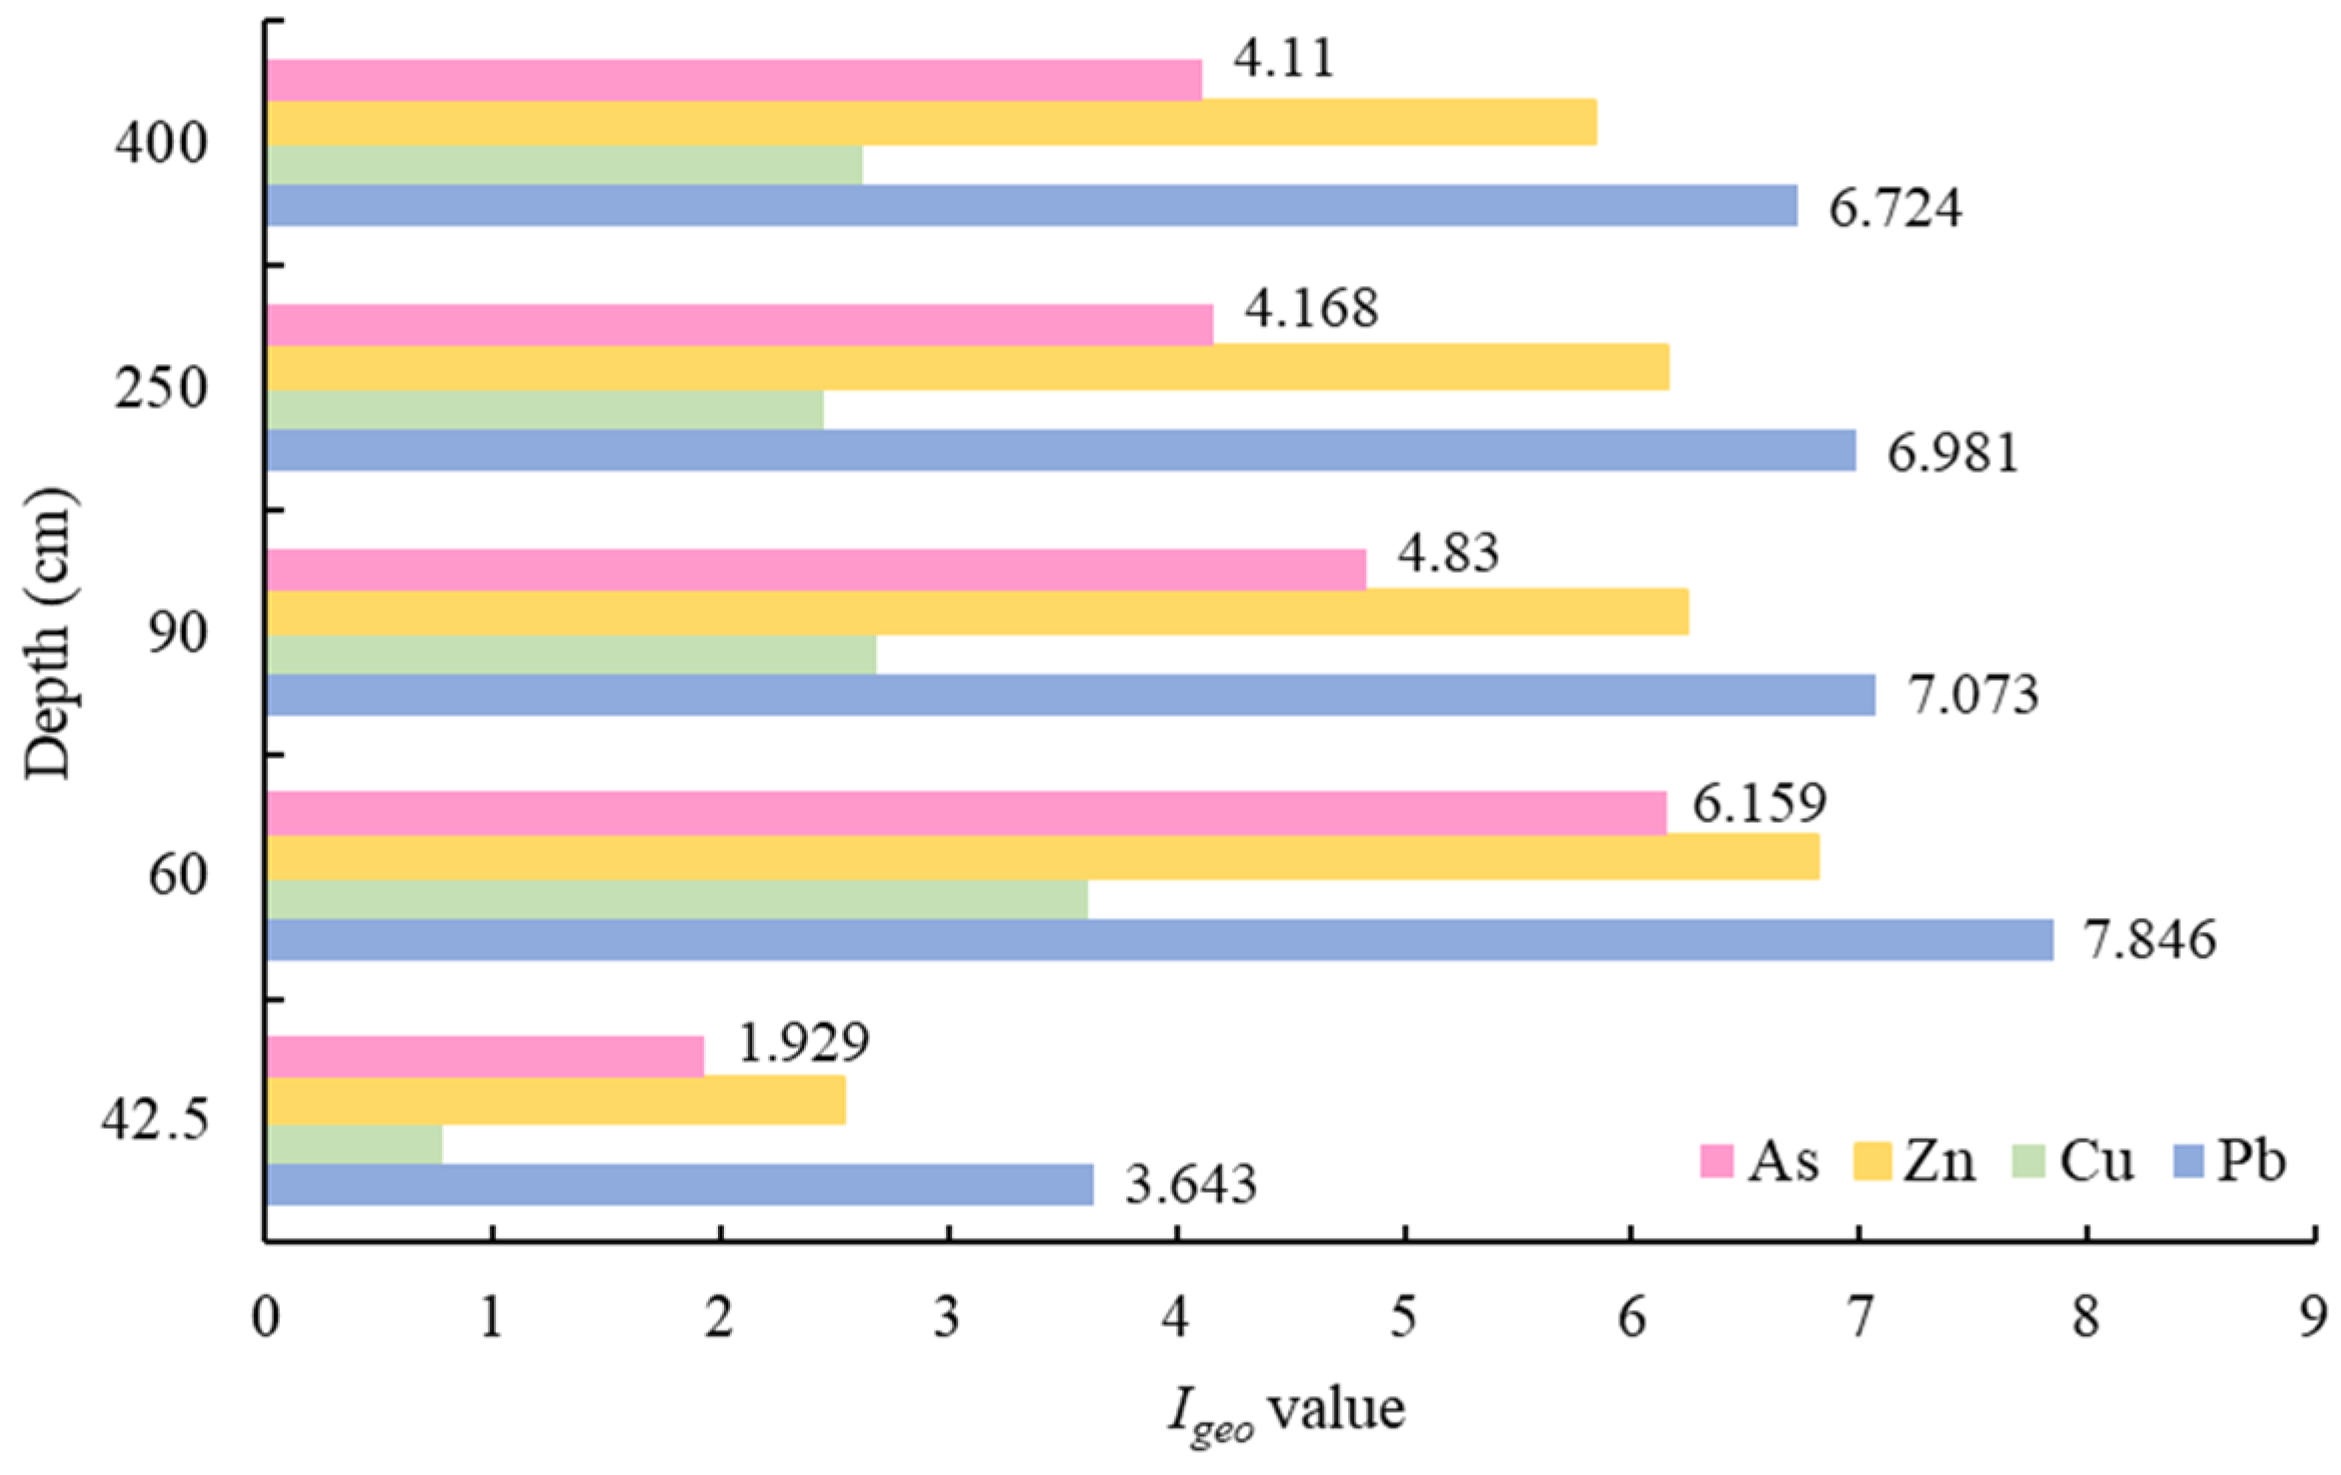
The geoacculumation index method was employed to assess the pollution levels of heavy metals. The Igeo value for Pb in the reclaimed zone was 3.643 (Figure 5), indicating a strong pollution level at Grade Ⅴ. In the other three zones, the Igeo values for Pb exceeded 5, indicating an extremely strong pollution level at Grade VII. In terms of Cu, the Igeo value in the reclaimed zone ranged between 0 and 1, which indicates a mild to moderate pollution level at Grade II. At the interface layer between the reclaimed zone and the tailings layer, the Igeo value for Cu was 3.610, suggesting a strong pollution level at Grade V. In the tailings layer and the deep zone, the Igeo values for Cu ranged between 2 and 3, implying that Cu pollution was a moderate to strong level at Grade IV. The Igeo value for Zn in the reclaimed zone was 2.543, indicating that Zn contamination was at Grade IV (moderate to strong). In the other three zones, all the Igeo values for Zn exceeded 5, suggesting the presence of extremely strong Zn pollution (Grade VII). Moreover, the reclaimed zone exhibited moderate pollution of As with the Igeo of 1.929. The interface layer between the reclaimed zone and the tailings layer demonstrated an extremely strong level of As pollution (Grade VII), with the Igeo value exceeding 5. In the tailings layer and deep zone, the Igeo values for As ranged from 4 to 5, indicating a strong to extremely strong level of As pollution (Grade VI). From the above analysis, it can be seen that the pollution level of heavy metals was ranked as follows: interface layer between the reclaimed zone and the tailings layer > tailings layer > deep zone > reclaimed zone. Furthermore, among these four zones, the pollution degree for the four heavy metals followed the order of Pb > Zn > As > Cu.

3.3. Potential Ecological Risk Assessment

As shown in Figure 6, apart from the reclaimed zone, which is moderately polluted by Cu and strongly polluted by As with C f i values of 2.576 and 5.711, respectively, the other three zones experience extremely strong pollution from all four heavy metals with C f i values exceeding 6. Within the reclaimed zone, the E r i value for Pb was 93.715, implying a slightly strong potential ecological risk (PER) of Pb, and E r i values for Cu, Zn and As were 12.880, 8.739 and 57.110, respectively, indicating a mild PER of Cu and Zn as well as a moderate PER of As. The interface layer between the reclaimed zone and the tailings layer exhibited an extremely strong PER of Pb and As with E r i values greatly exceeding 320, a slightly strong PER of Cu with an E r i value of 91.575 and a strong PER of Zn with an E r i value of 168.220. In the tailings layer and deep zone, the E r i values for Pb were significantly larger than 320, indicating that both areas were experiencing an extremely strong PER of Pb. The E r i values for Cu and Zn fell between 40 and 80 as well as between 80 and 160, respectively, indicating a moderate PER of Cu and a slightly strong PER of Zn. In the upper portion of the tailings layer, the E r i value for As exceeded 320, indicating the presence of extremely strong As pollution. In the lower portion of the tailings layer and the deep zone, the E r i values for As ranged between 160 and 320, implying a strong PER of As.
From the overall vertical distribution perspective, RI values were 172.444 in the reclaimed zone, indicating a moderate PER. In the interface layer between the reclaimed zone and the tailings layer, the tailings layer and the deep zone, the RI values were all significantly higher than 600, suggesting an extremely strong PER of heavy metals in these three zones. Thereinto, the region with the most serious PER was the interface layer between the reclaimed zone and the tailings layer, followed by the tailings layer, and then the deep zone. The reclaimed zone had a relatively lighter PER. The contributions of the four heavy metals to PER, in descending order, were Pb > As > Zn > Cu, with corresponding average E r i values of 913.928, 416.900, 96.462 and 47.998, respectively.

3.4. Differences Analysis

As far as pollution levels are concerned, it can be found that the analysis results of the NCPI method and the geoaccumulation index method are essentially identical. In the vertical distribution of the entire tailings dam, the severity of heavy metal pollution follows the order: the interface layer between the reclaimed zone and the tailings layer > the tailings layer > the deep zone > the reclaimed zone. Moreover, among these four zones, the degree of pollution for the four heavy metals is ranked as Pb > Zn > As > Cu. Due to the capillary adsorption and rhizosphere effect from plant roots, there was an enrichment phenomenon of heavy metals at the interface layer, causing the most severe heavy metal pollution at this layer. The tailings layer represents the bulk of the mining waste deposition, and the pollution severity (the second-highest level) indicates that heavy metals have leached or migrated to some extent into this region over time. The deep zone’s heavy metal pollution is primarily the result of long-term infiltration. When water permeates, it acts as a transporting medium, facilitating the movement of dissolved heavy metals. Currently, the contamination in the deep zone is relatively lighter compared to the interface layer and tailings layer. The heavy metal pollution in the reclaimed zone is mainly caused by the accumulation of contaminants in plants. When the plant dies, the accumulated heavy metals can be released back into the soil. This release can occur through the decomposition of plant material. Consequently, the soil in the reclaimed zone is the least polluted with heavy metals.
Furthermore, the PER levels of the tailings dam, evaluated using the PER index, coincides with the pollution levels calculated using the NCPI and geoaccumulation index at different zones. However, the ranking of the four heavy metals in terms of their contributions to the PER differs from the ranking of the four metals based on their pollution levels, with the descending order being Pb > As > Zn > Cu. The differences between the pollution levels and PER primarily lies in that the PER index method takes into account the toxic response of heavy metals and combines the ecological, toxic and environmental effects of these metals to form an evaluation index [47,48,49]. For example, when As and Zn have the same single pollution coefficient ( C f i ), the toxic response coefficient ( T r i ) for As and Zn is 10 and 1, respectively. After taking into account the toxicity level of heavy metals, the single PER coefficient ( E r i = T r i C f i ) for As appears to be larger than that for Zn. This leads to a higher PER level for As than Zn in the PER index assessment. Considering the practical circumstances in the tailings dam, it is essential to not only focus on the actual contents of heavy metals but also their toxicity responses to human beings and ecosystems

3.5. Investigation of the Heavy Metal Sources

In this study, Pearson’s correlation analysis was used to examine the correlation between the distribution of heavy metals. As shown in Figure 7, there is an extremely positive strong correlation (r > 0.8) observed between Pb and Zn, Cu as well as As. Additionally, Cu also shows an extremely positive strong correlation (r > 0.8) with Zn and As, while Zn exhibits a positive strong correlation (r > 0.6) with As. The correlation findings suggest that these heavy metals may have a common pollution source.
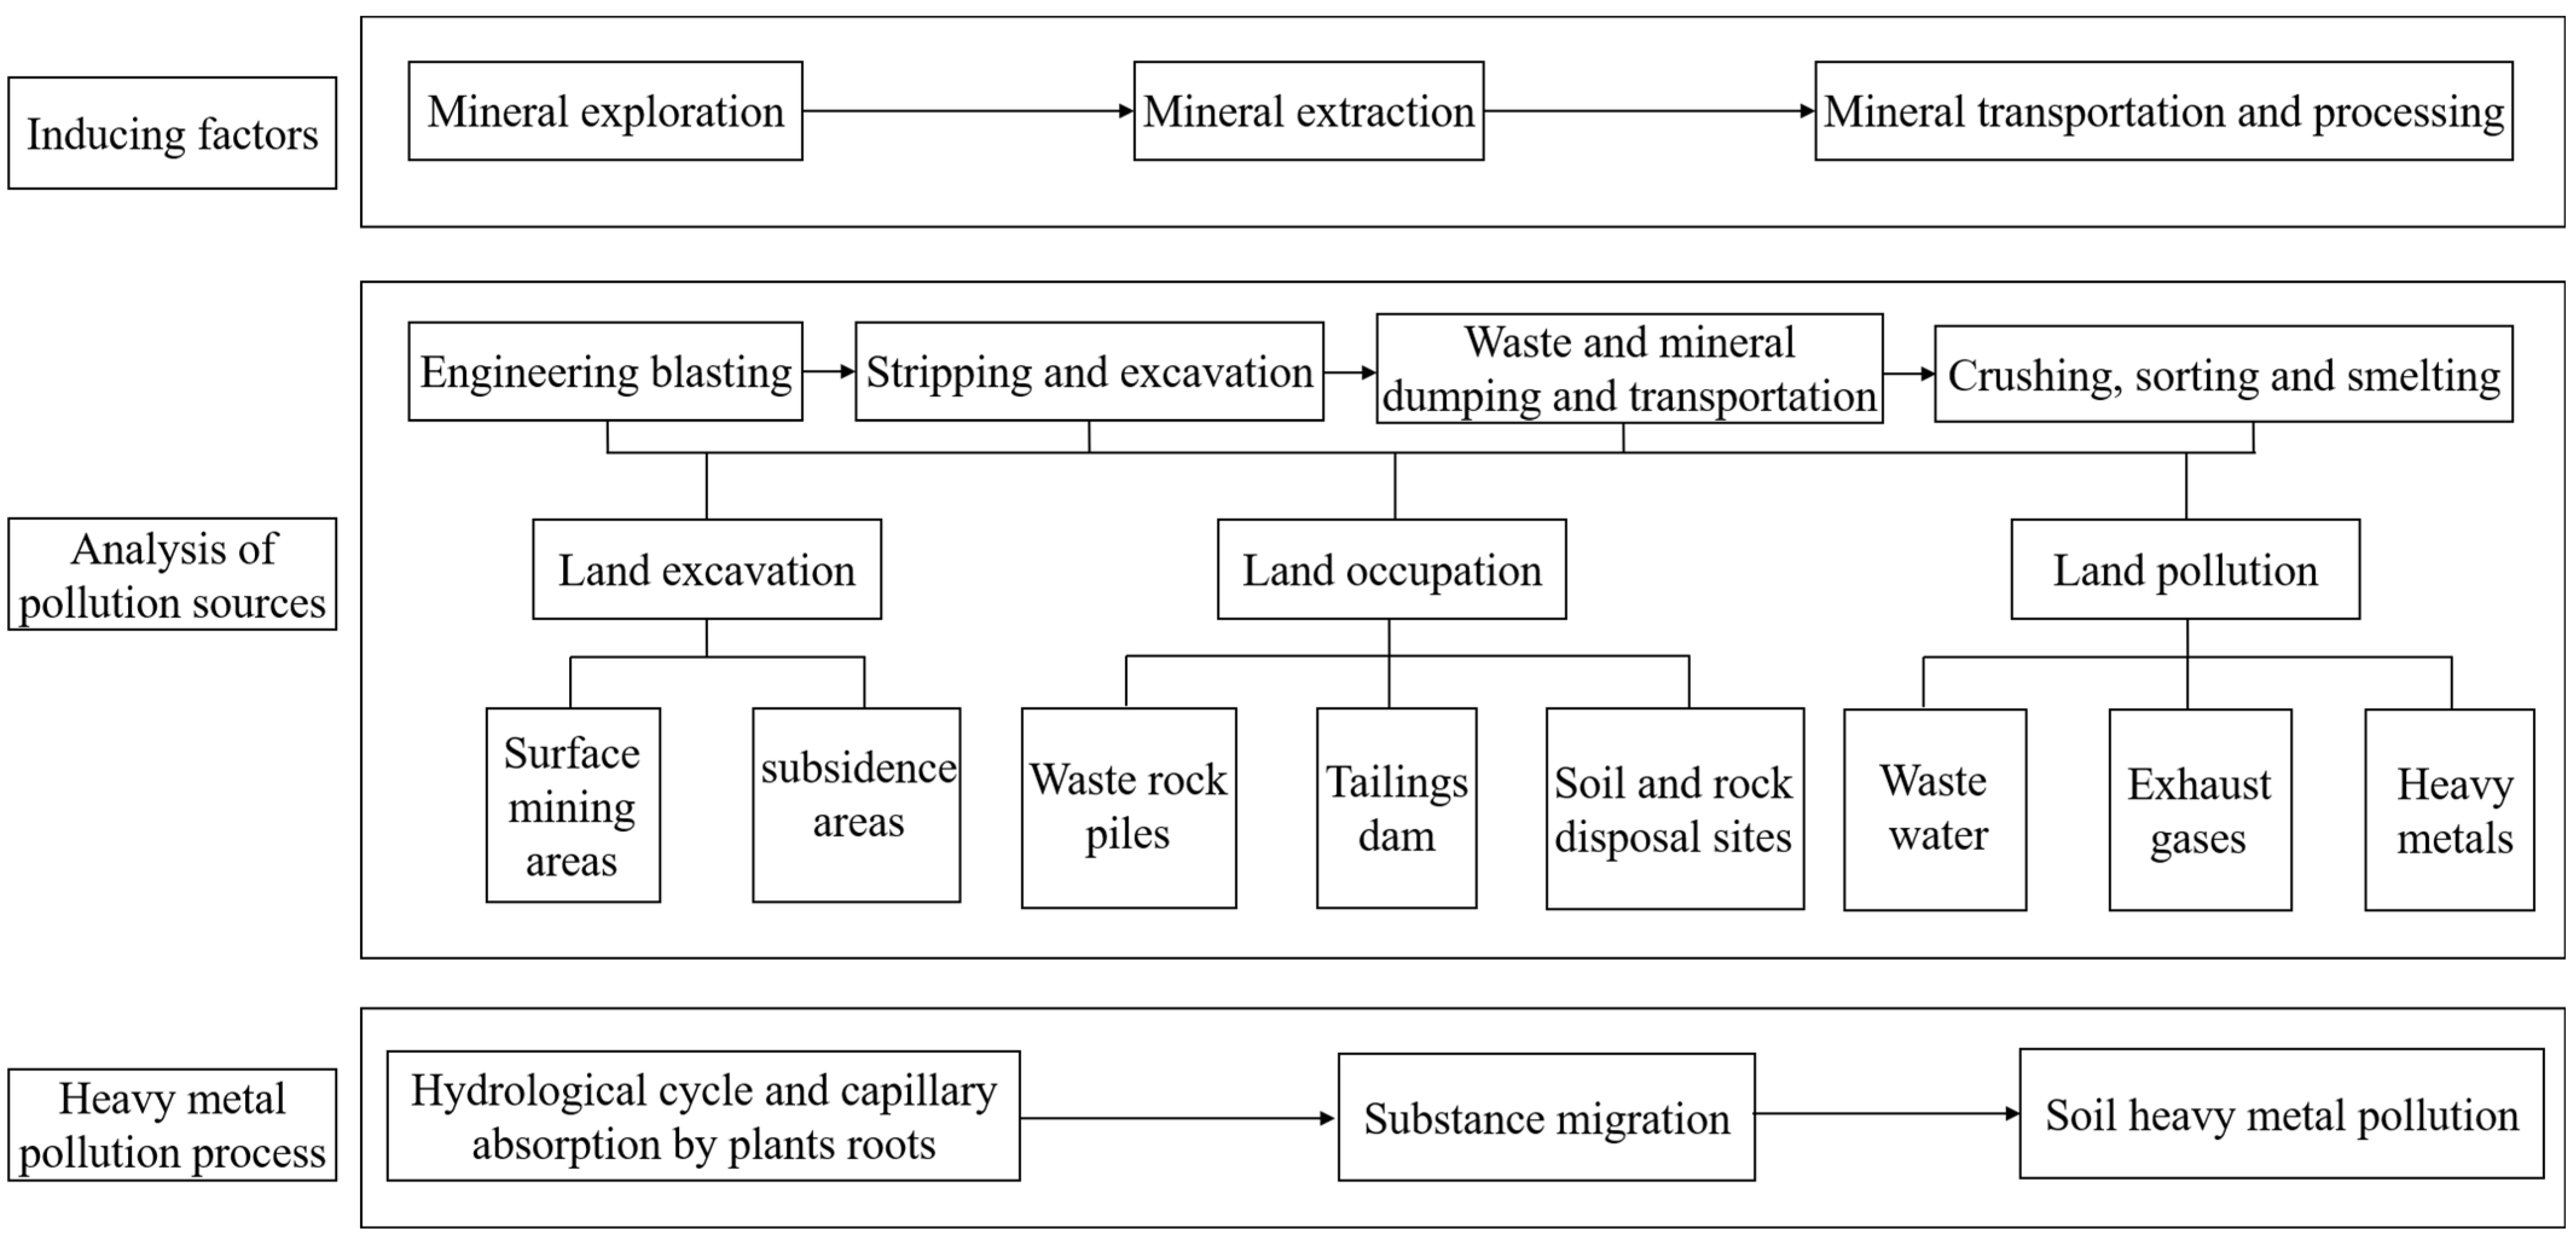
To investigate the causal relationship between heavy metal pollution issues and mining production activities, this study establishes a pollution analysis diagram for the tailings dam based on the mining production process. The ecological damage caused by lead–zinc mine is mainly manifested in three aspects (Figure 8). Firstly, land and vegetation destruction caused during mineral exploration leads to the disruption of the original ecosystem. Secondly, the waste materials generated during the mineral extraction process are extensively deposited in the tailings dam and stone discharge yard, resulting in widespread heavy metal pollution in the sites. Thirdly, the wastewater, exhaust gases and residues produced during mineral transportation and processing contribute to heavy metal pollution in the surrounding environment. Hence, it can be found that apart from directly damaging the existing ecosystem, mineral extraction also causes heavy metal pollution for the surrounding environment under runoff, infiltration and capillary adsorption by plant roots.

3.6. Exploration of Potential Ecological Hazards

The elevated concentrations of heavy metals in the vicinity of the tailings dam not only directly endanger the growth of crops, fruit trees and vegetables, resulting in significant decreases in both yield and quality, but also pose a threat to the health of local residents. Additionally, the tailings dam is located in the upstream region of the Dongjiang Lake. This study has revealed that the heavy metal contents downstream of the tailings dam are higher than those upstream, indicating that heavy metals have migrated and diffused downstream. After the soil around the tailings dam is severely contaminated by heavy metals, these heavy metal elements can infiltrate and enter the surface water system or groundwater system, ultimately flowing into Dongjiang Lake. When the water quality of Dongjiang Lake and the groundwater are both contaminated by heavy metals, it will pose a potential threat to water security for humans as well as the forestry and biological resources within the Dongjiang Lake Ecological Protection Area. Therefore, appropriate measures need to be taken to remediate the heavy metal pollution in this tailings dam.

4. Discussion

In soil, Pb, Zn, As and Cu can exist in various forms. The specific forms and chemical speciation of these elements in soil depend on several factors, including soil pH, organic matter content, redox conditions and the source of contamination. Pb, Zn and Cu have exchangeable, precipitated and organic-bound forms. As has the oxidized form as arsenate and an organic-bound form. In terms of the exchangeable form for Pb, Zn and Cu, it is loosely bound to the soil particles and can be readily released into soil solution, making it potentially available for plant uptake. As can exist in a reduced form as arsenite (As(III)). Arsenite is typically more mobile than arsenate. Therefore, the predominant form of heavy metals distributed at the interface layer and reclaimed zone is an exchangeable state of Pb, Zn and Cu as well as the arsenite form of As. As for precipitated forms, Pb, Zn and Cu can form insoluble compounds with other elements in the soil, such as carbonates, phosphates and sulfates, resulting in less availability for plants. The heavy metal As commonly occurs in oxidized form as arsenate. It can adsorb into soil particles, making it less mobile. Hence, precipitated Pb, Zn, Cu and the oxidized form of As (As(V)) can be mainly found in the tailings zone and deep zone.
The pH value of soil can influence the forms and availability of Pb, Zn, As and Cu. Lower pH values can increase the exchangeable and soluble forms of Pb, Zn and Cu, enhancing their potential for leaching and plant uptake. Under acidic conditions, arsenate (As(V)) tends to be more mobile and soluble, making it more accessible for leaching and plant uptake. In alkaline soils, Pb, Zn and Cu tend to form insoluble precipitates with carbonates and hydroxides, reducing their mobility and availability. As pH increases, arsenate can undergo adsorption onto soil particles and become less mobile. Therefore, it can be found that under acidic conditions, the mobility of heavy metal elements is enhanced, and they are more prone to accumulate at a certain location through capillary adsorption and rhizosphere effect. Under alkaline conditions, heavy metal elements tend to form carbonates and hydroxides, reducing their solubility and concentration in the environment.
The hydrologic processes occurring in underground water systems can influence the distribution of heavy metal concentrations, including their enrichment. As water infiltrates through the soil, it can transport dissolved or suspended metals from their source areas to other locations. The rate and direction of groundwater flow determine the extent to which heavy metals disperse within the subsurface. The presence of geological features, such as fractures, faults and preferential flow pathways, can influence the distribution of heavy metals. These features can act as conduits for subsurface flow, allowing metals to migrate more rapidly or concentrate in specific areas, resulting in localized enrichment. The enrichment of heavy metals at the interface layer between the reclaimed zone and the tailings layer (60 cm) is primarily attributed to the processes of capillary adsorption and biogeochemical adsorption by plant roots. The hydrogeological characteristics, such as fractures, provide preferential pathways for metal migration. The dissolution of heavy metals in underground water is a necessary condition for their migration and enrichment.

5. Conclusions

This study analyzed the distribution patterns of heavy metals with depth as well as the pollution levels and ecological risk caused by heavy metals in the tailings dam in an abandoned lead–zinc mine. Then, the sources and potential hazards of heavy metals were further investigated. The conclusions can be drawn as follows:
  • The concentrations of heavy metals within the reclaimed zone show a significant increasing trend with depth, and there is an enrichment of heavy metals observed at the interface layer. In the tailings layer and deep zone, the variation patterns for the four heavy metal concentrations are not clearly observed, but the contents remain relatively high;
  • The pollution degrees of heavy metals in each zone are ranked as (high to low): the interface layer > the tailings layer > the deep zone > the reclaimed zone. The four heavy metals pollute the soil in the descending order of Pb > Zn > As > Cu;
  • The interface layer, tailings layer and deep zone exhibit extremely strong PER with the RI values far exceeding 600, while the reclaimed zone shows moderate PER, with an RI value of 172.444. The contribution rates of the four heavy metals to RI are as follows, in descending order: Pb > As > Zn > Cu;
  • A common source of heavy metal pollution in the study area has been identified based on correlation analysis, namely the lead–zinc mine. Heavy metal pollution poses a potential threat to water security for humans and the biological resources within the Dongjiang Lake Ecological Protection Area.

Author Contributions

Conceptualization, writing—original draft, investigation and formal analysis: Q.W.; methodology and visualization: Q.W. and J.C.; writing—review and editing: Q.W., J.C., F.G., Z.L. and M.Z.; supervision and funding acquisition: Z.L. All authors have read and agreed to the published version of the manuscript.

Funding

Zijun Li was supported by the National Natural Science Foundation of China (No. 52274247). Qiaoli Wang was supported by the China Scholarship Council (No. 202206370105). Jiannan Cai was supported by the Hong Kong Research Grants Council Postdoctoral Fellowship awarded by the Research Grants Council of Hong Kong (PDFS2223-4H01).

Institutional Review Board Statement

The present study did not involve humans or animals.

Informed Consent Statement

Not applicable.

Data Availability Statement

The datasets used and analyzed during the current study are available from the corresponding author upon reasonable request.

Acknowledgments

The authors are very grateful to the anonymous reviewers and the editors for their valuable comments and suggestions.

Conflicts of Interest

The authors declare no conflict of interest.

References

  1. Zhao, G.; Ma, Y.; Liu, Y.; Cheng, J.; Wang, X. Source analysis and ecological risk assessment of heavy metals in farmland soils around heavy metal industry in Anxin County. Sci. Rep. 2022, 12, 10562. [Google Scholar] [CrossRef]
  2. Li, Z.; Ma, Z.; van der Kuijp, T.J.; Yuan, Z.; Huang, L. A review of soil heavy metal pollution from mines in China: Pollution and health risk assessment. Sci. Total Environ. 2014, 468, 843–853. [Google Scholar] [CrossRef]
  3. Cao, J.; Xie, C.; Hou, Z. Ecological evaluation of heavy metal pollution in the soil of Pb-Zn mines. Ecotoxicology 2022, 31, 259–270. [Google Scholar] [CrossRef] [PubMed]
  4. Liu, H.; Probst, A.; Liao, B. Metal contamination of soils and crops affected by the Chenzhou lead/zinc mine spill (Hunan, China). Sci. Total Environ. 2005, 339, 153–166. [Google Scholar] [CrossRef] [PubMed] [Green Version]
  5. Li, J.; Xie, Z.M.; Xu, J.M.; Sun, Y.F. Risk assessment for safety of soils and vegetables around a lead/zinc mine. Environ. Geochem. Health 2006, 28, 37–44. [Google Scholar] [CrossRef]
  6. Li, Y.; Wang, Y.B.; Gou, X.; Su, Y.B.; Wang, G. Risk assessment of heavy metals in soils and vegetables around non-ferrous metals mining and smelting sites, Baiyin, China. J. Environ. Sci. 2006, 18, 1124–1134. [Google Scholar] [CrossRef]
  7. Zhuang, P.; Zou, B.; Li, N.Y.; Li, Z.A. Heavy metal contamination in soils and food crops around Dabaoshan mine in Guangdong, China: Implication for human health. Environ. Geochem. Health 2009, 31, 707–715. [Google Scholar] [CrossRef] [PubMed]
  8. Štofejová, L.; Fazekaš, J.; Fazekašová, D. Analysis of heavy metal content in soil and plants in the dumping ground of Magnesite Mining Factory Jelšava-Lubeník (Slovakia). Sustainability 2021, 13, 4508. [Google Scholar] [CrossRef]
  9. Sonone, S.S.; Jadhav, S.; Sankhla, M.S.; Kumar, R. Water contamination by heavy metals and their toxic effect on aquaculture and human health through food Chain. Lett. Appl. NanoBioSci. 2020, 10, 2148–2166. [Google Scholar] [CrossRef]
  10. Shi, J.; Zhao, D.; Ren, F.; Huang, L. Spatiotemporal variation of soil heavy metals in China: The pollution status and risk assessment. Sci. Total Environ. 2023, 871, 161768. [Google Scholar] [CrossRef]
  11. Wang, Q.; Li, Z.; Xu, Y.; Li, R.; Zhang, M. Adaptive-weight water quality assessment and human health risk analysis for river water in Hong Kong. Environ. Sci. Pollut. Res. 2022, 29, 75936–75954. [Google Scholar] [CrossRef]
  12. Rahman, H.H.; Yusuf, K.K.; Niemann, D.; Dipon, S.R. Urinary speciated arsenic and depression among US adults. Environ. Sci. Pollut. Res. 2020, 27, 23048–23053. [Google Scholar] [CrossRef]
  13. Muenyi, C.S.; Ljungman, M.; States, J.C. Arsenic Disruption of DNA Damage Responses—Potential Role in Carcinogenesis and Chemotherapy. Biomolecules 2015, 5, 2184–2193. [Google Scholar] [CrossRef] [Green Version]
  14. Vareda, J.P.; Valente, A.J.; Durães, L. Assessment of heavy metal pollution from anthropogenic activities and remediation strategies: A review. J. Environ. Manag. 2019, 246, 101–118. [Google Scholar] [CrossRef] [PubMed]
  15. Vuong, X.T.; Vu, L.D.; Duong, A.T.T.; Duong, H.T.; Hoang, T.H.T.; Luu, M.N.T.; Nguyen, T.N.; Nguyen, V.D.; Nguyen, T.T.T.; Van, T.H.; et al. Speciation and environmental risk assessment of heavy metals in soil from a lead/zinc mining site in Vietnam. Int. J. Environ. Sci. Technol. 2023, 20, 5295–5310. [Google Scholar] [CrossRef]
  16. Gujre, N.; Rangan, L.; Mitra, S. Occurrence, geochemical fraction, ecological and health risk assessment of cadmium, copper and nickel in soils contaminated with municipal solid wastes. Chemosphere 2021, 271, 129573. [Google Scholar] [CrossRef]
  17. He, W.; He, Q.; Zhou, J. Soil weathering-water environment-ecological risks in Hanjiang River Basin, China. Quat. Int. 2015, 380, 297–304. [Google Scholar] [CrossRef]
  18. Zhong, S.; Geng, H.; Zhang, F.; Liu, Z.; Wang, T.; Song, B. Risk assessment and prediction of heavy metal pollution in groundwater and river sediment: A case study of a typical agricultural irrigation area in Northeast China. Int. J. Anal. Chem. 2015, 2015, 921539. [Google Scholar] [CrossRef] [Green Version]
  19. Chen, Y.; Jiang, X.; Wang, Y.; Zhuang, D. Spatial characteristics of heavy metal pollution and the potential ecological risk of a typical mining area: A case study in China. Process Saf. Environ. Protect. 2018, 113, 204–219. [Google Scholar] [CrossRef]
  20. Chen, W.; Zhu, K.; Cai, Y.; Wang, Y.; Liu, Y. Distribution and ecological risk assessment of arsenic and some trace elements in soil of different land use types, Tianba Town, China. Environ. Technol. Innov. 2021, 24, 102041. [Google Scholar] [CrossRef]
  21. Xu, X.; Wang, T.; Sun, M.; Bai, Y.; Fu, C.; Zhang, L.; Hu, X.; Hagist, S. Management principles for heavy metal contaminated farmland based on ecological risk—A case study in the pilot area of Hunan province, China. Sci. Total Environ. 2019, 684, 537–547. [Google Scholar] [CrossRef]
  22. Kowalska, J.B.; Mazurek, R.; Gąsiorek, M.; Zaleski, T. Pollution indices as useful tools for the comprehensive evaluation of the degree of soil contamination–A review. Environ. Geochem. Health 2018, 40, 2395–2420. [Google Scholar] [CrossRef] [PubMed] [Green Version]
  23. Yari, A.A.; Varvani, J.; Zare, R. Assessment and zoning of environmental hazard of heavy metals using the Nemerow integrated pollution index in the vineyards of Malayer city. Acta Geophys. 2021, 69, 149–159. [Google Scholar] [CrossRef]
  24. Wang, X.; Sun, Y.; Li, S.; Wang, H. Spatial distribution and ecological risk assessment of heavy metals in soil from the Raoyanghe Wetland, China. PLoS ONE 2019, 14, e0220409. [Google Scholar] [CrossRef] [Green Version]
  25. Huang, S.W.; Jin, J.Y. Status of heavy metals in agricultural soils as affected by different patterns of land use. Environ. Monit. Assess. 2008, 139, 317–327. [Google Scholar] [CrossRef]
  26. Muller, G. Index of geoaccumulation in sediments of the Rhine River. Geojournal 1969, 2, 108–118. [Google Scholar]
  27. Okedeyi, O.O.; Dube, S.; Awofolu, O.R.; Nindi, M.M. Assessing the enrichment of heavy metals in surface soil and plant (Digitaria eriantha) around coal-fired power plants in South Africa. Environ. Sci. Pollut. Res. 2014, 21, 4686–4696. [Google Scholar] [CrossRef]
  28. Adimalla, N. Heavy metals contamination in urban surface soils of Medak province, India, and its risk assessment and spatial distribution. Environ. Geochem. Health 2020, 42, 59–75. [Google Scholar] [CrossRef]
  29. Jamal, A.; Delavar, M.A.; Naderi, A.; Nourieh, N.; Medi, B.; Mahvi, A.H. Distribution and health risk assessment of heavy metals in soil surrounding a lead and zinc smelting plant in Zanjan, Iran. Hum. Ecol. Risk Assess. Int. J. 2018, 25, 1018–1033. [Google Scholar] [CrossRef]
  30. Nasirian, H.; Irvine, K.N.; Sadeghi, S.M.T.; Mahvi, A.H.; Nazmara, S. Assessment of bed sediment metal contamination in the Shadegan and Hawr Al Azim wetlands, Iran. Environ. Monit. Assess. 2016, 188, 107. [Google Scholar] [CrossRef] [PubMed]
  31. Cheng, J.L.; Shi, Z.; Zhu, Y.W. Assessment and mapping of environmental quality in agricultural soils of Zhejiang Province, China. J. Environ. Sci. 2007, 19, 50–54. [Google Scholar] [CrossRef] [PubMed]
  32. Brady, J.P.; Ayoko, G.A.; Martens, W.N.; Goonetilleke, A. Development of a hybrid pollution index for heavy metals in marine and estuarine sediments. Environ. Monit. Assess. 2015, 187, 306. [Google Scholar] [CrossRef] [Green Version]
  33. Mazurek, R.; Kowalska, J.; Gąsiorek, M.; Zadrożny, P.; Józefowska, A.; Zaleski, T.; Kępka, W.; Tymczuk, M.; Orłowska, K. Assessment of heavy metals contamination in surface layers of Roztocze National Park forest soils (SE Poland) by indices of pollution. Chemosphere 2017, 168, 839–850. [Google Scholar] [CrossRef] [PubMed]
  34. Solgi, E.; Esmaili-Sari, A.; Riyahi-Bakhtiari, A.; Hadipour, M. Soil contamination of metals in the three industrial estates, Arak, Iran. Bull. Environ. Contam. Toxicol. 2012, 88, 634–638. [Google Scholar] [CrossRef] [PubMed]
  35. Yang, Q.; Li, Z.; Lu, X.; Duan, Q.; Huang, L.; Bi, J. A review of soil heavy metal pollution from industrial and agricultural regions in China: Pollution and risk assessment. Sci. Total Environ. 2018, 642, 690–700. [Google Scholar] [CrossRef]
  36. Hakanson, L. An ecological risk index for aquatic pollution control. A sedimentological approach. Water Res. 1980, 14, 975–1001. [Google Scholar] [CrossRef]
  37. Liu, Y.; Wang, Q.; Zhuang, W.; Yuan, Y.; Yuan, Y.; Jiao, K.; Wang, M.; Chen, Q. Calculation of Thallium’s toxicity coefficient in the evaluation of potential ecological risk index: A case study. Chemosphere 2018, 194, 562–569. [Google Scholar] [CrossRef]
  38. Li, Y.; Li, P.; Liu, L. Source identification and potential ecological risk assessment of heavy metals in the topsoil of the Weining Plain (Northwest China). Expo. Health 2022, 14, 281–294. [Google Scholar] [CrossRef]
  39. Kumar, V.; Pandita, S.; Setia, R. A meta-analysis of potential ecological risk evaluation of heavy metals in sediments and soils. Gondwana Res. 2022, 103, 487–501. [Google Scholar] [CrossRef]
  40. Yan, N.; Liu, W.; Xie, H.; Gao, L.; Han, Y.; Wang, M.; Li, H. Distribution and assessment of heavy metals in the surface sediment of Yellow River, China. J. Environ. Sci. 2016, 39, 45–51. [Google Scholar] [CrossRef]
  41. Zhou, L.; Yang, B.; Xue, N.; Li, F.; Seip, H.M.; Cong, X.; Yan, Y.; Liu, B.; Han, B.; Li, H. Ecological risks and potential sources of heavy metals in agricultural soils from Huanghuai Plain, China. Environ. Sci. Pollut. Res. 2014, 21, 1360–1369. [Google Scholar] [CrossRef] [PubMed]
  42. Cai, J.; Kwan, M.P. Discovering co-location patterns in multivariate spatial flow data. Int. J. Geogr. Inf. Sci. 2022, 36, 720–748. [Google Scholar] [CrossRef]
  43. Wang, Q.; Li, Z.; Xu, Y.; Li, R.; Zhang, M. Analysis of spatio-temporal variations of river water quality and construction of a novel cost-effective assessment model: A case study in Hong Kong. Environ. Sci. Pollut. Res. 2022, 29, 28241–28255. [Google Scholar] [CrossRef] [PubMed]
  44. Zeng, L.; Wang, Y.; Jing, L.; Cheng, Q. Quantitative determination of auxiliary information for mapping soil heavy metals and soil contamination risk assessment. Appl. Geochem. 2021, 130, 104964. [Google Scholar] [CrossRef]
  45. Tian, K.; Huang, B.; Xing, Z.; Hu, W. In situ investigation of heavy metals at trace concentrations in greenhouse soils via portable X-ray fluorescence spectroscopy. Environ. Sci. Pollut. Res. 2018, 25, 11011–11022. [Google Scholar] [CrossRef] [PubMed]
  46. Peralta, E.; Pérez, G.; Ojeda, G.; Alcañiz, J.M.; Valiente, M.; López-Mesas, M.; Sánchez-Martín, M.J. Heavy metal availability assessment using portable X-ray fluorescence and single extraction procedures on former vineyard polluted soils. Sci. Total Environ. 2020, 726, 138670. [Google Scholar] [CrossRef] [PubMed]
  47. Manzoor, R.; Zhang, T.; Zhang, X.; Wang, M.; Pan, J.F.; Wang, Z.; Zhang, B. Single and combined metal contamination in coastal environments in China: Current status and potential ecological risk evaluation. Environ. Sci. Pollut. Res. 2018, 25, 1044–1054. [Google Scholar] [CrossRef]
  48. Baran, A.; Wieczorek, J.; Mazurek, R.; Urbański, K.; Klimkowicz-Pawlas, A. Potential ecological risk assessment and predicting zinc accumulation in soils. Environ. Geochem. Health 2018, 40, 435–450. [Google Scholar] [CrossRef] [Green Version]
  49. Zhou, W.; Dan, Z.; Meng, D.; Zhou, P.; Chang, K.; Zhuoma, Q.; Wang, J.; Xu, F.; Chen, G. Distribution characteristics and potential ecological risk assessment of heavy metals in soils around Shannan landfill site, Tibet. Environ. Geochem. Health 2023, 45, 393–407. [Google Scholar] [CrossRef]
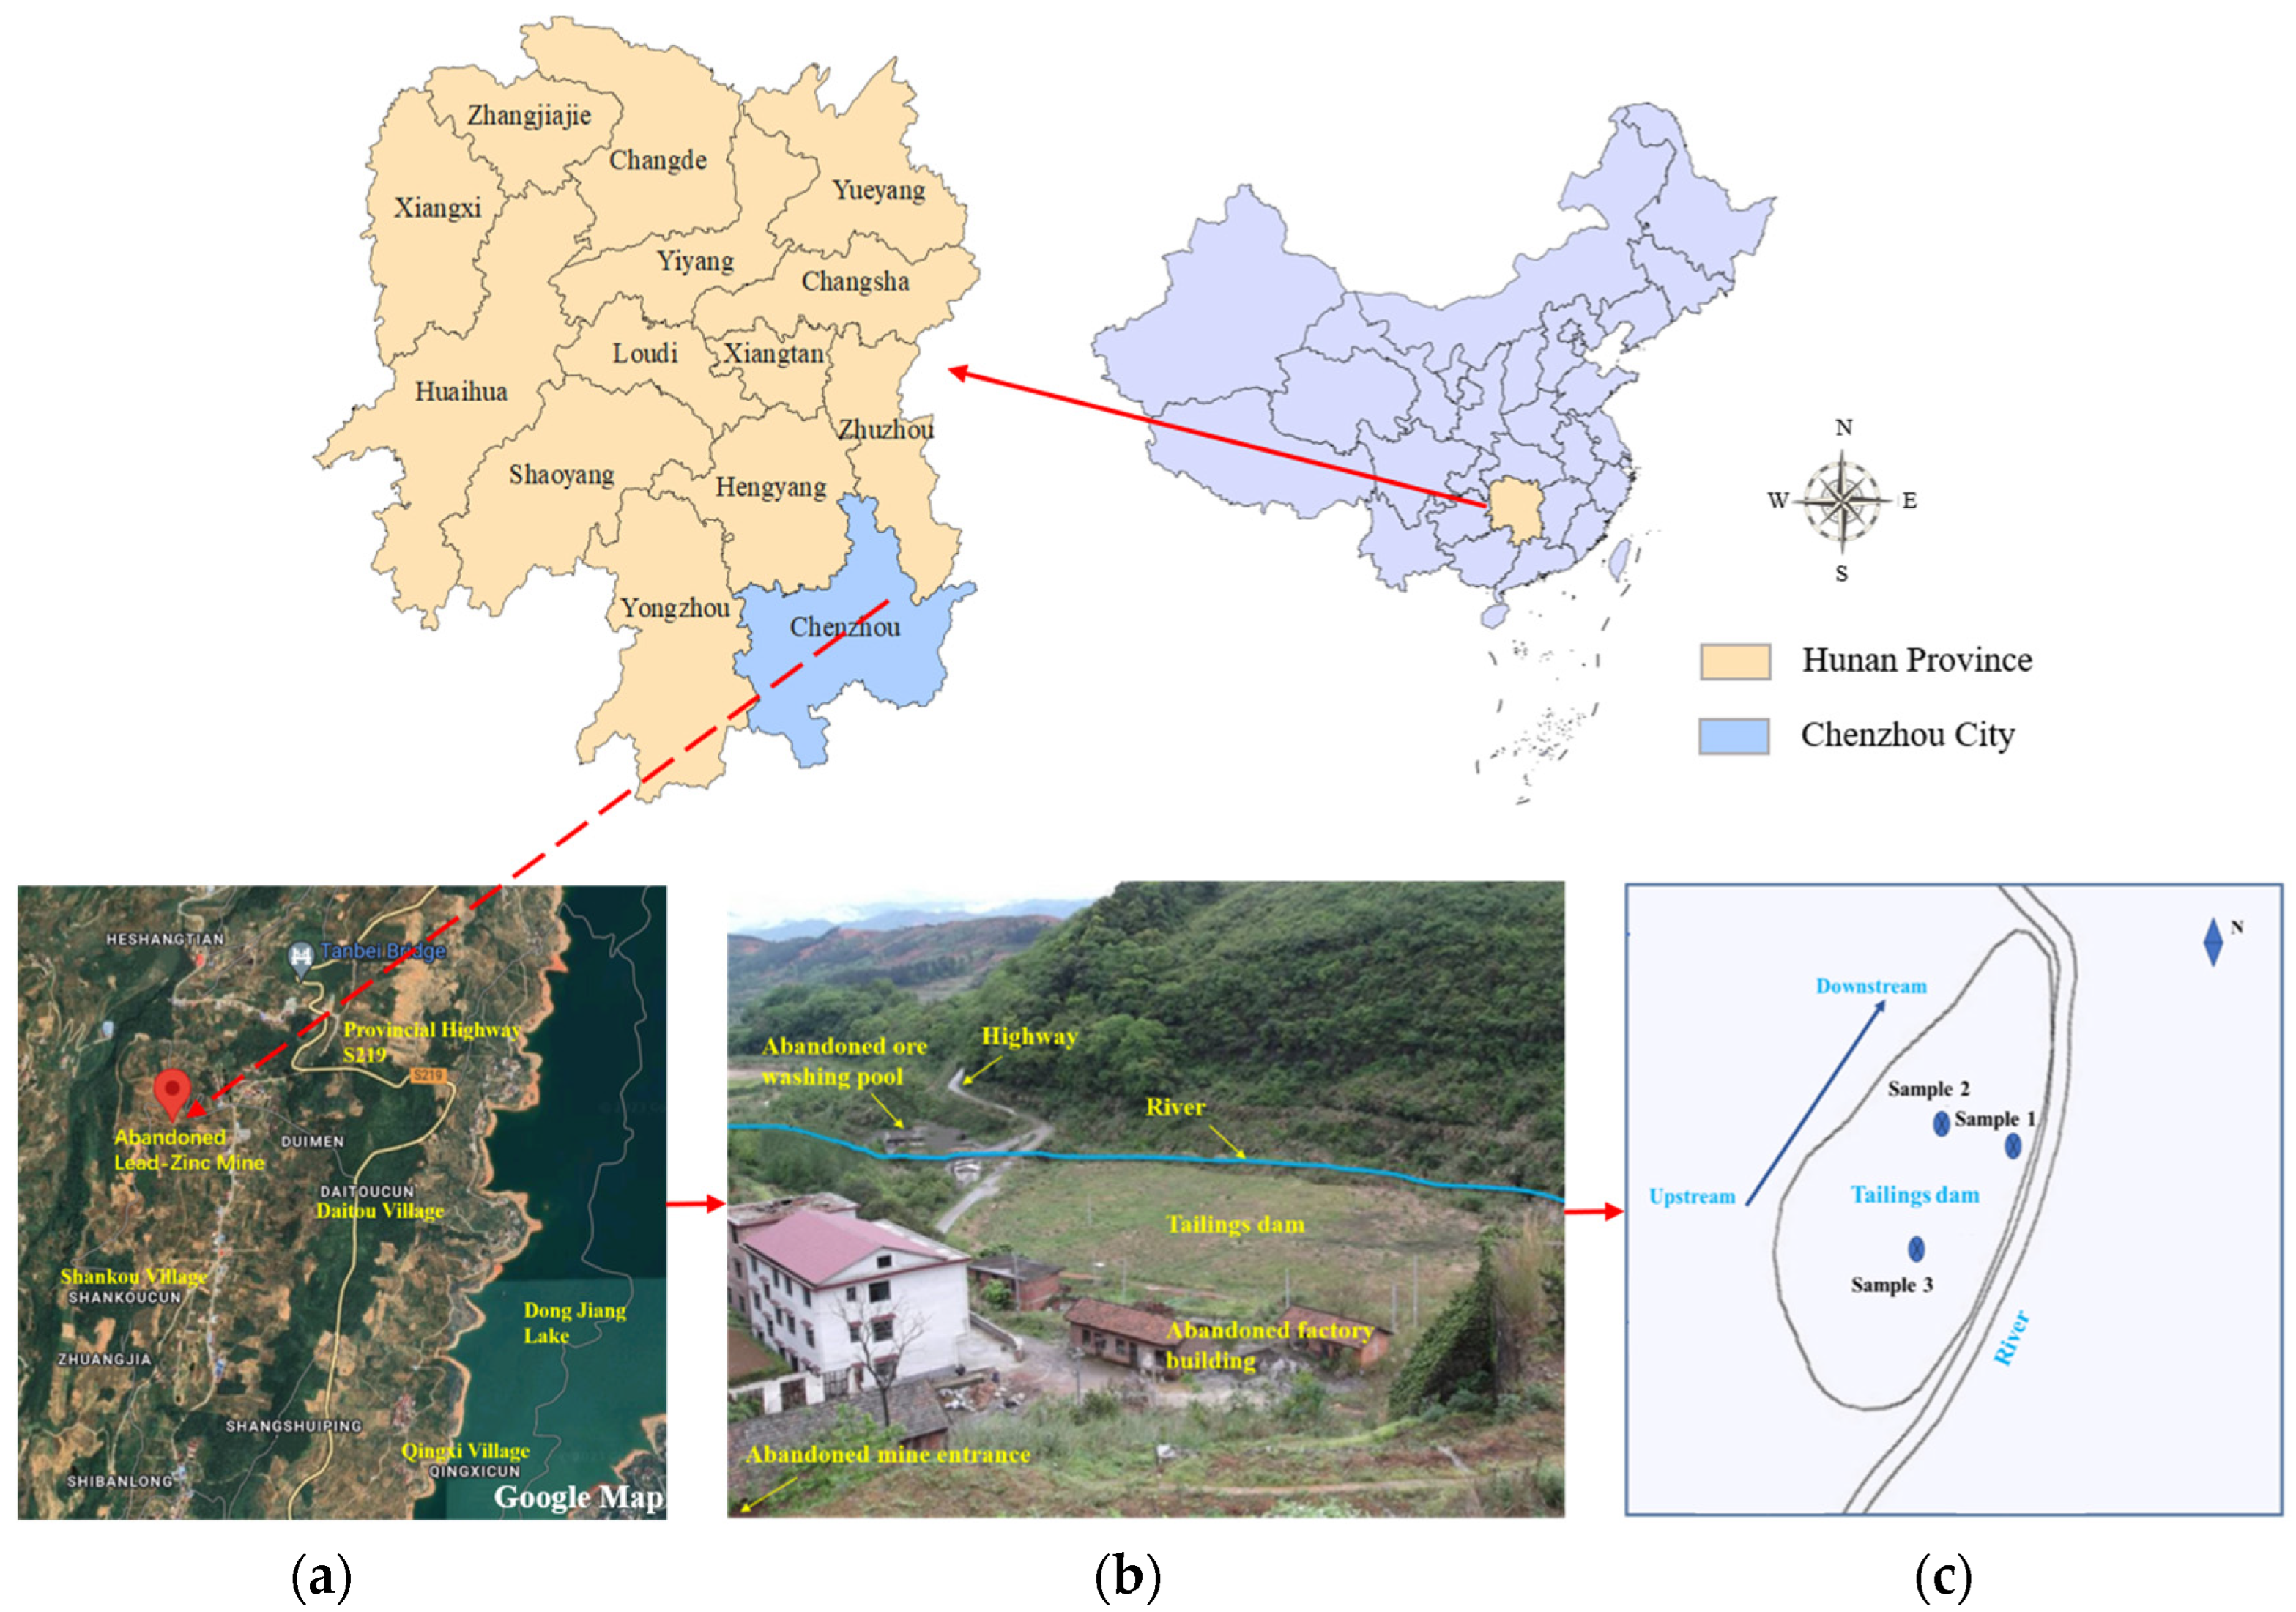
Figure 1. (a) Geographical location (modified based on Google map), (b) surrounding environment, and (c) sampling points of the abandoned lead–zinc mine tailings dam.
Sustainability 15 11987 g001
Figure 2. The degree of correlation between variables.
Sustainability 15 11987 g002
Figure 3. Vertical distribution patterns of the measured heavy metals; (a) Pb; (b) Zn; (c) Cu; (d) As.
Sustainability 15 11987 g003aSustainability 15 11987 g003b
Figure 4. The variations of heavy metal concentrations from upstream to downstream; (a) Pb; (b) Zn; (c) Cu; (d) As.
Sustainability 15 11987 g004
Figure 5. Igeo values of the four heavy metals at different depths.
Sustainability 15 11987 g005
Figure 6. PER index values of four heavy metals at different depths.
Sustainability 15 11987 g006
Figure 7. Correlation coefficient for four heavy metals in tailings dam.
Sustainability 15 11987 g007
Figure 8. Causal relationship between mineral extraction and heavy metal pollution.
Sustainability 15 11987 g008
Table 1. The classification of pollution levels for NCPI.
Grading LevelPollution IndexPollution Degree
IPc ≤ 0.7Without pollution
II0.7 < Pc ≤ 1Alert limit
III1 < Pc ≤ 2Mild pollution
IV2 < Pc ≤ 3Moderate pollution
VPc > 3Strong pollution
Table 2. The classification of pollution levels for geoaccumulation index.
Grading LevelPollution IndexPollution Degree
I I g e o ≤ 0Without pollution
II0 < I g e o ≤ 1Mild pollution–Moderate pollution
III1 < I g e o ≤ 2Moderate pollution
IV2 < I g e o ≤ 3Moderate pollution–Strong pollution
V3 < I g e o ≤ 4Strong pollution
VI4 < I g e o ≤ 5Strong pollution–Extremely strong pollution
VII5 < I g e o Extremely strong pollution
Table 3. The classification of pollution levels and ecological risk.
Single Pollution CoefficientSingle PER CoefficientPER Index
Threshold RangeSingle Pollution DegreeThreshold RangeSingle Ecological Risk LevelThreshold RangeTotal Ecological Risk Level
C f i < 1Mild pollution E r i < 40Mild RI < 150Mild
1 ≤ C f i < 3Moderate pollution40 ≤ E r i < 80Moderate 150≤ RI < 300Moderate
3 ≤ C f i < 6Strong pollution80 ≤ E r i < 160Slightly strong 300 ≤ RI < 600Strong
6 ≤ C f i Extremely strong160 ≤ E r i < 320Strong 600 ≤ RIExtremely strong
pollution320 ≤ E r i Extremely strong
Table 4. Comprehensive pollution index for the four heavy metals.
Sampling No. Depth (cm)Single-Factor Pollution Index (Pi)Nemerow ComprehensivePollution Index (Pc)
PbCuZnAs
Sampling 142.513.1312.0519.5345.03210.671
60217.50810.989161.54723.567170.297
9083.1654.76270.33916.56166.433
250172.7277.32697.56414.013132.571
400256.9028.791141.73728.025197.294
Sampling 242.514.4782.3819.0044.14011.530
60641.75135.531287.182250.955502.082
90359.93317.949225.21277.707281.531
250275.42112.821185.27546.497215.357
400124.91613.919101.37738.854101.172
Sampling 342.528.6203.2977.687.96221.914
60176.4318.42555.93247.070134.735
90162.7956.22744.80933.758123.153
250120.2024.39636.29220.38290.836
40093.8055.12313.45310.82869.815
Disclaimer/Publisher’s Note: The statements, opinions and data contained in all publications are solely those of the individual author(s) and contributor(s) and not of MDPI and/or the editor(s). MDPI and/or the editor(s) disclaim responsibility for any injury to people or property resulting from any ideas, methods, instructions or products referred to in the content.