1. Introduction
Land-use cover change has been the main factor responsible for deforestation and CO
2 emissions in the Amazon. However, numerous factors are responsible for forest degradation and consequent CO
2 emissions, as shown by [
1] who analyzed one decade of the carbon balance of the Amazon forest from 2006 to 2016 and correlated CO
2 emissions with forest degradation factors. Some literature reviews directly addressed lumber as one of the factors linked to forest degradation but not directly linked to CO
2 emissions. Recent works searched for a connection between lumber and CO
2 emissions. For example, ref. [
2] analyzed the CO
2 footprint of lumber activities and indicated that logging and sawn wood residues are the main contributors to the CO
2 emissions of lumber in the Amazon region. Furthermore, the Monitoring System of Wood Exploitation, SIMEX [
3], revealed that 70% of the wood processed in the State of Pará, Brazil, is illegal. Therefore, lumber activity can be linked to the degradation of the Amazon forest both by the illegality and the inefficiency of the wood industries exhibiting low sawn yield, leading to unsustainable demand for forest wood. It is worth noting that the term ‘sawn yield’ is characterized as the division between the volume in cubic meters produced by the piece from the sawmill divided by the volume of the log. Consequently, sawn yield in the Amazon region is particularly important: first, because it is related to the sustainability of the wood industries, second, because it is linked to forest degradation and CO
2 emissions [
4], and third, because wood residues represent underutilized energy potential in Amazon’s wood industries. Due to the importance of this factor, many authors have inferred the sawn yield of Amazon wood industries, such as the late works of Gerwing et al. (2001) [
5], Veríssimo et al. (2002) [
6], and Lentini et al. (2005) [
7]. Nascimento et al. (2006) [
8] presented sawn yields between 32% and 41% for the industries of the State of Pará, Brazil, while the recent works of de Mendoza Borges et al. (2017) [
9] and Melo et al. (2019) [
10] showed an average lumber yield of 47.7% for the Amazon region. Recently, da Silva Luz et al. (2020) [
4] inferred an average lumber yield of 45% for the State of Pará and mentioned the prospect of the energy potential of wood residues. A similar average sawn yield of 45% was also found in the dataset of de Mendonça Brasil (2021) [
11], which proposed a methodology for estimating the electric energy potential of wood residues in the State of Pará.
Other indicators correlate with the impacts of lumber activities in the Amazon region. The two environmental indicators, i.e., deforested areas and CO
2 emissions, are consolidated and available from government authority datasets. Some socioeconomic indicators, such as the area dedicated to agriculture, cattle population, human population, and demand for housing, are not directly connected to lumber activities. However, these indicators reflect land-use changes and an ongoing “dispute” for land at the expense of forests (Brito et al., 2019) [
12], and, thus, they can be interpreted as environmental factors. Additional socioeconomic indicators are causally linked to lumber activities, such as GDP, taxes, jobs and salaries. Several authors have published works about lumber’s impacts on the Amazon’s socioeconomics. In that sense, the socioeconomic characteristics of wood exploitation occur differently depending on the locality, industry size and specificity of the communities in the Amazon region. Veríssimo et al. (2002) [
6] showed the importance of the small sawmill production of local communities in the Amazon. Lima (2003) [
13] estimated that the wood industry in the Amazon created 250,000 jobs and generated an annual revenue of 2.5 billion dollars. Veríssimo (2002) [
6] showed that wood industries create 26 direct jobs per processed cubic meter, while the results of Hummel et al. (2010) [
14] provided evidence that in the State of Pará, Brazil, the number of direct jobs created per processed cubic meter is even higher, with an average of 36. This suggests regional variation in the socioeconomic outcomes of lumber production.
Cover change has been the main factor responsible for deforestation and CO
2 emissions in the Amazon [
15]. However, numerous factors are responsible for forest degradation and consequent CO
2 emissions, as shown by Assis et al. (2020) [
1], who analyzed one decade of the carbon balance of the Amazon forest from 2006 to 2016 and correlated the CO
2 emissions with the forest degradation factors. Some literature reviews have directly addressed lumber as one of the factors linked to forest degradation, albeit not directly tied to CO
2 emissions. Recent works have searched for a connection between lumber and CO
2 emissions. For example, Campos et al. (2021) analyzed the CO
2 footprint of lumber activities and indicated that logging and sawn wood residues are the main contributors to the CO
2 emissions of lumber in the Amazon region. Furthermore, the Monitoring System of Wood Exploitation—SIMEX [
3]—revealed that 70% of the wood processed in the State of Pará, Brazil, is illegal. Therefore, lumber activity can be linked to the degradation of the Amazon forest both by the illegality and the efficiency of the wood industries with low sawn yield, resulting in unsustainable demand for forest wood. Notably, the expression “sawn yield” is characterized as the division between the volume in cubic meters produced by the piece from the sawmill divided by the volume of the log. Consequently, sawn yield in the Amazon region is particularly important, first because it is related to the sustainability of the wood industries, second because it is linked to forest degradation and CO
2 emissions [
4] and third because wood residues represent an energy potential that is almost not used by wood industries in the Amazon. Due to the importance of this factor, many authors have inferred the sawn yield of Amazon wood industries, as in the works of Gerwing et al. (2001) [
5], Veríssimo et al. (2002) [
6], and Lentini et al. (2005) [
7]. Nascimento et al. (2006) [
8] presented sawn yields between 32% and 41% for the industries of the State of Pará, Brazil, while the recent works of de Mendoza Borges et al. (2017) [
9] and Melo et al. (2019) [
10] showed an average lumber yield of 47.7% for the Amazon region. Recently, da Silva Luz et al. (2021) [
4] inferred an average lumber yield of 45% for the State of Pará and mentioned the prospect of the energy potential of wood residues. An average sawn yield of 45% was also found from the dataset of de Mendonça Brasil (2021) [
11], which proposed a methodology for the electric energy potential of wood residues in the State of Pará.
Other indicators correlate with the impacts of lumber activities in the Amazon region. The two environmental indicators, i.e., deforested areas and CO
2 emissions, are consolidated and available by government authority datasets. Some socioeconomic indicators are not directly connected to lumber activities, such as the harvested area dedicated to agriculture, cattle, population, and demand for housing. However, these indicators represent land-use change and a “dispute” for land at the expense of forest [
12]; therefore, they can be translated into environmental factors. Additional socioeconomic indicators are causally linked to lumber activities, such as GDP, taxes, jobs and salaries. Several authors have published works about lumber’s impact on Amazon’s socioeconomics. In that sense, the socioeconomic characteristics of wood exploitation occur differently depending on the locality, industry size and specificity of the communities in the Amazon region. Veríssimo et al. (2002) [
6] showed the importance of the small sawmill production of local communities in the Amazon. Lima (2003) [
13] estimated that the wood industry in the Amazon created 250,000 jobs and generated an annual revenue of USD 2.5 billion.
The works of Brasil, Brasil Jr. and Malico (2020) [
16], da Silva Luz et al. (2020) [
4] and de Mendonça Brasil (2021) [
11] considered the destination of wood residues for energy use in the State of Pará, but if lumber activities are linked to forest degradation and CO
2 emissions, both wood products and wood residues carry a footprint of deforestation and CO
2 emissions. Therefore, the present work aimed to evaluate how wood production is connected to socioeconomic and environmental factors in the Amazon region by analyzing a historical series of ten years (2008–2018) of the available indicators from the State of Pará governmental authority.
The analysis of the sawn yield of the timber industries in the Amazon is important to unify the number that correlates the volume of logs consumed by the timber industries with the generated wood residues. A unified number is essential because, in Brazil, there is no single number, and the sawn yield data passed on by the timber industries, in general, are diversified, which leads to misinterpretation by the governmental environmental agencies [
17], so the available open dataset of the wood residues is not as consistent as the total log volume consumption. Therefore, for the purpose of this study, all factors are correlated with the log volume consumption, and the wood residues are also correlated with the log volume consumption. The second part of the work presents the indicators selected for the study, available in a 10-year dataset of the Government of the State of Pará. The third part of the work describes the principal component analysis (PCA) applied to determine if the dimensionality reduction in the indicators resulted in socioeconomic and environmental components and how the wood industry is correlated with the available indicators. The PCA results are detailed in the last part of this work, followed by the conclusions. Although studies in the literature demonstrate connections between sawmill production and socioeconomic and environmental factors in the Amazon, they did include analysis with a statistical and mathematical model that represents this relationship. Therefore, this work fills this gap.
2. Sawn Yield of Wood Industries in the Amazon Region
The sawn yield represents the efficiency of transforming wood logs into finished lumber in the Amazon region. It is connected to (a) the quantity and destination of wood residues, such as unused energy potential in the Amazonian state of Pará [
11,
16]; (b) the economic sustainability of the wood industries [
4]; and (c) forest sustainability, which is associated with lower demand for new areas of exploitation [
18]. If residues from wood production industries in the State of Pará were utilized for their potential as electric energy, the average calculated efficiency of converting wood energy into electricity would be 12.3% [
11].
Wood residues are a direct byproduct of log consumption in the Amazon, constituting approximately 53.46% of the total log volume, especially in the State of Pará. It is pertinent to mention that official data regarding total log volume consumption, which are open access, are generally more reliable than residue data [
17]. To summarize, if wood production activities in the Amazon are linked to deforestation and CO
2 emissions, wood products and the electrical energy derived from wood residues are likewise associated with deforestation and CO
2 emissions. Given this context, subsequent sections will explore potential correlations between log volume consumption (and its value) and socioeconomic and environmental factors.
Studies conducted by Gerwing et al. (2001) [
5] and Gerwing and Uhl (1997) [
19] investigated the sawn yield of two lumber industries and ten sawmills in a single municipality of the State of Pará, gauging the volume of logs and the final lumber products. Beyond these industries, they employed questionnaires in 52 other industries within the same municipality. They discovered average sawn yields of 35% for the sawmills and 36% for the lumber industries.
Veríssimo et al. (2002) [
6] utilized questionnaires to analyze 676 wood industries in the State of Pará, which comprised 602 sawmills and 74 plywood industries. While the study’s objective was not to infer the sawn yield, it sought to comprehensively characterize the wood industry in the State of Pará. However, the findings of the study suggested sawn yield values of 36% for the sawmills and 40% for the plywood industries.
The highest sawn yield of 55% for sawmills in the State of Pará was reported by Padilha et al. (2005) [
20], who distributed questionnaires across 707 wood industries. In 2014, the same figure was echoed by 68 wood industries responding to questionnaires near the Tucuruí Hydropower Complex, State of Pará, Brazil [
16]. Surveys used by Lentini et al. (2005) [
7] in the wood industry also indicated an increase in the sawn yield from 38% in 1998 to 42% in 2004.
Hummel et al. (2010) [
14] administered questionnaires to 2226 wood industries across the Amazon region. For the state of Pará, they analyzed 1067 industries in 31 municipalities. The study provided details of the total log volume consumed and the total lumber volume for each industry in 2009. The consumed log volume and total lumber volume are graphically presented specifically for the State of Pará in
Figure 1a and for the broader Amazon region in
Figure 1b [
14]. A linear regression of the data discloses that the sawn yield for the State of Pará alone is 38.1%, and is 40.9% when considering all industries across the Amazon region.
As mentioned above, questionnaires have been used in literature reviews about sawn yield, especially for a large number of analyzed industries. However, the precision of a survey depends on the quality of the original data presented by the wood industries. Analogous to Gerwing et al. (2001) [
5], an optional methodology is to statistically infer sawn yield by measuring the log volume and processed wood of selected industries and then comparing measurements with responded questionnaires.
Some studies inferred the sawn yield by measuring the volumes of logs and finished lumber in wood industries. Nascimento, Dutra et al. (2006) [
8] evaluated the wood residues of one sawmill in the State of Pará. They presented sawn yields between 32% and 41% with an average of 36.5%. Marialva et al. (2017) [
21] assessed the wood residues for the electric energy use of a small sawmill located in the Marajó Archipelago, State of Pará, and showed that final lumber products represented 30.3% of the total log volume. Recently, da Silva Luz et al. (2021) [
4] inferred an average lumber yield of 45% for the State of Pará. In one of the states of the Amazon region, the state of Amapá, the sawn yield is like that in the state of Pará. Lima et al. (2020) [
22] showed an average sawn yield of 43.95% of 50 logs analyzed in one sawmill in the State of Amapá. However, in the southern part of Amazon, the State of Mato Grosso, the reported sawn yield is higher than that found for the state of Pará. De Mendoza et al. (2017) [
9] analyzed 48 logs of Amazonian species, resulting in an average sawn yield of 47.48%; de Mendoza et al. (2019) [
23] analyzed 171 logs of Amazonian species with an average sawn yield of 48.33%; and Melo et al. (2019) [
10] showed an average lumber yield of 51%.
Table 1 summarizes the sawn yield of the cited references.
Based on the statistical analysis of published works depicted in
Figure 1 and
Table 1, a unified value for the sawn yield in the State of Pará can be suggested, with a mean value of 46.54% and a standard deviation of 7.07%.
The greatest timber production in Brazil is concentrated in the Amazon, with the states of Rondônia, Amazonas, Amapá, and Pará standing out. Although Pará is currently not the largest producer due to legal restrictions, it has historically been the largest timber producer in Brazil. In Pará, when there are significant problems with the lack of control over timber production, illegal logging increases substantially due to the established historical production in the region [
11].
3. Available Socioeconomic and Environmental Indicators
This study analyzed the dataset available for access from the State of Pará governmental authority website (FAPESPA, 2019) [
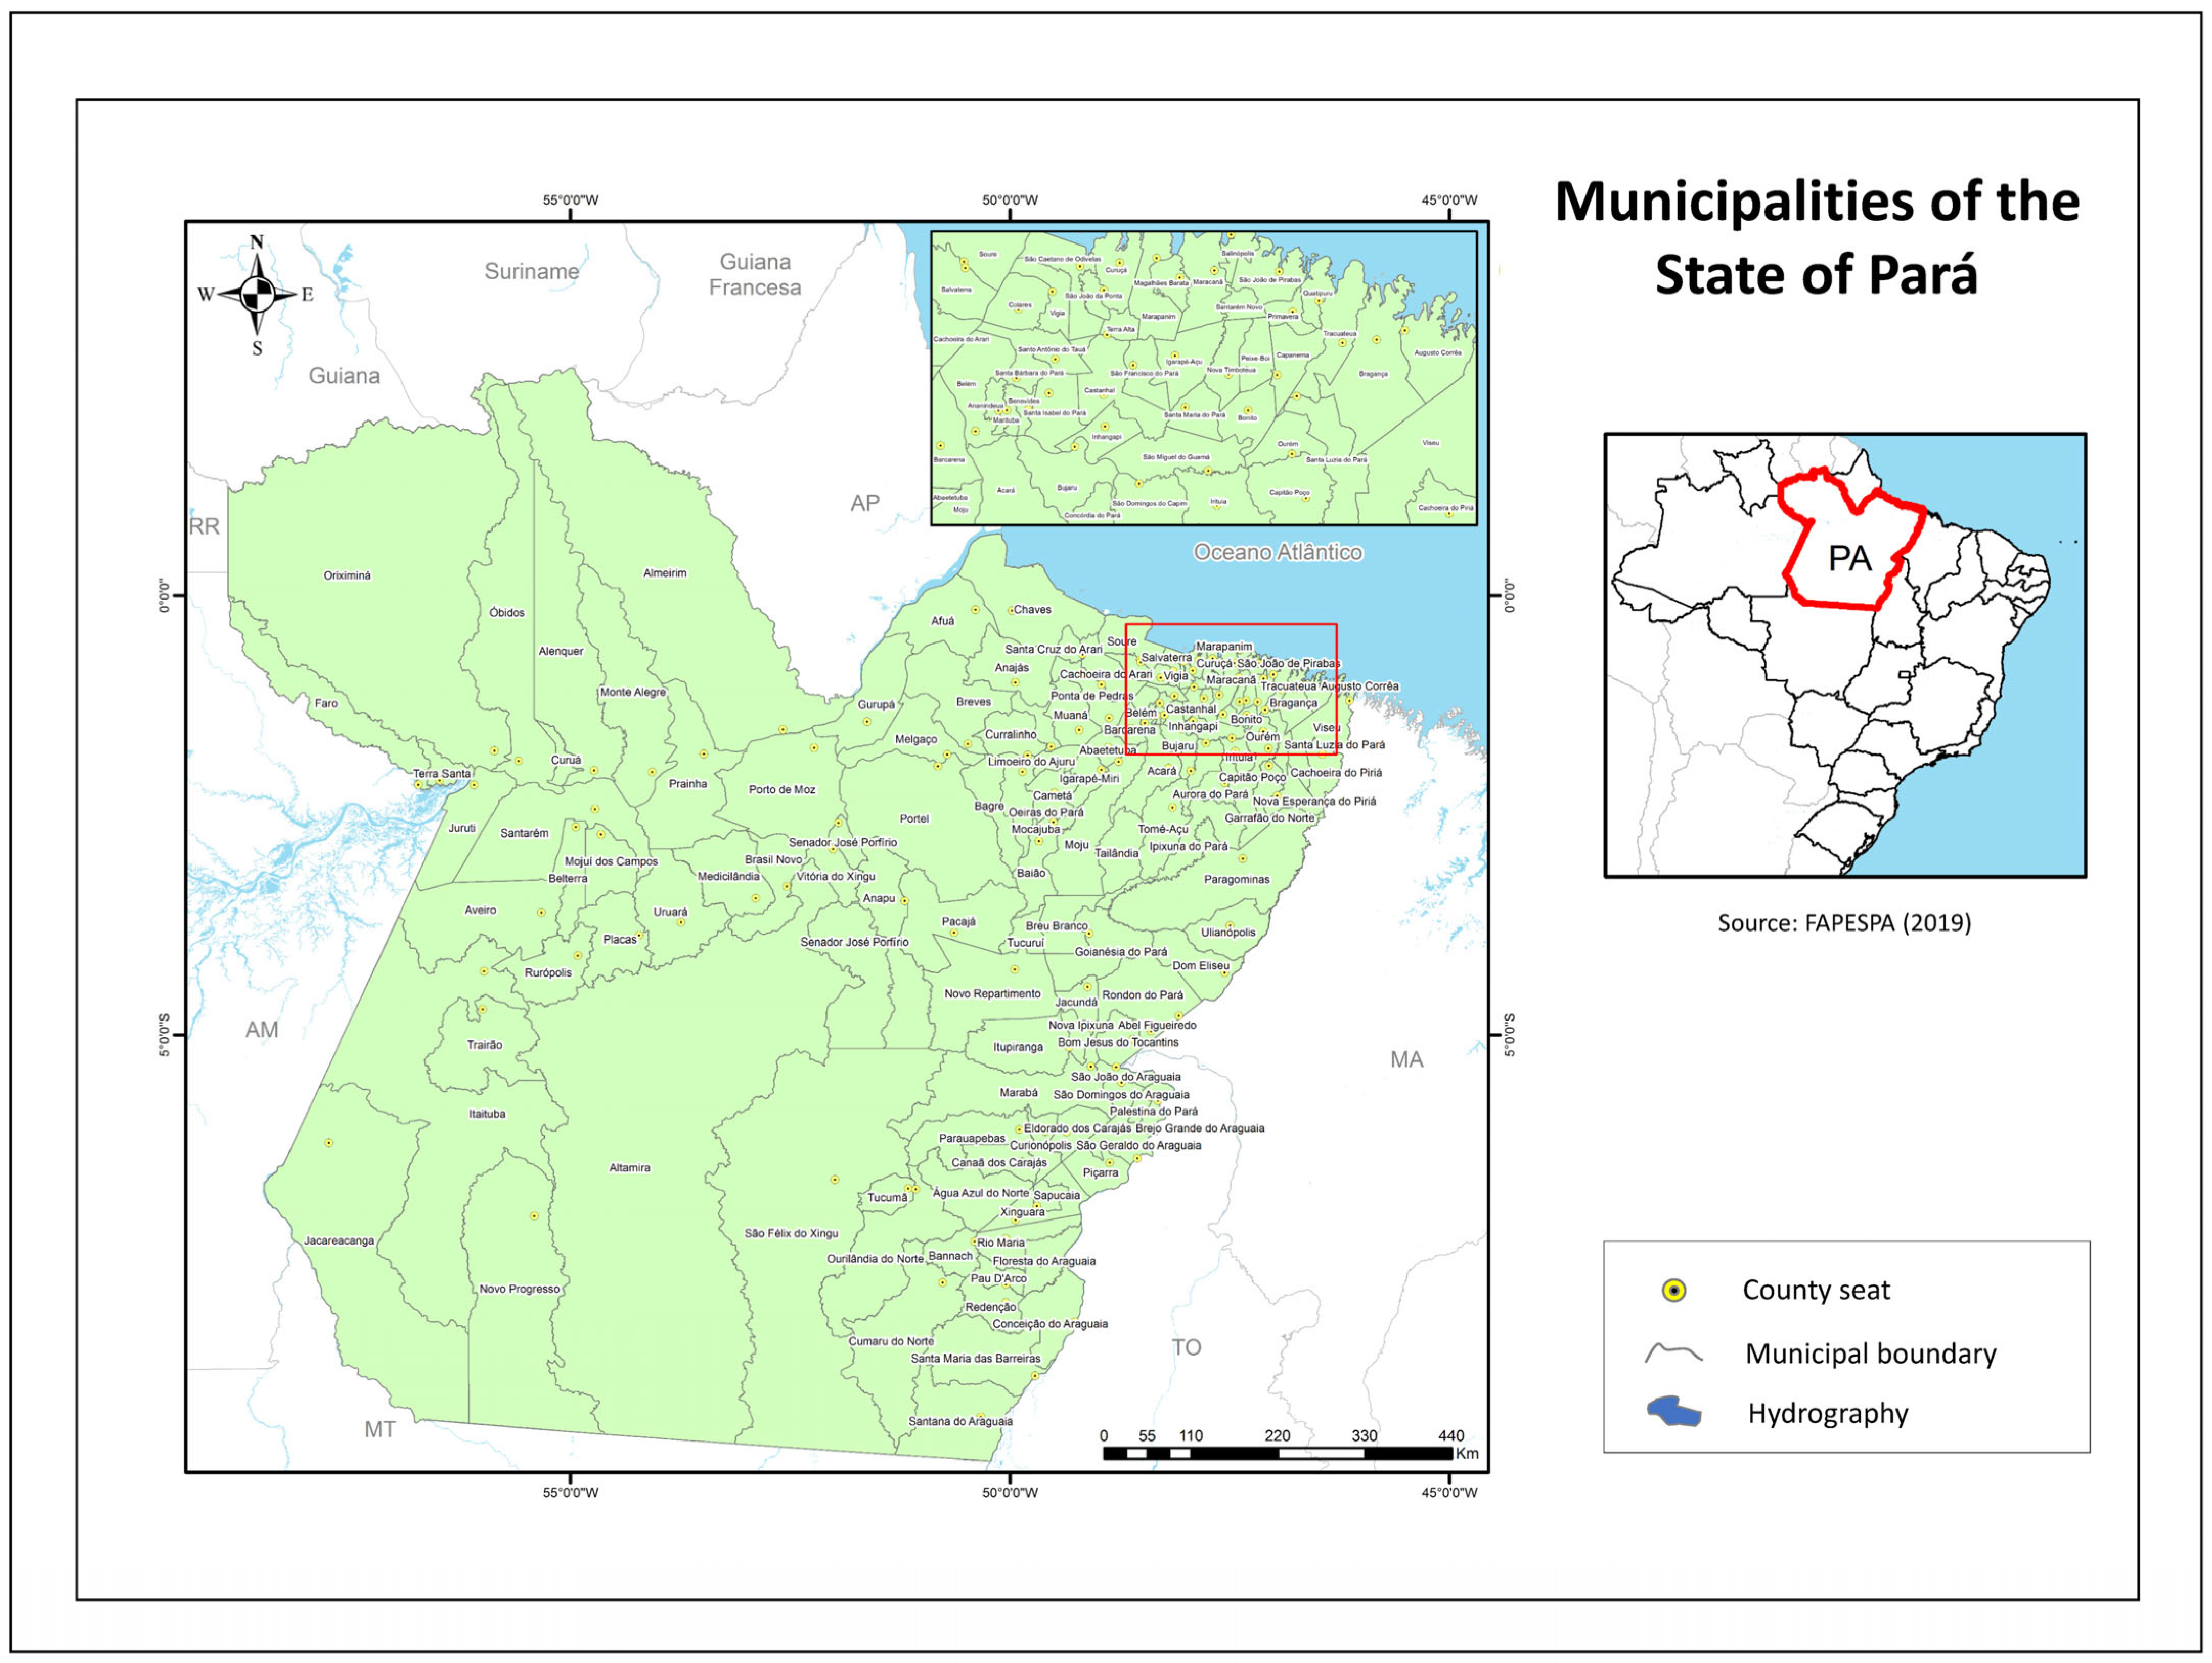
24]. A historical series of ten years, from 2008 to 2018, was compiled with the selection of 14 indicators of all 144 municipalities of the State of Pará. As an illustration, a map of the State of Pará and the 144 municipalities are shown in
Figure 2.
The dataset comprised 20,160 values. For instance, some indicators, such as registered light-duty vehicles, were not used due to a lack of correlation with wood production. Consequently, fourteen socioeconomic and environmental indicators were chosen, assuming that the wood production indicators were correlated with those indicators.
Table 2 depicts a list of the compiled indicators with the respective abbreviations that are used hereafter as variable names.
Some particularities of indicators presented in
Table 2 need to be further elucidated. The units are shown in parentheses, and those indicators without units are depicted as “numbers”. The Brazilian currency is the real, represented by BRL. In Brazil, the tax imposed on goods and services within a municipality is called ICMS, equivalent to value-added tax (VAT). Thus, the variable VAT refers to the Brazilian ICMS tax expressed in the local currency, the real (BRL).
Two indicators represent the wood production activity and were compiled for each municipality of the State of Pará: wood log consumption (WLG) and the revenue (total value) of the wood log consumption (LGV). To evaluate the correlation of wood production with socioeconomic indicators, three regional socioeconomic indicators were chosen for each municipality: population (POP), GDP per capita (GDP), and value-added tax (VAT). Additionally, four local socioeconomic indicators for each municipality were considered: the number of jobs (JOB), average salary (SAL), medical doctors per 1000 people (DOC), and high school evasion (HEV). Moreover, five indicators were selected to evaluate the correlation of wood production with environmental indicators for each municipality. These indicators were supposed to be correlated and represent a “dispute” for land against the forest. The five selected environmental indicators were the number of houses with electricity consumption (ELT), total harvested area for agriculture (HAV), cattle (CAT), cumulative deforested area (DEF), and CO2 emissions (CO2). ELT, HAV and CAT were chosen as environmental indicators because land-use change is the main contributor to CO2 emissions in the Amazon basin due to the replacement of forests with housing, plantations, and pastures.
4. Analysis of the Indicators
Principal component analysis (PCA) has been used as a tool to investigate how indicators are grouped as a consequence of a dimensionality reduction. PCA is an adequate tool for evaluating multiple factor aggregation, such as sustainability indicators, because those indicators are grouped into social, economic, and environmental dimensions. Recent works, such as Mamipour et al. (2019) [
25], have analyzed sustainability using PCA. Mamipour et al. combined PCA with vector autoregression (VAR) to evaluate the relationship between indicators of the environment, economy, and society in Iran. Similarly, Doukas et al. (2012) [
26] used PCA to assess the energy sustainability of rural communities in Europe, with eight indicators showing that the methodology is applicable to evaluating a sustainability index. Akande et al. (2019) [
27] ranked smart, sustainable cities in Europe by synthesizing 38 indicators into four components, and PCA was essential for the proposal of a methodology for a European smart sustainable rank. This study applied a methodology similar to Mamipour et al. (2019) [
25] and Doukas et al. (2012) [
26], using PCA on the compiled indicators and normalizing them to a number between 0 and 1.
In the first step, PCA was applied to the absolute values of the variables presented in
Table 2 to obtain the component loadings for each year of the historical series. A second step normalized all the indicators to a number between 0 and 1 according to Equation (1). The program JASP (2020) was used for the PCA.
where
i refers to each of the 144 municipalities,
xi,norm is the normalized value of the indicator,
xi,max is the maximum value of the indicator, and
xi,min is the minimum value of the indicator.
In Equation (1), the variable
xi encompasses 10 indicators, namely POP, GDP, VAT, WLG, LGV, JOB, SAL, DOC, and HEV. It is important to note that for the socioeconomic indicators, a value of 0 denotes the lowest value (which is not good), whereas a value of 1 represents the highest value (which is good). For instance, higher values of GDP, JOB, or SAL are benefits. However, the environment-related indicators operate inversely to the other indicators, implying that higher values of ELT, HAV, CAT, and CO
2 are considered disadvantages. As a result, Equation (2) was applied to these four indicators to align the scale with the other indicators, where 0 is the lowest value (not good) and 1 is the highest value (good).
The results of the PCA revealed the group of indicators for each component and the respective component loadings. The number of components was first tested with eigenvalues above 1 but resulted in five components separating socioeconomic indicators and making no sense. Subsequently, the number of components was fixed at 3, and component loadings above 0.4 were considered [
28]. The three principal components represented the socioeconomic, environmental, and wood production dimensions, hereafter named SOC, ENV, and WPI. Therefore, for each year, the indicator
xi was associated with the component loadings of the dimensions SOC, ENV, and WPI, as shown in
Table 3, taking 2008 as an example.
In a final step, for each year, the normalized indicator
xi was multiplied by the component loadings and summed according to Equation (3) to result in the dimensions SOC
i, ENV
i and WPI
i for each municipality
i.
where
i refers to the 144 municipalities,
j refers to the 14 indicators (POP, GDP, VAT, WLG, LGV, JOB, SAL, DOC, HEV, ELT, HAV, CAT, DEF, and CO
2),
xi,j,norm is the normalized value of the indicators for each municipality
i, and
xi,j,PCA loadings are the component loadings of the dimensions SOC, ENV and WPI for each municipality
i and indicator
j.
5. Results
With the number of components fixed at three, PCA was applied to the absolute values of the 14 indicators (POP, GDP, VAT, WLG, LGV, JOB, SAL, DOC, HEV, ELT, HAV, CAT, DEF, CO
2), obtaining the component loadings for each year that were assigned to the dimensions SOC, ENV and WPI (
Table 3).
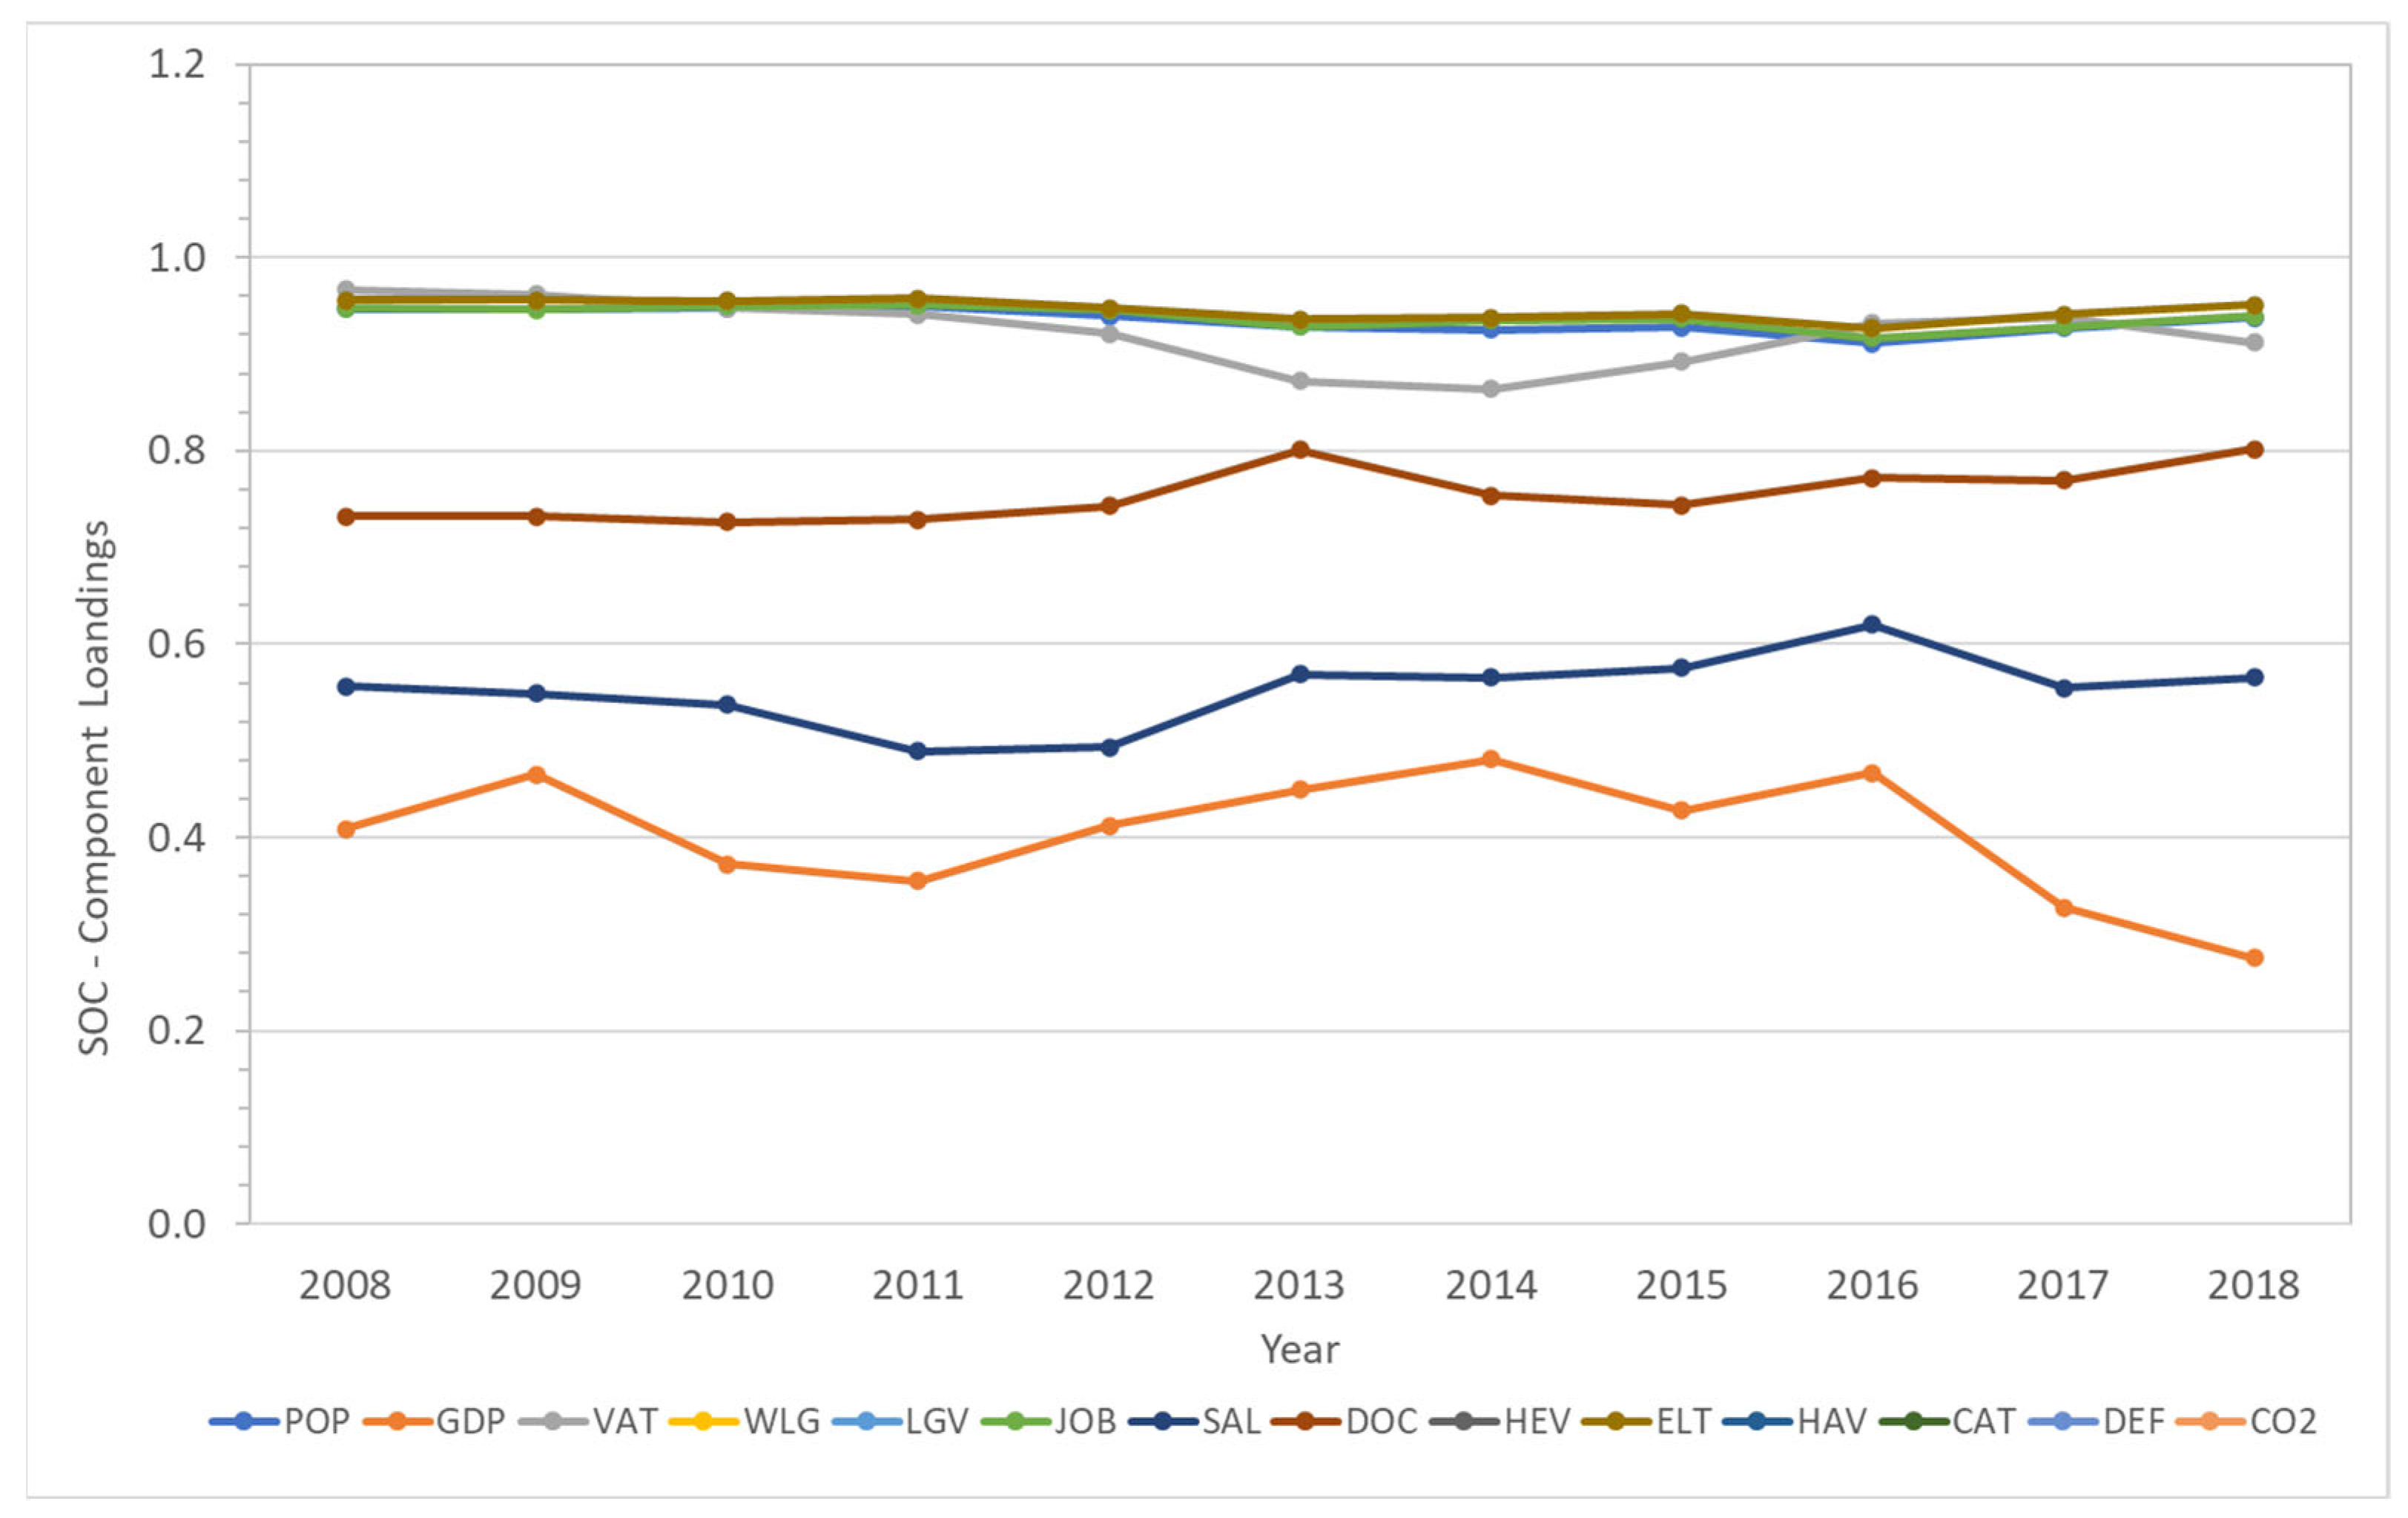
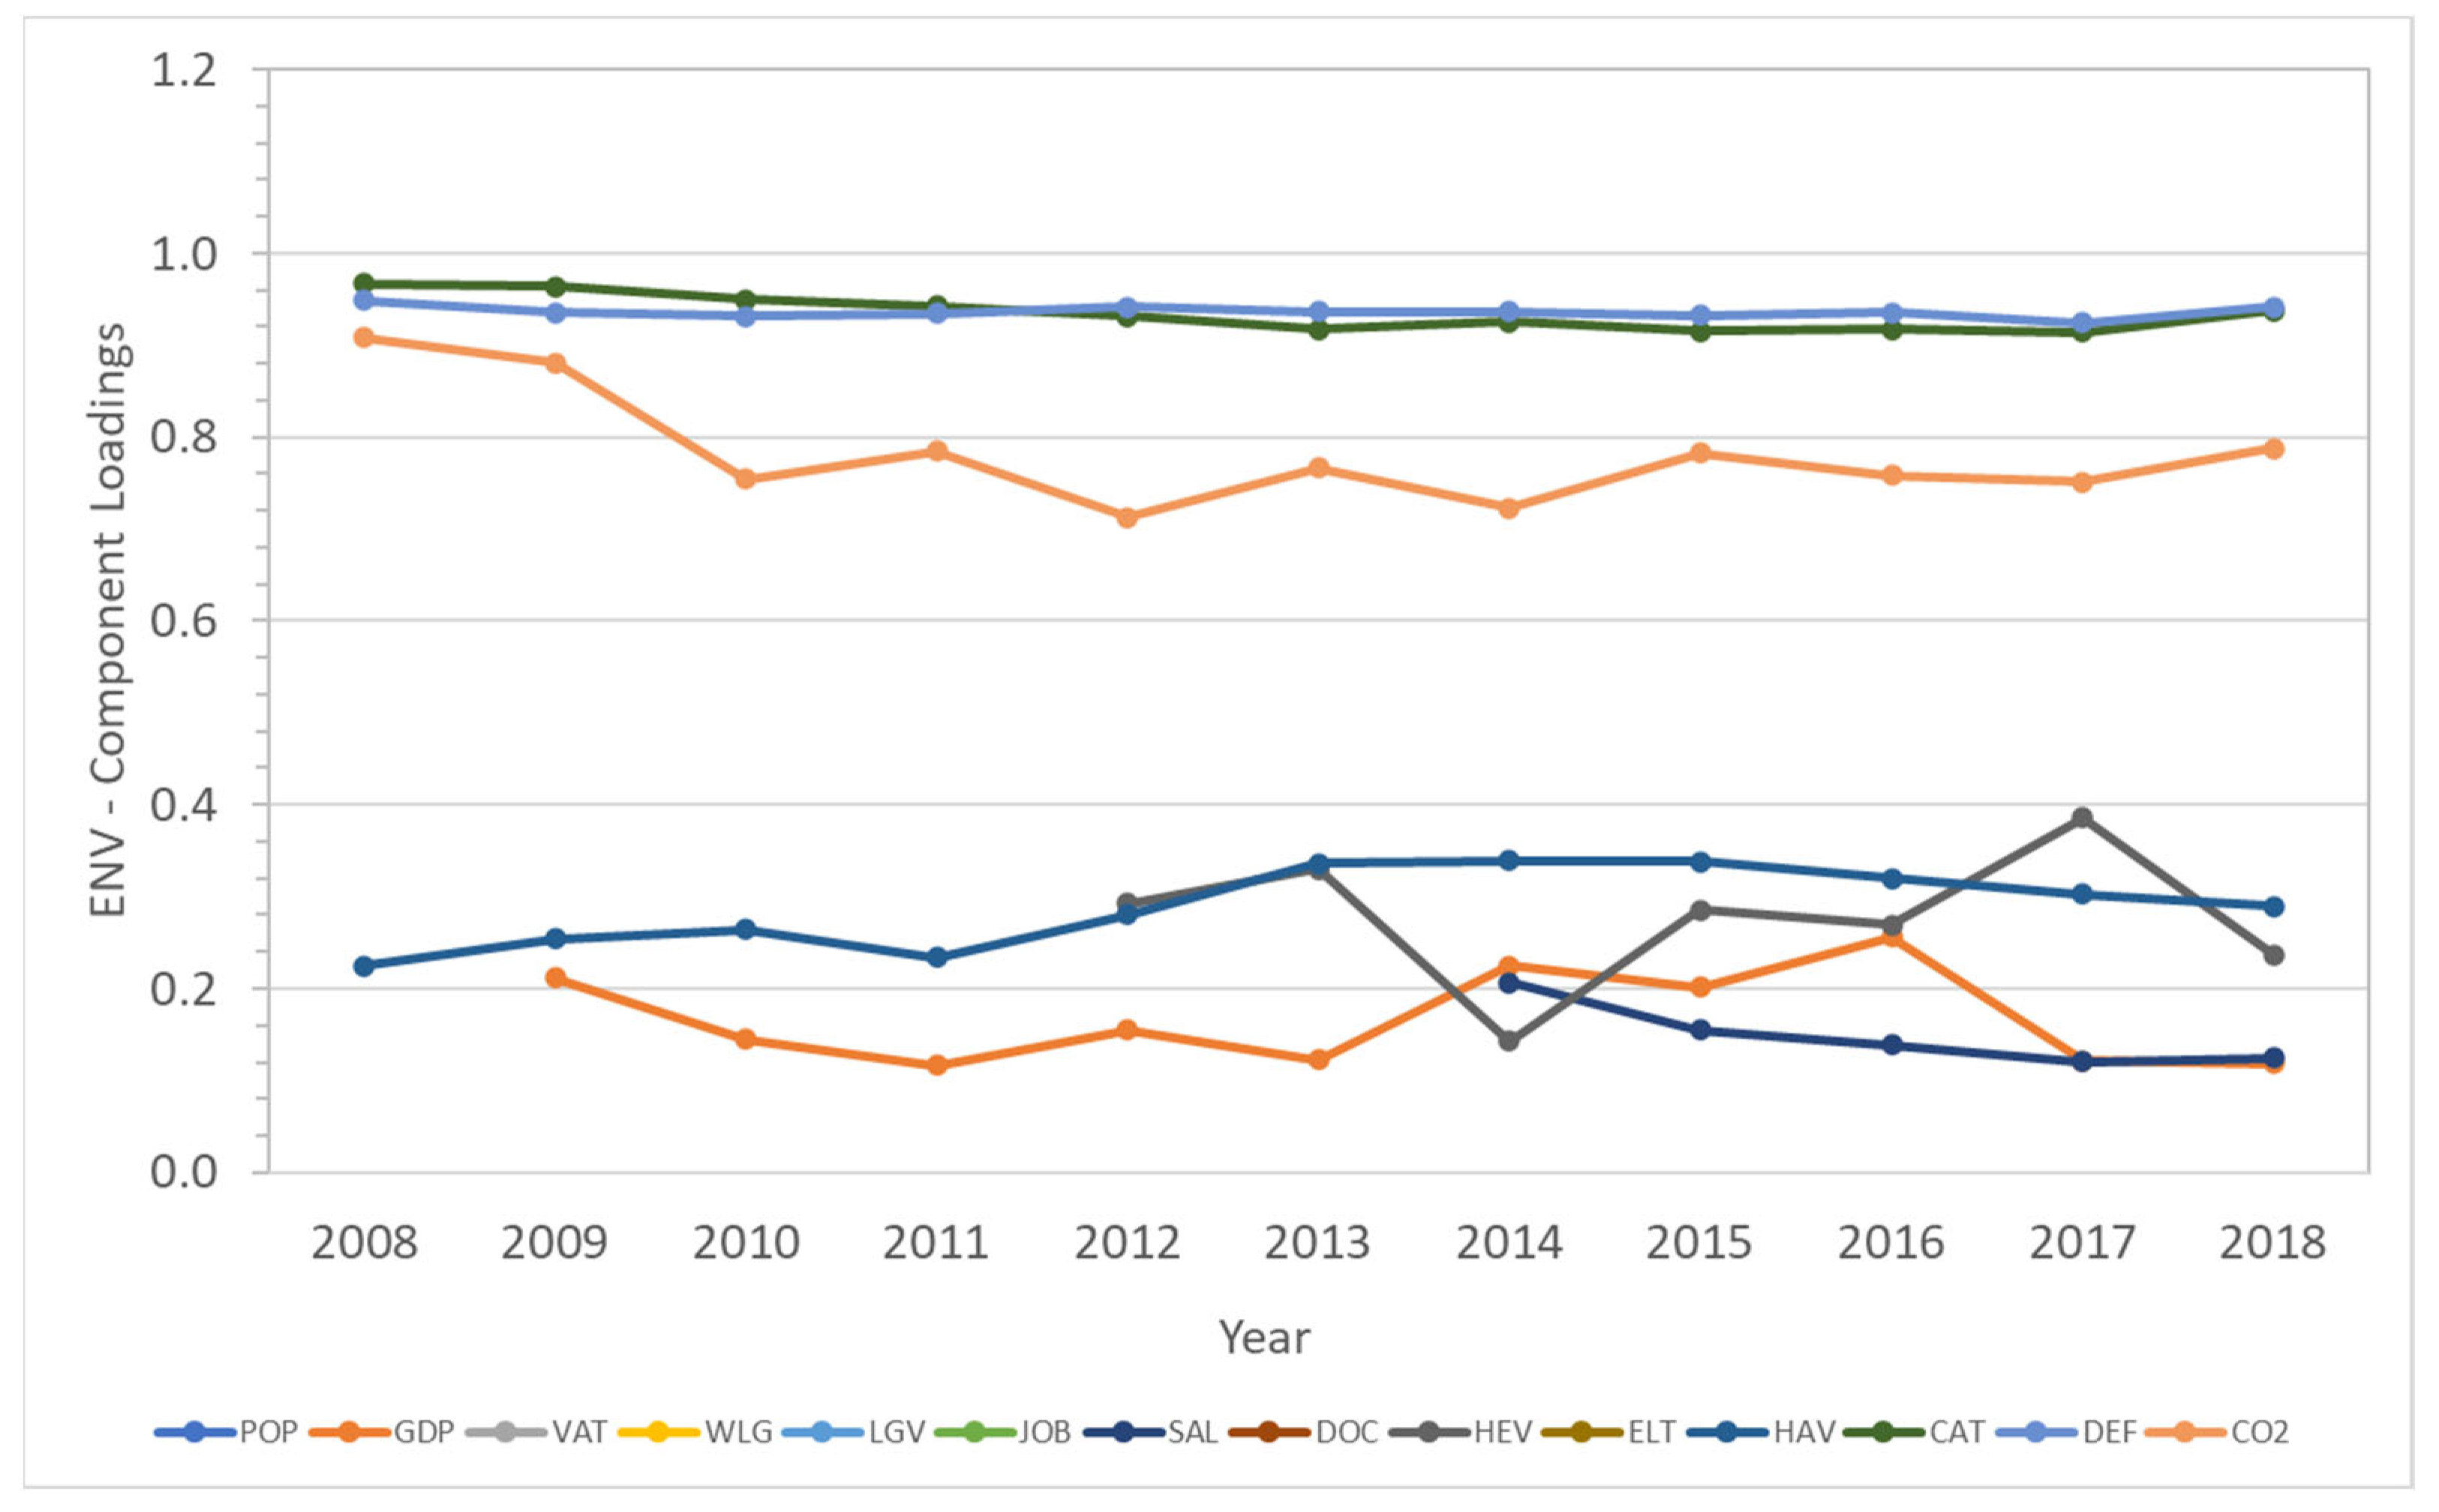
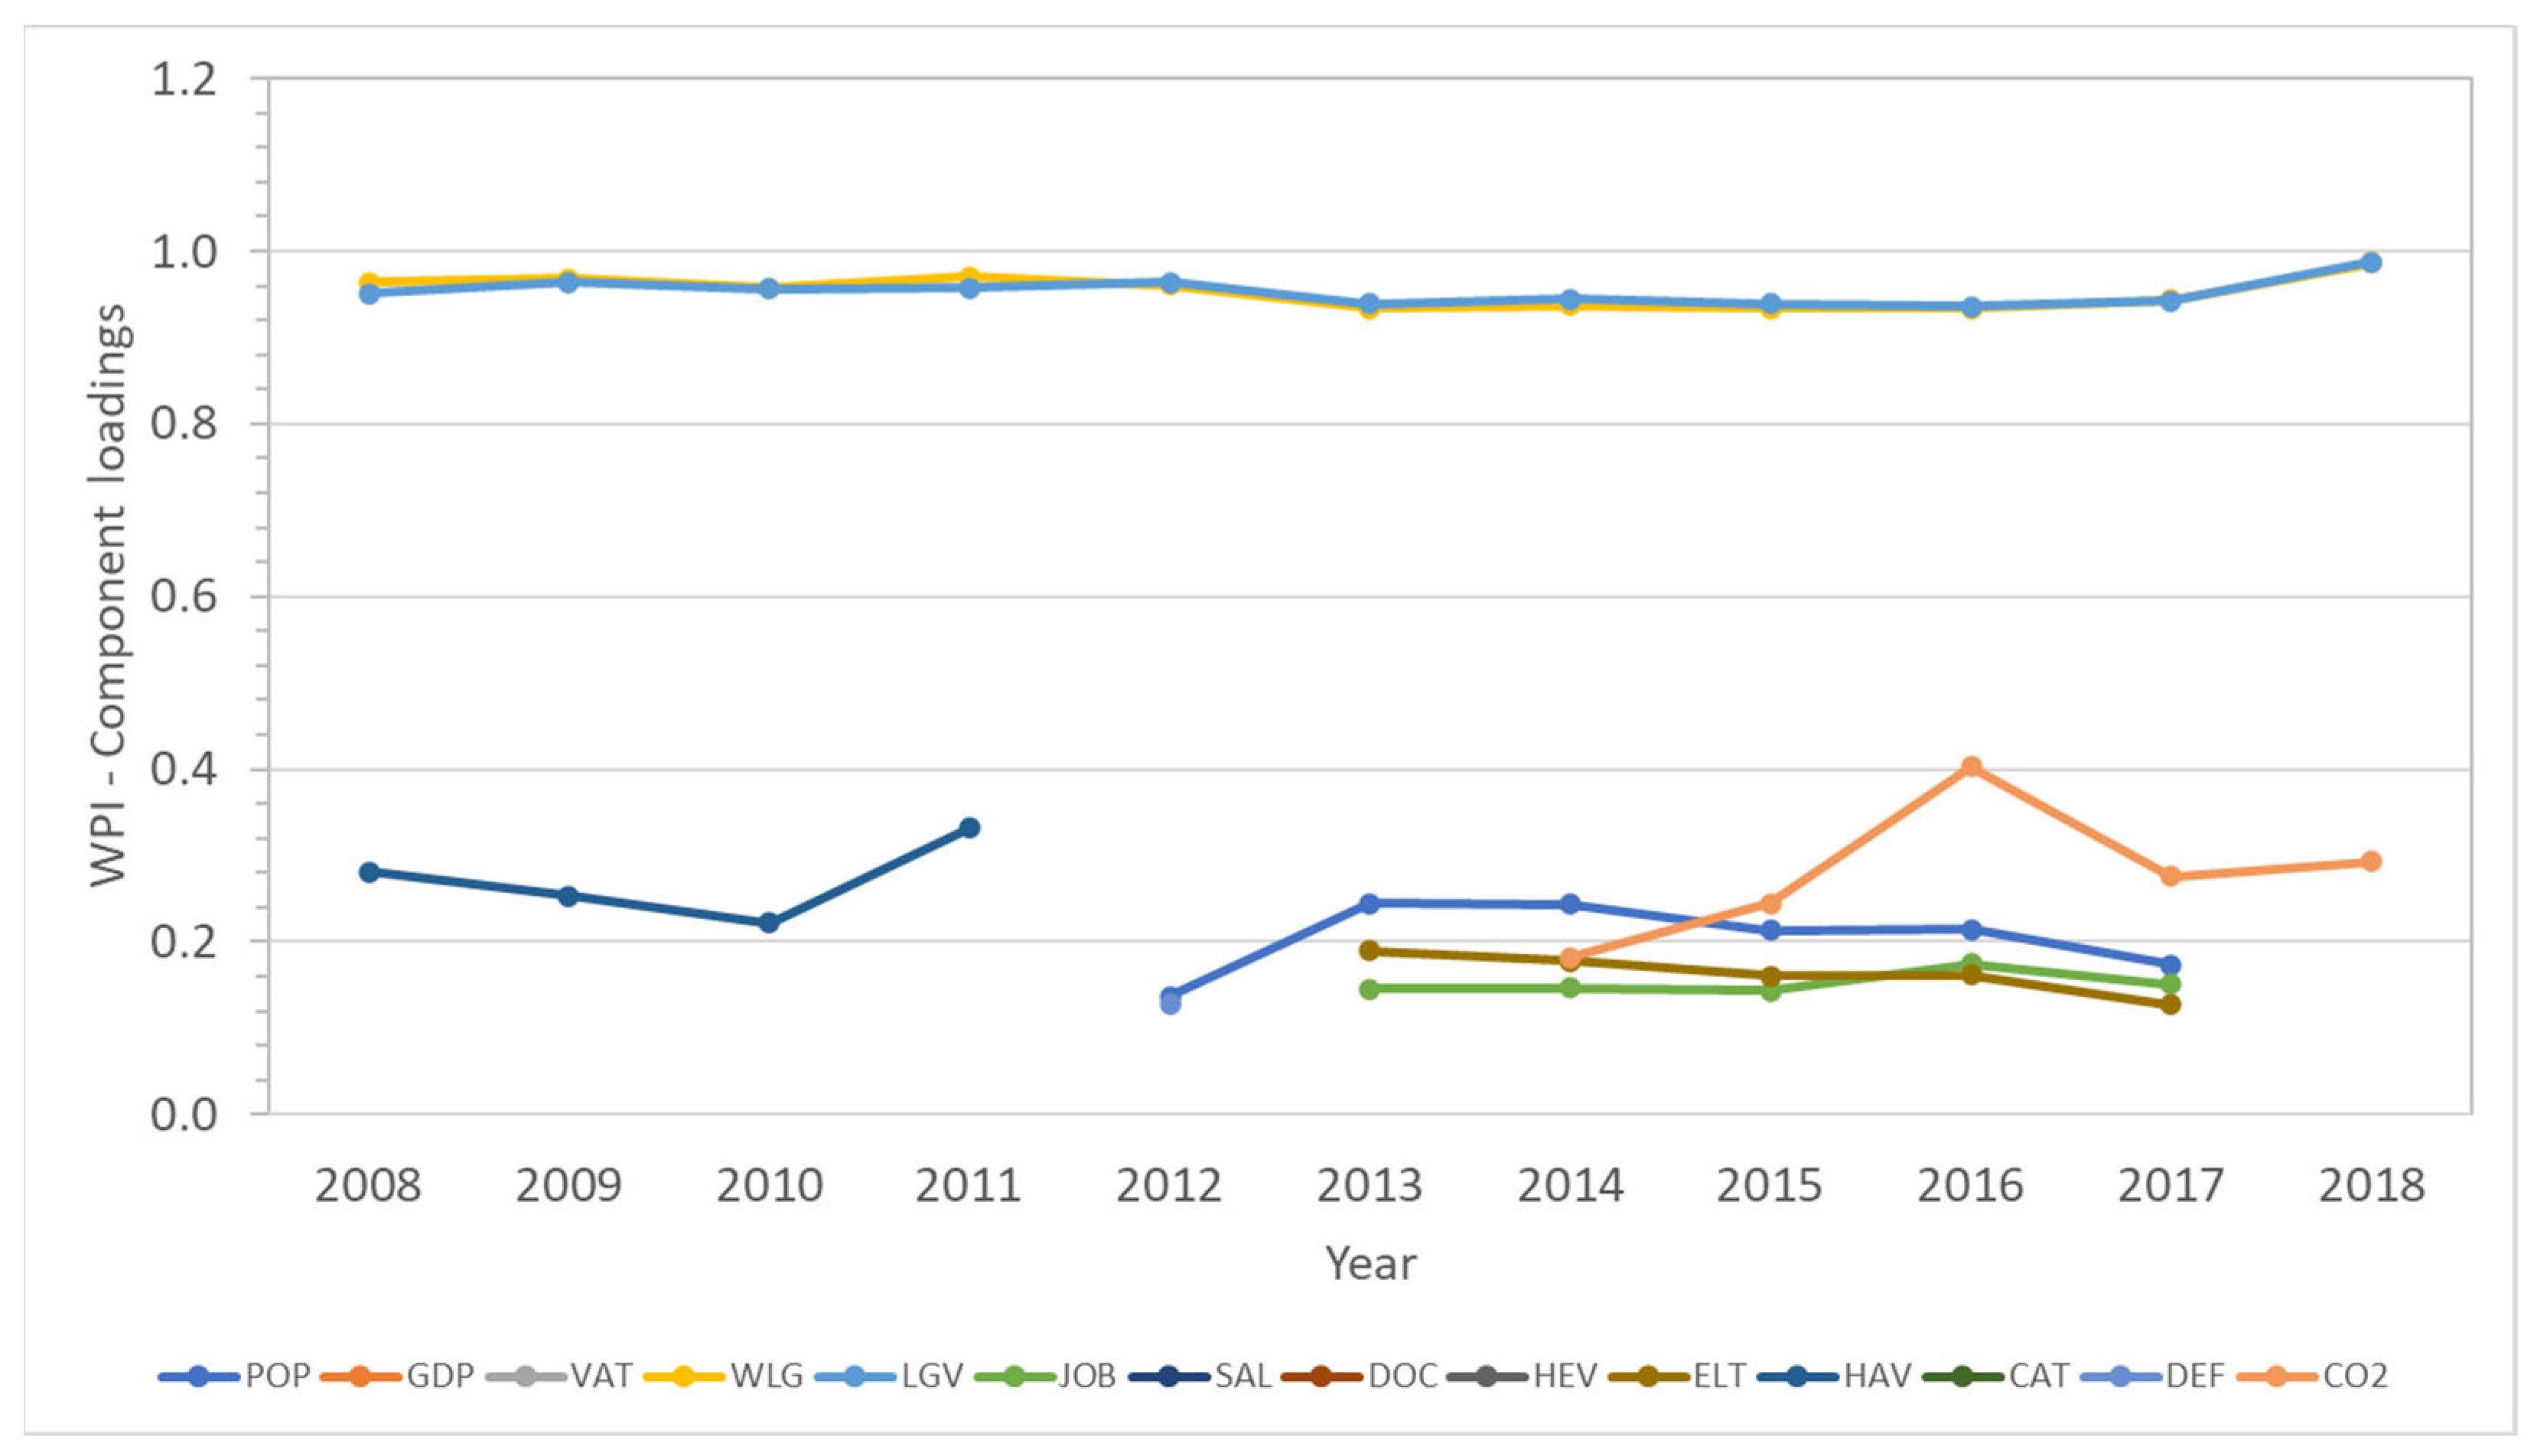
Figure 3,
Figure 4 and
Figure 5 depict the component loadings assigned to the respective dimensions, but it is important to emphasize that only component loadings above 0.4 were considered [
28].
According to the figure, it can be observed that the variations in salary and CO2 emissions closely track each other, indicating a strong correlation with per capita GDP.
In
Figure 3, the indicators assigned to the SOC component are, in descending order of component loadings, POP, VAT, ELT, DOC, SAL, and GDP. Higher loadings of POP, VAT, and ELT, ranging from 0.86 to 0.96, indicate that the socioeconomic dimension is strongly influenced by the population (POP), value-added tax (VAT), and the number of houses with electric consumption (ELT) in the municipalities. The number of medical doctors per 1000 people (DOC) also shows a significant connection to the socioeconomic dimension with component loadings between 0.72 and 0.80, followed by average salaries (SAL) with component loadings between 0.49 and 0.62. However, GDP was not considered for the years 2010, 2011, 2017, and 2018 due to loadings below 0.4. GDP (per capita), displaying weak but consistent loadings, and from 2016 to 2018, which represented a period of economic recession with a decrease in GDP per capita in Brazil. According to
Figure 3, it is also observable that salary variations and CO
2 emissions track each other, indicating a very strong correlation with per capita GDP.
In
Figure 4, the indicators CAT, DEF, and CO
2 assigned to ENV were well-defined, with component loadings above 0.7. These indicators decreased from 2008 to 2017 and likely increased from 2017 to the present. Moreover, it is interesting to note that the indicator HAV was not considered because of loadings below 0.4, but had a consistent increase in importance from 2008 to 2018. The aforementioned indicators certainly illustrate the factors associated with environmental problems in the Amazon: cattle, deforestation, harvested area for agriculture, and consequent CO
2 emissions. In fact, deforestation and CO
2 emissions are the consequences of agriculture and animal husbandry, especially cattle. The indicator GDP was also not considered because of the loadings between 0.12 and 0.26; however, the GDP loadings were weak but consistent, indicating that the economy of the municipalities can play a role in influencing the environmental dimension in the Amazon. Due to the subject of the present work, another important factor that is worth highlighting in
Figure 4 is that the indicators WLG and LGV had no correlation with the dimension ENV from 2008 to 2018, with no component loadings. This could lead to the conclusion that there is no measurable link between wood production activity in the State of Pará and the environmental dimension, but the subsequent analysis of
Figure 5 may provide insights into this connection.
In
Figure 5, the indicators WLG and LGV are assigned to the dimension WPI. These indicators represent the wood production activity in the State of Pará. The component loadings of these indicators between 0.94 and 0.99 exhibited a small decrease from 2008 to 2017 and a probable increase from 2017 to the present. As mentioned before, the component loadings of HAV from 0.22 to 0.33 appeared weak but perceptible from 2008 to 2011, and CO
2 increased consistently from 0.18 to 0.29 from 2014 with a maximum loading of 0.4 in 2006. Even with loadings below 0.4, those indicators can suggest how wood production activity in the Amazon is correlated with impacts in socioeconomic and environmental dimensions. A probable explanation of the indicator HAV is that until 2011, the degraded areas resulting from wood exploitation were used as areas for agriculture. The increase in the loadings of the indicator CO
2 suggests that wood production activity has been linked to CO
2 emissions since 2014 and therefore connected to land-use change. Furthermore, the loadings between 0.13 and 0.24 of the indicators POP, JOB, and ELT need to be theorized as follows: despite low values of loadings, the indicators POP, ELT, and JOB suggest that wood production is influenced by socioeconomic indicators, meaning that wood production activity is linked to the increase in the population, which in turn is also linked to the demand for housing and jobs.
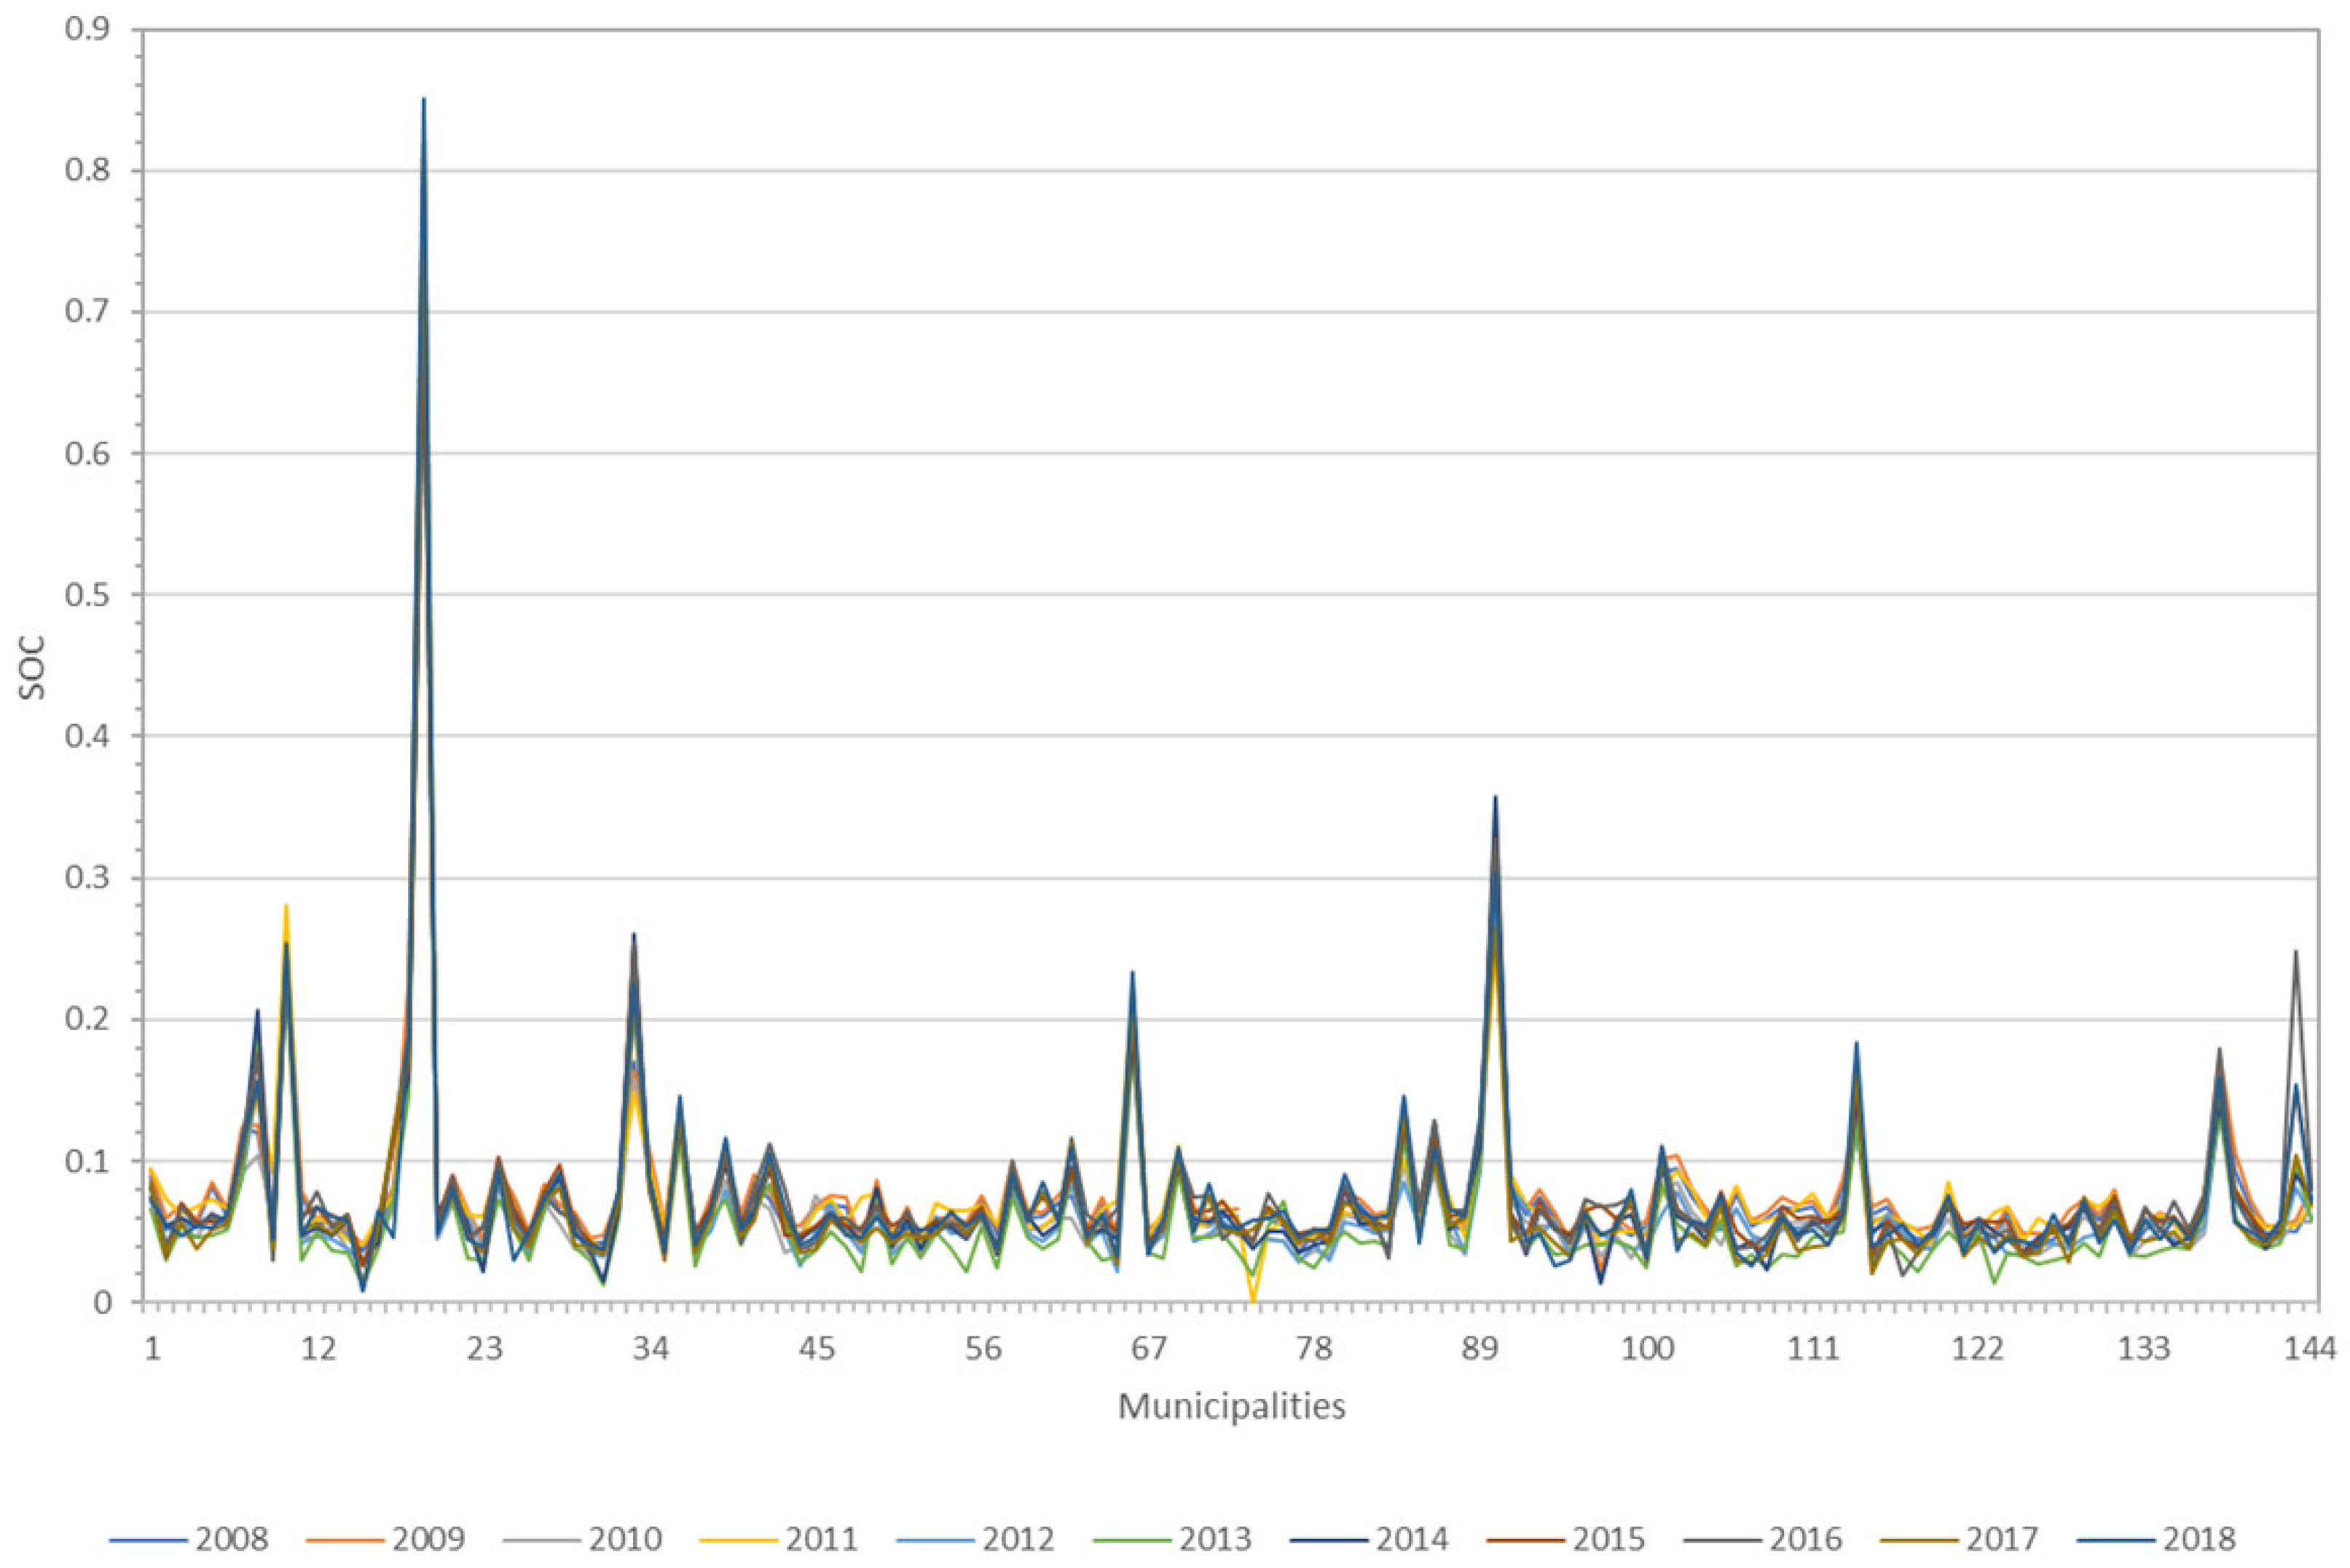
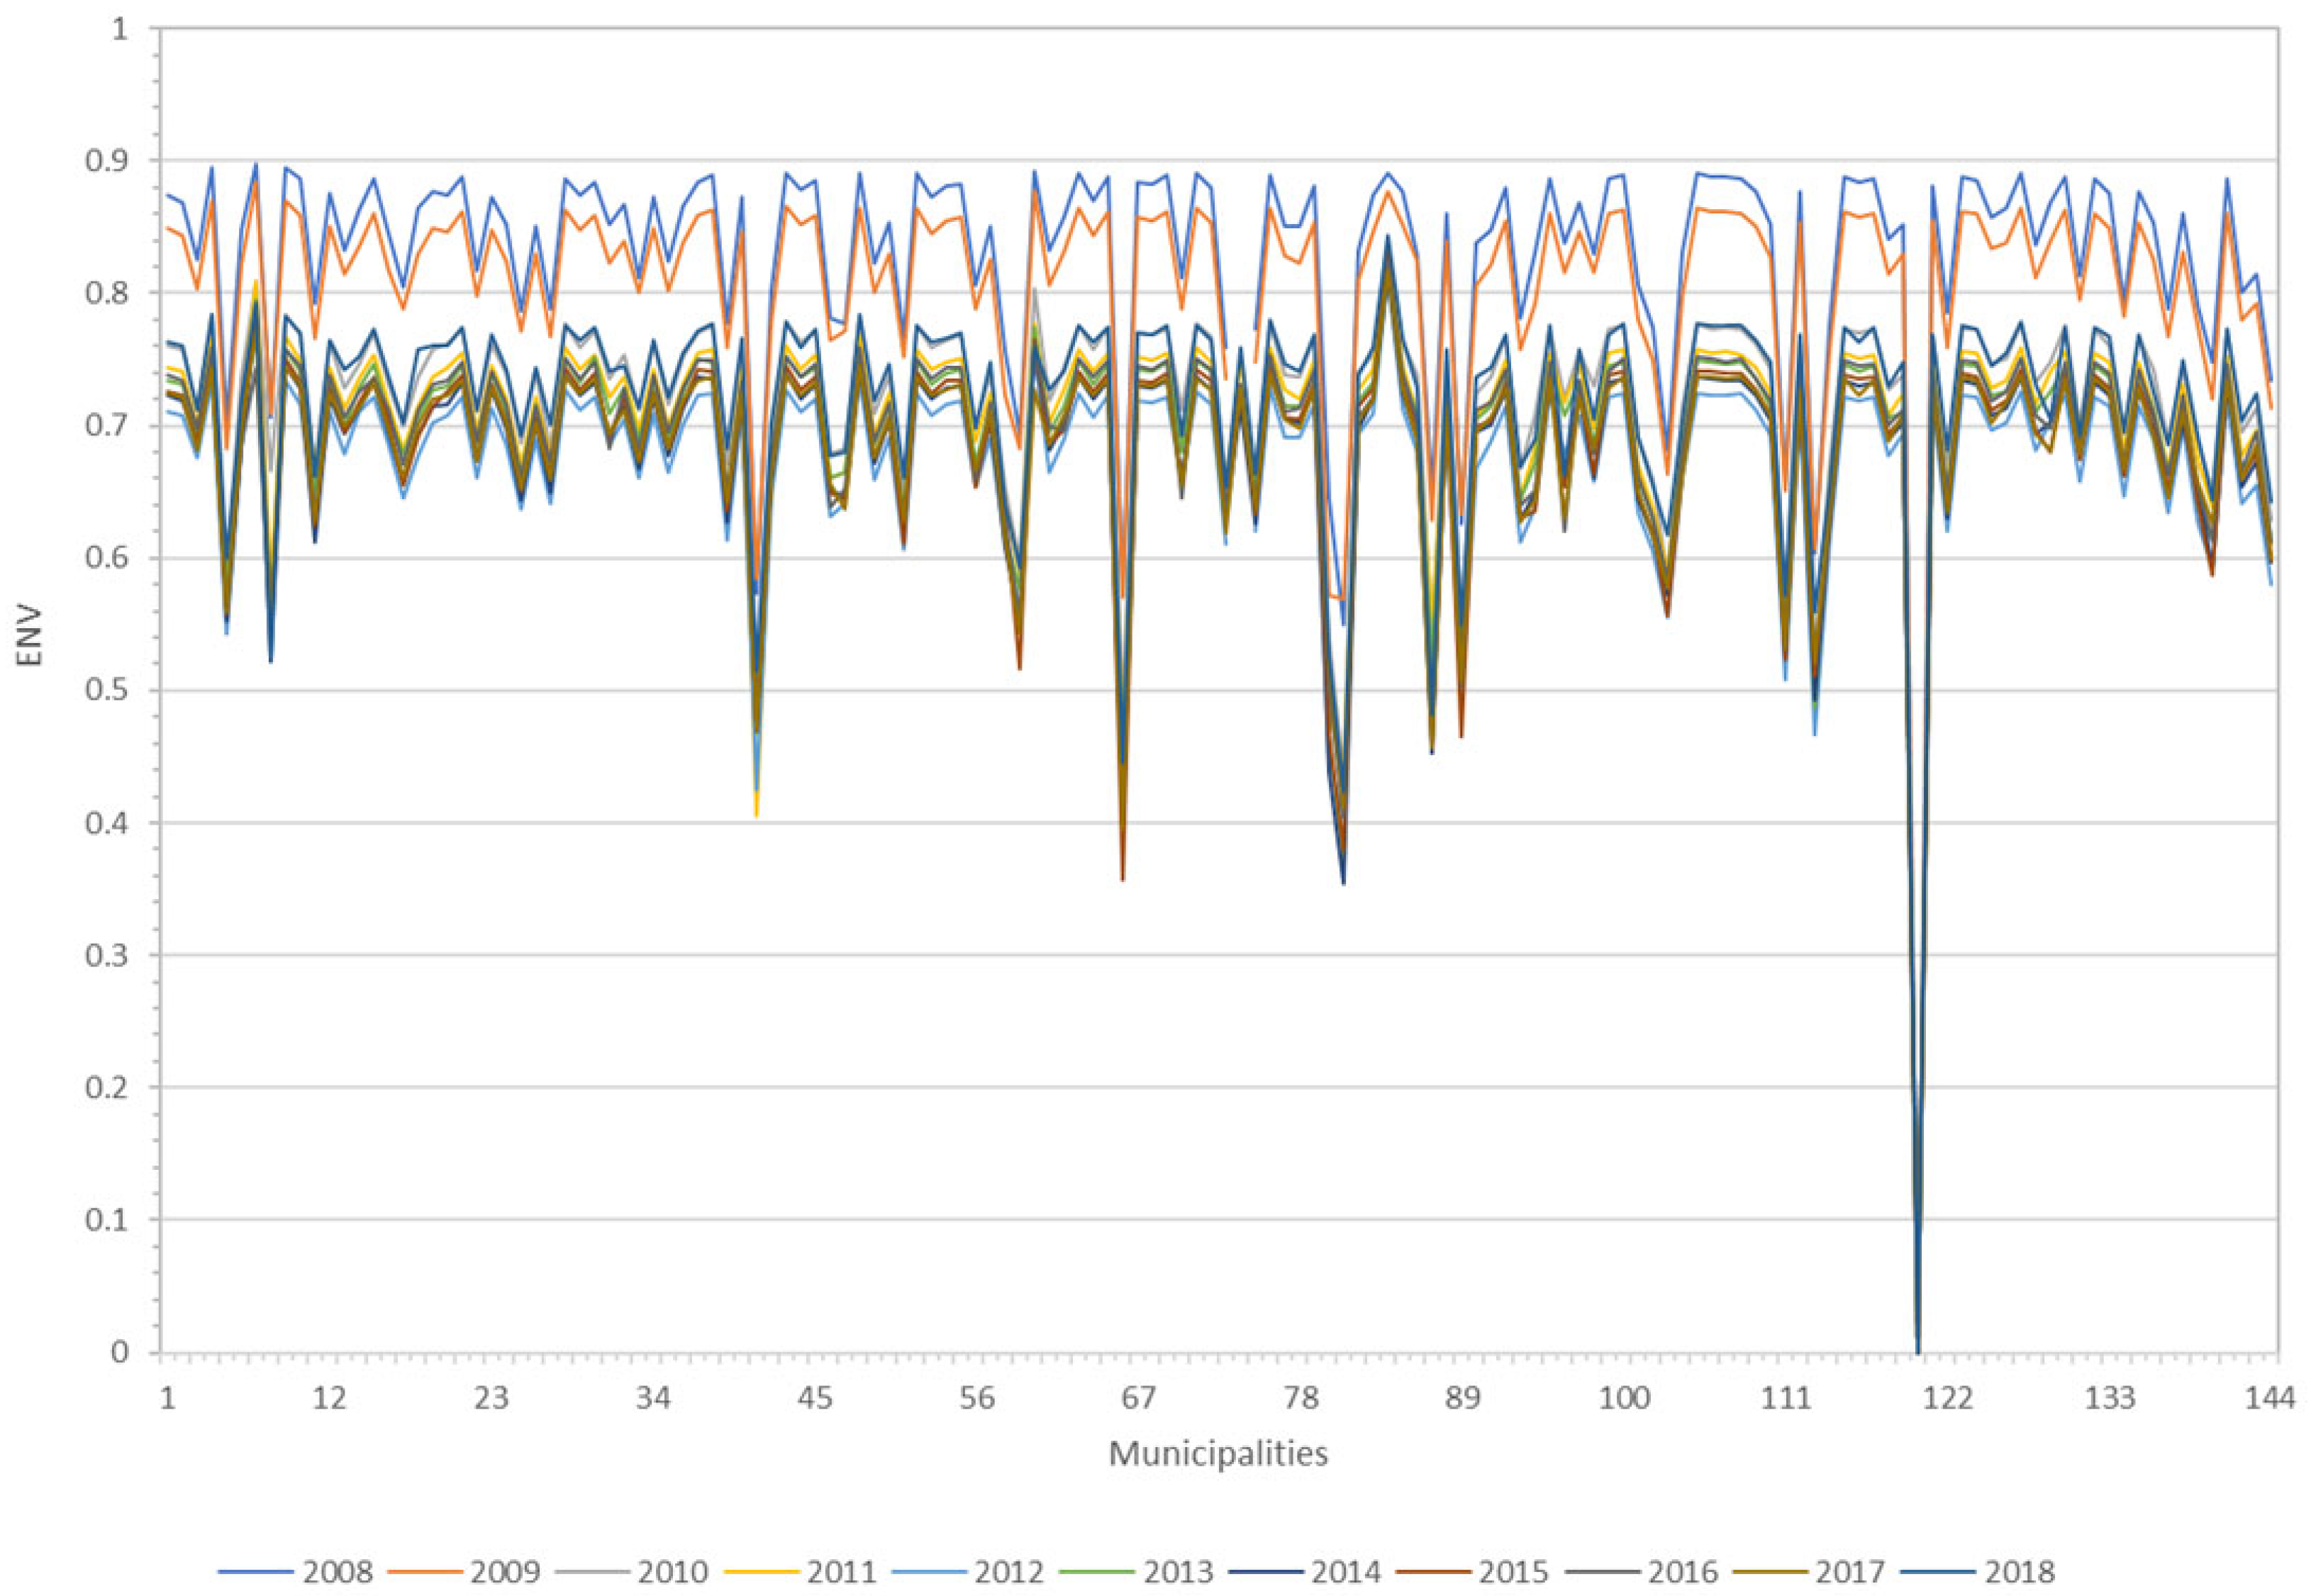
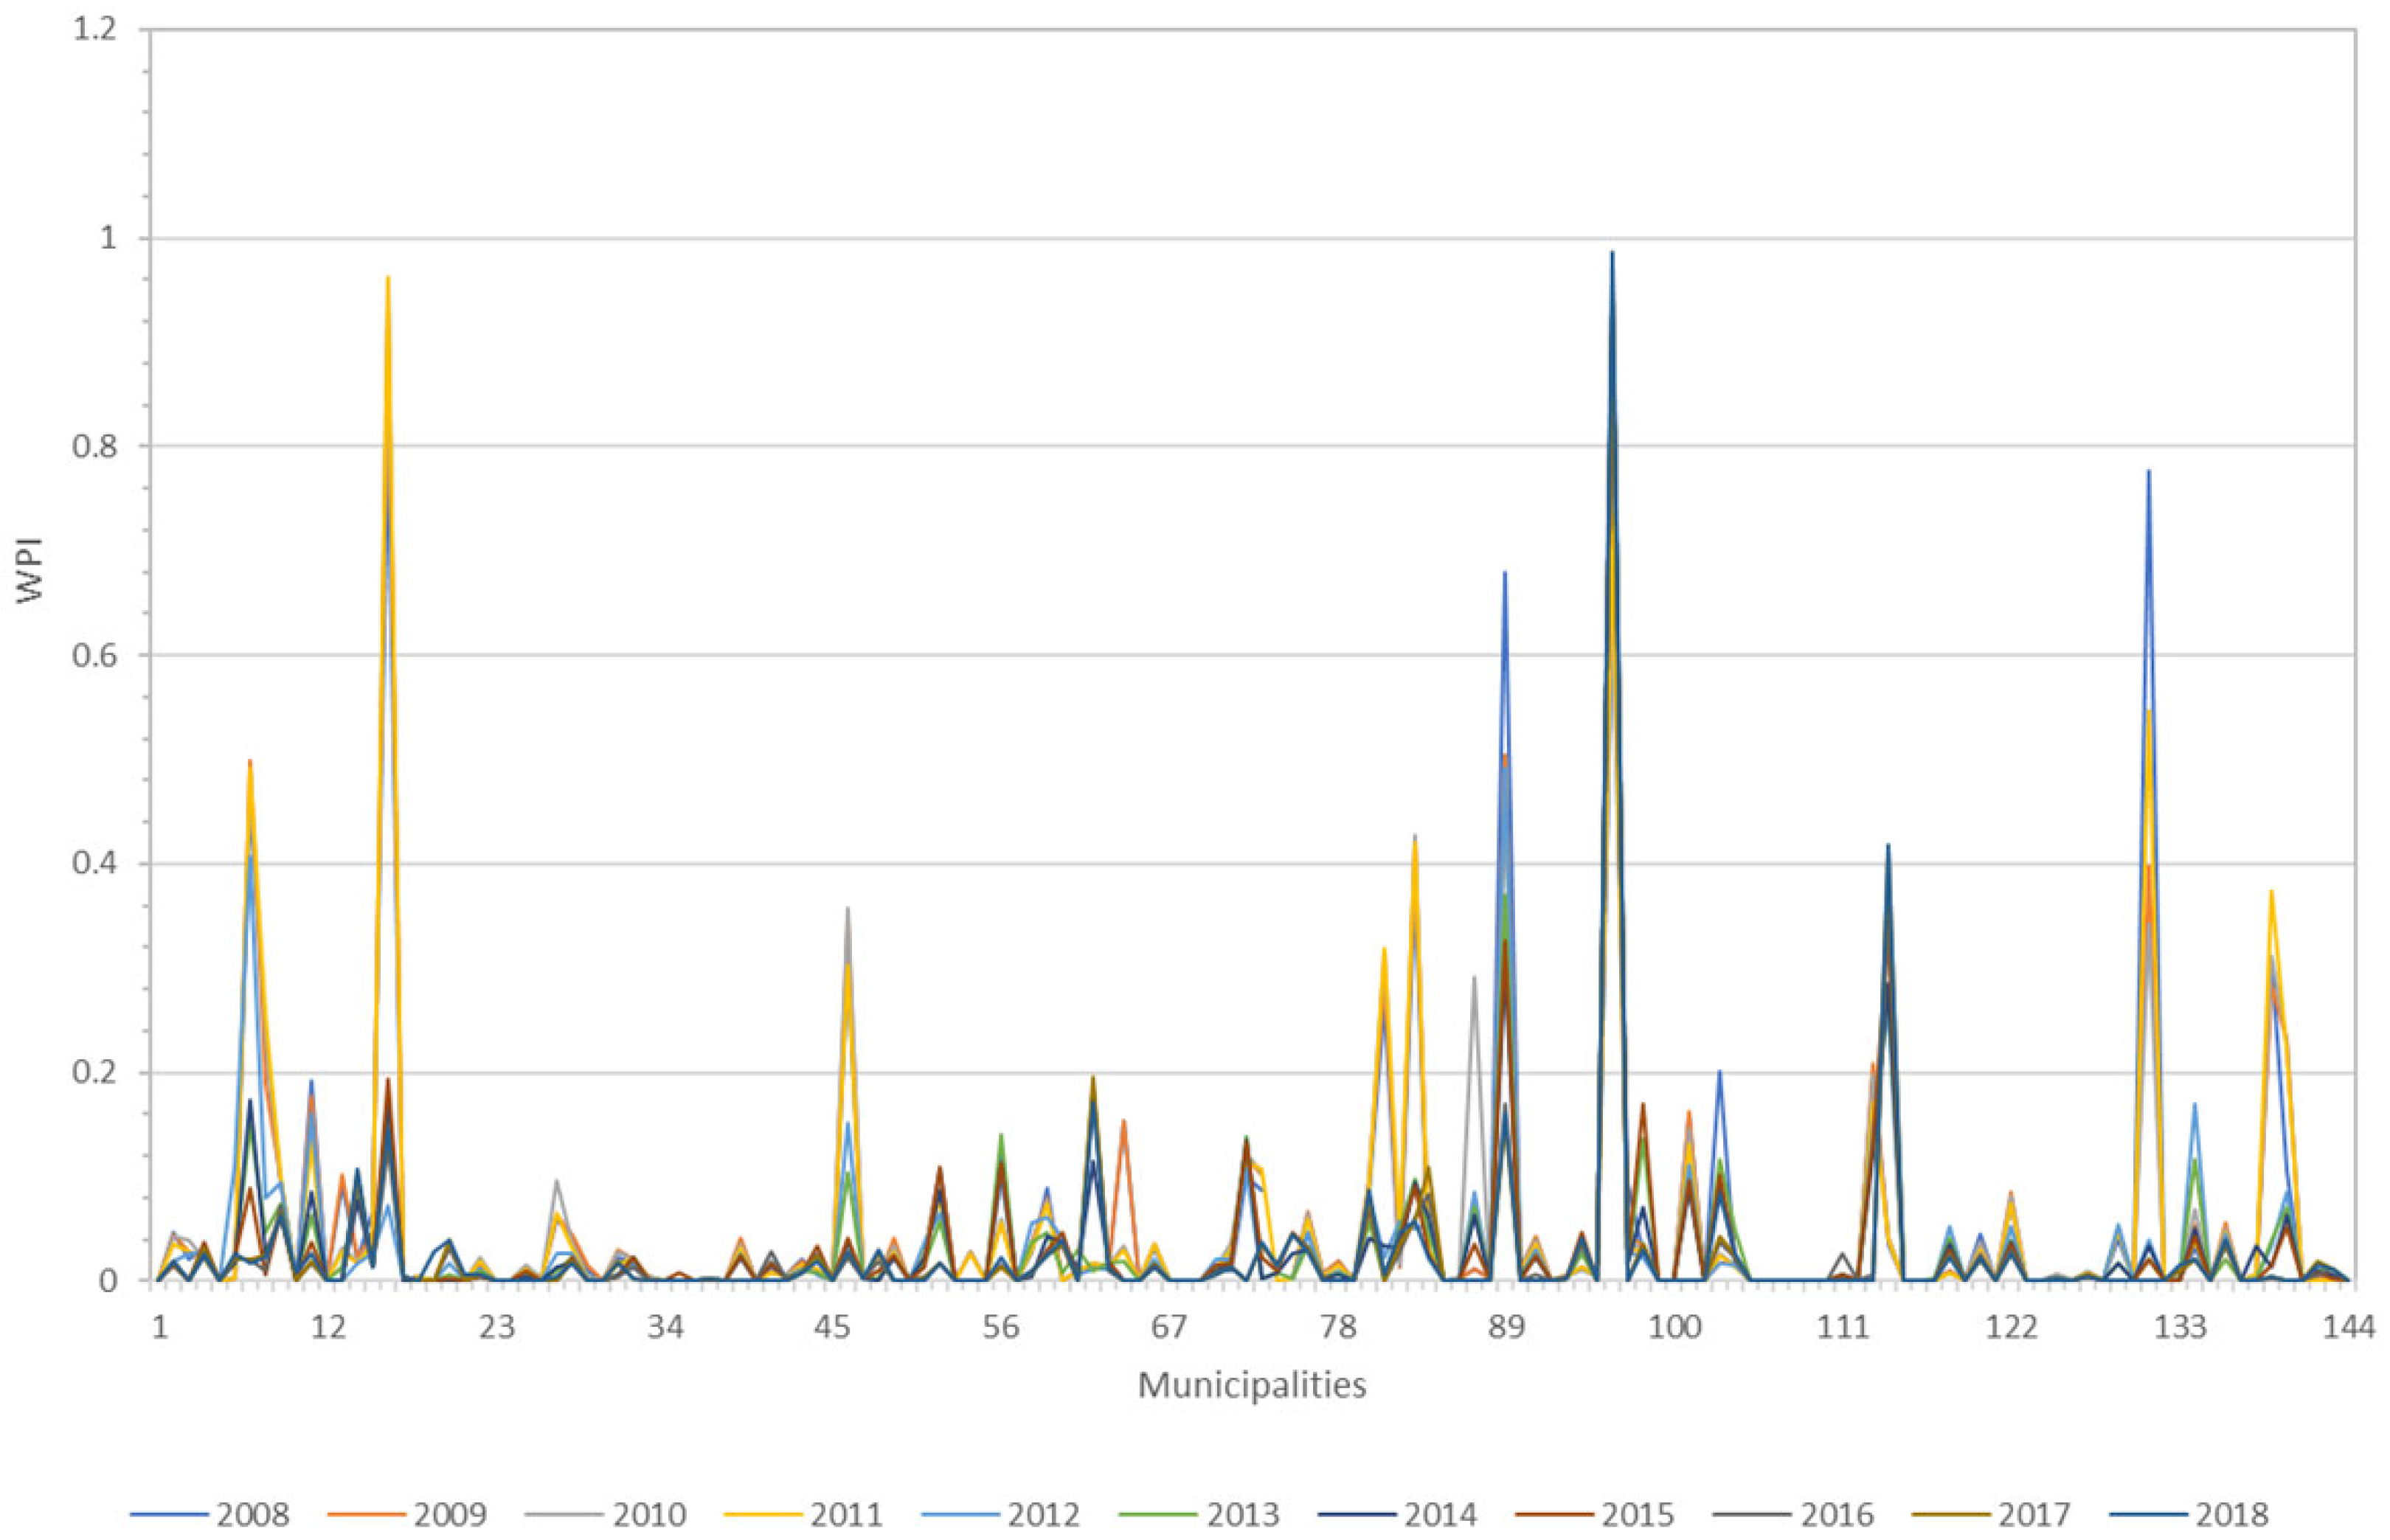
With the PCA component loadings assigned to the dimensions, Equations (2) and (3) were applied for the normalization of the indicators. The following results demonstrate how the calculated dimensions varied over the years for each municipality. In
Figure 6,
Figure 7 and
Figure 8, the values of SOC
i, ENV
i, and WPI
i for the 144 municipalities are plotted as multiple lines, where each line represents one year from 2008 to 2018.
It is noteworthy that, in general, the lines coincide more in
Figure 6 and
Figure 7, indicating that dimension WPI varied more over the years compared with SOC and ENV. Therefore, a deeper analysis of the variation over time was performed. In
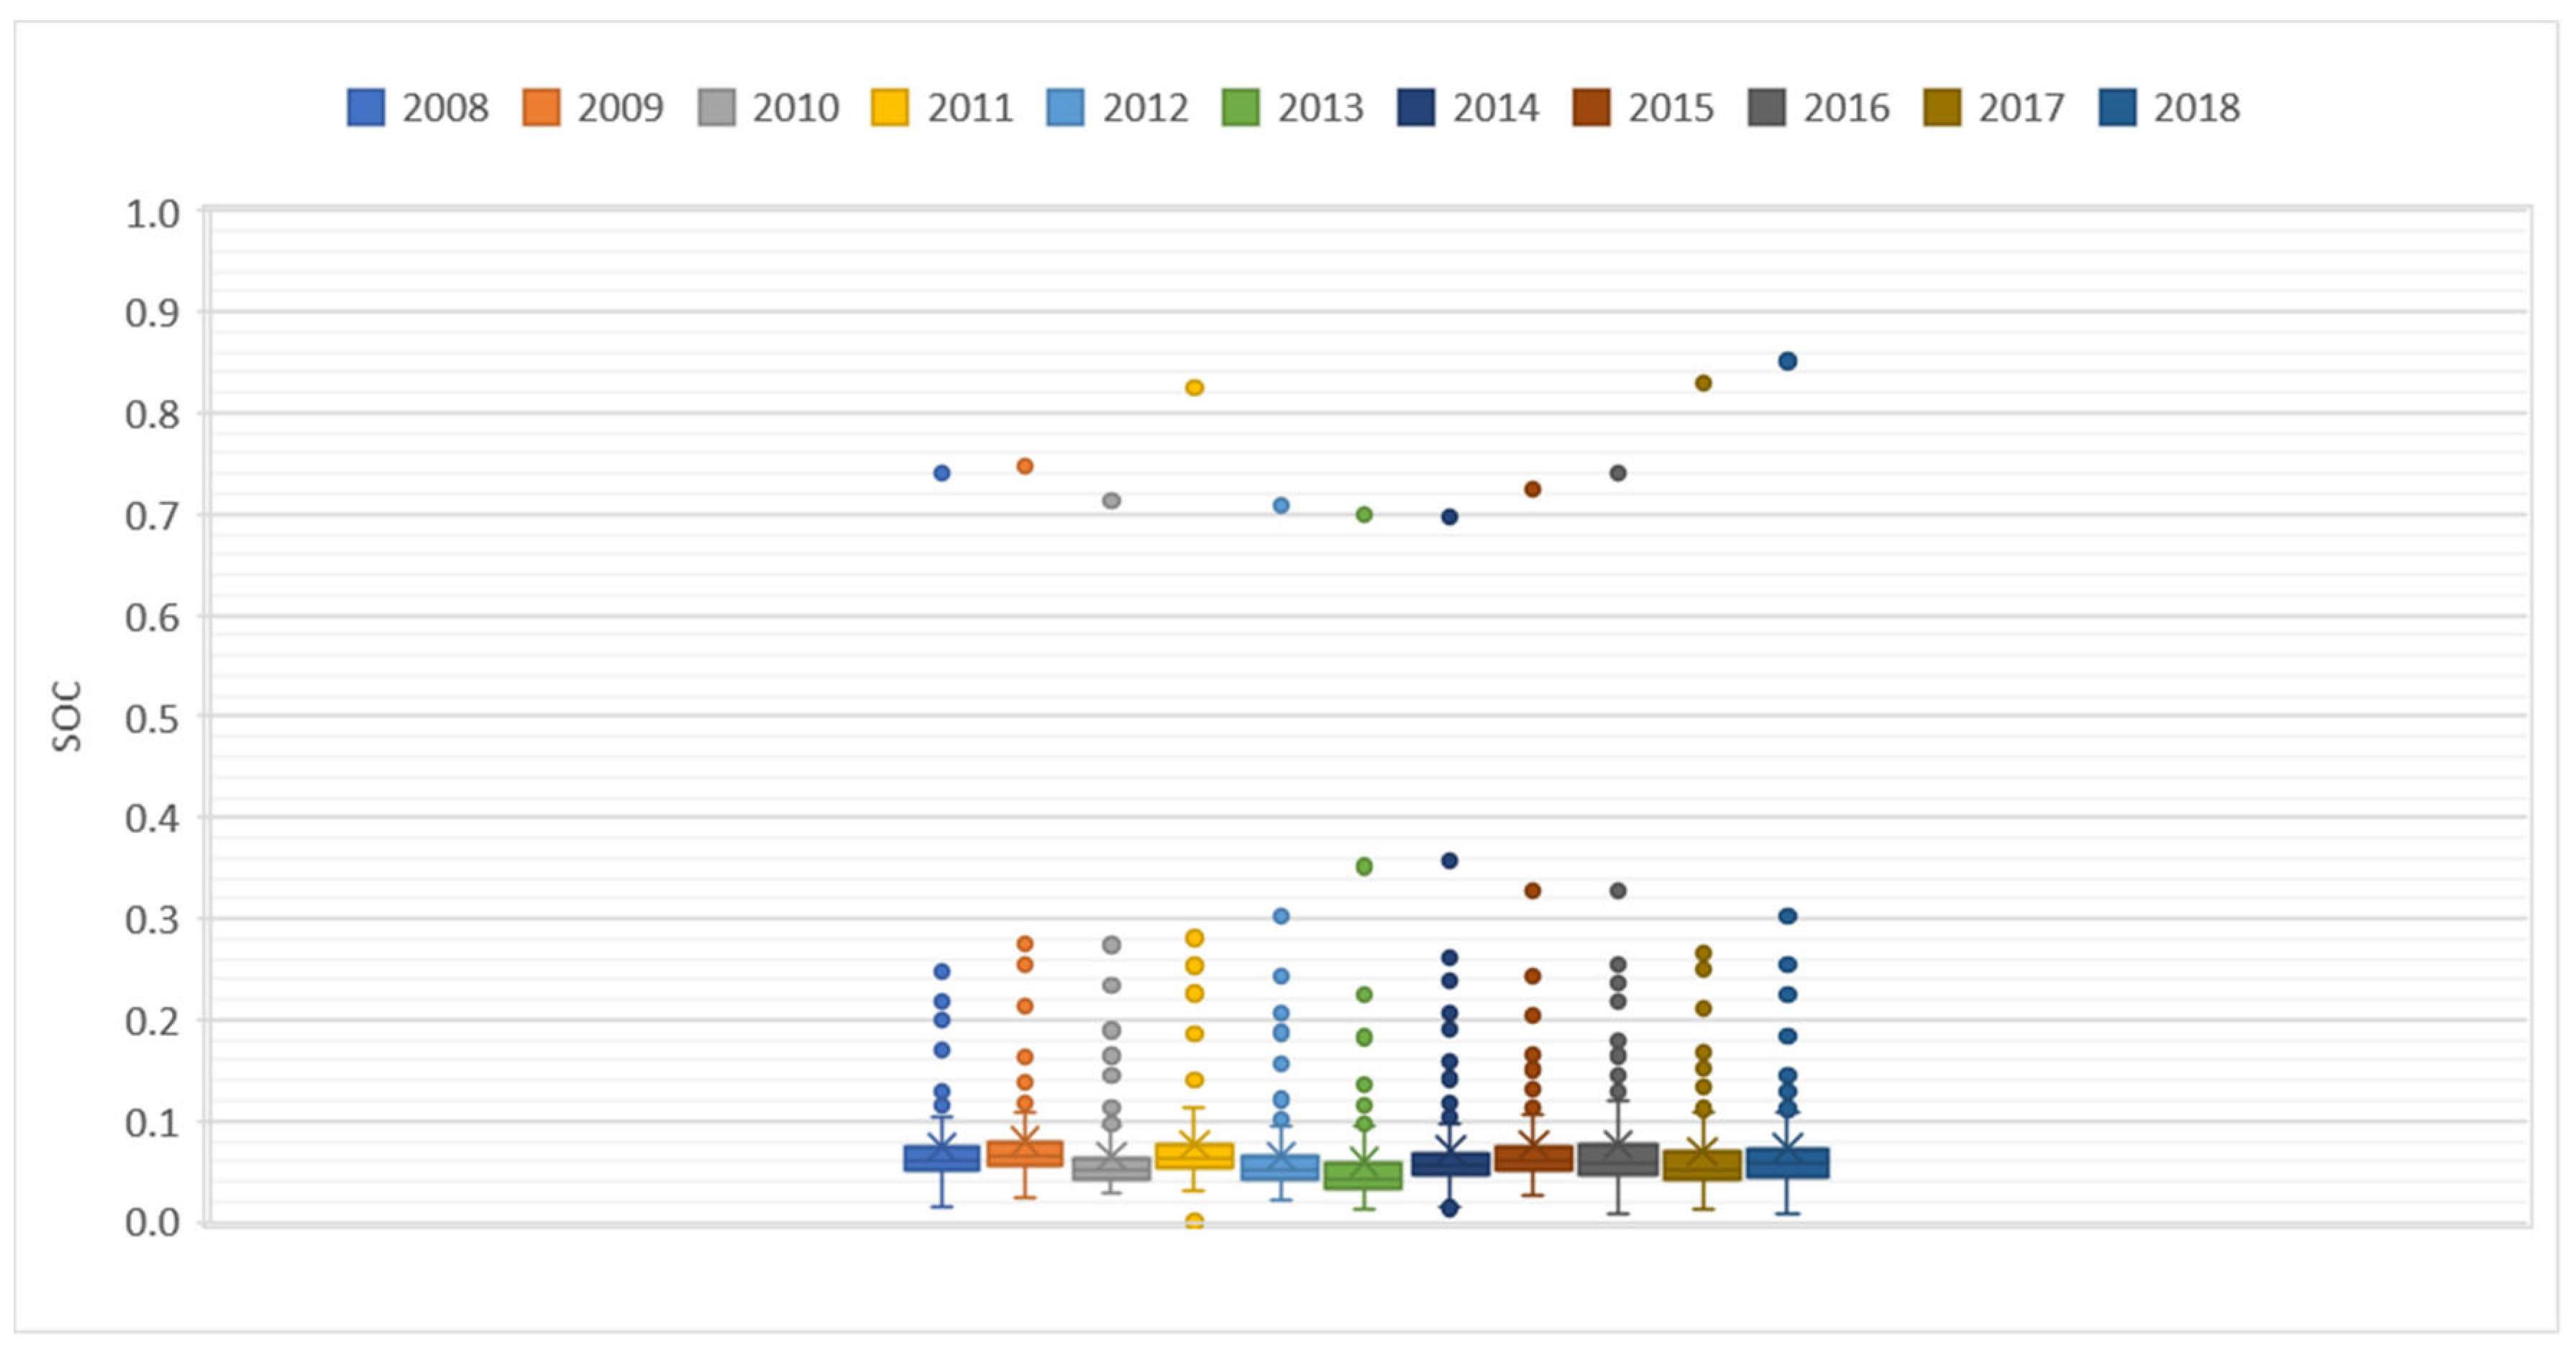
Figure 9,
Figure 10 and
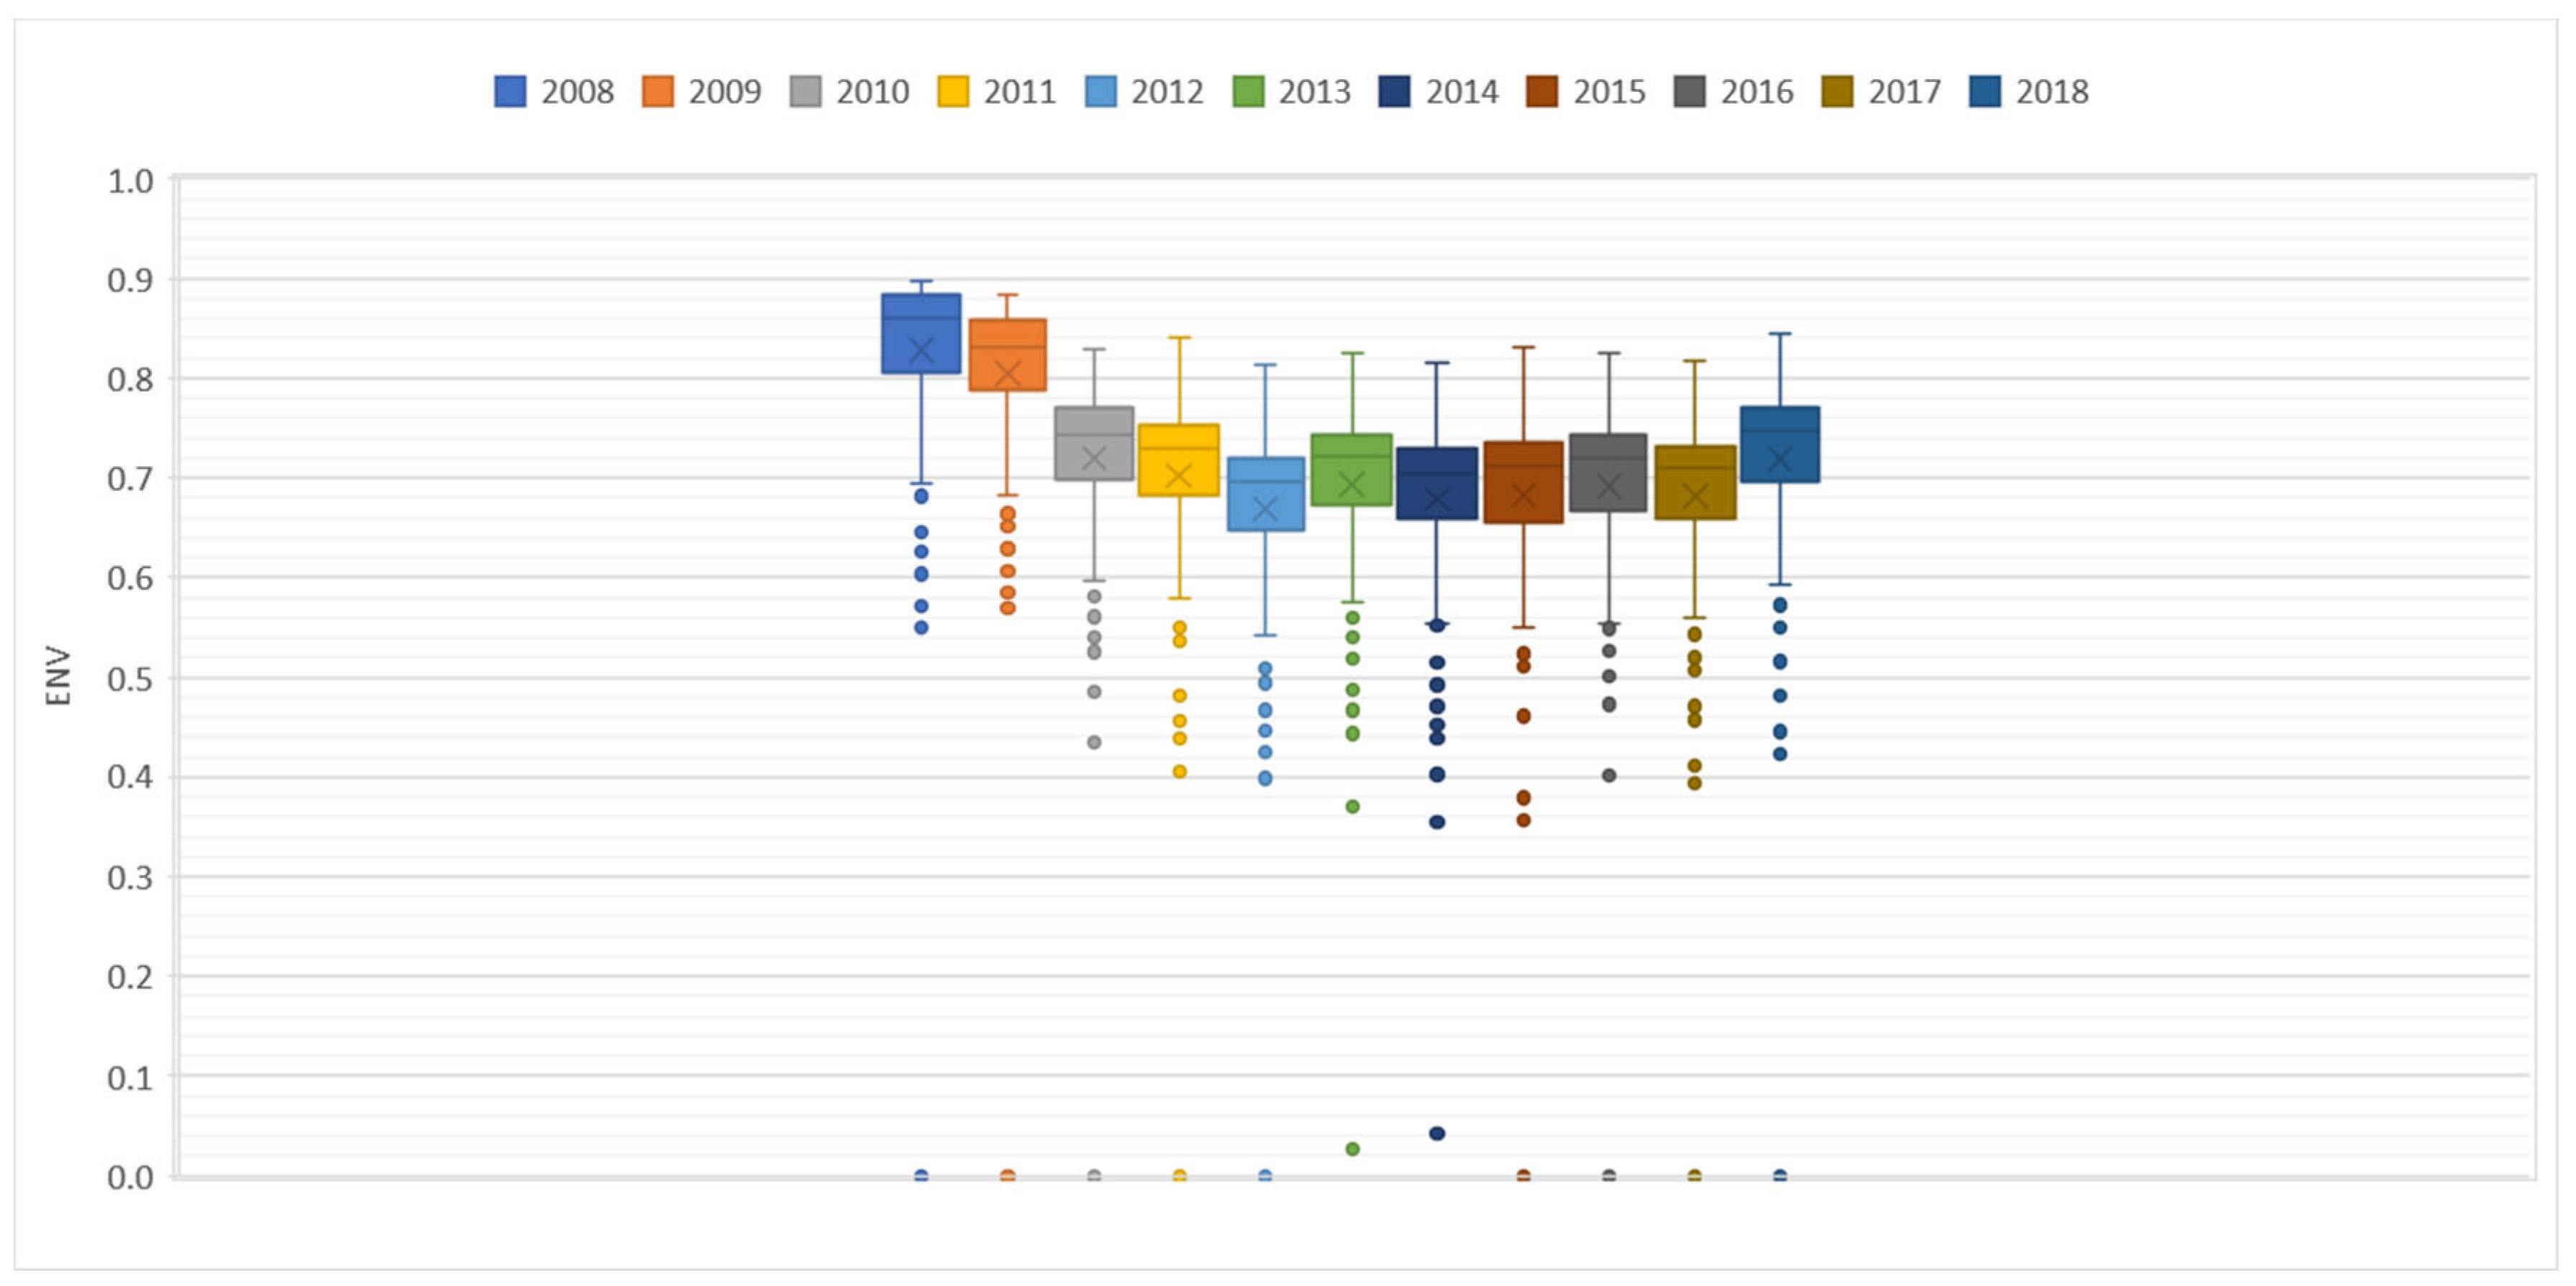
Figure 11, boxplots are presented with values of SOC
i, ENV
i and WPI
i for all municipalities, where each boxplot represents one year from 2008 to 2018.
Variations in the dimensions SOC, ENV and WPI over the years are shown in the boxplots of
Figure 9,
Figure 10 and
Figure 11. The average SOC decreased from 2008, reaching the lowest value of 0.06 in 2013, and then recovered in the following years. The average ENV had the same pattern, clearly decreasing from 2008 to the lowest value of 0.67 in 2012 and then recovering. In contrast to SOC and ENV, the average WPI had a consistent decrease from 2008 to 2018, indicating a decrease in legal wood production activity in the State of Pará.
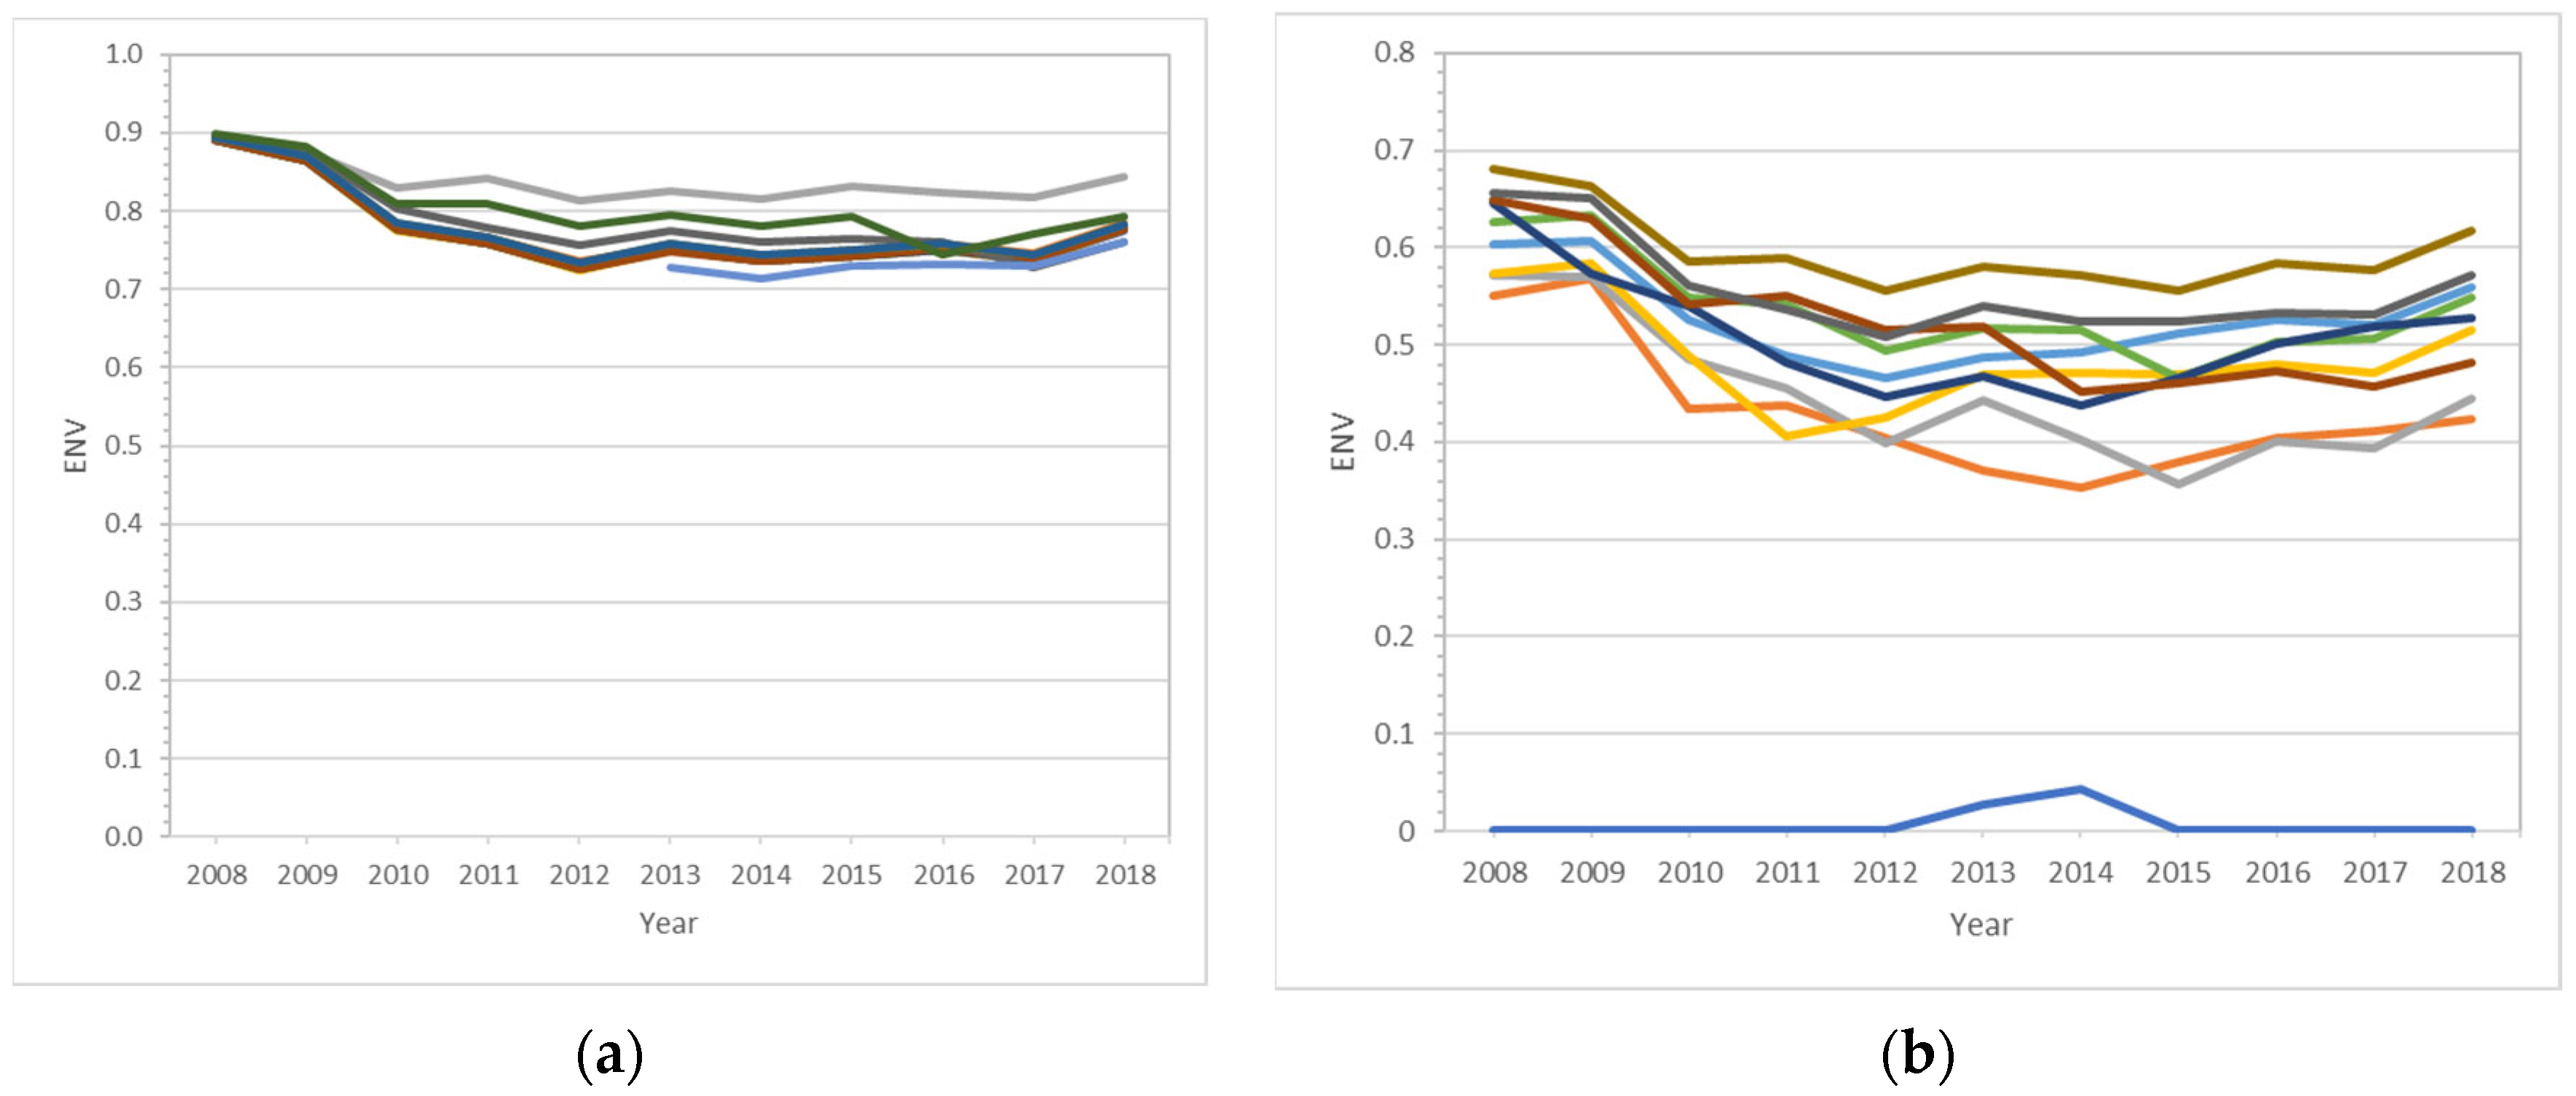
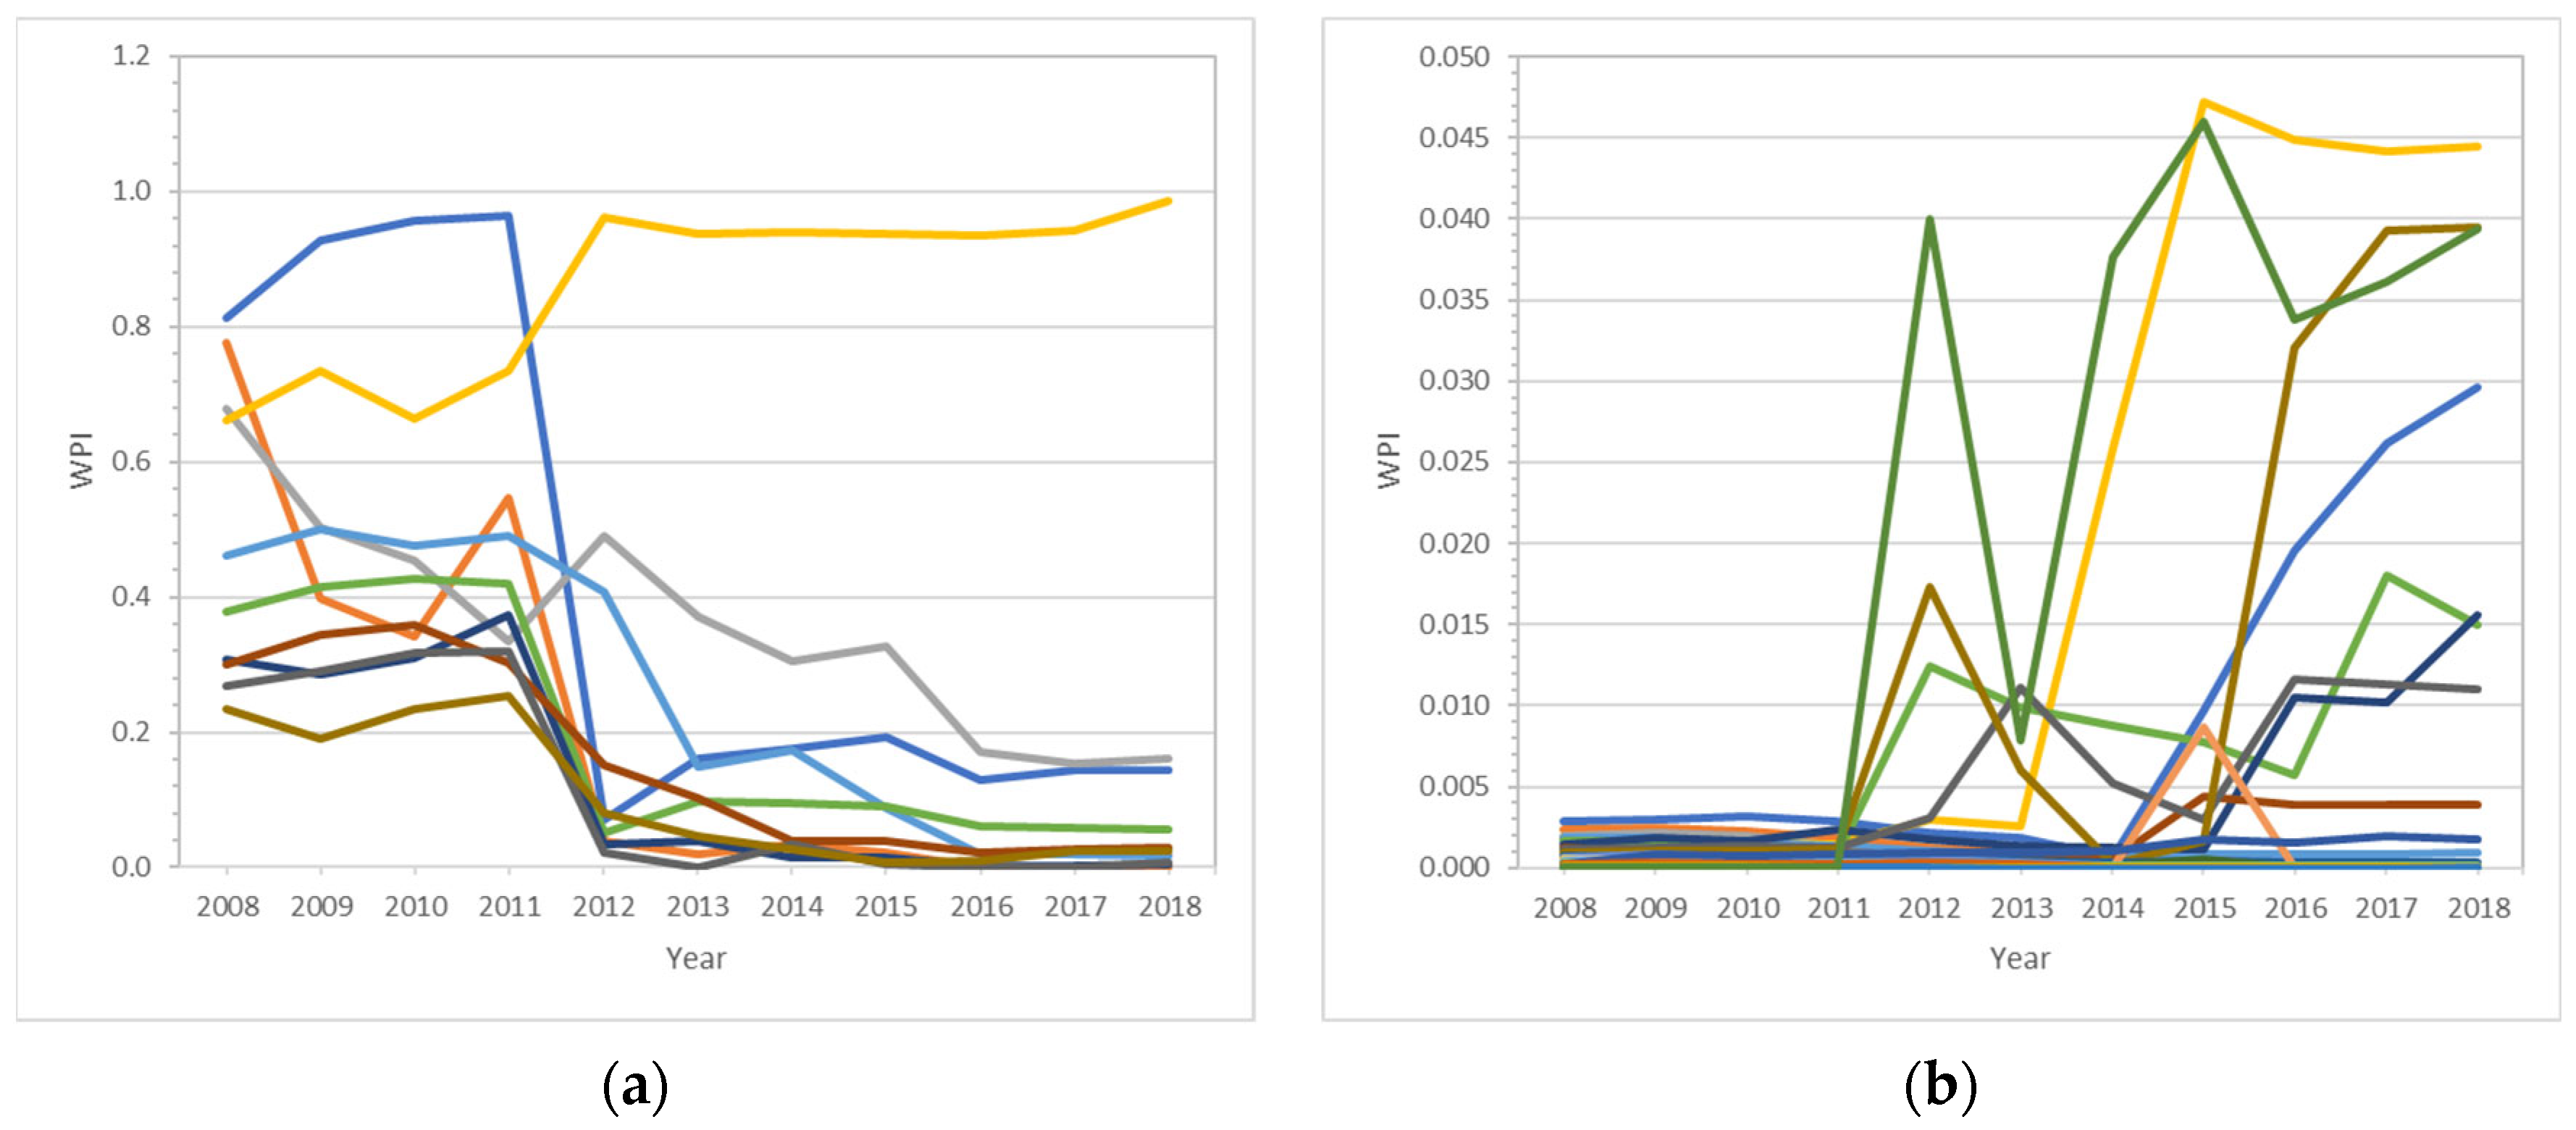
The last performed analysis aimed to rank the municipalities with the top values in the dimensions SOC, ENV and WPI in 2008 and those with the lowest values in 2008, and then verify how the dimensions of those municipalities varied over the years. In
Figure 12,
Figure 13 and
Figure 14, the values of SOC, ENV and WPI for the top and bottom municipalities are plotted against the years, where each line represents the values of the dimensions for each municipality.
In
Figure 12,
Figure 13 and
Figure 14, the average of all indicators decreased as a result of stricter control and legislation on timber production in the Amazon between 2008 and 2013 and began to recover in 2018 due to a relaxation of enforcement actions.
In
Figure 12a, the top municipalities kept their values of dimension SOC above 0.1, with an increasing trend from 2013 to 2018. The municipality called Oriximiná had the lowest SOC among the top municipalities, and the socioeconomic dimension decreased from 2008 to 2012, presenting values below 0.1, and then recovered from 2012 to 2018. Interestingly, as shown in
Figure 12b, 23 municipalities could be grouped together, which shows that with SOCs between 0.01 and 0.1, the values were concentrated between 0.035 and 0.05 for all the bottom municipalities in 2008, and then the values spread up to 2018. Additionally, the values oscillated over the years for most of the municipalities from 2008 to 2014, showing a peak in 2011 and a valley in 2013, and then the oscillation smoothed from 2014 to 2018.
Figure 13a depicts the top values of dimension ENV between 0.7 and 0.9. The values were more concentrated in 2008, being close to 0.9 for all the top municipalities, and then spread up to 2018.
As shown in
Figure 13a, the top municipalities maintained ENV values above 0.7 with a decreasing trend from 2008 to 2013 and then a slight recovery. In
Figure 13b, 13 municipalities grouped together, and the bottom values of ENV, between 0.0 and 0.7, showed the same trend as the top municipalities. It is important to emphasize that the worst value of dimension ENV was for the municipality called São Felix do Xingu (blue line), which has higher CO
2 emissions due to deforestation, agriculture, and cattle. The CO
2 emissions of this municipality are even higher than those of countries such as Uruguay, Norway, Chile, and Croatia.
The values of WPI presented in
Figure 14 were the most unexpected compared to
Figure 12 and
Figure 13 because of the spread and the lack of a trend or similarity among municipalities. However, some observations can be highlighted based on the Brazilian context. The top municipalities presented in
Figure 14a, with WPI values from 0.22 to 0.8, had a consistent decrease in the WPI from 2008 to 2018, and most of the municipalities had an accentuated decrease in the WPI in 2012. The exception was the yellow line, a municipality called Portel (south of the Marajó Archipelago), which historically had the highest wood log consumption from 2008 to 2018. Intriguingly, most of the bottom municipalities, with values between 0.0 and 0.047, presented an accentuated increase in the WPI since 2013. The dimension WPI is highly influenced by the wood log consumption, so an easy conclusion to draw from
Figure 14a,b, with 24 municipalities grouped together, is that the industries with the highest wood log consumption were the most affected by the law, as determined by the Brazilian Forest Code, in force since 2012, which aims to reconcile the protection of forests and natural resources with the socio-economic needs of the country [
29,
30], while industries with low wood log consumption benefited from the law and augmented production. It seems that the Brazilian Forest Code promoted a decrease in wood production in large industries and an accentuated increase in wood production in small industries. Four illuminating examples of this scenario are the yellow, green, brown, and blue lines of
Figure 14b, representing the municipalities of Monte Alegre, Jacareacanga, Belterra, and Faro, respectively. These municipalities increased their wood log consumption by 1135%, 371%, 418%, and 1628%, respectively, when comparing the log consumption in 2018 with that in 2013.
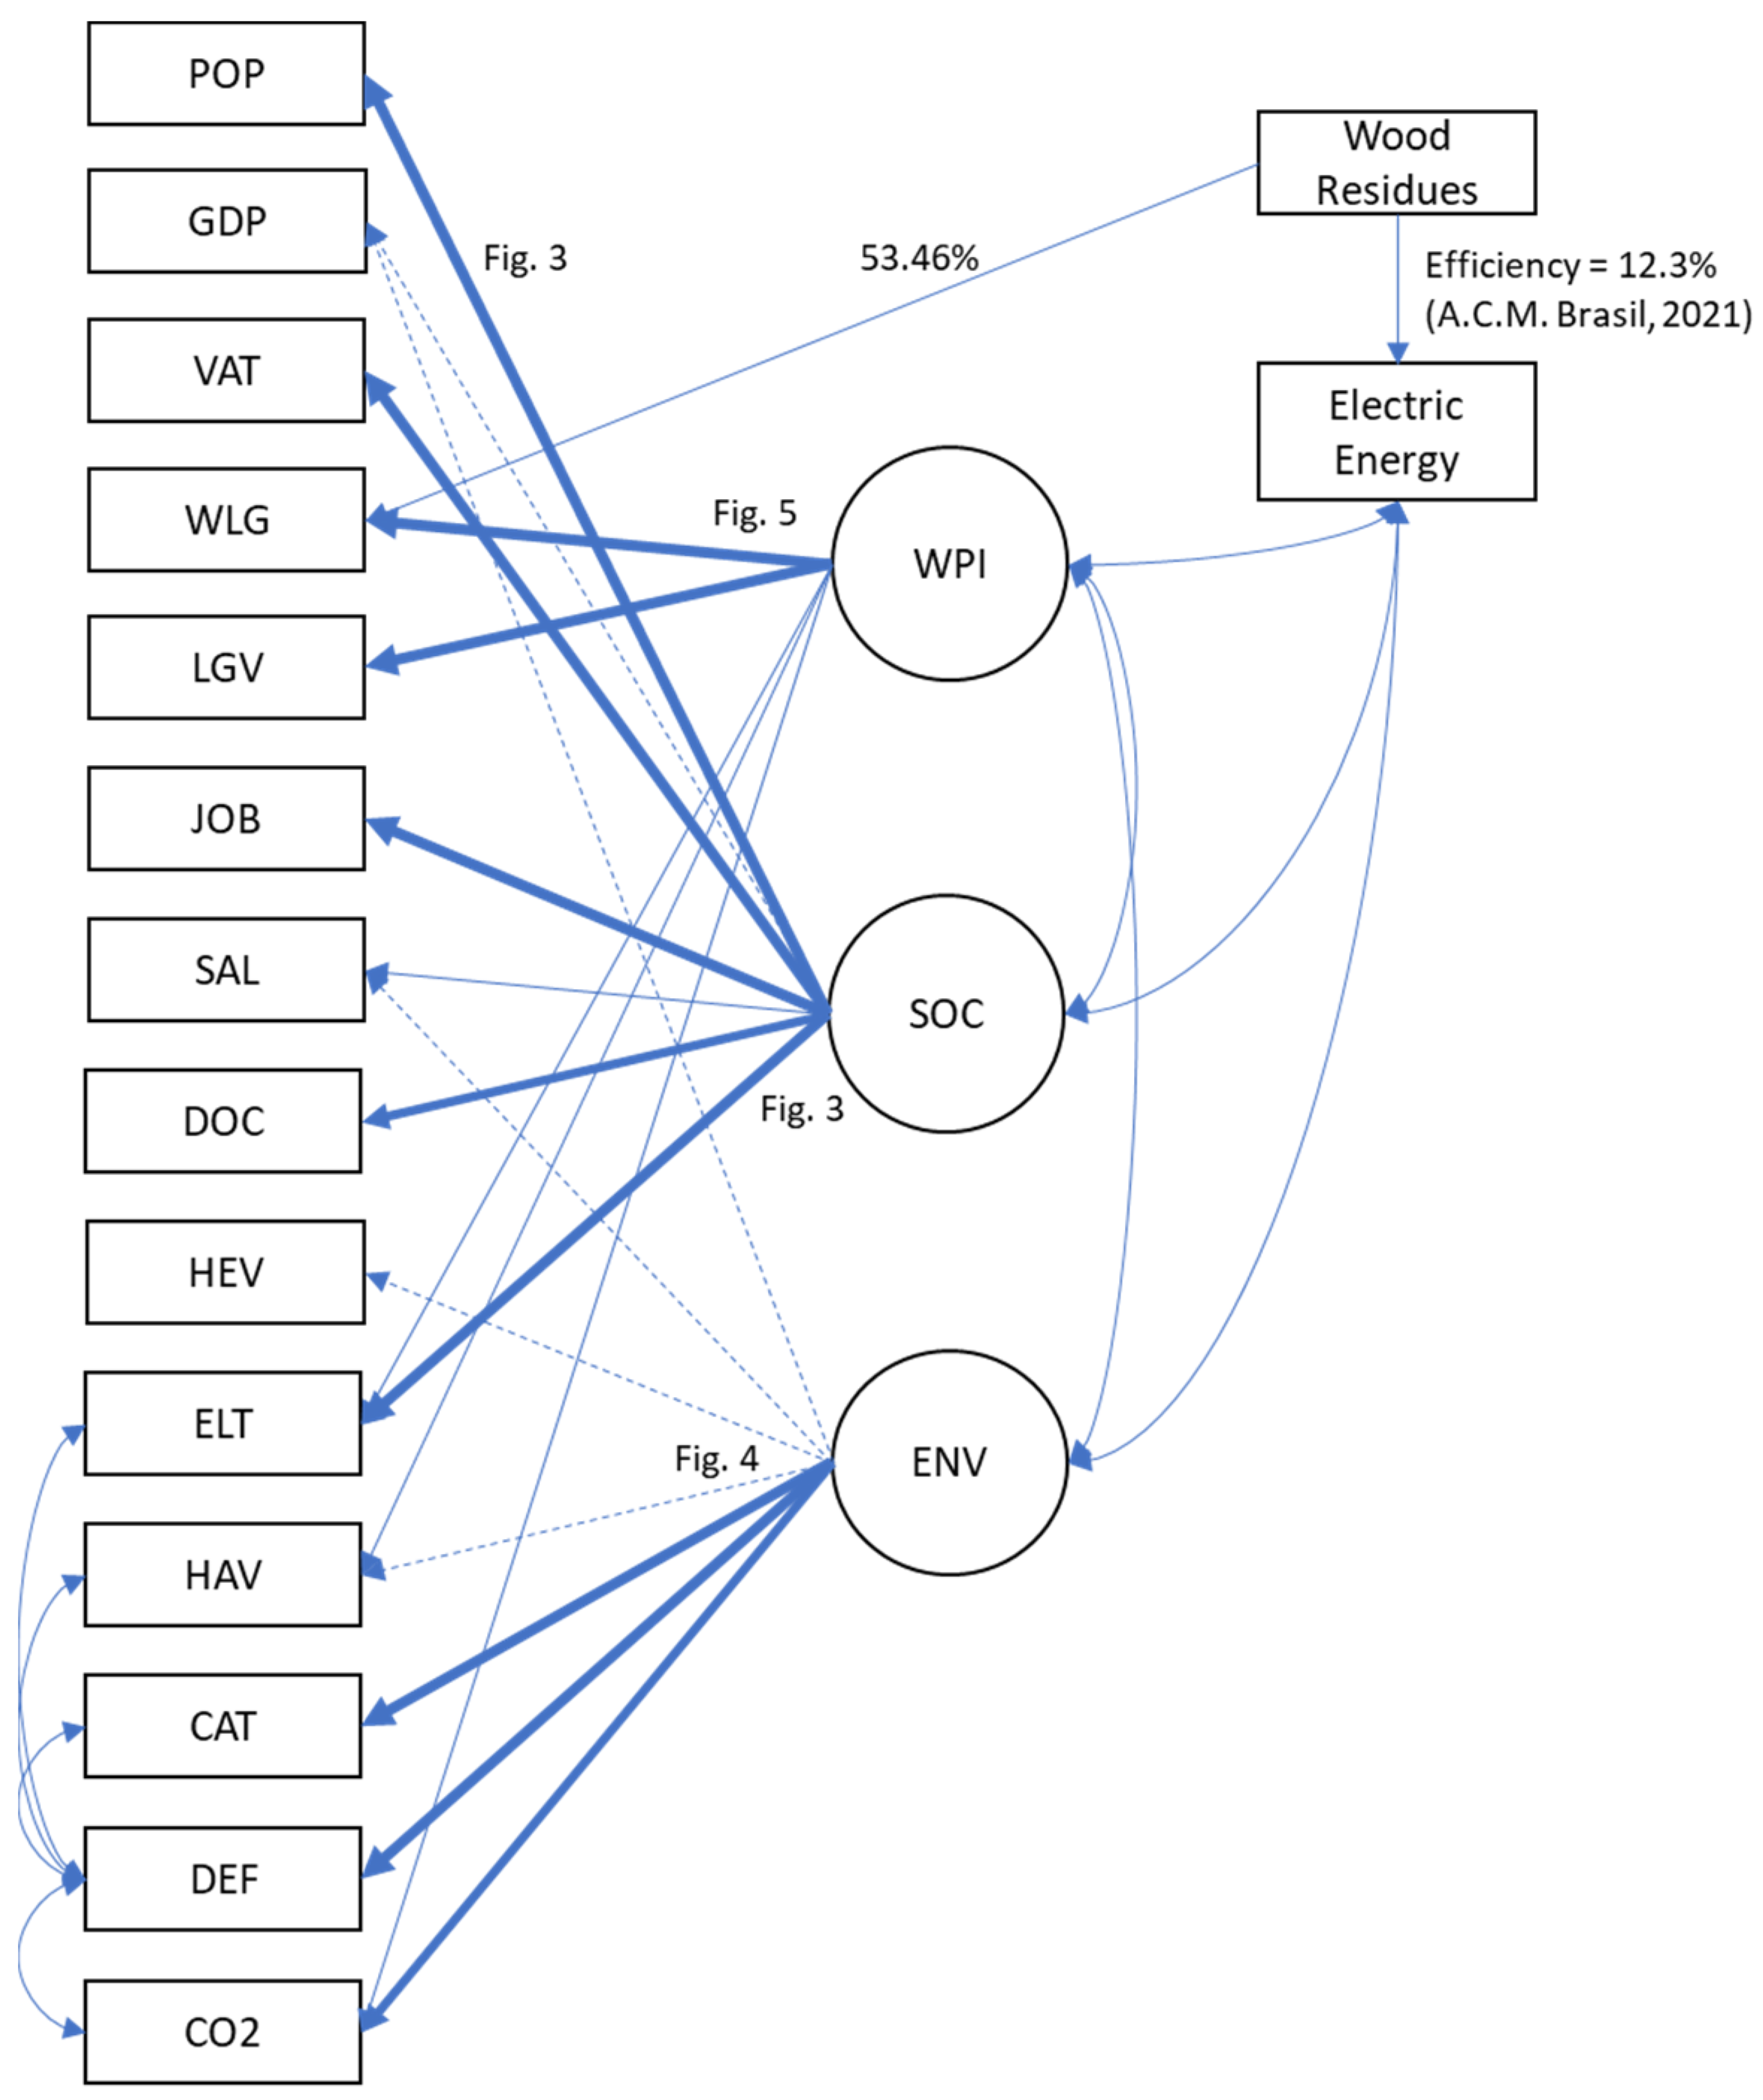
The results and figures presented above could explain in numbers how the lumber in the Amazon region is linked to the 14 analyzed indicators and how these indicators can be grouped into three dimensions, namely SOC, ENV, and WPI. To illustrate the relationship between the indicators and dimensions,
Figure 15 depicts a causal diagram and addresses the figures representing the resulting correlations of the present work.
In summary, from the analysis presented in this work, based on a dataset of ten years (2008–2018) containing the available indicators of the State of Pará, wood products and wood residues are linked not only to socioeconomic factors but also to forest degradation and CO2 emissions in the Amazon region.
6. Conclusions
In the first part of the present work, we proposed a unified number to determine the sawn yield as a function of wood log consumption in the State of Pará. As a result, this unified number for the sawn yield suggests that wood residues are estimated at 53.46% of the total log volume, particularly in the State of Pará. This number is an important factor because it represents the efficiency of wood log transformation, associated with the economic sustainability of wood industries and a lower demand for new areas of exploitation.
In the second part of the work, we implemented a principal component analysis, applied to a historical series spanning ten years, from 2008 to 2018, of 14 indicators of 144 municipalities of the State of Pará. The analysis of component loadings above 0.4 revealed how the 14 indicators were assigned to the socioeconomic, environmental, and wood production dimensions. Additionally, the component analysis indicated how the indicators and dimensions are related in the State of Pará. The component loadings showed that the socioeconomic dimension is more influenced by the population, value-added tax, and the number of houses with electric consumption, with loadings between 0.86 and 0.96. The number of medical doctors per 1000 people is also linked to the socioeconomic dimension, with component loadings between 0.72 and 0.80, followed by the average salary (SAL), with component loadings between 0.49 and 0.62. Three indicators, cattle, deforestation, and CO2 emissions were assigned to the environmental dimension, with component loadings above 0.7. These loadings decreased from 2008 to 2017 and probably increased from 2017 to the present. The total harvested area for agriculture resulted in loadings below 0.4 for the environmental dimension but had a plausible connection due to a consistent increase in importance from 2008 to 2018. Two indicators, wood log production and wood log value, were assigned to the wood production dimension, representing the wood production activity in the State of Pará. The component loadings of those indicators were between 0.94 and 9.99, with a slight decrease from 2008 to 2017 and a probable increase from 2017 to the present. Notably, low component loadings could reveal interesting conclusions, such as the total harvested area for agriculture that was perceptible from 2008 to 2011 and CO2 emissions that increased consistently from 2014 to 2018, both indicating a relationship with the wood production dimension.
In conclusion, the results and the causal diagram presented in this work could explain in numbers how the lumber in the Amazon region is linked to the 14 analyzed indicators and how these indicators can be grouped into three dimensions: socioeconomic, environmental, and wood production. Additionally, even low component loadings could indicate how wood production activity in the Amazon is correlated with impacts in the socioeconomic and environmental dimensions.
In the future, this article suggests proposing strategies for the enforcement of Brazilian law in the same manner as it was established between 2009 and 2013 for the timber industry, to regain positive indicators, which will consequently lead to improvements in environmental issues.

