Article

Transcriptome Analysis of Spirulina platensis sp. at Different Salinity and Nutrient Compositions for Sustainable Cultivation in Vietnam

1
Institute of Biotechnology, Vietnam Academy of Science and Technology, Hanoi 100000, Vietnam
2
Graduate University of Science and Technology, Vietnam Academy of Science and Technology, Hanoi 100000, Vietnam
3
LOBI Viet Nam Co., Ltd., Hanoi 100000, Vietnam
4
Department of Chemical and Environmental Engineering, Faculty of Science and Engineering, University of Nottingham Malaysia, Jalan Broga, Semenyih 43500, Selangor Darul Ehsan, Malaysia
5
Department of Chemical Engineering, Khalifa University, Abu Dhabi P.O. Box 127788, United Arab Emirates
*
Authors to whom correspondence should be addressed.
Sustainability 2023, 15(15), 11906; https://doi.org/10.3390/su151511906
Submission received: 15 June 2023 / Revised: 17 July 2023 / Accepted: 31 July 2023 / Published: 2 August 2023
(This article belongs to the Section Sustainable Engineering and Science)

Abstract

:
This study investigates the suitability of Spirulina-Ogawa-Terui (SOT) culture media with various nutrition concentrations for the laboratory growth of salt-tolerant Spirulina platensis ST. Among the four saltwater mediums, 25% SOT media (42‰ salinity) demonstrated a satisfactory performance, with maximum absorbance at a wavelength 556 nm reading of 0.76. After 15 cultivation days, the protein, carbohydrate, lipid, phycocyanin, chlorophyll a, and carotenoid contents reached 48.73%, 22.14%, 7.32%, 10.23%, 0.53%, and 0.12% of the dry cell weight (DCW), respectively. The growth of S. platensis ST is influenced by the culture medium with a salinity of 13‰ and 52‰, as well as different nutrient compositions. Transcriptional sequencing revealed that the response of S. platensis ST to salt stress was mainly expressed by regulating the gene expression involved in metabolic pathways such as photosynthesis and signaling transduction. Under nutritional and salt stress, S. platensis ST responds by modulating the gene expression involved in the synthesis of vital molecules, for example, growth regulators and adenosine triphosphate (ATP) producers. In conclusion, this study provides an insight into enhancing the ability of S. platensis to tolerate salt stress. The findings indicate that future efforts in algal-based cultivation research in seawater should focus on increasing the productivity to develop a sustainable industry for biomass production.

1. Introduction

Globally, the effects of climate change are currently becoming more severe and having a critical impact on socioeconomic factors. Vietnam, which has a long coastline, is thought to be among the regions most impacted by climate change because the coastal plains are particularly subject to rising sea levels and changes in the water flow brought on by rising steam. In fact, this has occurred in numerous provinces of the Mekong Delta, where salinization is rising as a result of high temperatures, low rainfall, seawater intrusion, and quick evaporation [1]. Therefore, numerous studies have been conducted to solve the issue of salinization, including the selection of some naturally occurring plant species that can tolerate high salt levels and adapt to severe environments [2].
Spirulina platensis belongs to the phylum Cyanophyta, class Cyanophyceae, order Oscillatoriales, family Oscillatoraceae, genus Spirulina [3]. S. platensis has been used as a source of nutrition for humans, feed for livestock and poultry, source of raw materials for the pharmaceutical industry, biofuels and fertilizers, as well as for the exploitation of biologically active substances such as antioxidants, anti-inflammatory agents, anticancer agents, and the enhancement of the immune system [4]. S. platensis is considered as the best food for the future and it is gaining popularity globally. The Food and Drugs Administration (FDA) validated it as “One of the best protein sources”. The intergovernmental institution permitted the use of Micro-algae Spirulina against Malnutrition (IIMSAM) [5,6]. The protein content of S. platensis is very high (accounting for 50–70% of dry cell weight (DCW)), with four important amino acids—lysine, methionine, phenylalanine, tryptophan (precursor for vitamin B3 synthesis)—that are easily absorbed by the body. In addition, S. platensis is rich in phycocyanin, a blue-colored phycobiliprotein (accounting for 10–20% of DCW) that is commonly used as a food additive, colorant, pharmaceutical, and cosmetic [7,8,9]. S. platensis also offers a number of health properties, such as antioxidant, anti-cancer, immunomodulatory, hypolipidemic, and anti-thrombotic properties [4,5,10]. In addition, polyunsaturated fatty acids (PUFA)—such as linolenic acid, stearidonic acid, and arachidonic acid—as well as macro and trace minerals, are abundant in S. platensis [8]. Therefore, S. platensis is currently being cultivated on an industrial scale for the commercialization of the products derived from this cyanobacterial biomass, such as functional food, animal feeds, and raw materials for the cosmetics and pharmaceutical sectors [3,5,6,7,10].
Spirulina has been shown to have the ability to tolerate a wide range of salinities. The use of a salt concentration regulator is one of the methods to maintain high quality Spirulina cultures. The economic success of S. platensis is determined by the quantity and quality of the biomass generated, which is achieved through the use of open pond technology in conjunction with tubular photobioreactors (PBRs) for cultivation [11]. Due to its high mineral content, seawater frequently serves as a substitute for freshwater and can help offset the cost of fertilizers [12]. The cultivation of algae with seawater is a potential water security solution that requires further research, especially for countries with arid environments that are dealing with the primary issue of a lack of fresh water for daily use in residential, industrial, and agricultural areas [13].
S. platensis has been discovered in waters with salinities ranging between 20 and 270‰, but the most optimal growth is at salinities between 20 and 70‰. S. platensis is the only organism present in substantial quantities in cyanobacterial populations in lakes with a salinity of more than 30‰ [14]. Al Mahrouqi et al. [15] showed that although S. platensis cultivated at 5‰ salinity produced more biomass than at 25 and 35‰ salinity, the dry weight attained at 35‰ was not statistically different from that at other salinity levels. S. platensis can change or modify its physiological and biochemical processes to adapt to the conditions of high salinity and different nutrient compositions. A thorough analysis of the physiological and proteomic alterations and the response of S. platensis to low temperature stress demonstrated that the proteins were differentially expressed, and S. platensis increased the carbohydrate metabolism, photosynthesis, amino acid biosynthesis, and translation to maintain cellular homeostasis and metabolic equilibrium under low temperatures [16]. As a defense mechanism against low temperature pressure, S. platensis up-regulated the proteins involved in gluconeogenesis, amino acid biosynthesis, and starch and sucrose metabolism, whereas the translation and down-regulated tricarboxylic acid (TCA) cycle were linked to reduced energy consumption. The transcriptomic study of S. platensis was conducted at varied salinity conditions (1.17‰, 17.55‰, and 29.25‰) [17]. Zhao et al. [17] confirmed the existence of msRNA in S. platensis, and these msRNA play a significant role in salt-induced stress responses. The mechanism underlying the genes related to stress and salt tolerance has not yet been discovered.
The metabolism of organisms can be altered by salinity shock, which might increase or produce new bioactive chemicals [18]. The production of biomass for food may have been impacted by the marine cultivation of S. platensis. However, there is a significant issue that needs to be resolved because the preparation of the culture medium on a basis of seawater would result in precipitation and turbidity. This results in nutrient loss in the culture media and increases the cost of biomass cultivation. A key research direction in growing S. platensis using seawater is the enhancement of the culture medium to lower the hardness of the saltwater (remove Ca2+, Mg2+) through negatively charged zeolite and bicarbonate [13,19].
In previous studies, we identified S. platensis ST (isolated from Giang Vo Lake, Hanoi, Vietnam, in 2005) that was capable of growing in natural seawater with a salinity of 30–40‰ [20,21]. However, during the long-term cultivation of this strain in a seawater supplementation of SOT, the culture medium was precipitation and turbidity, affecting the quality of the biomass and increasing the cost of biomass cultivation [20]. Therefore, an analysis of the effects of different salinities with partial or full supplementation of the nutrients of SOT media for the cultivation of S. platensis is still necessary. The aim of the present study was to evaluate the effect of different nutrition concentrations of SOT medium supplemented in distilled water or seawater on the growth rate, protein, lipid, carbohydrate, pigment contents, and photosynthetic parameters of S. platensis ST. Furthermore, the transcriptomes of the S. platensis ST strain at different culture conditions were sequenced and the regulation and functions of the important genes of this strain involved in salt tolerance and nutrition were identified.

2. Materials and Methods

2.1. Materials

The microalgae involved in this study was the S. platensis ST strain isolated from Giang Vo Lake, Hanoi city, Vietnam (2005). The strain belonged to the culture collection of the Algae Technology Department, Institute Biotechnology, Vietnam Academy of Science and Technology, under accession number SPST03.

2.2. Culture Media and Experimental Conditions

Before using culture media, the seawater was pre-treated to precipitate the excess ions of Mg2+, Ca2+ through the addition of 4 g/L NaHCO3, adjusted to pH 9.2 and storage of 37 °C for 2 h. Afterward, the seawater was filtered, and a suspension was collected for use.
Distilled water supplemented with 100% nutrient content of SOT medium was used as the control formula (S1). The pre-treated seawater was supplemented with 25%, 50%, 75%, and 100% nutrient contents of the SOT medium (which was first published in 1966 by Zarrouks (1966) [22], as shown in Table 1) are denoted as S2, S3, S4, and S5 media, respectively. These media were filtered using a filter Sartorius NY (0.2 µm; Minisart®®, Gottingen, Germany), and their final salinity was measured using a salinity refractometer REF211 (Total Meter, Taiwan).
All experiments in this study were conducted in triplicate, using 500 mL Erlenmeyer flasks containing 300 mL of culture medium under the following environmental conditions: temperature at 25 °C, irradiation with the light intensity of 40 µmol/m2s, the light: dark period of 12:12 h. The initial optical density at the wavelength of 556 nm (OD556nm) was 0.3 for all 5 formulations.
The samples were taken every 3–4 days to determine growth by measuring OD556nm and photosynthetic activity. The protein, carbohydrate, lipid, and pigments such as chlorophyll a, carotenoid, and phycocyanin content of the dry biomass were analyzed at the end of the experiments. S. platensis ST biomass will be harvested at the end of the logarithmic phase and the beginning of the stationary phase on the growth curve in the S1, S2, S3, S4, and S5 formulas to conduct mRNA extraction and cDNA synthesis (for transcriptome sequencing and analysis).

2.3. Determination of Microalgae Growth

The growth of microalgae was determined by measuring the optical density (OD) at the wavelength of 556 nm using a UV-1650 PC UV-Visible spectrophotometer (Shimadzu, Kyoto, Japan). When the OD is proportional to the cell density, the number of light photons absorbed is directly proportional to the amount of cell biomass in the sample to be measured (except for samples with very high dense cell concentrations). If the OD value is greater than 1.0 during the measurement, it is necessary to dilute the algae solution to ensure the OD is always less than 1.0.

2.4. Determining the Specific Growth Rate

The specific growth rate, µ (/day), of the algae population will be calculated using the formula [23,24]:
μ = (ln N1 − ln N0)/(t1 − t0)
where: N1 is the cell density at time t1; N0 is the cell density at time t0.

2.5. Determination of Pigments

Chlorophyll a, chlorophyll b, and total carotenoids were extracted and measured as described in the reports by Wellburn and Lichtenthaler [25], Hadiyanto and Suttrisnorhadi [26]. Chlorophyll a, carotenoids, and phycocyanin were extracted using 80% acetone and 0.01 M potassium phosphate buffer of pH 7 (using LAQUA twin, Horiba, Japan). The experiment was repeated three times independently.

2.6. Determination of Lipid, Protein, Carbohydrate Contents

The lipid, protein, and carbohydrate contents were evaluated. The total lipid content was calculated using the modified Bligh and Dyer method [24,27]. The lipid was extracted using chloroform/methanol solvent and washed using n-hexane. Protein in the biomass was extracted using the salting out approach and temperature shock method [28], and its concentration was determined using the Bradford method [29]. The carbohydrates concentration was determined as described in Sun et al. [30].

2.7. Measurement of the Net Photosynthetic Rate (Pn)

The Pn was measured using a portable photosynthetic system (Licor-6400, Lincoln, NE, USA) at 10:00 AM under the condition of 28 °C, 300 µ/m2/s, 370 ppm CO2, and 60% relative humidity.

2.8. Determination of Chlorophyll a Fluorescence Photosynthetic Activity

The measurement of chlorophyll a fluorescence was performed using a Mini-PAM II Chlorophyll a fluorimeter (HWG, Germany) [20,24,31]. First, 10 mL of culture broth of S. platensis ST was collected and filtered through Whatman GF/C filter paper (GE, 55 mm diameter). The period of dark adaptation lasted for 20 min, and the maximum fluorescence (Fm) was calculated using high light intensity (500–3000 µE). Minimal fluorescence in the light-adapted state (Fo) is defined as the fluorescence during the opening of the reaction center of photosystem II (PS II). To ensure the maximum oxidation of PS II electron acceptors, Fo was measured immediately after switching off the actinic source in the presence of far-red light for 10 s. The maximal photochemical efficiency [(Fv/Fm) = (Fm − Fo)/Fm] was calculated based on Kitajima and Butler [32]. The effective PS II quantum yield (ΦPSII or Y(II)) and photosynthetic electron transport rate (ETR) were determined as described in Qiu et al. [33].

2.9. Isolation of RNA and cDNA Synthesis

Total RNA from S. platensis ST grown under different culture conditions was extracted using TRIzol™ Reagent (Invitrogen, Singapore), according to the manufacturer’s protocol. The RNA content was quantified using a NanoDrop spectrophotometer (Thermo Fisher Scientific Inc., Waltham, MA, USA).
Reverse transcription of the total RNA was conducted via oligo (dT) 15 primer using a RevertAid Firs Strand cDNA Synthesis Kit (Thermo Fisher Scientific, Singapore), according to the manufacturer’s protocol, to generate cDNA. The cDNA was quantified using a NanoDrop spectrophotometer and Agilent 2100 Bioanalyzer with an Agilent RNA Pico Chip Kit (Agilent Technologies, Inc., Santa Clara, CA, USA). Three independent extractions were performed for each S. platensis ST cultivated at S1, S2, S3, S4, and S5 formulas. The samples were pooled and sent to LOBI Vietnam for sequencing (located at No 18 Hoang Quoc Viet Street, Cau Giay, Hanoi, Vietnam, www.lobi.vn, accessed on 15 June 2022).

2.10. Library Construction and Illumina Sequencing

Truseq Nano DNA libraries were constructed from the cDNA samples using the manufacturer’s protocol, and the qualification of the obtained libraries was assessed using Agilent 2100. The obtained libraries were sequenced using an Illumina NovaSeq sequencer. A total of 182,290,820 paired-end clean reads were generated with the read length of 101 bp.

2.11. Gene Expression Quantification and Differential Expression Analysis

The quality of the raw data was examined using the FastQC tool (FastQC 2015) and low quality reads were filtered using Trimmomatic [34] based on the lengths and average quality scores (SLIDINGWINDOW:4:30; MINLEN:50). The cleaned reads were aligned to the reference genome of S. platensis (Genbank IDs: GCA_000307915.1) using STAR [35] with default parameters (v2.7.10a; --alignIntronMax 0 --alignMatesGapMax 0 --outSAMtype BAM SortedBy-Coordinate). The expression level of each gene was quantified using the HTSeq tool [36] and normalized to Count per million (CPM) using edgeR [37]. Following the condition, the differentially expressed genes (DEGs) between 3 samples of S. platensis ST cultured at different (S1, S2, S3, S4, and S5) conditions were detected using equation: C P M S 2 G C P M S 1 G l o g 2 θ , where θ is a threshold.

2.12. Gene Ontology and KEGG Analyses

GoSeq was used to perform Gene Ontology (GO) annotation terms and GO functional enrichment [38]. Kyoto Encyclopedia of Genes and Genomes (KEGG) IDs were obtained from the KEGG Automatic Annotation Server (https://www.genome.jp/kegg/kaas/, accessed on 10 October 2022) [39] and KEGG pathway analysis was constructed using the KEGG Mapper—Reconstruct tool (https://www.genome.jp/kegg/mapper/reconstruct.html, accessed on 10 October 2022) [40] against the KEGG database [41].

2.13. Statistical Analysis

All experiments were performed in triplicate. The data were expressed as mean ± standard error of the mean (SEM). The data were analyzed using the Microsoft Excel software version 2306. One-way ANOVA and Duncan’s post hoc analysis with a significance level of 0.05 were used to analyze the collected data.

3. Results and Discussion

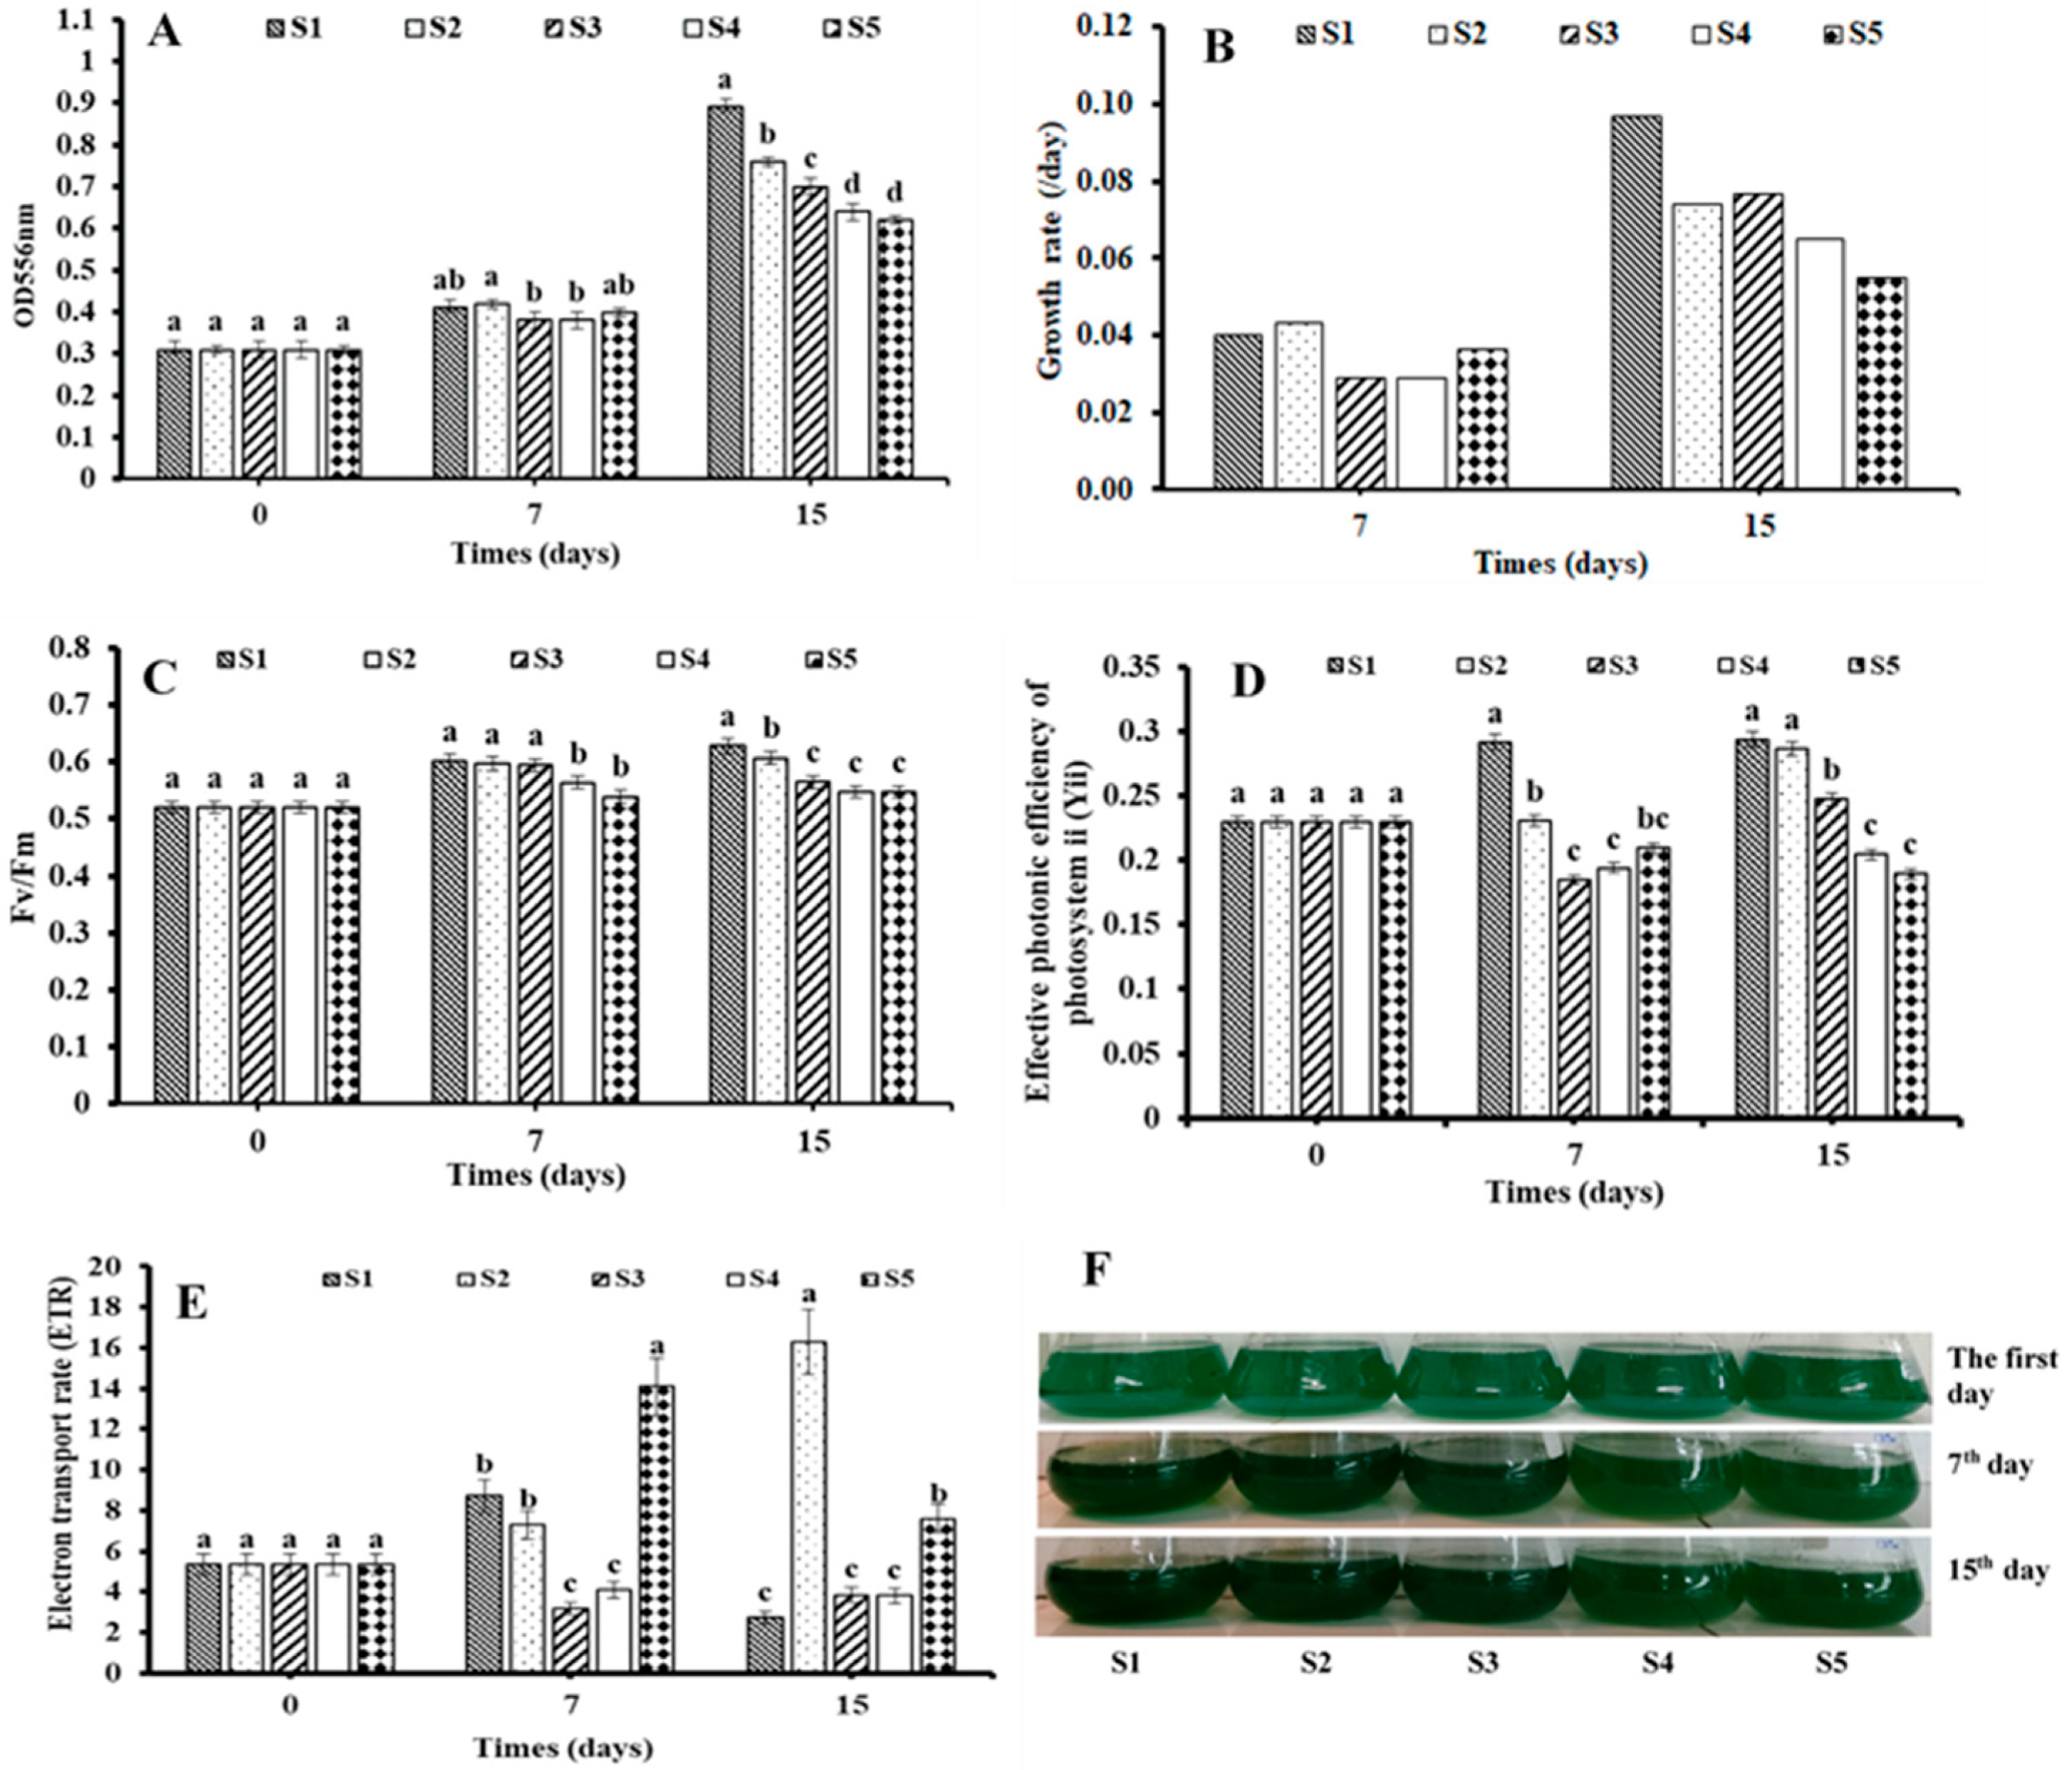
3.1. Effect of SOT Medium Containing Salinity of 30‰ with Different Nutrition Concentration on the Growth of Salt Tolerant S. platensis ST under Laboratory Condition

S. platensis can grow in high salinity media with varying nutritional compositions depending on the biological features, salinity tolerance, and nutrient source of the strain [42]. S. platensis can change or modify its physiological and biochemical processes to adapt to the conditions of high salinity and different nutrient compositions. The ability of S. platensis to grow in brackish water and sea water instead of fresh water will minimize the dependency on freshwater resources, which are becoming increasingly scarce around the world, and particularly in Vietnam. The cultivation of algal with seawater is a potential solution for water security in all countries; therefore, it needs further research, especially when freshwater resources are scarce in many countries [13]. This shows that there is a significant potential to commercialize S. platensis on a large scale in a country with a growing marine economy.
Natural seawater has a tremendously diversified chemical composition, comprised of more than 50 known elements and a considerable number of organic molecules [43]. However, when using seawater to prepare a SOT medium for a S. platensis culture, because seawater is hard water with high Ca+2 and Mg+2 ions, it causes the precipitation of nutrients and turbidity of the medium. This problem needs to be solved because it leads to the nutrient loss of the medium, increasing the cost of the biomass culture. Therefore, a major research direction in raising S. platensis cultivation with seawater is to reduce the hardness of seawater (i.e., remove Ca2+, Mg2+ ions) using negatively charged zeolites and bicarbonates [13,19]. To overcome the above problem, we evaluated the effect of different nutrient concentrations of the SOT medium supplemented in distilled water or seawater on the growth rate, protein, lipid, carbohydrate, and photosynthetic parameters of salt-tolerant S. platensis ST (Figure 1 and Table 2).
As shown in Figure 1, the growth of the salt-tolerant S. platensis ST strain in different nutrition concentrations of the SOT media was satisfactory. After 15 days of cultivation, the growth of S. platensis ST was observed in different SOT media concentrations (S2, S3, S4m and S5) with salinity concentrations of 42, 45, 48 and 52‰, respectively; the highest OD 556 nm were 0.76 ± 0.01; 0.70 ± 0.02; 0.64 ± 0.02; and 0.62 ± 0.01, respectively (Figure 1A). In comparison to S1 (control), the highest OD 556 nm value for S2 (0.76 ± 0.01) was decreased by 14.6%. The growth difference between the various SOT medium compositions was statistically significant (p < 0.05).
The salinity in the media also affected the specific growth rates over the days of cultivation. The results in Figure 1B showed that S. platensis ST was at the acclimatization stage during the first seven days, with the specific growth rate of 0.03–0.04/day. Next, during the cultivation period of 7 to 15 days, the specific growth rate was increased, ranging between 0.55 and 0.74/day. Increasing the nutrient concentration of the SOT medium in seawater led to an increase in the salinity in the culture medium, from 42‰ to 52‰, resulting in high salinity, which inhibited the growth and specific growth rate of the S. platensis ST strain (Figure 1B). Therefore, it is recommended to use the S2 formula (salinity of 42‰) for the growth of S. platensis ST in the following experiments to achieve rapid growth while reducing the need for chemicals in the culture medium. A similar pattern of results was obtained in the past studies by Sandeep et al. [19] and Vonshak et al. [44]. As published by Sandeep et al. [19], the specific growth rate of S. platensis when cultured in seawater was significantly higher than when it was grown in seawater supplemented with nutrients such as NaHCO3 and NaCl or NaHCO3, NaCl, and K2SO4 (p < 0.05). In other words, no improvement in the growth rate of S. platensis was observed when it was cultured in nutrient-fortified seawater. Its protein and pigment components (phycocyanin) in the algal biomass did not significantly differ from that of the cyanobacterial control in seawater media (salinity of 11 ‰, NaHCO3 of 8 g/L, and NaCl of 2 g/L) [19]. S. platensis can grow and tolerate high salt concentrations of up to 70 g/L NaCl. The growth rate and biochemical composition remained stable or constant at NaCl concentrations of 1 to 30 g/L [45]. Growth was delayed for at least 24 h after the algae were exposed to high concentrations of NaCl. However, the reduced algal biomass then had an exponential growth rate at a new steady state that was formed. After the acclimatization phase, the algae had a slower growth rate and they were inversely proportional to the increased NaCl concentration in the medium [44]. According to Moussa and Hassan [46], the salinity lowered the rate of photosynthesis. High salinity was significantly correlated with decreased protein synthesis and enzyme activity due to the accumulation of sodium ion in the tissues [47]. Bezerra et al. [48] reported that the biomass yield of Spirulina sp. LEB 18 cultured in seawater supplemented with Zazzouk medium at low nutrient concentrations (0 and 25%) was higher than at high nutrient concentrations (50 and 100%). This is because the increased salinity may have increased the osmotic pressure and enhanced the permeability of the cell membranes. It should be emphasized that the osmotic pressure of the cell is directly related to the absorption of the nutrients necessary for their metabolism to occur.
The chlorophyll a fluorescence measurements were used to assess the condition of the photosynthetic apparatus and the tolerance of the S. platensis ST strains to stress cultivation conditions. The results in Figure 1C demonstrate the efficient absorption of light energy in photosystem II (PSII) and utilized in the photochemical reaction (Fv/Fm), which was correlated to the change in the algal growth. During this process, the Fv/Fm values in all formulas varied from 0.55 to 0.63 (equivalent to or 10–13% lower than the corresponding value in the control formula at the same time). This showed that the culture media (with a salinity of 45–52‰) can damage the reaction center of PSII, affecting the growth of S. platensis ST. As a result, in comparison to the control, its growth reduced by 14.6%.
Furthermore, the effective quantum efficiency value of photosystem II (YII) in the control formula (S1) increased gradually, whereas there was a decrease in the experimental formulas. This demonstrates that the light energy absorption efficiency of PSII in the experimental formulas was considerably influenced (Figure 1D). The electron transfer rate (ETR) in the different nutrient concentrations of the SOT medium demonstrated statistical significance (p < 0.05) (Figure 1E). In comparison to the S1 control formula, the electron transport rate also changed in the experimental formulas S2, S3, S4, and S5. The findings were directly in line with previous findings [49,50] that demonstrated that the phycobilin/Chl a ratio and PSII activity decreased in the presence of high salinity, which also reduced the photosynthetic efficiency of S. platensis. This was regarded as an energy-intensive process because salinity influences the use of light energy and metabolism, which was used to counteract the osmotic pressure and ions. Figure 1F illustrates the growth of S. platensis in various experimental formulations.
The study by Vonshak et al. [44] showed that the photosynthetic and respiratory activities of S. platensis decreased when the cell was exposed to salt for around 30 min, and they persisted beyond the photosynthetic acclimatization and adaption phase to a lower state. It has been hypothesized that the separation of phycobilisomes from the thylakoid membrane may be the cause of the suppression of photosynthesis due to the rapid input of sodium [51]. According to Lu and Vonshak [52], A. fusiformis M2 was affected by the salinity, which inhibited electron transport in both the donor and acceptor side of PSII. This affected the phycobilisomes and partially disconnected them from PSII, which alters the beneficial excitation energy distribution of PSI.
Salinity is one of the most important factors affecting the growth, lipid content, and biochemical composition of microalgae. As shown in Table 2, the protein, carbohydrate, lipid, and phycocyanin contents of S. platensis ST ranged from: 38.94 to 57.75%; 16.55 to 22.1%; 6.81 to 11.14% and 5.90 to 10.90% DCW, respectively, at which the protein amount was the highest. S2 (25% SOT) contained a higher amount of protein (48.73 ± 0.81% DCW), carbohydrates (22.14 ± 0.11% DCW), and phycocyanin (10.23 ± 0.25% DCW) than S5 (100% SOT) (38.94 ± 0.29, 16.55 ± 0.38 and 5.90 ± 0.37% DCW). In addition, S2 (25% SOT) had a similar chlorophyll a concentration (0.53 ± 0.04% DCW) and carotenoids (0.12 ± 0.01% DCW) to the control formula. The difference in the nutritional contents between the experimental formulas S2, S3, S4, and S5 exhibited statistical significance (p < 0.05). According to Ravelonandro et al. [50], the protein concentration of S. platensis declined from 50% to 38% DCW when the salinity increased from 13‰ to 35‰. The reduced carbohydrate content of the SOT medium with increased nutrient concentrations can be explained by the low molecular weight of carbohydrate molecules, which aided in regulating the osmotic pressure of the cells to adapt to the high salinity of the culture conditions [13]. Therefore, the formula of S2 (25% SOT) should be selected for the following experiments to save costs, assure better growth, and provide high-quality algal biomass in comparison to the control (S1: 100% SOT with salinity of 13‰).
The findings demonstrated that the growth, photosynthetic activity, and nutrient accumulation of the cells of the S. platensis ST strain will be affected by various culture conditions. The S2 formula (25% SOT with salinity of 42‰) provided the most satisfactory growth conditions for S. platensis ST. In this S2 medium, the highest growth rate expressed by the OD556nm value was 0.76 ± 0.01. The concentration of protein, carbohydrates, lipids, and phycocyanin reached 48.73 ± 0.81%; 22.14 ± 0.11%; 7.32 ± 0.61%; and 10.23 ± 0.25% of DCW, respectively. Biomass can be harvested to be utilized in different industries, such as pharmaceuticals, nutraceuticals, animal feeds, and food and beverages.

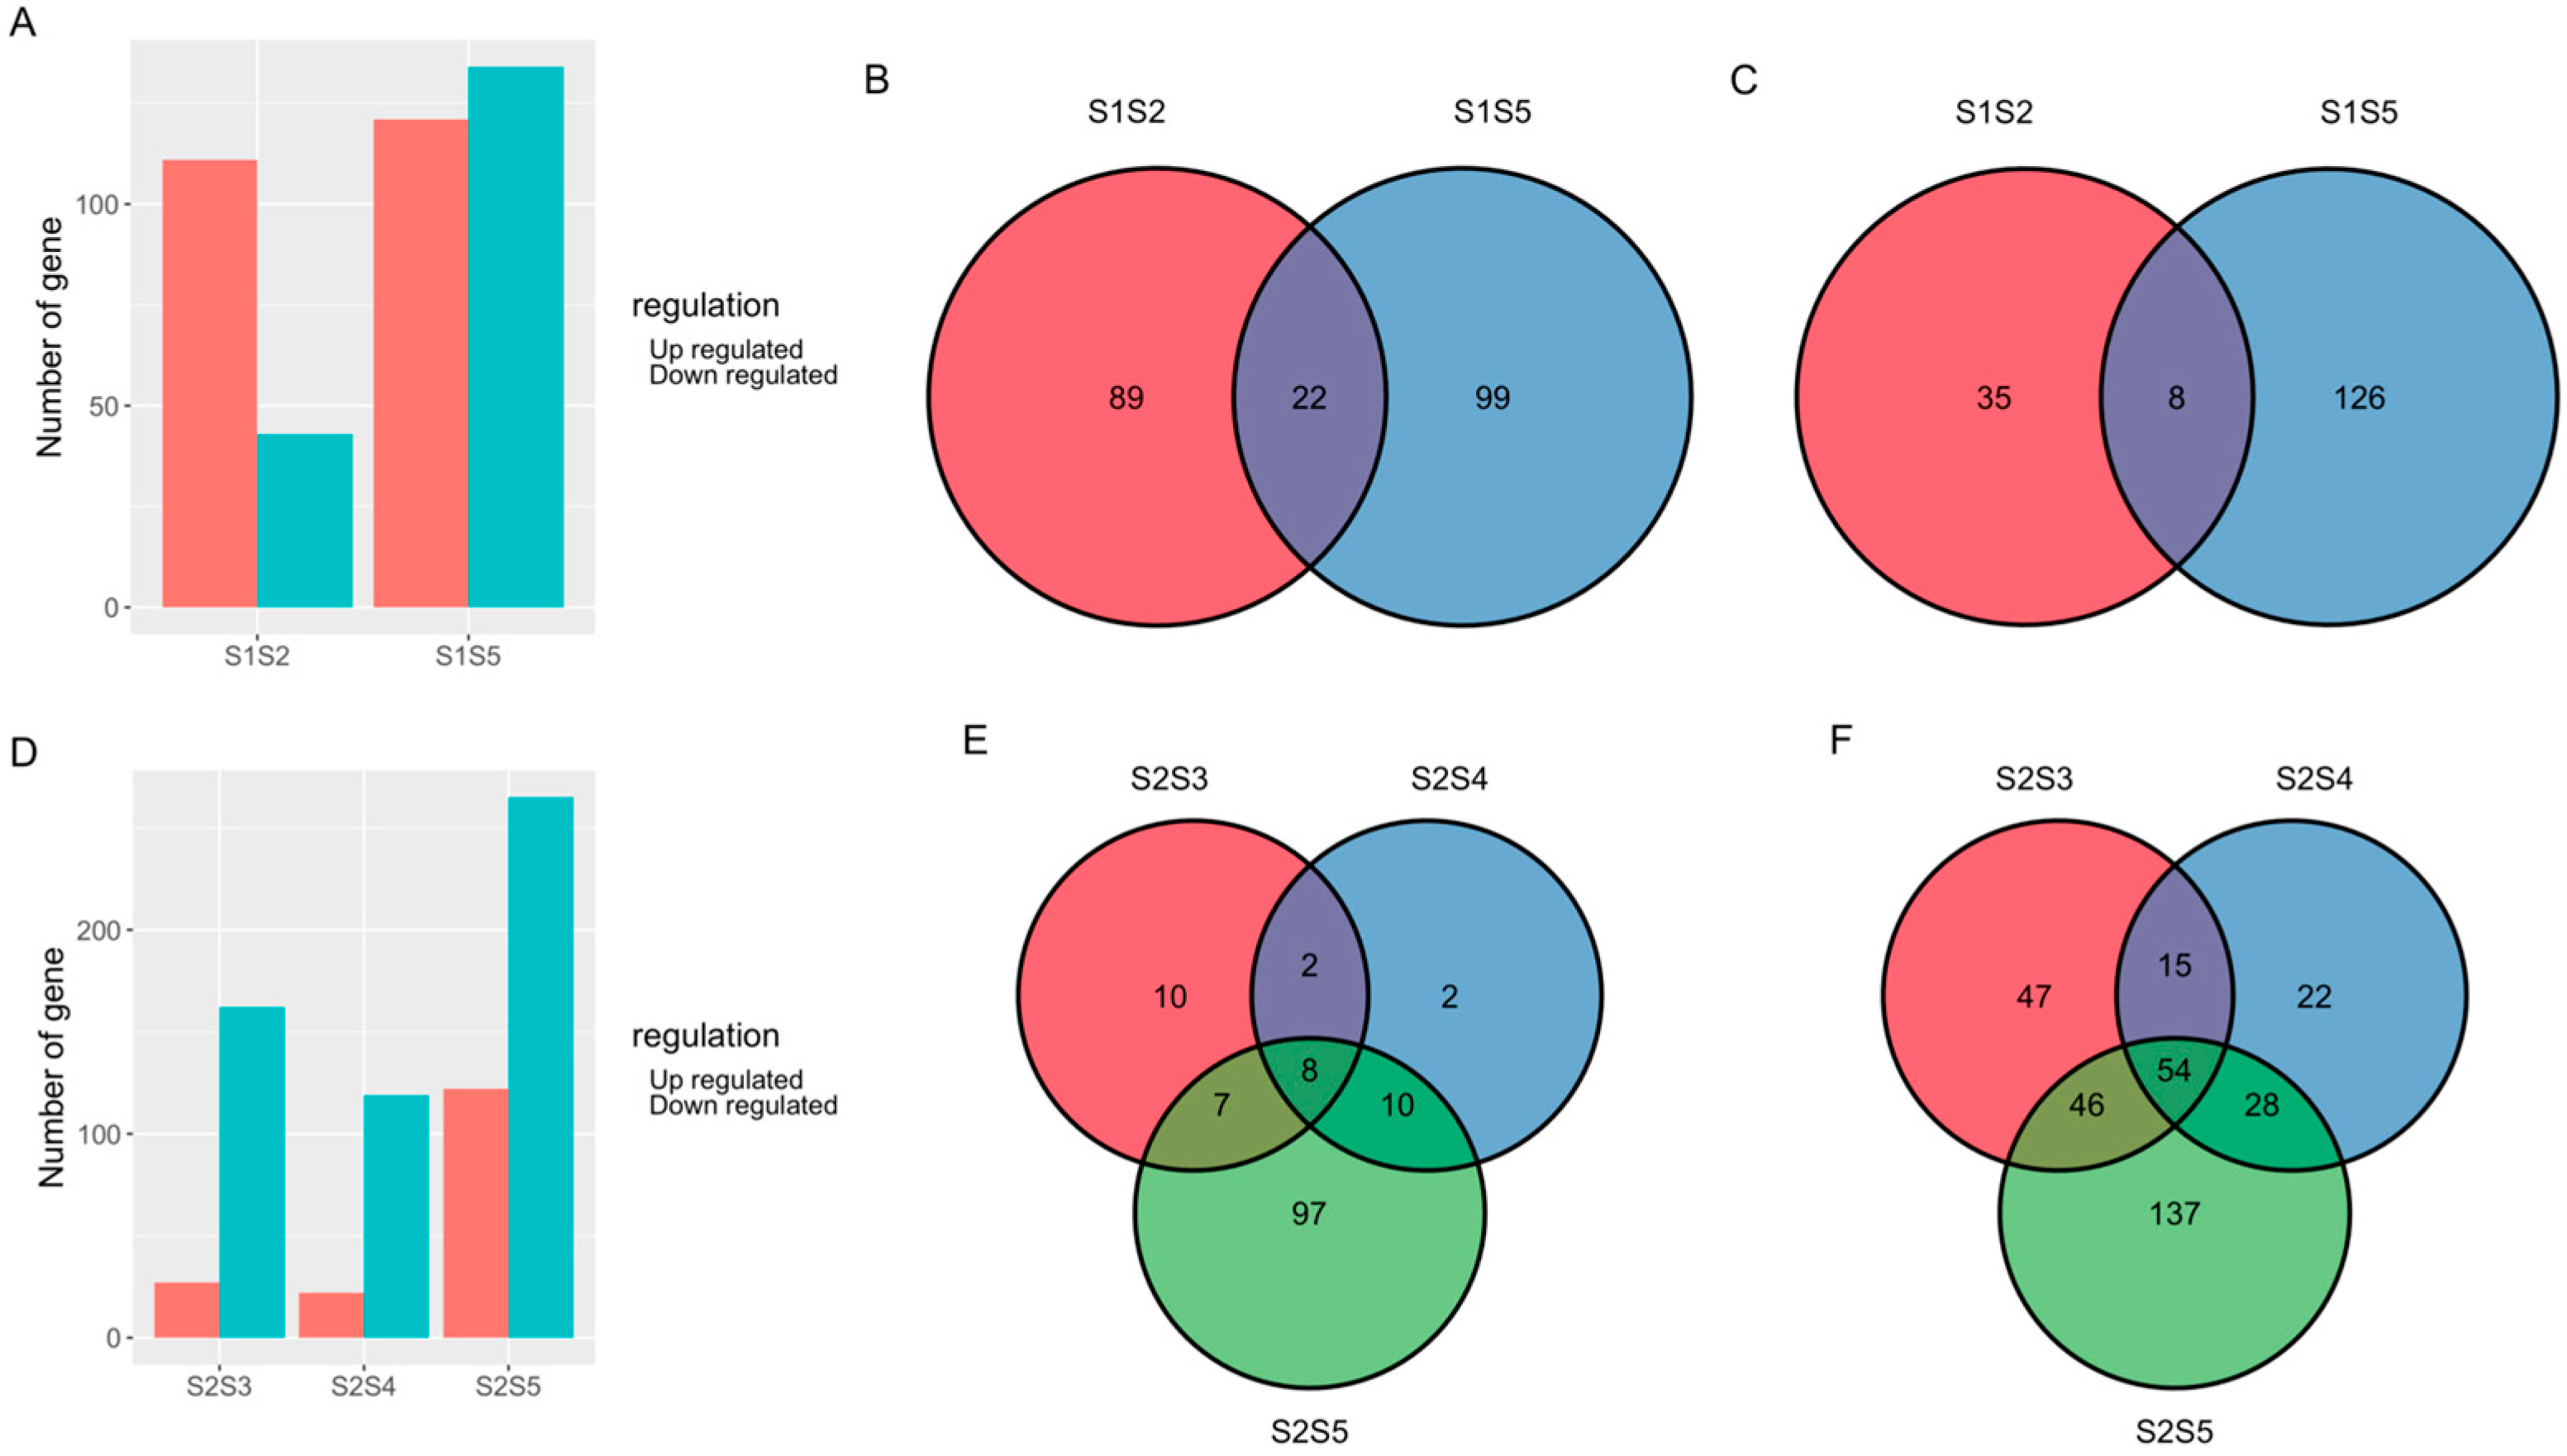
3.2. Transcriptome Analysis

Sequencing libraries were prepared from the cDNA of the S. platensis ST strain grown under different salinity and nutrition conditions. Five libraries corresponding to the samples cultured in the S1, S2, S3, S4, and S5 formulas were sequenced using the Illumina NovaSeq sequencer. A total of 91,145,410 reads were generated with 9,205,686,410 bases, with 45–46% GC content and 93.1–94.13% Q30 base percentage for all samples (Table 3). The reads were mapped to the reference transcriptome of Arthrospira platensis C1 (Accession number GCA_000307915.1) with an average mapping rate of 23.67% (13.19–36.43%) [53]. The HTseq tool was used to determine the number of protein-encoding genes and transcripts in S. platensis under different salinity and nutrient concentrations based on the alignment file generated using STAR. Out of a total of 6108 identified genes in the reference genome, about 5700 protein-encoding genes were discovered in each sample (Table 4). The average number of transcripts per gene ranged between 310 and 737, with the highest transcript count ranging between 4775 and 8835 times.
Through data integration analysis, the DEGs of the S. platensis ST strain cultured in S1 vs. S5, S1 vs. S2, S2 vs. S3 and S4, and S5 formulas were identified (Figure 2). Overall, 111 up-regulated DEGs and 43 down-regulated DEGs were found when the S. platensis cultured in the S1 and S2 formulas (S1S2) were compared (Figure 2A). However, when exposed to salt stress (S1 vs. S5, 13‰ vs. 52‰), the number of up- and down-regulated DEGs significantly increased. Next, by comparing S1 vs. S5, a total of 121 up-regulated DEGs and 134 down-regulated DEGs were identified (Figure 2A). In the group of S1S5, 22 common DEGs were found to be up-regulated, whereas eight common DEGs were found to be down-regulated when compared to the group of S1S2 (Figure 2B,C).
Some significant DEGs of the S. platensis ST strain were discovered by comparing the S2 vs. S3 formulas (27 up-regulated and 162 down-regulated DEGs), S2 vs. S4 formulas (22 up-regulated and 119 down-regulated DEGs), and S2 vs. S5 formulas (122 up-regulated and 165 down-regulated DEGs) at different salinities (42‰ vs. 45‰, 42‰ vs. 48‰, 42‰ vs. 52‰) and different nutritional concentrations (25%, 50%, 75%, 100% nutrition concentration of SOT medium) (Figure 2D). By analyzing the intergroup DEGs of the S. platensis comparison groups (S2 vs. S3, S2 vs. S4, and S2 vs. S5), 62 similar DEGs were discovered (Figure 2E,F). Furthermore, based on the expression levels of the common DEGs, their comparison groups—S2 vs. S3, S2 vs. S4, and S2 vs. S5—were associated with more down-regulated common DEGs than up-regulated common DEGs (Figure 2E,F).

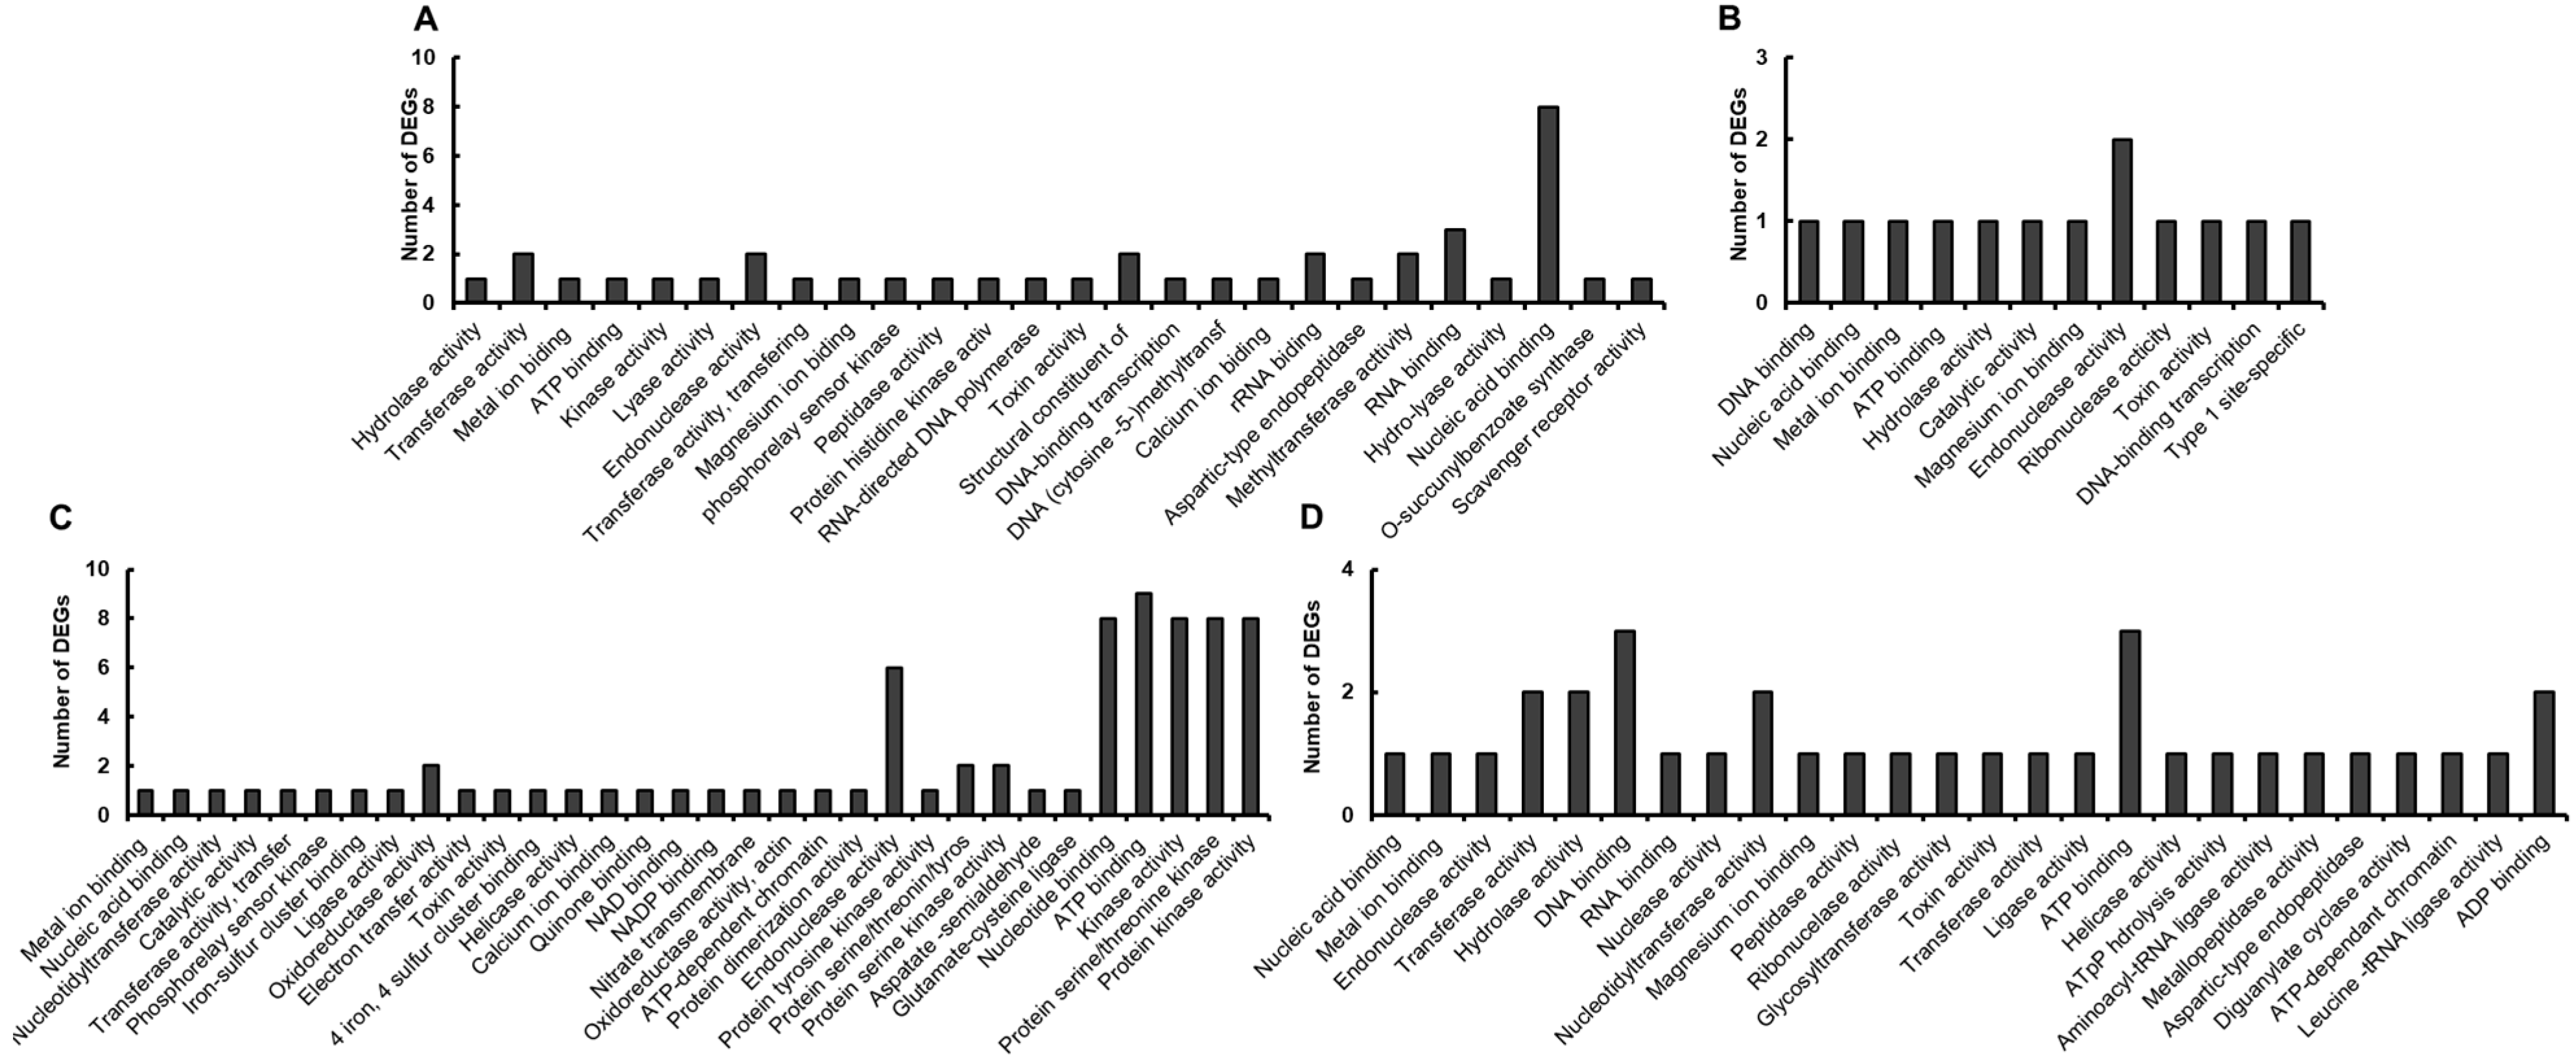
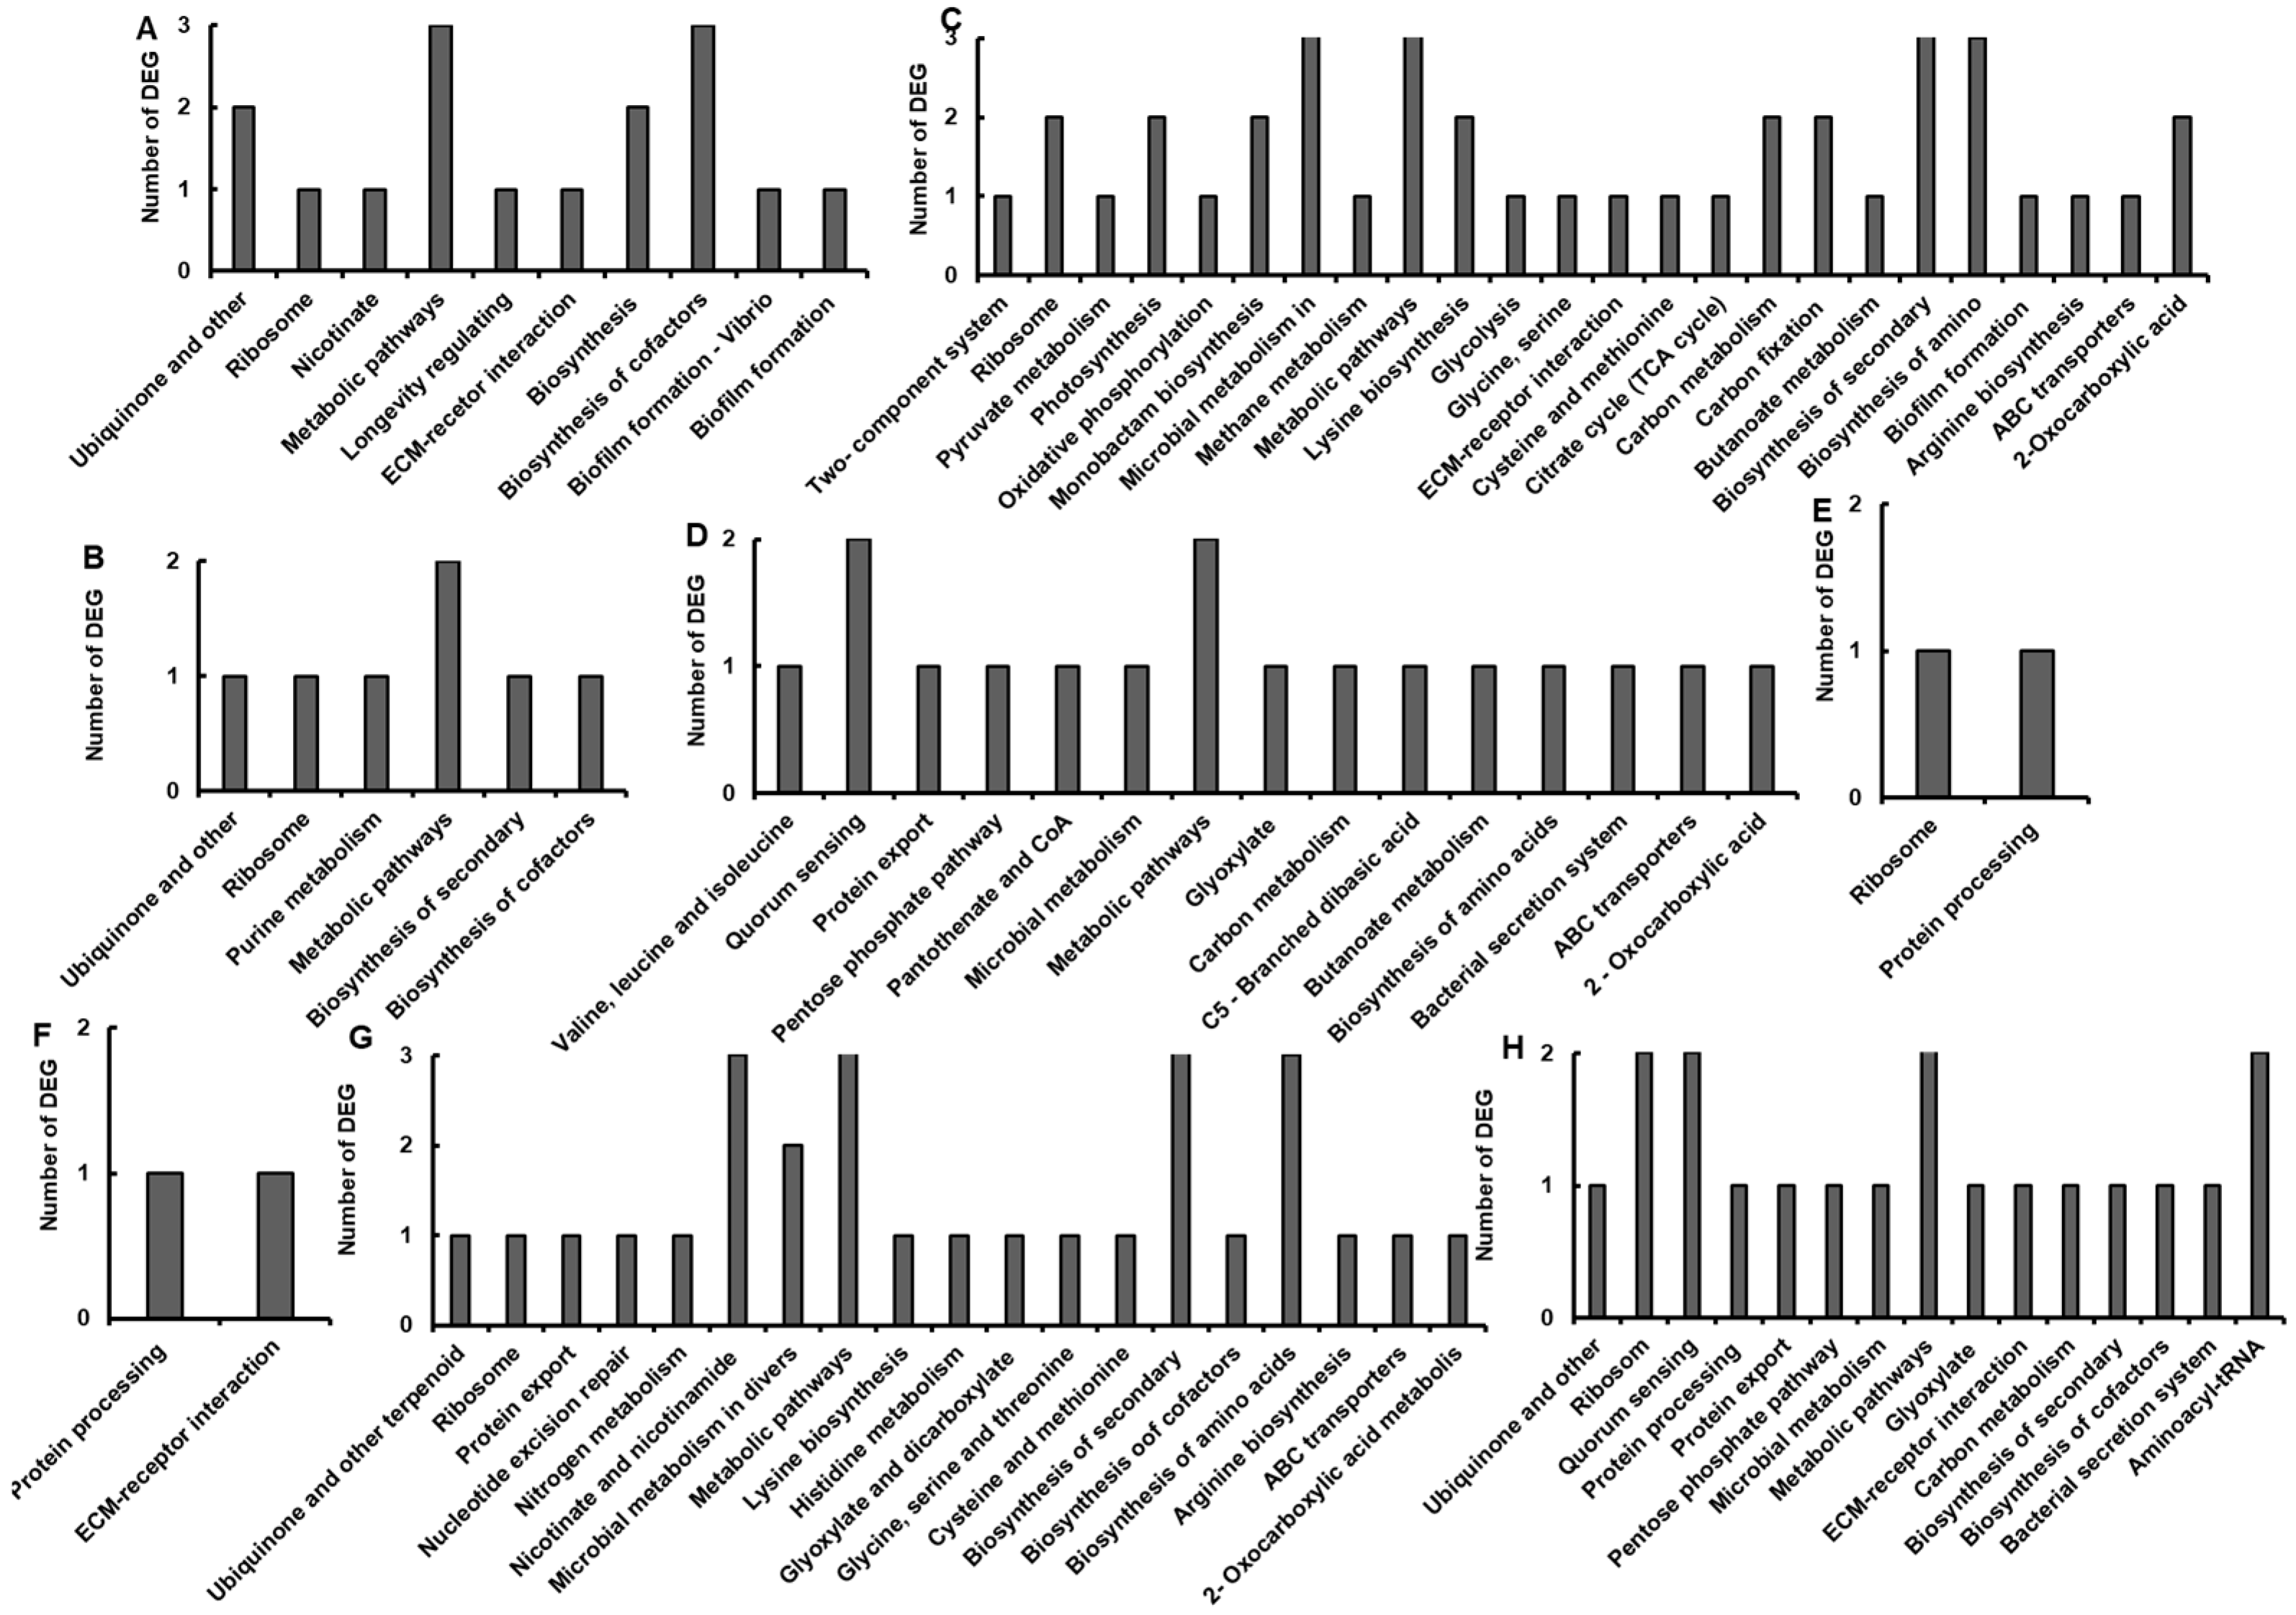
3.3. GO and KEGG Analysis of DEGs

The DEGs in the S. platensis ST strain cultured in the different formulas were classified into various functions and pathways based on their GO terms and KEGG scores. In addition, three categorization criteria in which the DEGs participated were examined using GO enrichment for the DEGs. The categorization criteria were the cellular component, molecular function, and biological process (Figures S1–S5). The number of DEGs in S1 vs. S5 and S2 vs. S5 were higher than in S1 vs. S2, S2 vs. S3, and S2 vs. S4. The majority of the DEGs were classified as a biological process and molecular function based on the GO classification criteria. Comparing S1 vs. S2, the largest number of DGEs was discovered in the functional group of nucleic acid binding. The functional group of nucleic acid binding is involved in the nucleic acid cycle phosphodiester bond hydrolysis and the structural components of the membrane. In sample S2, eight genes with functional nucleic acid binding were overexpressed (Figure S1 and Figure 3A,B).
When comparing S1 and S5, the DGEs were focused in the functional groups of endonuclease activity, nucleotide binding, ATP binding, kinase activity, serine/threonine-protein kinase, and protein kinase activity. In comparison to S1, the majority of the DGEs in this functional group were overexpressed. The DGE genes associated with ATP binding related genes, hydrolase activity, transferase activity, and DNA binding, on the other hand, were down expressed. Nucleic acid group phosphodiester bond hydrolysis, phosphorylation, and protein phosphorylation are the biological processes that generate the most DGEs (Figure S2 and Figure 3C,D).
When comparing S2 and S3, the functional group comprising DNA binding, transferase activity, and hydrolase activity contained the most DGEs. Most of the DGE genes in these groups exhibited decreased expression in S3. The DGEs are mostly associated with the structural component of the membrane (Figure S3 and Figure 4A,B). Through the comparison of S2 and S4, the DGEs highlighted the functional groups of DNA binding, nucleic acid binding, and the activities of transferase, hydrolase, endonuclease, and glycosyltransferase. The DGEs from the aforementioned groups also showed decreased expression in S4. The types of DGEs that were most frequently discovered were membrane structure and the nucleic acid cycle phosphodiester bond hydrolysis (Figure S4 and Figure 4C,D). When S2 and S5 were compared, the functional groups of DNA binding, nucleic acid binding, transferase activity, and endonuclease activity had the highest number of DGEs. In S5, the expression of DGEs belonging to the hybrid endonuclease activity group increased, whereas the DNA binding, nucleic acid binding, and transferase activity groups decreased in expression (Figure S5 and Figure 4E,F). The outcomes of this study were consistent with the gene ontology outcomes from the past study by Kumaresan et al. [54], which found that sulphate deprivation profoundly changed a number of protein-related functions, including translation, amino acid biosynthesis, protein folding, ribosomes, DNA and RNA binding, glucose metabolism, signal transduction, metal-ion binding, and DNA repair.
Additionally, there are 1790 genes with KEGG ID codes, or 29.3% of the total 6108 annotated genes in the S. platensis transcriptomes. Figure 5 shows the gene DGEs implicated in the KEGG pathway. The comparison group S2 vs. S5 had the greatest DEG expression level, followed by S1 vs. S5 and S1 vs. S2. The comparison of the S2 vs. S3 and S2 vs. S4 groups revealed the lowest DEG expression levels (Figure 5). These findings were consistent with the GO term analysis.
The KEGG pathway comparison between the S1 and S2 cultures revealed that the DEGs were mapped to 11 different pathways of the ubiquinone and other terpenoid-quinone biosynthesis, ribosome, purine metabolism, nicotinate and nicotinamide metabolism, metabolic pathways, longevity regulating pathway, extracellular matrix (ECM)–receptor interaction, secondary metabolism biosynthesis, cofactor biosynthesis, biofilm formation (Vibrio cholera and Escherichia coli) (Figure 5A). By comparing S1 vs. S2, up-regulated DEGs were found in 10 out of the 11 KEGG pathways, except for purine metabolism (Figure 6A). Nevertheless, the expression trend of the DEGs encoding ubiquinone and other terpenoid-quinone biosynthesis, ribosome, purine metabolism, metabolic pathway, biosynthesis of secondary metabolism, and biosynthesis of cofactor were down-regulated (Figure 6B). These findings were in line with the studies on the physiological characteristics, which showed that the use of a nutrient-starved culture medium maintained the growth of S. platensis ST under high salinity (42‰) (Figure 1A–D).
Furthermore, when S5 and S1 were compared, the DEGs were assigned to 32 distinct pathways (Figure 5B), in which 48 DEGs were down-regulated and 18 DEGs were up-regulated (Figure 6C,D). The up- and down-regulated DEGs involved in the two-component system which were ribosome, pyruvate metabolism, photosynthesis, oxidative phosphorylation, monobactam biosynthesis, microbial metabolism, methane metabolism, lysine biosynthesis, glycolysis/glucogenesis, glycine, serine and threonine metabolism, ECM–receptor interaction, cysteine and methionine metabolism, citrate cycle (TCA cycle), carbon metabolism, carbon fixation pathways in photosynthetic organisms, butanoate metabolism, biosynthesis of secondary metabolism, biosynthesis of amino acids, biofilm formation (Pseudomonas), arginine biosynthesis, ATP-binding cassette (ABC) transporters, and the 2-oxocarboxylic acid pathway (Figure 6C,D). The obtained results supported the hypothesis that the culture media (with a salinity of 30‰) can damage the reaction center of photosystem II, affecting the growth of S. platensis ST (Figure 1C,D).
When compared to S1, S3 and S4 had an impact on the 2 KEGG pathways (Figure 5C,D and Figure 6E,F). In contrast, the comparison of the KEGG pathways between the S2 and S5 cultures revealed that the DEGs corresponded to 25 different pathways (Figure 5E). Among these, the condition of high nutrients in the culture promoted numerous protein-related functions, such as ubiquinone and other terpenoid-quinone biosynthesis, ribosome, protein export, nucleotide excision repair, nitrogen metabolism, microbial metabolism, metabolic pathway, lysine biosynthesis, histidine metabolism, glycine, serine and threonine metabolism, biosynthesis of secondary metabolism, biosynthesis of cofactor, biosynthesis of amino acids, arginine biosynthesis, ABC transporters, and the 2-oxocarboxylic acid pathway (Figure 5E and Figure 6G,H).
In summary, the findings in this study revealed that the response of the S. platensis ST strain to salt stress was mainly achieved by regulating the gene expression involved in the metabolic pathways. In contrast, the S. platensis ST strain responded to nutrient stress by regulating the gene expression involved in the synthesis of vital molecules such as the growth regulator and ATP producer involved in cell growth and protein synthesis. Key biological pathways involved in photosynthesis, signal transduction, several metabolic pathways, and a decrease in cell growth and protein were triggered in S. platensis in response to both salt and nutrient stress.

4. Conclusions

In this study, a 25% nutritional concentration of SOT medium (S2 formula, 42‰ salinity) was best suited for the growth of the S. platensis ST strain compared to the other medium formula, such as S3 (50% nutritional concentration of SOT medium formula, 45‰ salinity), S4 (75% nutritional concentration of SOT medium, 48‰ salinity), and S5 (100% nutritional concentration of SOT medium, 52‰ salinity). After 15 days of culture in this S2 condition, the growth rates and protein, carbohydrate, lipid, phycocyanin, chlorophyll a, and carotenoid contents of the S. platensis ST were substantially identical to S. platensis ST grown in fresh water. Based on the transcriptome analyses of the S. platensis ST that was cultivated in various culture mediums, molecular investigations on the salinity and nutritional stress revealed that photosynthesis, signal transduction, and other metabolic pathways were actively involved under salt stress. However, in response to both salt and nutritional stress, the synthesis of important molecules such as growth regulators, ATP producers, cell growth, and the protein content was implicated. In summary, our research provides insight into improving the cultivation of S. platensis and other salt-tolerant microalgae strains in salinity intrusion zones in Vietnam.

Supplementary Materials

The following supporting information can be downloaded at: https://www.mdpi.com/article/10.3390/su151511906/s1.

Author Contributions

Conceptualization, D.D.H.; methodology, D.D.H. and H.T.M.H.; software, N.C. and L.T.T.; validation, N.C.H., L.A.H. and N.T.H.T.; investigation, L.T.T., N.C.H. and N.C.; resources, D.D.H.; writing original draft preparation, D.D.H., H.T.M.H., L.T.T., N.C.H., L.A.H. and N.T.H.T.; writing review and editing, D.D.H., P.L.S. and D.Y.Y.T. All authors have read and agreed to the published version of the manuscript.

Funding

This research was funded by the title Senior Researcher, code NVCC08.04/22-23 (Prof. Dr. Dr. Dang Diem Hong).

Institutional Review Board Statement

Not applicable for studies not involving humans or animals.

Informed Consent Statement

Not applicable.

Data Availability Statement

Data available on request from the authors.

Conflicts of Interest

The authors declare no conflict of interest.

References

  1. Nhung, T.T.; Vo, P.L.; Nghi, V.V.; Bang, H.Q. Salt intrusion adaptation measures for sustainable agricultural development under climate change effects: A case of Ca Mau Peninsula, Vietnam. Clim. Risk Manag. 2019, 23, 88–100. [Google Scholar] [CrossRef]
  2. Toan, T.L.; Huu, N.; Simioni, M.; Phan, H.; Arai, H.; Mermoz, S.; Bouvet, A.; de Eccher, I.; Diallo, Y.; Duong, T.H.; et al. Agriculture in Viet Nam under the impact of climate change. In Climate Change in Vietnam. Impacts and Adaptation; A COP26 Assessment Report of the GEMMES Viet Nam Project; HAL: Glasgow, UK, 2021; Available online: https://hal.inrae.fr/hal-03456472/document (accessed on 30 July 2023).
  3. Karkos, P.D.; Leong, S.C.; Karkos, C.D.; Sivaji, N.; Assimakopoulos, D.A. Spirulina in Clinical Practice: Evidence-Based Human Applications. Evid. Based Complement. Altern. Med. 2011, 2011, 531053. [Google Scholar] [CrossRef] [PubMed] [Green Version]
  4. Brito, A.d.F.; Silva, A.S.; de Oliveira, C.V.; de Souza, A.A.; Ferreira, P.B.; de Souza, I.L.; da Cunha, A.L.C.; da Silva, F.G.; de Souza, S.R.; Tavares, R.L.; et al. Spirulina platensis prevents oxidative stress and inflammation promoted by strength training in rats: Dose-response relation study. Sci. Rep. 2020, 10, 6382. [Google Scholar] [CrossRef] [PubMed] [Green Version]
  5. Ai, X.; Yu, P.; Li, X.; Lai, X.; Yang, X.; Yang, M.; Liu, F.; Luan, F.; Meng, X. Polysaccharides from Spirulina platensis: Extraction methods, structural features and bioactivities diversity. Int. J. Biol. Macromol. 2023, 231, 123211. [Google Scholar] [CrossRef]
  6. Lafarga, T.; Fernández-Sevilla, J.M.; González-López, C.; Acién-Fernández, F.G. Spirulina for the food and functional food industries. Food Res. Int. 2020, 137, 109356. [Google Scholar] [CrossRef]
  7. Liu, Q.; Huang, Y.; Zhang, R.; Cai, T.; Cai, Y. Medical Application of Spirulina platensis Derived C-Phycocyanin. Evid. Based Complement. Altern. Med. 2016, 2016, 7803846. [Google Scholar]
  8. Jung, F.; Krüger-Genge, A.; Waldeck, P.; Küpper, J.H. Spirulina platensis, a super food? J. Cell. Biotechnol. 2019, 5, 43–54. [Google Scholar] [CrossRef]
  9. Wang, F.; Yu, X.; Cui, Y.; Xu, L.; Huo, S.; Ding, Z.; Hu, Q.; Xie, W.; Xiao, H.; Zhang, D. Efficient extraction of phycobiliproteins from dry biomass of Spirulina platensis using sodium chloride as extraction enhancer. Food Chem. 2023, 406, 135005. [Google Scholar] [CrossRef]
  10. Salama, A.F.; Abdel-Hamid, N.M.; El-sheekh, M.; Tosson, E.; Gabr, A.M. Spirulina platensis microalgae protects against diethyl nitrosamine carcinogenic effect on female albino rats. Alex. J. Vet. Sci. 2017, 53, 167–179. [Google Scholar] [CrossRef]
  11. Tredici, M.R. Mass Production of Microalgae: Photobioreactors. In Handbook of Microalgal Culture; Wiley-Blackwell: Hoboken, NJ, USA, 2003; pp. 178–214. [Google Scholar]
  12. Moisander, P.H.; McClinton Lii, E.; Paerl, H.W. Salinity Effects on Growth, Photosynthetic Parameters, and Nitrogenase Activity in Estuarine Planktonic Cyanobacteria. Microb. Ecol. 2002, 43, 432–442. [Google Scholar] [CrossRef]
  13. Mary Leema, J.T.; Kirubagaran, R.; Vinithkumar, N.V.; Dheenan, P.S.; Karthikayulu, S. High value pigment production from Arthrospira (Spirulina) platensis cultured in seawater. Bioresour. Technol. 2010, 101, 9221–9227. [Google Scholar] [CrossRef] [PubMed]
  14. Ciferri, O. Spirulina, the edible microorganism. Microbiol. Rev. 1983, 47, 551–578. [Google Scholar] [CrossRef]
  15. Al Mahrouqi, H.; Naqqiuddin, M.A.; Achankunju, J.; Omar, H.; Ismail, A. Different salinity effects on the mass cultivation of Spirulina (Arthrospira platensis) under sheltered outdoor conditions in Oman and Malaysia. J. Algal. Biomass. Util. 2015, 6, 1–14. [Google Scholar]
  16. Li, Q.; Chang, R.; Sun, Y.; Li, B. iTRAQ-Based Quantitative Proteomic Analysis of Spirulina platensis in Response to Low Temperature Stress. PLoS ONE 2018, 13, e0196442. [Google Scholar] [CrossRef] [PubMed]
  17. Zhao, X.; Wang, X.; Ki, F.; Dahlgen, R.; Wang, H. Identification of microRNA-size sRNAs Related to Salt Tolerance in Spirulina platensis. Plant Mol. Biol. Rep. 2016, 34, 539–555. [Google Scholar] [CrossRef]
  18. Shalaby, E.A.; Shanab, S.M.M.; Singh, V. Salt stress enhancement of antioxidant and antiviral efficiency of Spirulina platensis. J. Med. Plants Res. 2010, 4, 2622–2632. [Google Scholar]
  19. Sandeep, K.P.; Shukla, S.P.; Harikrishna, V.; Muralidhar, A.P.; Vennila, A.; Purushothaman, C.S.; Kumar, R.R. Utilization of inland saline water for Spirulina cultivation. J. Water Reuse Desalination 2013, 3, 346–356. [Google Scholar] [CrossRef]
  20. Tam, L.T.; Le, T.T.; Nguyen, C.H.; Hoang, T.M.H.; Ngo, T.H.T.; Dang, D.H. Assessing the salt tolerance of Spirulina platensis freshwater strains and examining cheap culture media for cultivation of the potential strain. Vietnam. J. Biotechnol. 2021, 19, 381–392. [Google Scholar] [CrossRef]
  21. Dang, D.H.; Le, T.T.; Nguyen, C.H.; Le, A.H.; Hoang, T.M.H.; Luu, T.T.; Ngo, T.H.T. Selection of suitable medium for the culture of the salt tolerant Spirulina platensis ST strain under laboratory and pilot conditions. In Proceedings of the National Biotechnology Conference 2022, Dak Lak, Vietnam, 4 November 2022. [Google Scholar]
  22. Zarrouk, C. Contribution à L’éTude D’Une Cyanophycée Influencée de Divers Facteurs Physiques ET Chimiques sur la Croissance ET la Photo-Synthèse de Spirulina Maxima (Setch. ET Gardner) Geitler. Ph.D. Thesis, University of Paris, Paris, France, 1966. [Google Scholar]
  23. Guillard, R.R.L.; Sieracki, M.S. Counting cells in cultures with the light microscope. In Algal Culturing Techniques; Elsevier: Amsterdam, The Netherlands, 2005; pp. 239–252. [Google Scholar]
  24. Dang, D.H. Cultivation of Nutrient-Rich Microalgae for Application as Functional Food for Humans and Domestic Animals in Vietnam; Natural Science and Technology: Hanoi, Vietnam, 2019. [Google Scholar]
  25. Wellburn, A.R.; Lichtenthaler, H. Formulae and program to determine total carotenoids and chlorophylls a and b of leaf extracts in different solvents. In Advances in Photosynthesis Research, Proceedings of the VIth International Congress on Photosynthesis, Brussels, Belgium, 1–6 August 1983; Sybesma, C., Ed.; Springer: Dordrecht, The Netherlands, 1984; pp. 9–12. [Google Scholar]
  26. Hadiyanto, H.; Suttrisnorhadi, S. Response surface optimization of ultrasound assisted extraction (UAE) of phycocyanin from microalgae Spirulina platensis. Emir. J. Food Agric. 2016, 28, 227–234. [Google Scholar] [CrossRef] [Green Version]
  27. Bligh, E.G.; Dyer, W.J. A rapid method of total lipid extraction and purification. Can. J. Biochem. Physiol. 1959, 37, 911–917. [Google Scholar] [CrossRef]
  28. Soni, B.; Kalavadia, B.; Trivedi, U.; Madamwar, D. Extraction, purification and characterization of phycocyanin from Oscillatoria quadripunctulata—Isolated from the rocky shores of Bet-Dwarka, Gujarat, India. Process. Biochem. 2006, 41, 2017–2023. [Google Scholar] [CrossRef]
  29. Bradford, M.M. A rapid and sensitive method for the quantitation of microgram quantities of protein utilizing the principle of protein-dye binding. Anal. Biochem. 1976, 72, 248–254. [Google Scholar] [CrossRef]
  30. Sun, L.; Ren, L.; Zhuang, X.; Ji, X.; Yan, J.; Huang, H. Differential effects of nutrient limitations on biochemical constituents and docosahexaenoic acid production of Schizochytrium sp. Bioresour. Technol. 2014, 159, 199–206. [Google Scholar] [CrossRef] [PubMed]
  31. Tam, L.T.; Ha, N.C.; Thom, L.T.; Zhu, J.; Wakisaka, M.; Hong, D.D. Ferulic acid extracted from rice bran as a growth promoter for the microalga Nannochloropsis oculata. J. Appl. Phycol. 2021, 33, 37–45. [Google Scholar] [CrossRef]
  32. Kitajima, M.; Butler, W.L. Quenching of chlorophyll fluorescence and primary photochemistry in chloroplasts by dibromothymoquinone. Biochim. Biophys. Acta Bioenerg. 1975, 376, 105–115. [Google Scholar] [CrossRef]
  33. Qiu, Z.; Wang, L.; Zhou, Q. Effects of bisphenol A on growth, photosynthesis and chlorophyll fluorescence in above-ground organs of soybean seedlings. Chemosphere 2013, 90, 1274–1280. [Google Scholar] [CrossRef]
  34. Bolger, A.M.; Lohse, M.; Usadel, B. Trimmomatic: A flexible trimmer for Illumina sequence data. Bioinformatics 2014, 30, 2114–2120. [Google Scholar] [CrossRef] [PubMed] [Green Version]
  35. Dobin, A.; Davis, C.A.; Schlesinger, F.; Drenkow, J.; Zaleski, C.; Jha, S.; Batut, P.; Chaisson, M.; Gingeras, T.R. STAR: Ultrafast universal RNA-seq aligner. Bioinformatics 2013, 29, 15–21. [Google Scholar] [CrossRef]
  36. Anders, S.; Pyl, P.T.; Huber, W. HTSeq—A Python framework to work with high-throughput sequencing data. Bioinformatics 2015, 31, 166–169. [Google Scholar] [CrossRef] [PubMed] [Green Version]
  37. Robinson, M.D.; McCarthy, D.J.; Smyth, G.K. edgeR: A Bioconductor package for differential expression analysis of digital gene expression data. Bioinformatics 2010, 26, 139–140. [Google Scholar] [CrossRef] [Green Version]
  38. Young, M.D.; Wakefield, M.J.; Smyth, G.K.; Oshlack, A. Gene ontology analysis for RNA-seq: Accounting for selection bias. Genome Biol. 2010, 11, R14. [Google Scholar] [CrossRef] [Green Version]
  39. Moriya, Y.; Itoh, M.; Okuda, S.; Yoshizawa, A.C.; Kanehisa, M. KAAS: An automatic genome annotation and pathway reconstruction server. Nucleic Acids Res. 2007, 35, W182–W185. [Google Scholar] [CrossRef] [Green Version]
  40. Kanehisa, M.; Sato, Y. KEGG Mapper for inferring cellular functions from protein sequences. Protein Sci. 2020, 29, 28–35. [Google Scholar] [CrossRef] [Green Version]
  41. Kanehisa, M.; Goto, S.; Kawashima, S.; Okuno, Y.; Hattori, M. The KEGG resource for deciphering the genome. Nucleic Acids Res. 2004, 32, D277–D280. [Google Scholar] [CrossRef] [PubMed] [Green Version]
  42. Chen, W.; Chen, Y.H.; Liao, Y.C.; Huang, X.W.; Lu, T.J. Effect of hot water extracts of Arthrospira maxima (Spirulina) against respiratory syncytial virus. Phytomedicine 2023, 110, 154611. [Google Scholar] [CrossRef]
  43. Gagneux-Moreaux, S.; Moreau, C.; Gonzalez, J.L.; Cosson, R.P. Diatom artificial medium (DAM): A new artificial medium for the diatom Haslea ostrearia and other marine microalgae. J. Appl. Phycol. 2007, 19, 549–556. [Google Scholar] [CrossRef] [Green Version]
  44. Vonshak, A.; Guy, R.; Guy, M. The response of the filamentous cyanobacterium Spirulina platensis to salt stress. Arch. Microbiol. 1988, 150, 417–420. [Google Scholar] [CrossRef]
  45. Bolsunovskii, A.Y.; Kosinenko, S.V. Intracellular phosphorus pool of the cyanobacterium Spirulina platensis. Microbiology 2000, 69, 116–118. [Google Scholar] [CrossRef]
  46. Moussa, H.R.; Hassan, M.A.E.F. Growth Enhancers to Mitigate Salinity Stress in Vicia faba. Int. J. Veg. Sci. 2016, 22, 243–250. [Google Scholar] [CrossRef]
  47. Tester, M.; Davenport, R. Na+ Tolerance and Na+ Transport in Higher Plants. Ann. Bot. 2003, 91, 503–527. [Google Scholar] [CrossRef]
  48. Bezerra, P.Q.M.; Moraes, L.; Cardoso, L.G.; Druzian, J.I.; Morais, M.G.; Nunes, I.L.; Costa, J.A.V. Spirulina sp. LEB 18 cultivation in seawater and reduced nutrients: Bioprocess strategy for increasing carbohydrates in biomass. Bioresour. Technol. 2020, 316, 123883. [Google Scholar] [CrossRef]
  49. Sili, C.; Torzillo, G.; Vonshak, A. Arthrospira (Spirulina). In Ecology of Cyanobacteria II: Their Diversity in Space and Time; Whitton, B.A., Ed.; Springer: Dordrecht, The Netherlands, 2012; pp. 677–705. [Google Scholar]
  50. Ravelonandro, P.H.; Ratianarivo, D.H.; Joannis-Cassan, C.; Isambertc, A.; Raherimandimby, M. Improvement of the growth of Arthrospira (Spirulina) platensis from Toliara (Madagascar): Effect of agitation, salinity and CO2 addition. Food Bioprod. Process. 2011, 89, 209–216. [Google Scholar] [CrossRef] [Green Version]
  51. Blumwald, E.; Tel-Or, E. Salt Adaptation of the Cyanobacterium Synechococcus 6311 Growing in a Continuous Culture (Turbidostat). Plant Physiol. 1984, 74, 183–185. [Google Scholar] [CrossRef] [PubMed] [Green Version]
  52. Lu, C.; Vonshak, A. Effects of salinity stress on photosystem II function in cyanobacterial Spirulina platensis cells. Physiol. Plant 2002, 114, 405–413. [Google Scholar] [CrossRef] [PubMed] [Green Version]
  53. Cheevadhanarak, S.; Paithoonrangsarid, K.; Prommeenate, P.; Kaewngam, W.; Musigkain, A.; Tragoonrung, S.; Tabata, S.; Kaneko, T.; Chaijaruwanich, J.; Sangsrakru, D.; et al. Draft genome sequence of Arthrospira platensis C1 (PCC9438). Stand. Genomic Sci. 2012, 6, 43–53. [Google Scholar] [CrossRef] [PubMed] [Green Version]
  54. Kumaresan, V.; Nizama, F.; Ravichandran, G.; Viswanathan, K.; Palanisamy, R.; Bhatt, P.; Arasu, M.V.; Al-Dhabi, N.A.; Mala, K.; Arockiaraj, J. Transcriptome changes of blue-green algae, Arthrospira sp. in response to sulfate stress. Algal Res. 2017, 23, 96–103. [Google Scholar] [CrossRef]
Figure 1. The growth and change of photosynthetic parameters of S. platensis ST strain in SOT media with the salinity from 13 to 52‰ and different nutrition concentrations after 15 days of cultivation. The growth was expressed by OD 556 nm (A); Specific growth rate (B); Fv/Fm (C); Effective photonic efficiency of photosystem II (D); Electron transport rate (E); Illustration of the growth in different experimental formulas (F). The letters a, b, c, d at the same time were indicated statistically significant difference (p < 0.05). Notices: S1 formula—control—SOT medium containing salinity of 13‰; S2 formula—25% SOT medium containing salinity of 42‰; S3 formula—50% SOT medium containing salinity of 45‰; S4 formula—75% SOT medium containing salinity of 48‰; S5 formula—100% SOT medium containing salinity of 52‰.
Sustainability 15 11906 g001
Figure 2. The number of differentially expressed genes (DEGs) in S. platensis ST strain under different salinity and nutritional state. (A) Red is Up; Cyan: Down regulation. DEGs comparison between S1 vs. S2 and between S1 vs. S5. (B) Venn diagram of DEGs up-regulated among the 2 comparison groups: S1 vs. S2 and S1 vs. S5. (C) Venn diagram of DEGs down-regulated among the 2 comparison groups: S1 vs. S2 and S1 vs. S5. (D) Red is Up; Cyan: Down regulation. DEGs comparison between S2 vs. S3, S2 vs. S4, and S2 vs. S5. (E) Venn diagram of DEGs up-regulated among the 3 comparison groups: S2 vs. S3, S2 vs. S4, and S2 vs. S5. (F) Venn diagram of DEGs down-regulated among the 3 comparison groups: S2 vs. S3, S2 vs. S4, and S2 vs. S5. Notices: S1—control formula—SOT medium containing salinity of 13‰; S2 formula—25% SOT medium containing salinity of 42‰; S3 formula—50% SOT medium containing salinity of 45‰; S4 formula—75% SOT medium containing of 48%; S5 formula—100% SOT medium containing salinity of 52‰.
Sustainability 15 11906 g002
Figure 3. Functional categories of differently expressed genes in S. platensis grown in S1, S2 and S5 formulas classified by GO database. (A): S1 in comparison to S2, functional categories of down-regulated genes in S. platensis. (B): S1 in comparison to S2, functional categories of up-regulated genes in S. platensis. (C): S1 in comparison to S5, functional categories of down-regulated genes in S. platensis. (D): S1 in comparison to S5, functional categories of up-regulated genes in S. platensis. Notices: S1—control formula—SOT medium containing salinity of 13‰; S2 formula—25% SOT medium containing salinity of 42‰; S5 formula—100% SOT medium containing salinity of 52‰.
Sustainability 15 11906 g003
Figure 4. Functional categories of differently expressed genes in S. platensis ST strain grown in S2, S3, S4 and S5 formulas conditions classified by GO database. (A): S2 in comparison to S3, functional categories of down-regulated genes in S. platensis. (B): S2 in comparison to S3, functional categories of up-regulated genes in S. platensis. (C): S2 in comparison to S4, functional categories of down-regulated genes in S. platensis. (D): S2 in comparison to S4, functional categories of up-regulated genes in S. platensis. (E): S2 in comparison to S5, functional categories of down-regulated genes in S. platensis. (F): S2 in comparison to S5, functional categories of up-regulated genes in S. platensis. Notices: S2 formula—25% SOT medium containing salinity of 42‰; S3 formula—50% SOT medium containing salinity of 45‰; S4 formula—75% SOT medium containing salinity of 48‰; S5 formula—100% SOT medium containing salinity of 52‰.
Sustainability 15 11906 g004
Figure 5. Functional categories of differently expressed genes in S. platensis ST strain grown in comparative analysis of KEGG pathways between S1 and S2 (A); S1 and S5 (B); S2 and S3 (C); S2 and S4 (D); S2 and S5 cultures (E). Notices: S1 formula—control formula—SOT medium containing salinity of 13‰; S2 formula—25% SOT medium containing salinity of 42‰; S3 formula—50% SOT medium containing salinity of 45‰; S4 formula—75% SOT medium containing salinity of 48‰; S5 formula—100% SOT medium containing salinity of 52‰.
Sustainability 15 11906 g005
Figure 6. Functional categories of differently expressed genes in S. platensis ST strain grown in different culture conditions classified by KEGG. (A): S1 in comparison to S2, functional categories of significantly up-regulated genes in S. platensis; (B): S1 in comparison to S2, number of down-regulated genes in KEGG database; (C): S1 in comparison to S5, functional categories of significantly up-regulated genes in S. platensis; (D): S1 in comparison to S5 in comparison to high salinity and nutritional state, number of down-regulated genes in KEGG database; (E): S2 in comparison to S3, functional categories of significantly down-regulated genes in S. platensis; (F): S2 in comparison to S3, number of down-regulated genes in KEGG database; (G): S2 in comparison to S5, functional categories of significantly up-regulated genes in S. platensis; (H): S2 in comparison to S5, number of down-regulated genes in KEGG database; Notices: S1 formula—control formula—SOT medium containing salinity of 13‰; S2 formula—25% SOT medium containing salinity of 42‰; S3 formula—50% SOT medium containing salinity of 45‰; S4 formula—75% SOT medium containing salinity of 48‰; S5 formula—100% SOT medium containing salinity of 52‰.
Sustainability 15 11906 g006
Table 1. Nutritional concentration of different SOT media used for the experiment.
Nutrition
Composition (g/L)
SOT Medium
100%
(S1)
25%
(S2)
50%
(S3)
75%
(S4)
100%
(S5)
Distilled water (L)1.0000000
Seawater 30‰ (L)01.0001.0001.0001.000
NaHCO316.8004.2008.40012.60016.800
K2HPO4·3H2O0.6550.1640.3280.4930.655
NaNO32.5000.6251.2501.8752.500
K2SO41.0000.2500.5000.7501.000
NaCl1.0000.2500.5000.7501.000
MgSO4·7H2O0.2000.0500.1000.1500.200
CaCl2·2H2O0.0400.0100.0200.0300.040
FeSO4·7H2O0.0100.00250.0050.00750.010
Na2EDTA0.0800.0200.0400.0600.080
A5 (mL)1.0000.2500.5000.7501.000
Final salinity (‰)1342454852
Table 2. Protein, carbohydrate, lipid, and pigment (chlorophyll, phycocyanin and carotenoid) contents of S. platensis ST strain biomass in SOT medium with different salinity concentrations and nutrition concentrations.
Parameters
(SOT Medium)
Protein
(% DCW)
Carbohydrate (% DCW)Lipid
(% DCW)
Phycocyanin (% DCW)Chlorophyll a (%DCW)Carotenoid (%DCW)
13‰ salinityS157.75 ± 0.1021.63 ± 0.466.81 ± 0.4010.90 ± 2.370.59 ± 0.040.23 ± 0.00
42‰ salinityS248.73 ± 0.8122.14 ± 0.117.32 ± 0.6110.23 ± 0.250.53 ± 0.040.12 ± 0.01
45‰ salinityS347.17 ± 0.0218.22 ± 0.158.70 ± 0.2510.17 ± 0.810.56 ± 0.060.21 ± 0.00
48‰ salinityS441.16 ± 0.0617.47 ± 0.1811.14 ± 0.3311.18 ± 0.250.58 ± 0.050.30 ± 0.04
52‰ salinityS538.94 ± 0.2916.55 ± 0.3810.35 ± 0.555.90 ± 0.370.32 ± 0.030.18 ± 0.04
Note: DCW: dry cell weight; S1 formula—control—SOT containing salinity of 13‰; S2 formula- 25% SOT medium containing salinity of 42‰; S3 formula- 50% SOT medium containing salinity of 45‰; S4 formula- 75% SOT medium containing salinity of 48‰; S5 formula—100% SOT medium containing salinity of 52‰.
Table 3. Statistic results of transcriptome sequencing in S. platensis ST strain under different salinity and nutritional concentration.
SampleTotal ReadsTotal BasesMapped ReadsUniq Mapped ReadsMultiple Map ReadsGC (%)Q30 (%)
S118,240,1041,842,250,504 4,279,358 (23.46%)3,770,540 (20.67%)508,818 (2.79%)45.5093.40
S218,163,0701,834,470,070 6,616,267 (36.43%)4,962,102 (27.32%)1,654,165 (9.11%)45.0094.10
S318,187,0251,836,889,525 5,681,799 (31.24%)4,906,667 (26.98%)775,132 (4.26%)45.0093.10
S418,241,5871,842,400,287 6,485,723 (35.56%)5,707,645 (31.29%)778,078 (4.27%)46.8093.70
S518,313,6241,849,676,024 2,806,231 (15.33%)2,414,712 (13.19%)391,519 (2.14%)47.3093.30
Total91,145,4109,205,686,41025,869,37821,761,6664,107,712
Note: DCW: dry cell weight; S1 formula—control—SOT containing salinity of 13‰; S2 formula- 25% SOT medium containing salinity of 42‰; S3 formula- 50% SOT medium containing salinity of 45‰; S4 formula- 75% SOT medium containing salinity of 48‰; S5 formula—100% SOT medium containing salinity of 52‰.
Table 4. Statistic of protein-coding genes and transcripts in S. platensis ST strain under different salinity and nutritional concentration.
Sample Total Protein-Coding GenesNumber of
Transcripts
Average Number of Transcripts per GenesLowest Transcript CountHighest Transcript Count
S157172,752,90248218664
S257573,720,16064618286
S357413,554,50261917068
S457374,225,42573718835
S556921,767,35931014775
Note: DCW: dry cell weight; S1 formula—control—SOT containing salinity of 13‰; S2 formula- 25% SOT medium containing salinity of 42‰; S3 formula- 50% SOT medium containing salinity of 45‰; S4 formula- 75% SOT medium containing salinity of 48‰; S5 formula—100% SOT medium containing salinity of 52‰.
Disclaimer/Publisher’s Note: The statements, opinions and data contained in all publications are solely those of the individual author(s) and contributor(s) and not of MDPI and/or the editor(s). MDPI and/or the editor(s) disclaim responsibility for any injury to people or property resulting from any ideas, methods, instructions or products referred to in the content.

