1. Introduction
Organizations use research and development (R&D) activities to find solutions to the challenges imposed by rapid changes in customer needs and the competitive environment of domestic and international markets [
1,
2]. R&D consumes significant human and technological resources, so it must be managed systematically [
2,
3,
4,
5]. This is a fundamental task for a successful business [
4,
6,
7]. With an increase in R&D expenditure and the need for R&D productivity, performance management of R&D projects becomes increasingly important [
1].
R&D is essential for advancing national competitiveness [
5,
8,
9], prompting many national governments to invest in R&D and introduce R&D programs. According to the Main Science and Technology Indicators provided by the OECD statistical database, Gross Domestic Expenditure on R&D (GERD) in OECD countries has generally been increasing each year. In 2020, the average GERD as a percentage of Gross Domestic Product (GDP) was 2.74%. Israel (5.71%) and South Korea (4.80%) were the first and second largest investors, respectively. Specifically, the average government-financed GERD as a percentage of GDP in 2020 was 0.66%, with South Korea (1.07%) being the top investor. Government-funded R&D activities contribute to technology, economy, and society as a whole [
6,
10]. To fulfill these contributions, most developed countries operate Public Research Institutes (PRIs), which often conduct infrastructure and large-scale studies [
6,
11,
12].
These studies have a long-term nature and are funded by taxes; therefore, it is important to monitor their progress to ensure valuable outcomes [
5]. As a result, some cases monitor R&D performance using process indicators or interim evaluations [
9,
13,
14]. Previous studies on R&D performance monitoring have also presented measurement systems or models with an emphasis on continuous progress checks [
15,
16,
17,
18,
19,
20]. However, if the monitoring intervals are short, the assessment may only detect “no measurable change” and miss latent progress, such as conceptual advances that have not been implemented yet [
7]. The weakness of using process indicators is that they do not measure ultimate results [
8,
21]. Moreover, several well-known methods have limited applicability when monitoring the performance of R&D projects [
6,
9,
22].
Therefore, this paper aims to present a system for monitoring R&D performance to overcome these limitations. After conducting a literature review, we design the system by classifying performance indicators, developing metrics to measure the progress level of each indicator, and suggesting ways to prioritize them. Subsequently, we conducted a case study to demonstrate its application, develop an information system, and discuss the practical results and contributions.
3. Proposal of Performance Monitoring System
3.1. Classification of Performance Indicators
The progress rate is commonly calculated using the formula (100 × (Output−baseline)/(Target−baseline)), where the baseline represents the starting point of performance monitoring before any progress has been made. However, if the frequency of actually produced outputs for an indicator is low during the research process, the progress rate calculated using this formula can only account for outwardly visible progress and fails to quantify latent progress. The uniform calculation using this formula cannot solve this problem, and typical classification systems of performance indicators [
46] are inadequate for addressing it. Therefore, we need to establish classification criteria and a system to address these issues.
The first criterion is the feasibility of measuring progress at a desired time. This criterion answers the following question: Can progress on the indicator be measured at any time? The feasibility of measuring progress depends on factors such as the availability of immediate progress data and the ease of objectively assessing the indicator. The R&D manager makes a decision based on the characteristics of the indicator. If the answer is “Feasible”, it means that the R&D manager can measure the produced output at any time. If the answer is “Infeasible”, it implies that measuring progress at a given time is impossible, difficult to objectively assess, or requires excessive resources. For example, the indicator “Number of academic papers published” is feasible as it can be counted at any time. However, the indicator “Level of customer satisfaction” based on an external survey is not feasible during the progress-check period because it requires surveying products that have not yet been completed, and obtaining results would require additional time and cost.
The second criterion is the frequency at which output is produced during the progress-check period. When an indicator has a small target value, a short progress-check interval may result in a report of “no progress” [
7]. However, it is possible that progress is being made invisibly by the R&D performers, even if there is no visible output. Therefore, the second criterion answers the following question: Does the output of the indicator occur frequently? To determine the answer, we perform the following calculations. We define the “
expected output per check” of an indicator as the target value of the indicator divided by the total number of progress checks during the monitoring period. We also define the “
unit of measure” of an indicator as the minimum amount of changed output. If the
expected output per check is larger than the
unit of measure, then the indicator is classified as “Frequent.” If it is smaller, then it is classified as “Infrequent”. For example, let us consider the indicator “Number of academic papers published” with an annual target value of 20 and a progress-check interval of every month (total number of checks is 12). In this case, the
unit of measure is 1 because the number of papers increases by 1 as a natural number. The
expected output per check is 20/12 = 1.67. Since the
expected output per check is larger than the
unit of measure, the frequency of produced output is classified as “Frequent”. This classification suggests that a paper may have been published within one performance-check interval.
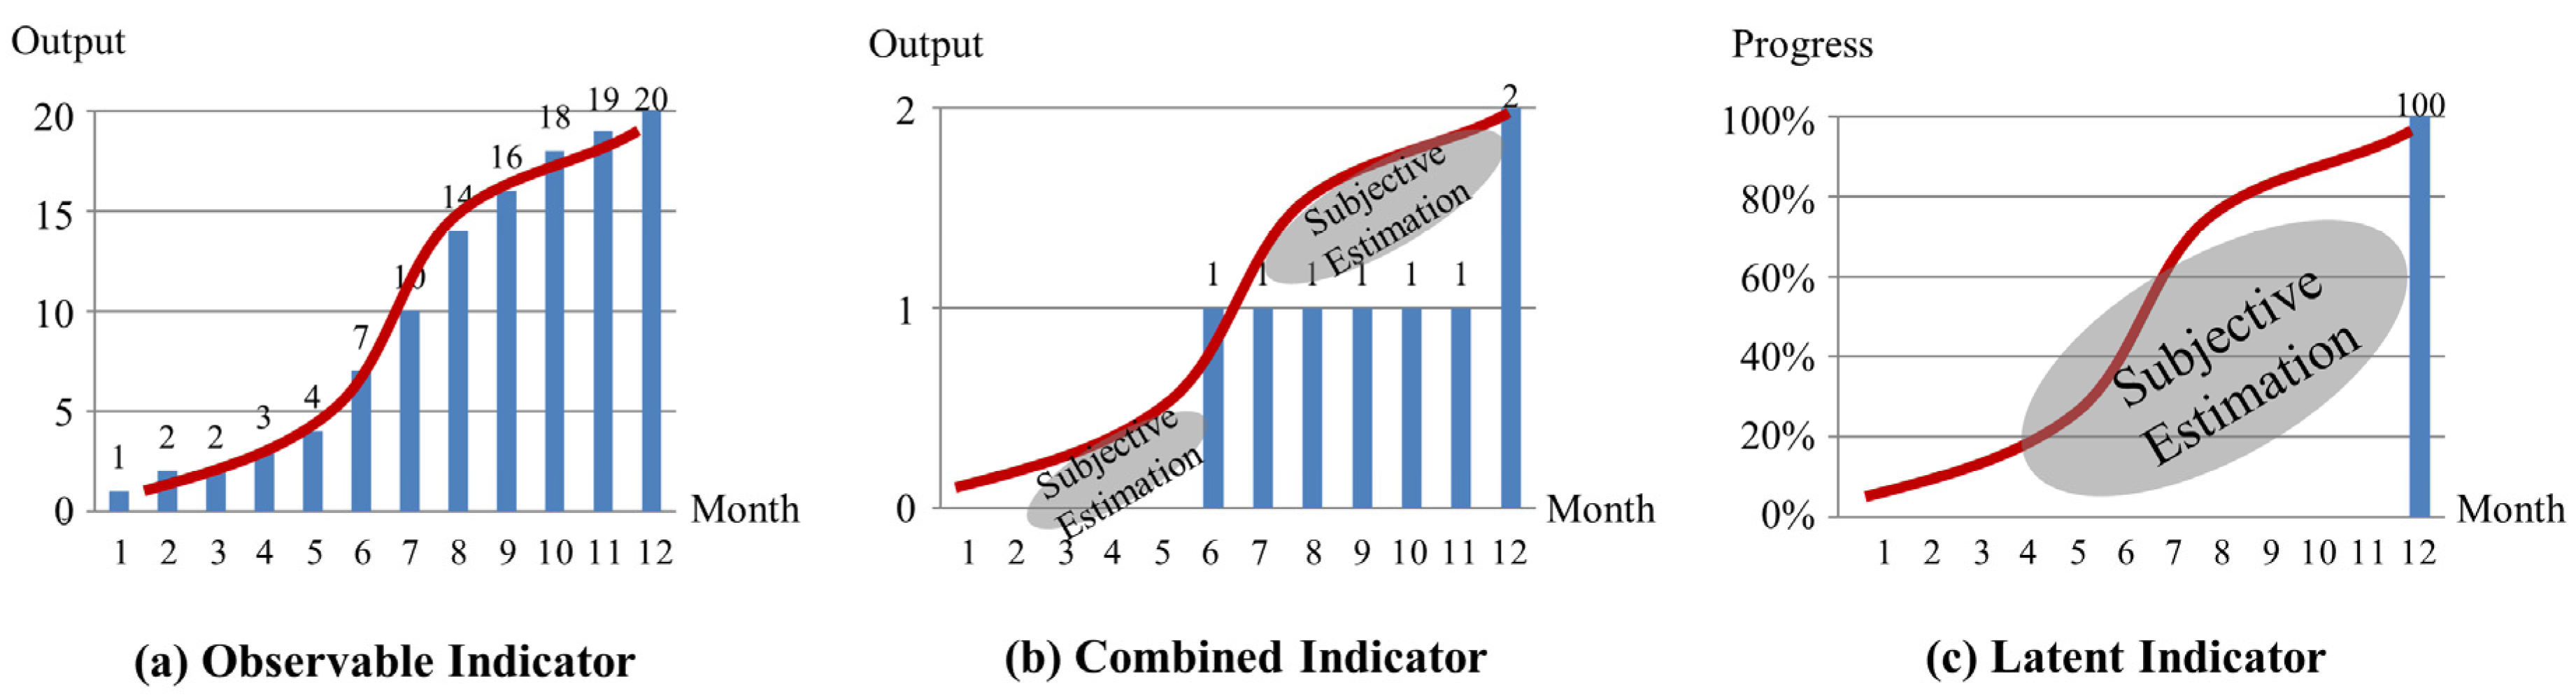
These criteria divide the performance indicators into three categories (
Table 1,
Figure 1): Observable Indicator (
IndicatorOb), Latent Indicator (
IndicatorLt), and Combined Indicator (
IndicatorCo).
IndicatorOb is more likely to show output for most progress checks. For this indicator, progress can be measured using actual output data.
IndicatorCo is less likely to show output for most progress checks. To measure progress for this indicator, actual output data should be taken into account, considering the potential for latent progress that may not be immediately visible.
IndicatorLt is infeasible to measure progress during the progress-check period. This indicator represents latent progress that cannot be objectively measured at a given time. Progress for these indicators is measured subjectively, taking into consideration the potential for latent progress.
3.2. Metric to Measure Progress Rate of Indicators
In this study, we utilized the indicator classification to develop metrics (
Table 1) that represent the progress of each indicator. These metrics allow us to identify the Degree of Progress made in relation to the target value of the indicator. We refer to the calculated result as the “progress rate” in this paper. The progress rate is expressed as a percentage and indicates the level of achievement of the indicator.
The progress rate is calculated based on both “Observable Progress” and “Latent Progress”. Observable Progress refers to the visible progress obtained from the actual output during the progress-check period, expressed as a percentage of the output against the target value. On the other hand, latent progress represents the invisible progress that has not yet manifested as actual output during the progress-check period. It is estimated subjectively and expressed as a percentage for the remaining target value.
To determine the
latent progress, researchers who are involved in the R&D project corresponding to the indicator perform a subjective self-check of the research progress. This self-check involves evaluating the progress and estimating the percentage of completion for the remaining target value. One approach to measuring the progress rate and evaluating R&D performance is to consult an expert who is knowledgeable about the technology or actively participating in the research [
47,
48,
49]. Seeking input from external experts can provide relatively objective results. However, this approach may have practical limitations. Alternatively, self-check by the R&D practitioner has the advantage of the researcher being intimately familiar with the research schedule. However, relying solely on self-check by the researcher may introduce biases in the assessment [
47]. Therefore, the R&D manager should be aware that the evaluation may be inflated and take necessary precautions when considering self-assessment results.
IndicatorOb considers only Observable Progress, IndicatorLt considers only latent progress, and IndicatorCo represents both Observable and latent progress. Let us consider an example where the target value for an IndicatorCo is 4 and the actual output observed during a progress-check is 1. In this case, the Observable Progress would be calculated as 100 × (1/4) = 25%. Now, let us assume that the researcher evaluates the progress for the remaining target value (3 out of 4) as 40%. This assessment represents the latent progress. To calculate the latent progress, we multiply the proportion of the remaining target value (3/4) by the researcher’s rating (40%), resulting in (3/4) × 100 × 0.4 = 30%. To obtain the overall progress rate for the indicator, we sum the Observable Progress and the latent progress: 25% + 30% = 55%. Therefore, the progress rate for the indicator in this example would be 55%.
3.3. Priority Evaluation to Future Directions
Appropriate allocation of resources enables R&D institutes to maximize their output [
1]. During the R&D planning or evaluation phase, resource allocation for R&D requires evaluating the importance of tasks or comparing the input to the output. Similarly, reallocation of resources during the course of R&D requires evaluating the progress made to guide modifications in resource allocation or to provide additional support to researchers, maximizing the probability of achieving the target value [
14,
50]. In this step, we propose a prioritization method that considers the progress rate to support feedback to research participants by providing reasonable evidence of resource reallocation.
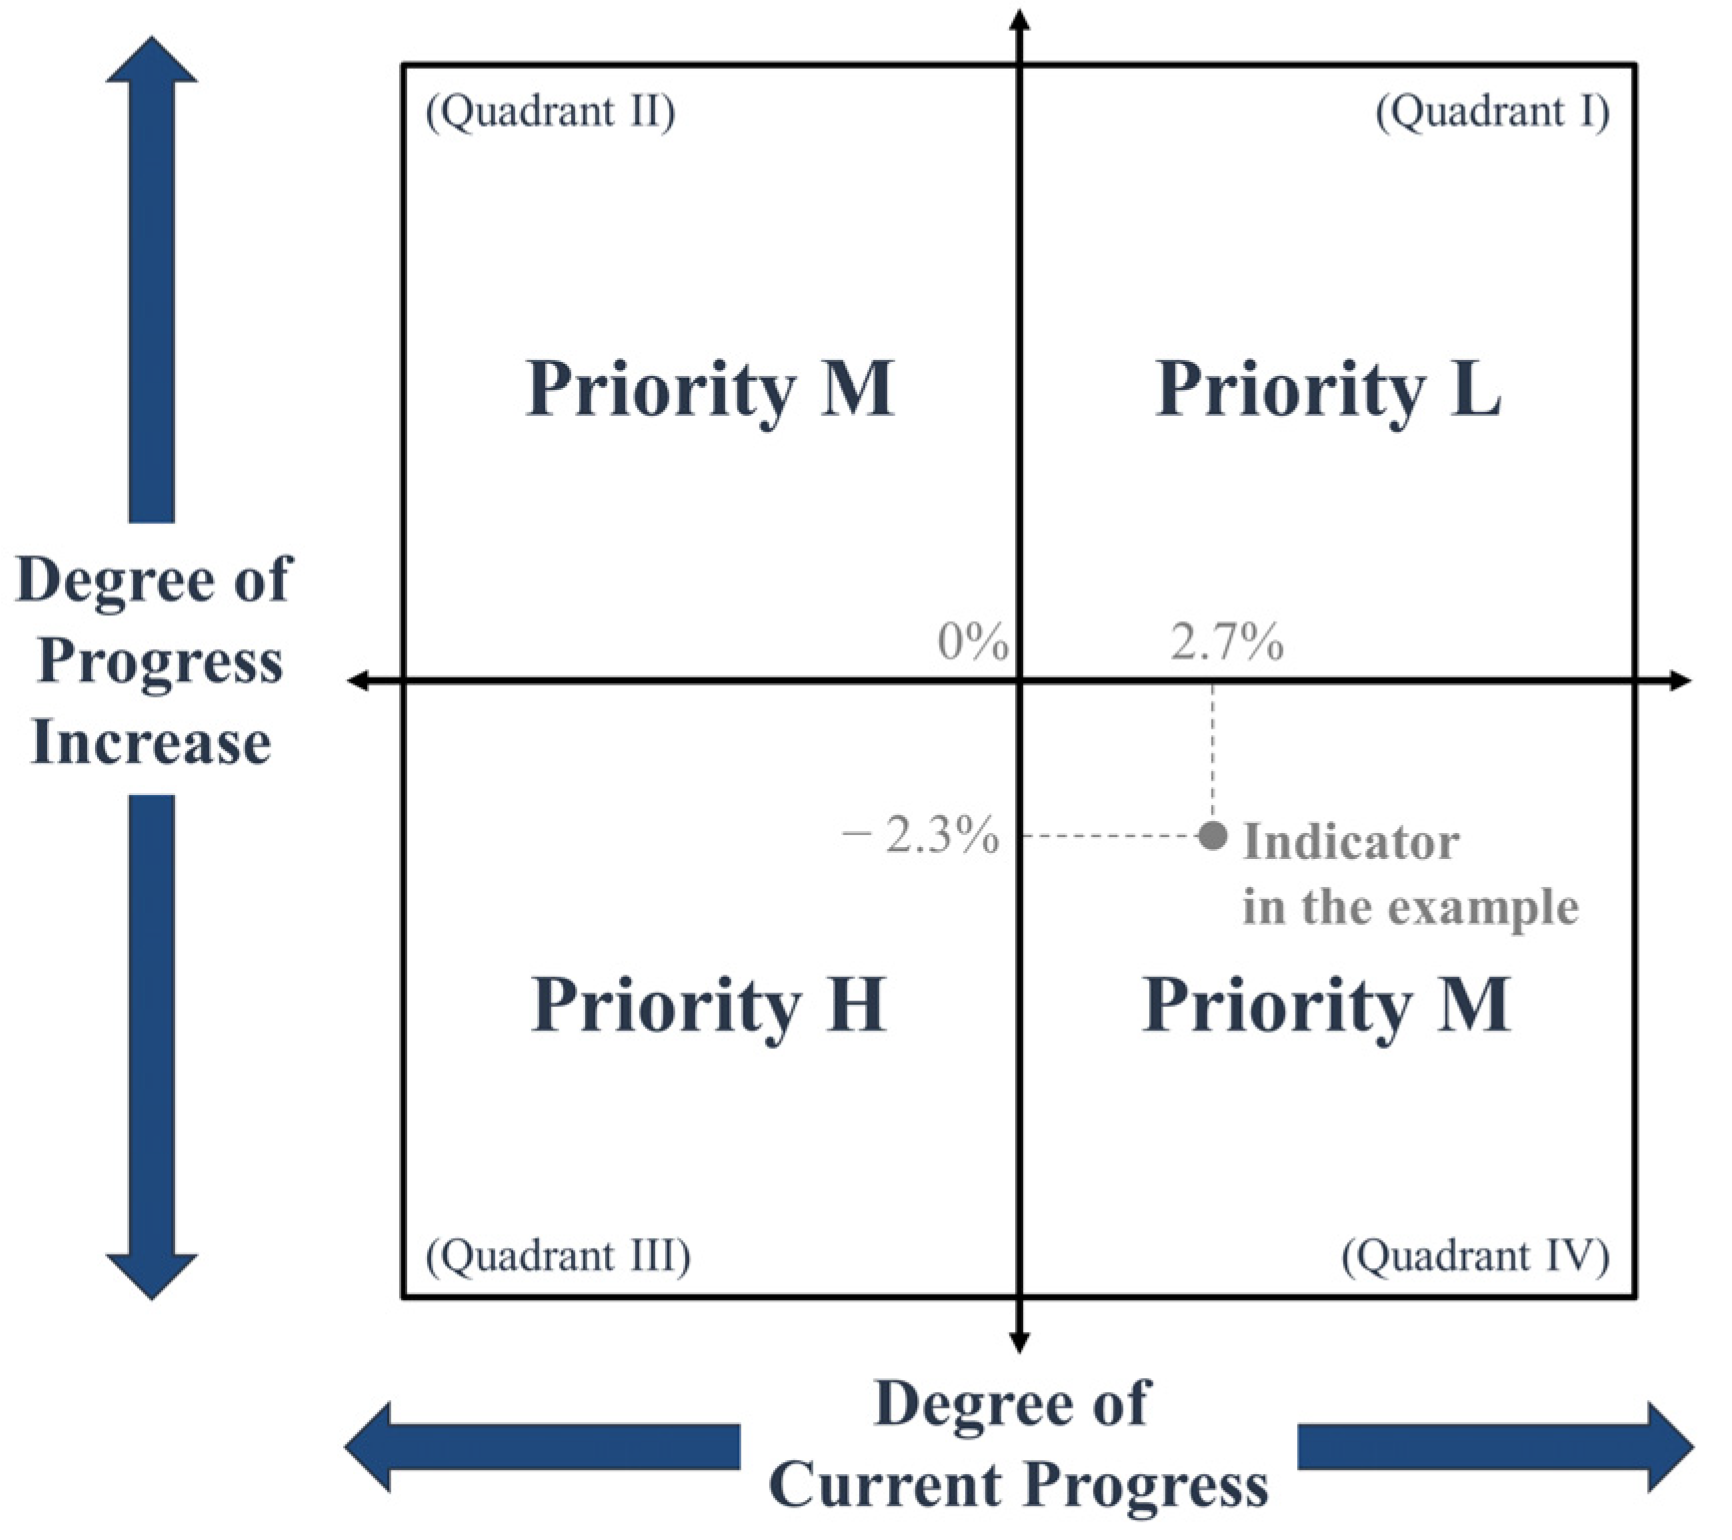
To determine the progress priority of indicators, we introduce the concept of the “Progress Priority Matrix” (
Figure 2). This matrix takes into account potential errors that may arise from subjective evaluations of the progress rate. At each progress checkpoint, each indicator is positioned on the matrix based on comparisons with the
Degree of Current Progress and the
Degree of Progress Increase.
The Degree of Current Progress is defined as the expected value of the progress rate that an indicator should normally achieve at the Nth progress checkpoint throughout the entire monitoring period. The Degree of Progress Increase represents the standard increment in the progress rate from the (N-1)th to the Nth progress checkpoint. In this study, we assume a linear increase in the progress rate over the entire monitoring period to derive the standard increment.
To determine the progress priority of indicators, two criteria are considered. First, if the progress rate of an indicator at the Nth checkpoint exceeds the Degree of Current Progress, it is placed on the right half of the matrix. Second, if the increment of the progress rate from the (N-1)th to the Nth checkpoint exceeds the Degree of Progress Increase, it is placed on the upper half of the matrix.
Based on the positioning of indicators on the matrix, their progress priorities are classified as high (H), medium (M), or low (L). Priority H corresponds to Quadrant III, Priority M corresponds to Quadrant II or IV, and Priority L corresponds to Quadrant I in the Cartesian coordinate system. The results of the progress priority matrix are used by the R&D management department to establish policies and take actions to increase progress toward the objective.
For example, let us consider a scenario where monthly progress checks are conducted on the last day of each month for a year. If the current checkpoint is April, the Degree of Current Progress can be estimated as approximately 100 × (4/12) = 33.3%, and the Degree of Progress Increase is (100 × (4/12)) − (100 × (3/12)) = 8.3%. Now, assuming that the progress rate of an indicator was 30.0% in March and 36.0% in April, the progress priority of the indicator in April would be assigned as Priority M (Quadrant IV). This is because the progress rate (36.0%) exceeds the Degree of Current Progress (33.3%), and the increment in the progress rate (6.0% = 36.0% − 30.0%) does not exceed the Degree of Progress Increase (8.3%).
4. Case Study
4.1. Backgrounds
South Korea is recognized as the world’s fifth-largest investor in R&D, having allocated USD 11 billion towards R&D activities. Additionally, South Korea holds the distinction of having the largest government-financed GERD as a percentage of GDP in 2020. Given the significant investment in public R&D, there is a need for a systematic performance monitoring system to effectively manage public R&D projects. In light of this, we applied the proposed system to a case study involving a Public Research Institute (PRI) in South Korea and developed an information system tailored to the institute’s requirements.
The case study institute, referred to as PRI-K, is a government-funded research institute primarily focused on conducting national-level R&D related to science and technology information and infrastructure in South Korea. PRI-K is required to submit a research plan to the government for a 3-year period, with annual interim evaluations conducted by the government. Despite PRI-K’s intention to monitor progress at short intervals during R&D activities, the institute faced challenges in quantifying the progress of indicators set on an annual basis. The collection of progress data was further complicated by the unique characteristics of the performance indicators. Some indicators could be measured immediately, while others required a certain project level to determine achievement. Additionally, some indicators had a small number of target values, such as 1 or 2 for a year.
PRI-K consists of four research divisions, each comprising multiple departments. The institute operates a large-scale R&D program consisting of various projects. These projects are allocated among the divisions and departments, and each project is associated with a set of performance indicators. Goals within PRI-K are organized hierarchically at the institute, division, and department levels, with each goal and performance indicator assigned a weight. While certain indicators are shared across multiple projects (e.g., “Number of academic papers published”), others are unique to specific projects. PRI-K aimed to monitor progress at approximately monthly intervals. In this context, we implemented the proposed system within PRI-K, utilizing its established performance indicators.
4.2. Implementation
Firstly, we classified a total of 123 indicators of all projects according to the classification criteria with the manager of the R&D management department, after preprocessing the target values to ensure their consistency. These indicators were constructed based on technological, infrastructural, social, or economic aspects, and were configured to evaluate performance annually with preset weights. The results were reviewed by each research division. The examples of the indicators by categories are as shown in
Table 2. Finally, 28 were classified as
IndicatorOb, and 29 as
IndicatorCo. A total of 66 were classified as
IndicatorLt, which is evaluated using statistical analysis, surveys, technical demonstrations, or comparison of experimental results with best practices.
Then, we derived the progress rate of each indicator by applying the developed metrics according to the indicator categories. The progress rate was calculated using the information system described in the next subsection of this paper. We operated the information system over a period of one year to derive the progress rate, and then derived the progress priorities once at the 6th checkpoint as a sample. During this step, we identified a few unusual cases and took actions as follows. The identical indicators such as ‘Number of academic papers published’ were used by all projects, but the indicator category could change according to the target value. In this case, two options were possible: to unify each category of the indicator into the same category, or to apply different categories by recognizing the distinct characteristics of the projects. The former was chosen after discussion with the manager. In addition, some indicators had a target value of 0, so the problem of dividing by zero occurs. In this case, we fixed the value of progress rate at 100%.
We calculated the progress rate by the levels of management, using the following weighted sum formulas:
Let the progress rate function
and weight function
defined on a discrete set
Aj = {
a1, a2, a3, …, ai} for a given number
j; the weighted sum of the progress rate on
Aj is defined as follows.
Then, the weighted sum of the progress rate on the project is as follows.
where
i is an index for indicator,
j is an index for project,
indi is an indicator i, belonging to project j,
prjj is a project j.
Therefore, the weighted sum of the progress rate by levels of management is as follows.
where
k is an index for department k,
l is an index for division l,
dptk is a department k,
divl is a division l,
inst is the institute, PRI-K.
4.3. Information System for R&D Performance Monitoring
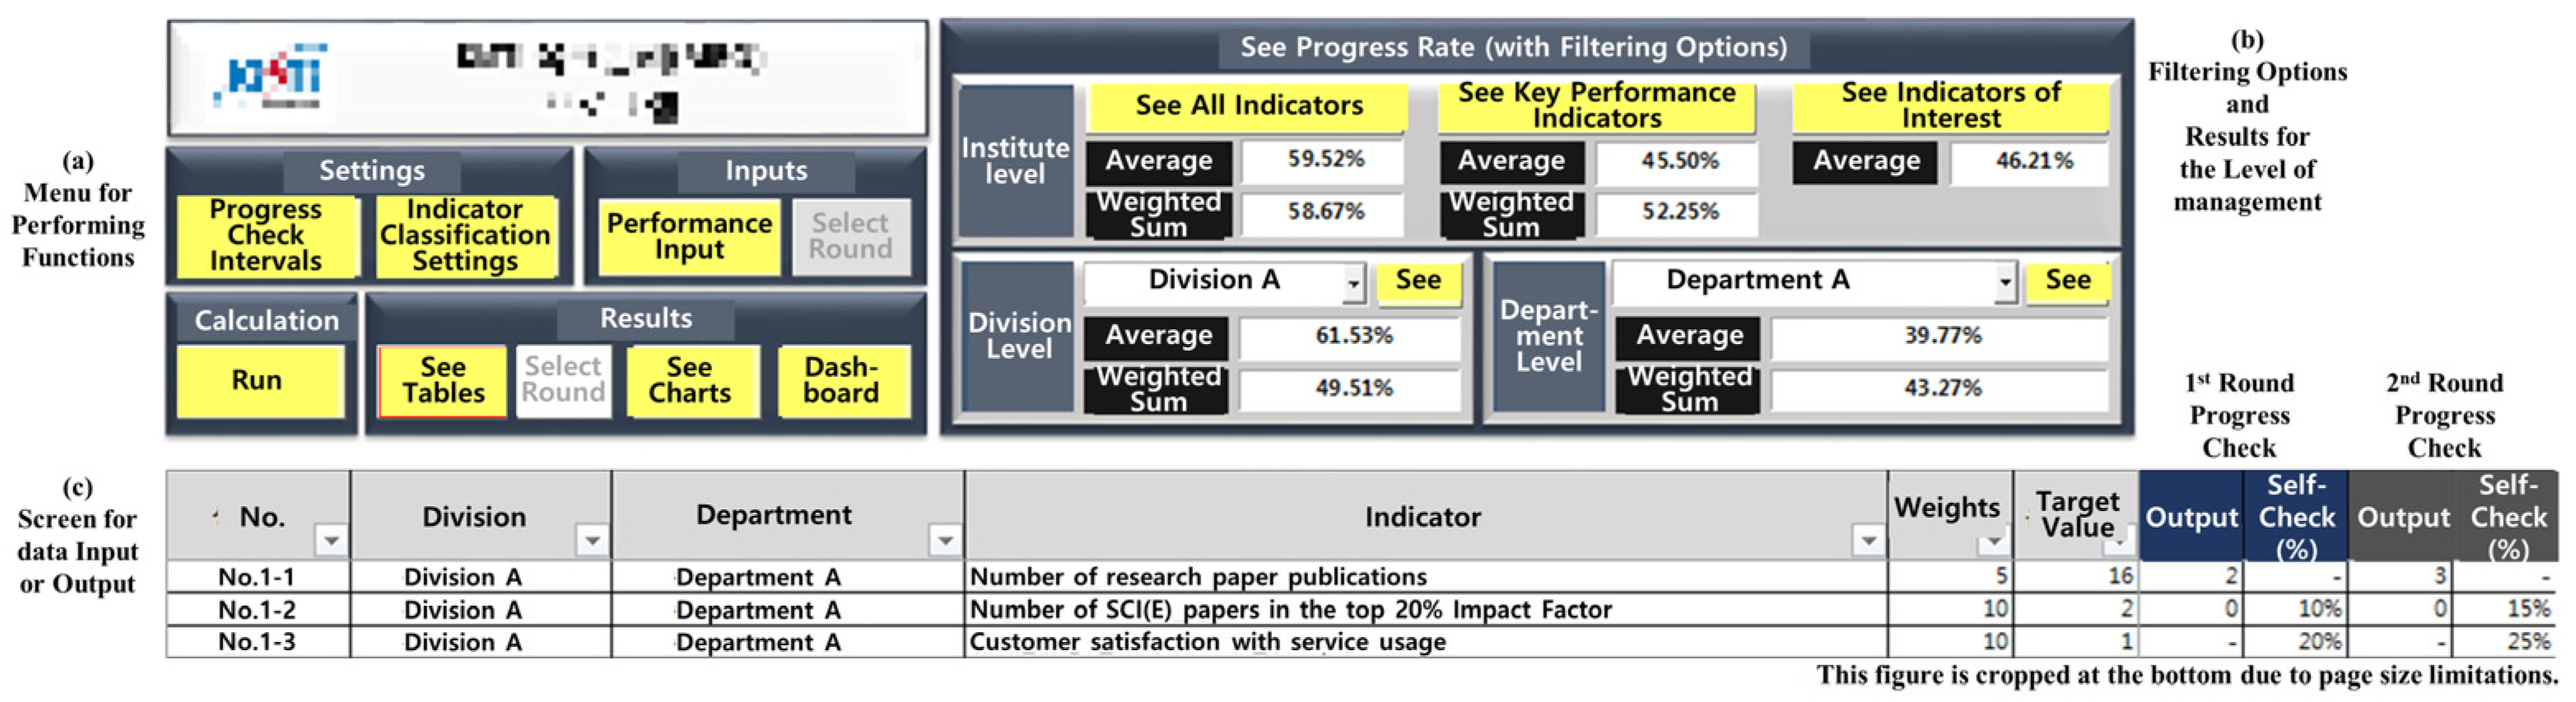
We developed a prototype information system (IS) for R&D performance monitoring using Visual Basic for Applications in Microsoft Excel. The IS was designed to provide convenience for the R&D manager and allow for expandability. The interface of the IS includes a menu for executing various functions, filtering options for selecting and printing specific content based on management levels, and a screen section for data input and result output. While the interface was originally developed in Korean, for the purpose of this paper, certain parts of
Figure 3 and
Figure 4 have been translated into English and are accompanied by corresponding descriptions.
The R&D manager collects progress data from the researchers involved in the R&D project and utilizes the program to manage the progress and provide feedback to the researchers. The manager enters preset data such as the progress-check period, target values of indicators, and data required for determining the indicator category. The manager then inputs the progress data into the program. The program employs the provided data to calculate the progress rate and progress priority, which are subsequently displayed. The manager can provide feedback on the results to the researchers based on the displayed information. The progress rate of each indicator is presented in the form of tables and graphs, providing a summary of the information on a dashboard. Additionally, the progress priority results are shown to aid the manager in making decisions and allocating resources effectively. Overall, the IS serves as a valuable tool for R&D performance monitoring, facilitating the collection, calculation, and visualization of progress data, as well as enabling efficient feedback and decision-making processes within the R&D management department.
5. Discussions
To validate the effectiveness of the proposed system, we applied it to a real-world case institute, PRI-K. Over the course of a year, PRI-K implemented the IS and tested its functionality. We conducted interviews with four individuals from PRI-K, including three from the R&D management department and one from the R&D department, to confirm the system’s validity.
PRI-K previously lacked a short-term cycle performance monitoring system, aside from an annual interim evaluation. Progress checks on indicators were conducted through intermittent interdepartmental meetings or simple counting of certain indicator outputs. Due to limited quantitative verification, such as historical progress data and research hour records, we primarily relied on qualitative verification through interviews to assess the performance monitoring system and validate the IS.
The proposed system successfully allowed the manager to monitor the progress of all indicators at PRI-K within short-term cycles, addressing the issue of “no progress” and reducing the workload associated with manual tasks, reporting, and meetings. The IS provided visual representations of indicator progress and management levels, enabling a more intuitive understanding of the data. Interviewees expressed that the IS reduced the administrative burden of R&D monitoring by presenting results through a dashboard, eliminating the need for text-based reports to higher management. Additionally, employee involvement in the process of determining research progress facilitated clearer comprehension and self-management of work progress. Feedback from the interviewees indicated that the IS enabled the identification of historical project progress at each check, allowing for a comprehensive examination of achievement trends and the establishment or adjustment of future objectives. Overall, all interviewees agreed that the proposed system contributed to achieving institute-level goals and improving productivity compared to the previous monitoring system.
To assess the usefulness of the proposed system, we compared it with various performance and project monitoring methods using comparison criteria and results according to the prior study [
20] (
Table 3). While some comparisons proved challenging due to differences in purpose and operational methods, the test confirmed that the proposed system offers advantages in monitoring R&D project progress and managing projects by providing periodic feedback and considering the complexities of “latent progress”.
The proposed system and information systems (IS) contribute significantly to both academic and practical domains. The measurement of R&D performance has been approached from various perspectives, taking into account the organizational purpose and measurement perspectives [
46]. Initially introduced by the Balanced Scorecard (BSC) [
40], which expanded the traditional financial perspective to a more balanced one, subsequent studies have developed indicators from a nonfinancial standpoint [
51,
52]. Other studies have considered the type of R&D [
53,
54] based on the OECD Frascati Manual or the process phase [
3,
55] within the performance management cycle. Recognizing the social impact of R&D in the public sector, researchers have classified indicators from technological, social, or economic perspectives [
6,
56]. In this study, we propose a novel classification system that goes beyond these existing classifications, incorporating a different dimension capable of encompassing latent progress and assessing overall progress.
Employee participation in organizational management has long been recognized as a crucial factor in enhancing organizational performance and employee morale [
31,
57,
58]. However, measuring R&D performance presents significant challenges, as it could potentially stifle researchers’ creativity and reduce productivity [
56]. Despite these challenges, employee participation remains a key focus in R&D performance management. Whitley and Frost [
49] highlighted the importance of involving not only R&D project directors but also the researchers themselves and their peers in the evaluation process. Similarly, Werner and Souder [
54] proposed the use of multiple evaluators, including the researcher, peers, and external stakeholders, as a suitable approach. Additionally, Khalid and Nawab [
32] analyzed the relationship between employee participation and organizational performance, finding a significant positive impact. A survey-based study of Korean R&D researchers [
48] suggested that an effective measurement system should involve participation from both researchers and managers.
In this study, we have supported previous research that demonstrates how organizational participation enhances organizational productivity. We have also confirmed the successful achievement of organizational goals through performance management that includes researchers’ own progress assessments. Feedback from the research department interviewees indicated that this system alleviated concerns about the lack of actual performance achieved during the monitoring period. The system provided a participatory environment that actively engaged researchers in assessing the progress of their research. Therefore, we conclude that by understanding and acknowledging progress and implementing an appropriate monitoring system for researchers, a successful performance-oriented organizational culture can be established, eliminating skepticism surrounding one-sided progress supervision.
This IS offers a clear visualization of indicator progress, enabling managers to effectively monitor R&D performance and provide feedback. The overall progress is presented in a standardized format, allowing managers to easily identify progress by color-coded indicators. For instance, R&D managers can quickly identify whether indicators have been achieved, marked in green, or not achieved, marked in red. Observable and latent progress are distinguished by different colors, enabling a clear differentiation between actual output and expected output. Furthermore, the visual representation of progress facilitates comparisons both within indicators and among different divisions. Feedback received highlighted that the progress rate is automatically calculated from the indicator level to the institute level. This comparative analysis of divisional progress assists in the development of an administrator’s overall management strategy. The dashboard also simplifies comprehension of indicator achievement by displaying the total number of indicator achievements in aggregate. Notably, one interviewee mentioned that the original performance indicators can be utilized as they are, eliminating the need to establish new process indicators.
6. Conclusions
With the growing impact of R&D and the increasing need for effective management of R&D projects, monitoring their performance, especially in large-scale R&D endeavors, becomes increasingly crucial. In this context, we have presented a R&D performance monitoring system and demonstrated its application in a Public Research Institute. This study focused on monitoring R&D performance by tracking indicator trends to ensure the achievement of desired targets. To fulfill this purpose, we introduced a monitoring system that measures the progress rate of performance indicators and developed an information system for R&D project management.
While this paper proposes an improved method for monitoring R&D performance, it does have some limitations in its design and implementation. The quantification of resource inputs, such as research hours allocated to each project, was not conducted in the case study. Therefore, calculating the efficiency of R&D was not possible, leading to the development of the progress priority matrix as an alternative. Further research could address this limitation by establishing and solving an optimization problem for resource allocation, using tracked man-hours information. Additionally, a method to detect and mitigate biases in the self-checking of latent progress should be developed. While such biases may be identified through comparison with the Degree of Progress Increase, compensating for these biases can be achieved by analyzing self-check tendencies. Furthermore, in future research, the accumulated history of progress rates could be leveraged to identify performance achievement trends for each indicator beyond linear assumptions, thus informing subsequent iterations of goal setting and performance monitoring.


