Article

Monitoring and Analysis of Land Subsidence in Jiaozuo City (China) Based on SBAS-InSAR Technology

1
School of Surveying and Land Information Engineering, Henan Polytechnic University, Jiaozuo 454000, China
2
School of Resources and Civil Engineering, Liaoning Institute of Science and Technology, Benxi 117004, China
3
Jiangsu Shuchuang Intelligent Development Co., Ltd., Nantong 212004, China
4
Jingjiang Bureau of Hydrological and Water Resources Survey, Jingjiang 434099, China
*
Author to whom correspondence should be addressed.
Sustainability 2023, 15(15), 11737; https://doi.org/10.3390/su151511737
Submission received: 17 June 2023 / Revised: 27 July 2023 / Accepted: 28 July 2023 / Published: 30 July 2023

Abstract

:
Jiaozuo, located in the northwest of Henan Province, is one of the six major anthracite production bases in China. It is susceptible to land subsidence due to over a hundred years of mining history, continuous urbanization, frequent human activities, etc., which poses a great threat to urban infrastructure construction and people’s production and lives. However, traditional leveling techniques are not sufficient for monitoring large areas of land subsidence due to the time-consuming, labor-intensive, and expensive nature of the process. Furthermore, the results of conventional methods may not be timely, rendering them ineffective for monitoring purposes. With the continuous advancement of urbanization, land subsidence caused by groundwater extraction, ground load, and other factors in daily life poses a great threat to urban infrastructure construction and people’s production and lives. In order to monitor the land subsidence in the area of Jiaozuo city, this article uses the Sentienl-1A satellite data covering the city from March 2017 to March 2021 to obtain the accumulated land subsidence and the average land subsidence rate based on the Small Baselines Subset InSAR (SBAS-InSAR) technology. The results indicate that the surface of Jiaozuo area is generally stable, and there has been no large-scale settlement. The settlement rate is roughly between −1 mm/a and 2.2 mm/a, and the areas with obvious land subsidence are mainly located in the southeast and east of Jiaozuo city center. After field investigation, it was found that the land subsidence is mainly caused by two reasons: groundwater excessive mining and excessive surface load. In the northeast of Jiaozuo city, there is a certain uplift area. After on-site investigation, it was found that the area is connected to a tailings pond of an aluminum mine, constantly accumulating abandoned rock masses and sediment, causing an annual uplift rate of +6~+ 24 mm/a. The large-scale extraction of groundwater from farmland in the urban–rural integration area for irrigation of wheat has led to the settlement of buildings in the area with a rate of −11–−74 mm/a.

1. Introduction

Land subsidence is also known as ground subsidence or subsidence. It is a local downward movement (or engineering geological phenomenon) caused by the consolidation and compression of loose underground strata under the influence of human engineering and economic activities, resulting in a decrease in the surface elevation of the Earth’s crust [1,2,3]. The damage caused by land subsidence is slow and persistent, and the resulting subsidence cannot be restored, leading to irreparable environmental problems and resource losses. Moreover, continuous land subsidence can lead to serious damage to urban infrastructure that will directly affect urban planning and development, land use, and layout, and seriously threaten the normal production and lives of people [4,5,6]. Therefore, accurate land subsidence monitoring and analysis are of great importance for hazard assessment and risk evaluation.
Many previous studies and investigations have been taken to monitor land subsidence in different regions, and scales with InSAR and other techniques [7]. The existing research can be classified into two categories: one is the traditional measurement methods and the other is based on recent radar satellite observations. The traditional monitoring approaches include the ground leveling survey, bedrock marker survey, stratified marker survey, and Global Positioning System (GPS) techniques [8]. The common characteristics of these methods are point-based, which means that they can only obtain subsidence information at discrete points on the ground. The limitation will restrict their applications into dynamic monitoring over large areas and could not provide sufficient samples required by land subsidence mapping, etc. Moreover, the traditional land subsidence monitoring methods are often costly, laborious, and time-consuming [9]. In recent years, with the increasing enrichment of space-borne SAR data, the InSAR technique, independent of time and weather, can monitor small deformations on the ground in near-real-time, which has become an important technical means of monitoring land subsidence in large geographic areas. Although the InSAR method is low-cost and effective [10], it suffers from temporal decorrelation and atmospheric disturbance [11,12,13], InSAR cannot measure below the surface, which is of course a limitation.
In traditional InSAR technology, the processed data results are always mixed with errors such as atmospheric phase delay and spatiotemporal decorrelation, which greatly reduces the accuracy of the technology and to some extent, restricts the promotion and application of InSAR technology. In order to break through the bottleneck that hindered the development of InSAR, in the late 20th century, InSAR time series analysis technology emerged as a key to opening the door to the future. This analysis technology is used to obtain relatively stable surface scatterers (usually roads, bridges, buildings, etc.) from long-term sequence images, obtain certain error phases from these stable scatterers, and remove the error phases; these error phases are also caused by factors such as atmospheric phase delay, spatiotemporal decorrelation, and Digital Elevation Models (DEM). At present, the relatively mature and commonly used InSAR time series analysis techniques include Small Baselines Subset InSAR (SBAS-InSAR) and Persistent Scatterer InSAR (PS-InSAR) [14,15].
Therefore, many other advanced InSAR methods based on multi-interferograms such as PS-InSAR and SBAS-InSAR have been proposed to overcome these limitations and disadvantages [16]. This study explores the application of SBAS-InSAR technology with high-resolution Sentinel-1A images to long-term monitoring of land subsidence in Jiaozuo city and analyzes the cause of land subsidence. Specifically, (i) we investigated the potential of 31 scenes Sentinel-1A images acquired between 19 March 2017 and 22 March 2021 to derive land subsidence rates in Jiaozuo, China; (ii) the influence of natural conditions and human activities on land subsidence and their interrelationships were investigated.
Research has shown that the occurrence of land subsidence disasters takes a long and continuous subsidence process, the accumulation of which has strong concealment [16]. However, the slow deformation caused by settlement can be discovered through the damage characteristics exhibited by cracks, tilting of buildings or structures, or rapid subsidence or collapse of the surface after reaching its limit. It brings direct and potential risks to people’s production and life, which is not conducive to the development of urbanization and the sustainable development of urban construction [17]. Therefore, it can be seen that the impact of land subsidence on people is extremely significant, and corresponding measures need to be taken as soon as possible to solve it.
The slow deformation process of land subsidence can be monitored through measurement methods, and the magnitude and rate of subsidence deformation can be analyzed, as well as the development range and trend of subsidence can be predicted [18].
Moreover, the current urban settlement engineering requires large-scale, high-density, and continuous monitoring, and from the characteristics of traditional monitoring technologies, it is obvious that traditional technologies cannot meet the current demand for large-scale settlement monitoring of cities [19]. Although traditional measurement methods have high accuracy, they have many limitations, such as the need to invest a large amount of manpower and resources, the measurement cost being directly related to the density of monitoring point layout, the monitoring range being small, the monitoring conditions being strict, and monitoring in large areas not being easy to achieve. With the successful launch of radar satellites and the rapid development of remote sensing technology, modern satellite technology has been widely used for efficient, low-cost, and large-scale surface subsidence monitoring. InSAR technology is a newly developed space Earth observation technology that combines traditional SAR remote sensing technology with radio astronomical interference technology. It uses radar to emit microwaves into the target area, and then receives the echoes reflected by the target to obtain multiple SAR image pairs of the same target. If there are coherent conditions between multiple image pairs, the conjugate multiplication of multiple SAR image pairs can obtain the interference map. Based on the phase value of the interference map, the distance difference between the microwaves in the two images is obtained, and the terrain, topography, and surface small changes in the target area are calculated.
Remote sensing methods can be used to establish DEM, detect crustal deformation, and obtain surface information. The Differential InSAR (D-InSAR) method in satellite radar monitoring technology has been rapidly developed in urban land subsidence monitoring, and the technology has also been widely used in the early identification of regional landslide disasters [14], post-earthquake surface deformation monitoring [18], and other geological disaster fields [20,21,22]. The main features of D-InSAR technology are wide space coverage, short revisit period, high spatial resolution, all-weather automation of deformation monitoring, and unattended access to monitoring data of disasters or subsidence areas under software processing. This technology has become an essential technical means for monitoring land subsidence. Through the data sharing of multiple radar satellites and the continuous improvement of data processing methods, the monitoring accuracy of InSAR technology continues to improve, and its applicability continues to expand. With the continuous improvement of radar data processing methods, time-series InSAR technology based on optimization and coherent targets has been developed, such as PS-InSAR technology and SBAS-InSAR technology [23]. Time InSAR technology utilizes the SAR data stack for temporal processing and analysis, which can effectively overcome the high-precision shortcomings of traditional D-InSAR in terms of spatiotemporal incoherence errors, atmospheric delays, terrain effects, and other aspects.
In order to avoid the sudden occurrence of subsidence disasters causing damage to people’s lives and property, the industry has taken many measures to monitor surface subsidence [24]. With the development and progress of science and technology, the means of land subsidence monitoring are also constantly iteratively developing. According to the characteristics of different technologies, they can be mainly divided into two categories: traditional measurement methods for subsidence monitoring and modern satellite monitoring technology [25]. Traditional measurement methods are used to establish a leveling monitoring control network to measure the elevation values of each network point and calculate the elevation changes observed in each period to analyze the settlement of the ground area [26]. The ground deformation can also be monitored by means of surveying robots, total station triangulation, and Global Navigation Satellite System (GNSS) based on the geodetic method of discrete points [27]. In general, large-scale monitoring often estimates the overall deformation trend based on changes in a single point. This method requires collecting enough information to meet the operational requirements, which is not only time-consuming and laborious, but also inevitably introduces estimation errors into the final result. In the past few years, urban surface subsidence monitoring and analysis have been carried out through time series InSAR. Orhan and others used InSAR to observe land subsidence, and combined with GNSS observation data, analyzed the relationship between groundwater exploitation, land subsidence, and sinkhole formation, providing a theoretical reference for land use/land cover change and groundwater data monitoring [28,29]. Time series InSAR technology can achieve high-precision land subsidence monitoring. Wang Lei and others used SBAS-InSAR technology to monitor land subsidence in Xi’an as the research object. The results showed that most areas of Xi’an were in a relatively stable state, with subsidence areas concentrated in the southern part of Yuhuazhai, Electronic City, San’ai Station, and Fengwuyuan Station. Groundwater extraction, infrastructure construction, and population density are the main driving factors for land subsidence in Xi’an [30,31,32,33]. Groundwater over-exploitation, increased surface load, and mining of underground minerals are rapidly emerging, leading to the occurrence of land subsidence problems caused by these phenomena [34,35,36].
Jiaozuo is located in the northwest of Henan Province, China, adjacent to Shanxi Province to the north and the surging Yellow River to the south. Jiaozuo city has an extremely long mining history, with many coal mines distributed in the region. Currently, due to the depletion of coal resources, Jiaozuo city is designated as one of the first resource-exhausted cities by the country. However, the exploitation of groundwater in areas such as Zhengzhou city and the North Henan Plain is still ongoing, and the situation is relatively severe. Against the backdrop of the development of the times, the rapid rise of cities has led to serious groundwater exploitation and continuous increase in surface loads. The subsidence disasters caused by this impact will affect the normal production and life of Jiaozuo area [37]. As a relatively new type of settlement observation technology, SBAS-InSAR technology has many advantages, making it an excellent choice for monitoring land subsidence disasters. Therefore, in order to comprehensively grasp the surface subsidence status of Jiaozuo city, better provide geological safety information for urban construction and urban sustainable development planning, and to grasp the subsidence distribution and characteristics of the old mined out areas of coal mines, SBAS InSAR technology was used to conduct a land subsidence analysis of Jiaozuo city.

2. Study Area and Datasets
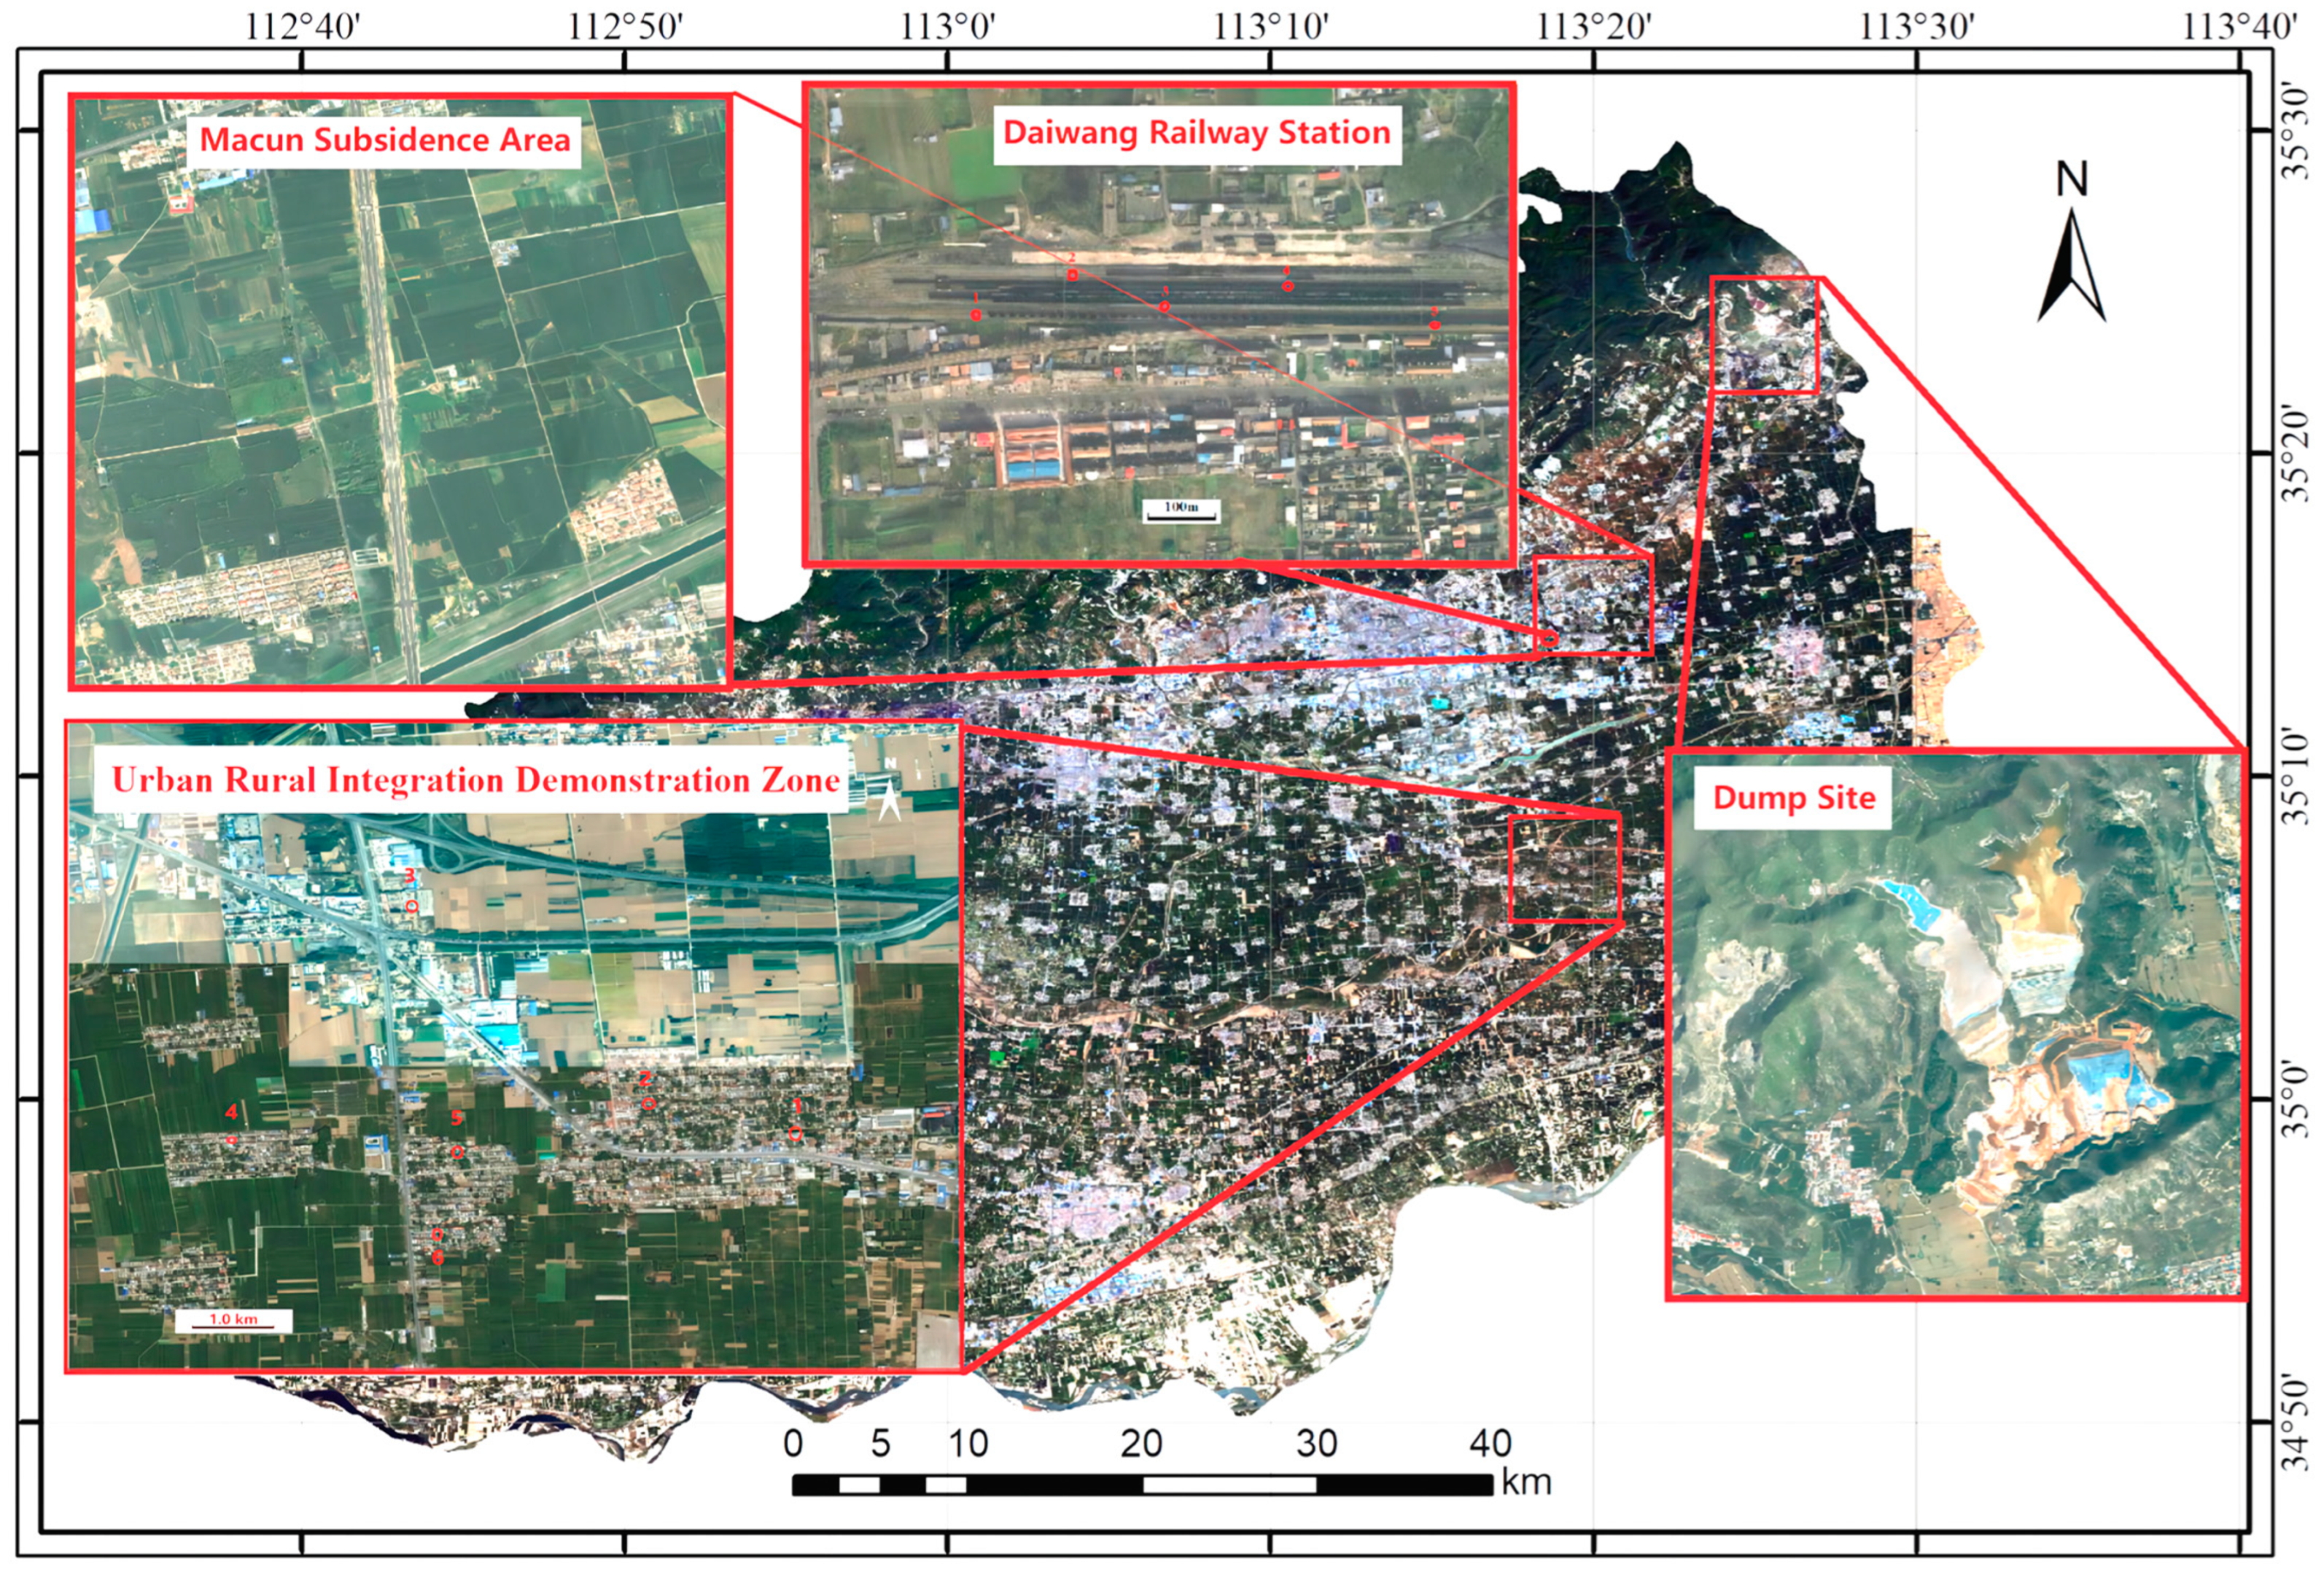
2.1. Study Area

Jiaozuo city (34°50′ N–35°30′ N, 112°30′ E–113°40′ E) is located in the northwest of Henan province, China, adjacent to the Taihang mountains to the north and the Yellow River to the south, with a total area of 4071 km2 [15], as shown in Figure 1. There is a wide range of landforms from north to south, including mountains, hills, plains, and mudflats. It is a natural basin for collecting groundwater, covering a vast area of approximately 1400 km2 in the northern mountainous areas and the southeastern mountainous areas of Shanxi Province. At the southern foothills of the Taihang mountains in the northern part of Jiaozuo, there are about 500 km2 of mountain front hills and gravel sloping flat land, whose geology is hard and stable for a human-induced subsidence point of view and the strata are durable; moreover, this land is adjacent to mining sites, water sources, transportation arteries, and towns, making it an ideal industrial land and also very suitable for building high-rise buildings [16]. In addition, the land resources that have been developed and utilized in the city are divided into four categories: cultivated land, forest land, grassland, and industrial and construction land.
Jiaozuo is a water-rich area in North China, with abundant surface water resources. There are numerous rivers in the area, and among them, the drainage area of 23 rivers is larger than 100 km2 [15]. The city has a temperate monsoon climate characterized by four distinct seasons, and abundant sunshine. The average annual temperature is 12.8–14.8 °C. The hottest month with a monthly average temperature of 27–28 °C normally is July, while the coldest month is January with a monthly average temperature of −3–1 °C. In addition, Jiaozuo has a wide variety of mineral resources with large reserves and good quality. The proven reserves include more than 20 kinds of coal, limestone, bauxite, refractory clay, pyrite, etc. [38]. The coal field extends from Xiuwu in the east to Bo’ai in the west and Wuzhi in the south. It is 65 km long from east to west, 20 km wide from south to north, with a coal reserve of 3.24 billion tons [39]. As a single high-quality anthracite, it is an Ideal raw material for chemical and steel industries.

2.2. Datasets

The data used in this study mainly include Sentinel-1 radar image data, external reference DEM data, and satellite precise ephemeris data.
(1)
Sentinel-1A SAR data
The Sentinel-1 satellite which was launched in April 2014 and which carried a C-band synthetic aperture radar, is an Earth observation satellite of the European Space Agency Copernicus Program (Global Monitoring for Environment and Security). This satellite has an all-weather and continuous radar imaging system with anon-orbit altitude of 693 km and a data update period of 12 days. It has several different polarization modes, such as single and double polarization, which can provide continuous imagery and data services through wide range, and multi-application modes [20]. This paper employed 31 single-look complex (SLC) images of Sentinel-1 radar acquired from 19 March 2017 to 22 March 2021, which were downloaded from European Space Agency website (https://search.asf.alaska.edu/) (accessed on 5 March 2021). The images were captured with ascending orbits, vertical transmit/vertical receive polarization mode (VV polarization mode), and the interferometric wide (IW) mode, which had a spatial resolution of 5 m × 20 m. More detailed parameters are listed in Table 1.
(2)
External DEM
External reference DEM data are commonly used data for InSAR technology to obtain surface deformation, which has various purposes, such as removing terrain phase and providing geographical references. This experiment uses Global Digital Elevation Model (GDEM) V2 version data with a resolution of 30 m, which can be downloaded freely from the website (http://www.gscloud.cn/sources/accessdata/) (accessed on 15 March 2021). At present, GDEM is one of the relatively few high-precision DEM data types that can cover global land. The V2 version of GDEM solves the problem of anomalies in local areas of GDEM V1 data and adopts more advanced and scientific algorithms to improve the overall quality of the data. On 6 January 2015, the GDEM V2 version data were officially released to the public.
Since it is a block download, after the data download is completed, it needs to be embedded, cropped, and converted into a data format, ultimately obtaining the “Jiaozuo DEM” data, as shown in Figure 2. According to the DEM of Jiaozuo city, the Taihang mountains are located in the north with steep terrain and high elevation. Some water systems of the Taihang mountains flow into Jiaozuo area. In addition, the Jiaozuo area is relatively flat with little elevation difference.
(3)
Precision ephemeris data
During the processing of InSAR data, orbital errors can affect the accuracy of the processing results. Therefore, precision orbit determination ephemeris data (POD) are often used to correct incorrect orbit information and improve the accuracy of the results. POD data are currently the most accurate orbit data, with an overall positioning accuracy better than 5 cm. However, there is a time limit for these data. The data distribution center generates a precision ephemeris data file every 24 h, each containing 26 h of collected data, including 1 day of data for the current day, as well as 1 h for the day before and after. The data can only be officially used for 21 days after the satellite passes through. The POD data for this study are sourced from https://s1qc.asf.alaska.edu/ (accessed on 16 June 2023).

3. Methodology and Data Processing

3.1. Principle of SBAS-InSAR Technology

SBAS-InSAR technology is a classical time series analysis method proposed by Berardino and Lanari et al. [15,16]. This method is used for short baseline combination and large-scale deformation inversion. According to the principle of short spatiotemporal baseline, the interferogram of time series of multi-main images is generated under the threshold limit of spatiotemporal baseline, and the singular value decomposition (SVD) method is used to retrieve the deformation sequence and the average deformation rate of the study area during the observation time. At the beginning of this century, Berardino and others first advanced the idea of using SBAS-InSAR technology to study large-scale ground deformation, hoping to obtain time series maps of deformation [21]. The core idea of this technology is to arrange and group the obtained multi scene SAR images according to the basic principle of smaller spatiotemporal baselines, and then perform registration, interference generation, and other processing according to the prior grouping to obtain interference maps with shorter baselines. The spatiotemporal baseline of the interferometric pair obtained by SBAS-InSAR technology is generally short, so the generated interferogram will have high coherence, which can weaken the impact of incoherence on data accuracy from the source. Based on the minimum norm criterion of deformation rate, singular value decomposition is used to connect the previously generated isolated interference data pairs, which can improve the sampling frequency of the image and facilitate the extraction of temporal deformation information.
The basic principles of SBAS-InSAR technology:
Firstly, multiple SAR images can be obtained by observing a certain research area at different time periods. The image acquisition time periods are: t0, t1, t2, t3, …, tn.
Secondly, select one scene from the numerous images as the super master image, and the rest N image as the auxiliary image. Group SAR images based on a threshold are set by the baseline length, and group SAR images with a baseline is less than this threshold. Then, differential interference processing is performed on each set of SAR images, resulting in M sets of differential interference maps.
If N is an odd number, M and N have the following mathematical relationship:
N 2 M N ( N 1 ) 2
It can now be assumed that two images are obtained during the time periods ta and tb, and the time baselines of the two images are extremely short. Therefore, it can be assumed that the residual terrain phase and noise phase are completely consistent. By conjugating multiplication of pixel values, the error phase can be removed to obtain an interferogram without errors. In the azimuth–distance pixel coordinate system (x, r), the specific phase at a certain point is:
δ φ i = φ b ( x , r ) φ a ( x , r ) 4 π λ [ d ( t b , x , r ) d ( t a , x , r ) ]
In the equation: φ is the interference phase between the two images;
i is the image sequence number of the interferogram, i ∈ (1, 2, ..., M).
Assuming that the deformation value at the start time t0 of image acquisition is 0, then d (tb, x, r) represents the cumulative deformation of the monitoring point at time tb, and d (ta, x, r) represents the cumulative deformation of the monitoring point at time ta, all of which are along the line of sight (LOS).
Perform statistical analysis on the coherence coefficient, amplitude dispersion, and other related parameters of each image pixel, and then filter the pixels based on the set parameters. Obtain the interference phase as shown in Equation (7):
φ = [ φ ( t 0 ) , φ ( t 1 ) , φ ( t 2 ) , , φ ( t N ) ]
Thirdly, after phase unwrapping of the interference phase, the following results are obtained:
δ φ d e f = [ δ φ d e f ( Δ t 1 ) , δ φ d e f ( Δ t 2 ) , δ φ d e f ( t 3 ) , , δ φ d e f ( Δ t M ) ] T
The relationship between interference and cumulative deformation phase can be expressed as:
δ φ d e f = A φ
In the formula: A is M × N-order coefficient matrix.
Finally, according to Formula (6), when the number of rows and columns M ≥ N, a unique solution can be obtained using the least squares method:
φ = ( A T A ) 1 A T δ φ d e f
However, when M < N, ATA will become a singular matrix, so the result is not unique. Obviously, the least squares method cannot be used for solving, and another method must be found. Use the singular value decomposition of the matrix to obtain the least squares solution in the sense of minimum norm, and then obtain the linear deformation results. Filter the results in different ways to obtain atmospheric and nonlinear deformation phases. In the entire SBAS-InSAR technology, singular value decomposition is an important step and can be considered to be at the core. After removing various error phases, the required processing results can be obtained.
By elaborating on the SBAS-InSAR technology, the core points of this technology have been clarified. The advantage of this technology lies in its ability to handle the impact of spatial incoherence, atmospheric delay, and other factors on the accuracy of the results. Not only does it avoid the shortcomings of SBAS-InSAR technology, but also it promotes the development of InSAR technology, which is of great significance for the promotion and application of InSAR. In practical engineering monitoring, especially short-term monitoring, the accuracy of monitoring results is extremely important, and SBAS-InSAR technology can obtain high-precision monitoring results. However, SBAS-InSAR technology requires a relatively strict technical process to achieve high-precision monitoring results.

3.2. Data Processing of SBAS-InSAR

The data processing of SBAS-InSAR technology is shown in Figure 3. Firstly, the SLC image data of the research area are obtained and a small baseline set pair is established. Secondly, during the interference generation process, with the assistance of external DEM, appropriate GCPs are selected through the calculation of smoothing and filtering, phase unwrapping, and trajectory refinement and re-smoothing to eliminate slope phase. Thirdly, the first inversion of the average deformation rate and DEM correction coefficient eliminates the influence of atmospheric phase, and the second inversion of the average deformation rate and DEM correction coefficient is carried out. Finally, the deformation amount and deformation rate accumulated by time series in SAR coordinate system are converted to geographic coordinate system.
The algorithm implementation of SBAS-InSAR technology can be divided into the following five steps:
(1)
Data preprocessing
The downloaded original radar image is trimmed and processed according to the scope of the study area to improve data processing efficiency. Set relevant threshold parameters in the software to form a small baseline set of the images, produce connection maps, and accurately register with the super main image to form interference pairs. Provide data preparation for subsequent image interference resolution processing.
(2)
Interference solving processing
By using image processing software to perform interference calculations on the generated connection image pairs, adding prepared data according to the SBAS-InSAR data processing steps, and setting the parameters in each step, the human–machine interaction processing of the interference image pairs is achieved, which makes greats preparations for the next step of track refinement. A large amount of data is involved in this process, which is quite time-consuming.
(3)
Track refinement and re-flattening
This process involves calculating orbital errors and phase offsets, removing slope phases, and correcting satellite orbits and phase offsets. The selection of stable Ground Control Points (GCPs) for track refining and re-leveling during the process is extremely important and directly affects the final processing results.
The location and quantity of GCP selection are important, and it is important to choose as many GCPs as possible. Generally, 20–30 GCPs need to be selected, and these GCPs with larger residuals are usually deleted based on the residuals to improve the reliability and accuracy.
(4)
Inversion processing
SBAS inversion needs to be performed twice, and the relatively important one is the first inversion, which is also the first time to estimate deformation rate and residual terrain. Simultaneously perform secondary phase unwrapping to ensure the accuracy of interferogram quality assurance results. The core of the second inversion is to calculate the displacement on the time series, estimate the Atmospheric Phase Screen (APS) and remove the atmospheric phase based on the deformation rate of the first inversion, and ultimately obtain the displacement results on the time series.
(5)
Phase to elevation and geocoding
Firstly, convert the processed phase information into elevation data; then, since the elevation is along the radar line of sight, it is necessary to convert the elevation information from the radar coordinate system to the geographic coordinate system.

4. Results and Analysis Methodology

4.1. SBAS-InSAR Monitored Land Subsidence Results

(1)
Data preprocessing quality analysis
Appropriate spatiotemporal thresholds can not only create high-quality data interference pairs to reduce data processing time, but most importantly, exclude interference pairs with poor quality from the calculation range. The interference pairs formed in the process will be accurately matched with the super main image, as shown in Figure 4 and Figure 5, respectively.
The data processing of SBAS-InSAR was carried out to obtain the position baseline, time baseline, resolution, Doppler difference, and other information of the super main image of each image phase, as shown in Table 2.
According to Table 2 and the analysis of baseline processing report data, the SAR image on 27 September 2017 was set as a super main image, with a total of 1464 days for SBAS-InSAR. The critical baseline is [−5765 m, 5765 m], and the position baseline of this experiment is 225.8476 m, which is much smaller than the above reference value. The maximum Doppler difference admitted is about 291 Hz, and the maximum value in this experiment is 66.0587 Hz, which is less than the allowable value. The pixel spacing ground range is approximately 3.97 m, and the pixel spacing azimuth is approximately 13.91 m. The spatiotemporal baseline of this experiment meets the technical requirements of SBAS-InSAR data processing.
(2)
Data processing workflow
The workflow for SAR image is processed through human–computer interaction. During the process, it is necessary to select the super main image, import external DEM data, set LOS and azimuth thresholds, unwrapping methods, and thresholds. The obtained results need to be subjected to track refinement and refurbishing processing, and then subjected to two inversion operations to obtain the settlement variation, as shown in Figure 6.
(3)
Geocoding
The essence of geocoding is the process of converting the results obtained in the radar coordinate system from the pre-processing to the geographic coordinate system. Through the SBAS-InSAR geocoding process, the average subsidence rate and cumulative subsidence value after geocoding are obtained through polynomial fitting and resampling. It can correct the geometric deformation of SAR images caused by terrain fluctuations and improve the accuracy of the monitoring area. The deformation amount at each time node is shown in Figure 7.

4.2. Land Subsidence Results in Jiaozuo City

The land subsidence in Jiaozuo city is mainly manifested in two characteristics: one is the major subsidence areas in the central regions and the other is the uplift area in the northeast. The settlement in the main urban area of Jiaozuo city is relatively small. The central subsidence areas are mainly distributed in areas with large cultivated land, and the subsidence is mainly concentrated on densely populated areas with village buildings, and the performance of cultivated land is not obvious. An uplift area has emerged in the northeast of Jiaozuo, and a large area of subsidence appearing in the urban–rural integration area and newly built Dashahe Ecological Park area in the southern part of the main urban area of Jiaozuo, and a small area of subsidence appearing in and around Macun District, as shown in Figure 8.
(1) Jiaozuo Daiwang Freight Train Station is an area with significant settlement in the Macun village settlement area, and a detailed analysis should be conducted on this area. Five monitoring points were selected in the area, and settlement process curves were drawn to analyze their settlement process, as shown in Figure 9.
Based on the above analysis, from March 2017 to March 2019, the railway station was basically in a stable state, with minimal settlement and rate. Starting from 21 March 2019, settlement began to occur at all monitoring points of the railway station, and the rate of settlement was relatively high. By March 2021, the settlement had reached −108 mm and the settlement rate had reached −28 mm/a. The analysis results may have some errors, but overall reflect a deformation trend of larger settlement and faster settlement rate at the monitoring points.
The Macun village subsidence area belongs to the land subsidence caused by coal mining. Usually, coal mining subsidence reached over 80% of the maximum subsidence during the active mining period. Afterwards, the settlement entered a period of decline and residual settlement. The settlement process during the residual settlement period was very slow and may last for 15–20 years or even longer. Through on-site investigation, surface cracks appeared on roads and brick concrete structures in the area, as shown in Figure 10.
On an important road that passes through the Macun, multiple cracks occurred due to land subsidence. Some cracks reached a depth of 30 cm and a width of 8–10 cm. In some hazardous areas, the front section of the road was restricted driving, limiting the tonnage of vehicles and the speed of vehicles for driving safety. A number of cracks with a width of approximately 10–30 cm appeared in the walls of some old houses after years of settlement.
(2) There was settlement scope along the He-Bao Expressway between Yingbin Road and Xiuwu Service Area within the urban–rural integration demonstration zone in Jiaozuo city, with an average settlement rate from −11 mm/a to −17 mm/a. There was significant settlement along the Yingbin Road and villages between the Yingbin Road Expressway toll station and Gaocun in Wuzhi County, with an average settlement rate of approximately −10 mm/a to −16 mm/a, as shown in Figure 11.
(3) A raised area appeared in the northeast of Jiaozuo city. There was an aluminum mine, and a tailings pond has been established around the mine. The excavated waste soil and useless rocks were piled up in the tailings pond, causing the surface of the area to rise. The lifting speed was 24 mm/a, and the cumulative lifting reached about 100 mm. These data may not be very accurate, and the uplift speed may far exceed this value. Due to the limitations of SBAS-InSAR itself, local large deformations beyond the wavelength range will not be calculated for uplift.
(4) There are three main reasons for land subsidence in Jiaozuo City: first, the mining of underground coal resources, the surface cracks near the Macun mining area, the road cracks mainly caused by the subsidence of the old mined out area, and the obvious ground cracks appearing at the edge of the settlement bowl. It even caused cracks and collapses in some old houses. Second, overexploitation of groundwater, mainly in land subsidies in agricultural areas. Third, the land supervision affected by the demolition of village buildings and land flatness in the urban–rural integration area. In addition, measures such as the restoration of wasteland, land consolidation, and the accumulation of river water in the Dasha River area ecological management project have led to surface subsidence.

5. Discussion

5.1. Validation of the Research Results

The research in this article has a long time-span and a large regional range. The SAR image processing adopts human–machine interaction, and after setting relevant parameters, the software has a high degree of automation. The SBAS-InSAR technology is also a very mature technology with high credibility, but the results of land subsidence still need to be verified. After collecting literature and data, it was found that during the research period of this article, Tian et al. [38] used both 37 Sentinel-1A data from 26 October 2016 to 9 March 2019 and SBAS-InSAR technology to study land subsidence in the Macun village area under the jurisdiction of Jiaozuo city. The Macun village area belongs to the old goaf of Jiaozuo Coal Mine, and the land subsidence occurs every year, with significant subsidence in some areas. This research paper selected four points of interest (POIs) for subsidence bowl analysis and analyzed the settlement curve patterns of the profile lines of the four settlement areas. The research results indicate that the maximum settlement rate reaches −88 mm/a and the maximum settlement amount reaches −200 mm.
From Tian’s study, it can be seen that the maximum subsidence rates of the two are −88 mm/a (Tian’s study) and −74 mm/a (this paper), respectively, while the data for surface uplift are 12 mm/a (Tian’s study) and 24 mm/a (this paper), respectively. Overall, the difference between subsidence rate and uplift rate is within a reasonable range.
This article shares similarities with Tian’s research. Both studies selected Sentinel 1 data as the data source and used SBAS-InSAR technology for land subsidence monitoring. Moreover, there is a two-year overlap in the time period. Tian’s data was selected from October 2016 to March 2019, and here, the period from March 2017 to March 2021 was chosen. The data processing software used in these two studies is different. This article used SARscape 5.2 software, while Tian used Gamma software(Version number: 20151209). Therefore, there may be some differences in data processing and calculation processes. Through careful comparison, it was found that the location and distribution of the settlement zone, as well as the range of each settlement zone, have good consistency. The difference between settlement values and settlement rates is also within a reasonable range.
According to reference [39], the SBAS InSAR method is used to analyze the land subsidence of Macun, Xiuwu County, in Jiaozuo, and the land subsidence rate and regional distribution of surface deformation from 2017 to 2018 are obtained. The land subsidence caused by coal mining in Jiaozuo city is mainly distributed in the densely distributed areas of Macun District and Xiuwu County. The maximum settlement rate in the main settlement area reached 58 mm/a. This study combines benchmark elevation data to evaluate the reliability of SBAS InSAR technology in monitoring land subsidence, providing reference for the law of surface deformation in mining areas, as well as providing a basis for the prevention and control of subsidence disasters and geological environment protection in the region.

5.2. Impact Factors on the Results of Land Subsidence

(1) Shallow groundwater extraction and irrigation of farmland are the main causes of urban–rural integration subsidence areas.
There is a large amount of farmland in the urban–rural integration area, with winter wheat as the main crop. The irrigation method mainly uses groundwater extraction. When a large amount of groundwater is extracted, causing physical water level lowering, there is a certain land subsidence under the load of village buildings, while the subsidence in the farmland area is not significant. Research has shown that groundwater extraction in this area of Jiaozuo city is relatively severe. The annual mining output of shallow groundwater resources in Jiaozuo city is about 446.8982 million m3, of which the mining output of agricultural irrigation water accounts for 52% of the total mining output [40]. Due to the overexploitation of local groundwater, the groundwater level drops, forming a subsidence bowl and causing a series of environmental problems.
(2) The integration of urban and rural construction, site leveling, and building demolition projects have led to significant settlement in the area.
The area was originally farmland, with an uneven surface and some villages. However, the urban–rural integration construction zone in Jiaozuo city has led to large-scale site leveling and building demolition projects in this area, resulting in more regular and obvious settlement in this area. In addition, the Dasha River landscape ecological restoration project may also be a cause of regional subsidence, as shown in Figure 12.
(3) Local new buildings causing land subsidence
During the construction process of buildings, as the load increases, the ground surface sinks. When a building complex or residential area is completed, a subsidence bowl will be generated in the construction area, forming a larger settlement area. After the construction of some factories, heavy equipment can also cause continuous subsidence of the ground surface. When the subsidence reaches a certain level, the settlement tends to stabilize. As shown in Figure 13, after the construction of the building’s factory building and the completion of equipment installation and commissioning, the factory building began to operate at the end of 2020, with no further increase in load, and the settlement in the area began to flatten out.

6. Conclusions

With the rapid development of urbanization, although Jiaozuo city belongs to a water-rich area, due to factors such as agricultural irrigation extracting groundwater and increasing building loads, land subsidence has become one of the most prominent geological disasters in the integrated construction of urban and rural areas in Jiaozuo city. Land subsidence has caused serious damage to houses, roads, farmland, and other infrastructure. In this study, the time series SBAS-InSAR technology was used to invert the land subsidence within the Jiaozuo city area from 2017 to 2022. The authenticity and correctness of the research results in this article have been verified through comparative analysis of on-site investigations and research on the settlement of Macun. Based on this study, the following conclusions are drawn:
(1)
After research, it was found that satellite radar images and SBAS-InSAR technology contribute to monitoring land subsidence and uplift. The use of this method for surface monitoring produces good results, but large deformations with fast deformation rates are not detected, mainly due to the loss of coherence between images and the inability to invert surface deformation information. Therefore, in urban land subsidence, the deformation process with slow settlement deformation rate has very good monitoring accuracy.
(2)
During this monitoring period, it was found that there is a surface uplift area in the northeast of Jiaozuo. The maximum lifting rate in the lifting area is 24 mm/a, which is located in the tailings pond in the northeast of Jiaozuo city.
(3)
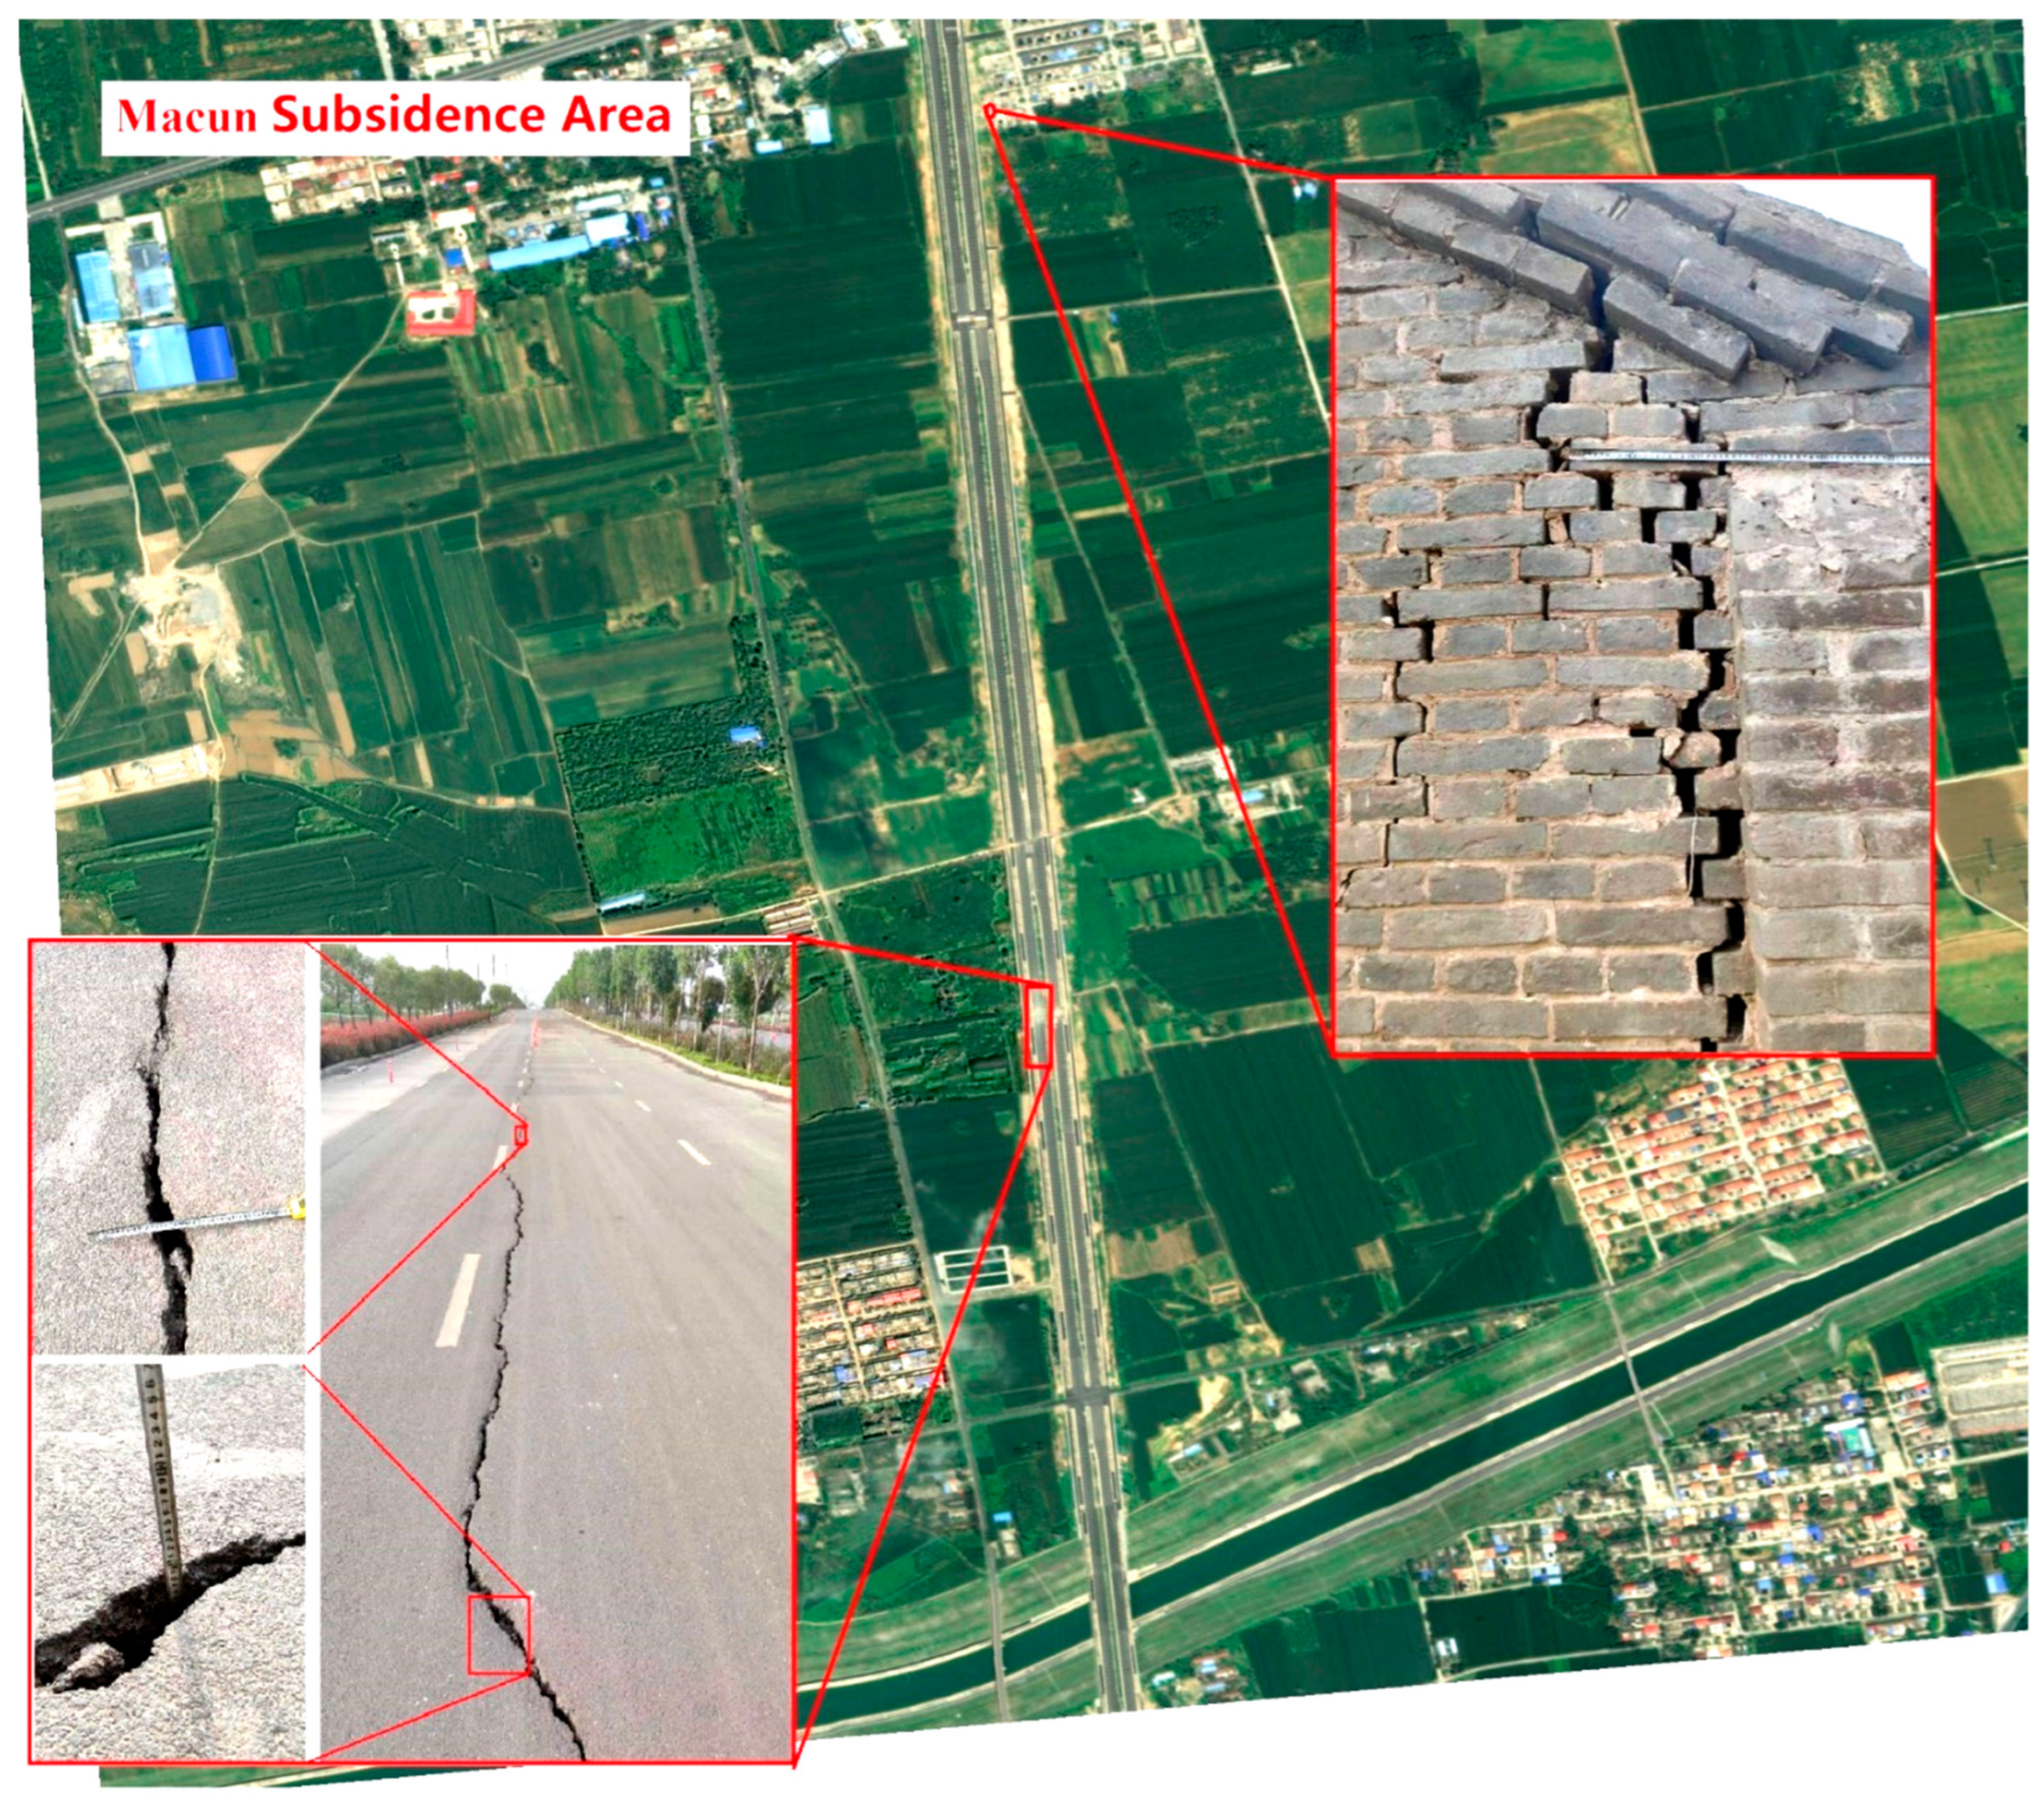
The land subsidence areas of Jiaozuo city are mainly distributed in the urban–rural integration area and the Macun District in the southern part of the main urban area, and the maximum subsidence position is at Daiwang Freight Train Station. According to Daiwang railway station settlement monitoring points analysis, from March 2019, settlement began to occur at various monitoring points of the railway station, and the rate of settlement was relatively fast. By March 2021, the settlement had reached −108 mm and the settlement rate had reached −28 mm/a.

Author Contributions

Conceptualization, Y.H. and G.L.; methodology, G.L.; software, J.L.; validation, J.Y. and G.L.; formal analysis, G.L. and X.X.; investigation, Y.H. resources, J.L. and G.L.; data curation, W.Z. and W.Y.; writing—original draft preparation, G.L.; writing—review and editing, Y.H., G.L., and J.L.; visualization, G.L.; supervision, Y.H. and W.Z.; project administration, W.Y.; funding acquisition, G.L., W.Y., W.Z., and J.L. All authors have read and agreed to the published version of the manuscript.

Funding

This research was funded by the National Natural Science Foundation of China, grant number 42207534, U21A20108, and U22A20620; and by Henan Natural Science Foundation Youth Fund Project, China, grant number 232300421401. Liaoning Province’s education unveiling and commanding project, 2022, (LJKFZ20220282).

Institutional Review Board Statement

Not applicable.

Informed Consent Statement

Not applicable.

Data Availability Statement

The experimental data in this paper adopt the C band SAR data of European Space Agency’s (ESA) Sentinel 1 radar [https://search.asf.alaska.edu/ (accessed on 5 March 2021)]. The precision orbit ephemeris data and Global Digital Elevation Model (GDEM) V2 version data were derived from the following resources available in the public domain: [https://qc.sentinel1.eo.esa.int/] (accessed on 5 March 2021) and [http://www.gscloud.cn/sources/accessdata/] (accessed on 5 March 2021).

Conflicts of Interest

The authors declare no conflict of interest.

References

  1. Candela, T.; Koster, K. The many faces of anthropogenic subsidence. Science 2022, 376, 1381–1382. [Google Scholar] [CrossRef]
  2. Dong, S.; Zhong, Y.; Hu, H.; Huang, L. Ground subsidence monitoring during 2015–2018 in Changzhou based on times series InSAR method. J. NanJing Unvi. (Natrual Sci.) 2019, 55, 370–380. [Google Scholar]
  3. Can, E.; Kuscu, S.; Kartal, M.E. Effects of mining subsidence on masonry buildings in Zonguldak hard coal region in Turkey. Environ. Earth Sci. 2012, 66, 2503–2518. [Google Scholar] [CrossRef]
  4. Dobos, E.; Kovács, I.P.; Kovács, D.M.; Ronczyk, L.; Szűcs, P.; Perger, L.; Mikita, V. Surface Deformation Monitoring and Risk Mapping in the Surroundings of the Solotvyno Salt Mine (Ukraine) between 1992 and 2021. Sustainability 2022, 14, 7531. [Google Scholar] [CrossRef]
  5. Diao, X.; Wu, K.; Chen, R.; Yang, J. Identifying the Cause of Abnormal Building Damage in Mining Subsidence Areas using InSAR Technology. IEEE Access 2019, 7, 172296–172304. [Google Scholar] [CrossRef]
  6. Solarski, M. Anthropogenic transformations of the Bytom area relief in the period of 1883–1994. Environ. Socio-Econ. Stud. 2015, 1, 1–8. [Google Scholar] [CrossRef]
  7. Li, B.; Chen, D.; Wu, S.; Zhou, S.; Wang, T.; Chen, H. Spatio-temporal assessment of urbanization impacts on ecosystem services: Case study of Nanjing City, China. Ecol. Indic. 2016, 71, 416–427. [Google Scholar] [CrossRef]
  8. Sneed, M.; Brandt, J.T. Land subsidence in the San Joaquin Valley, California, USA, 2007–2014. Proc. Int. Assoc. Hydrol. Sci. 2015, 372, 23–27. [Google Scholar] [CrossRef]
  9. Jaeger, J.; Schwick, C. Improving the measurement of urban sprawl: Weighted Urban Proliferation (WUP) and its application to Switzerland. Ecol. Indic. 2014, 38, 294–308. [Google Scholar] [CrossRef]
  10. Nádudvari, Á. Using radar interferometry and SBAS technique to detect surface subsidence relating to coal mining in Upper Silesia from 1993–2000 and 2003–2010. Environ. Socio-Econ. Stud. 2016, 4, 24–34. [Google Scholar] [CrossRef] [Green Version]
  11. Xiao, R.; Yu, C.; Li, Z.; Jiang, M.; He, X. InSAR stacking with atmospheric correction for rapid geohazard detection: Applications to ground subsidence and landslides in China. Int. J. Appl. Earth Obs. Geoinf. 2022, 115, 103082. [Google Scholar]
  12. Zhu, Y.; Xing, X.; Chen, L.; Yuan, Z.; Tang, P. Ground Subsidence Investigation in Fuoshan, China, Based on SBAS-InSAR Technology with TerraSAR-X Images. Appl. Sci. 2019, 9, 2038. [Google Scholar] [CrossRef] [Green Version]
  13. Sahadevan, D.K.; Pandey, A.K. Groundwater over-exploitation driven ground subsidence in the Himalayan Piedmont zone: Implication for aquifer health due to urbanization. J. Hydrol. 2023, 617, 129085. [Google Scholar] [CrossRef]
  14. Ramirez, R.A.; Kwon, T.H. Sentinel-1 Persistent Scatterer Interferometric Synthetic Aperture Radar (PS-InSAR) for Long-Term Remote Monitoring of Ground Subsidence: A Case Study of a Port in Busan, South Korea. KSCE J. Civ. Eng. 2022, 26, 4317–4329. [Google Scholar] [CrossRef]
  15. Liu, H. Surface Subsidence Monitoring and Analysis in Jiaozuo Region Based on SBAS-InSAR Technology. Master’s Thesis, Henan Polytechic University, Jiaozuo, China, 2021. [Google Scholar]
  16. Cigna, F.; Esquivel Ramírez, R.; Tapete, D. Accuracy of Sentinel-1 PSI and SBAS InSAR Displacement Velocities against GNSS and Geodetic Leveling Monitoring Data. Remote Sens. 2021, 13, 4800. [Google Scholar] [CrossRef]
  17. Verberne, M.; Koster, K.; Lourens, A.; Gunnink, J.; Candela, T.; Fokker, P.A. Disentangling shallow subsidence sources by data assimilation in a reclaimed urbanized coastal plain, South Flevoland polder, the Netherlands. J. Geophys. Res. Earth Surf. 2023, 128, e2022JF007031. [Google Scholar] [CrossRef]
  18. Solarski, M.; Machowski, R.; Rzetala, M.; Rzetala, M.A. Hypsometric changes in urban areas resulting from multiple years of mining activity. Sci. Rep. 2022, 12, 2982. [Google Scholar] [CrossRef]
  19. Bevan, S.L.; Luckman, A.; Khan, S.A.; Murray, T. Seasonal dynamic thinning at helheim glacier. Earth Planet. Sci. Lett. 2015, 415, 47–53. [Google Scholar] [CrossRef] [Green Version]
  20. Thapa, S.; Chatterjee, R.S. Estimation of atmospheric effects of RADARSAT-2 D-InSAR product using ground based and space borne meterological data. Int. Arch. Photogramm. Remote Sens. Spat. Inf. Sci. 2015, 40, 243–246. [Google Scholar] [CrossRef] [Green Version]
  21. Wu, Q.; Jia, C.; Chen, S.; Li, H. SBAS-InSAR based deformation detection of urban land, created from mega-Sacle mountain excavating and valley filling in the loess plateau: The Case Study of Yan’an City. Remote Sens. 2019, 11, 1673. [Google Scholar] [CrossRef] [Green Version]
  22. Cigna, F.; Bateson, L.B.; Jordan, C.J.; Dashwood, C. Simulating SAR geometric distortions and predicting Persistent Scatterer densities for ERS-1/2 and ENVISAT C-band SAR and InSAR applications: Nationwide feasibility assessment to monitor the landmass of Great Britain with SAR imagery. Remote Sens. Environ. 2014, 152, 441–466. [Google Scholar] [CrossRef] [Green Version]
  23. Xu, Y.; Li, T.; Tang, X.; Zhang, X.; Fan, H.; Wang, Y. Research on the Applicability of DInSAR, Stacking-InSAR and SBAS-InSAR for Mining Region Subsidence Detection in the Datong Coalfield. Remote Sens. 2022, 14, 3314. [Google Scholar] [CrossRef]
  24. Berardino, P.; Fornaro, G.; Lanari, R.; Sansosti, E. A New Algorithm for Surface Deformation Monitoring Based on Small Baseline Differential SAR Interferograms. IEEE Trans. Geosci. Remote Sens. 2002, 40, 2375–2383. [Google Scholar] [CrossRef] [Green Version]
  25. Zhuo, G.; Dai, K.; Huang, H.; Li, S.; Shi, X.; Feng, Y.; Li, T.; Dong, X.; Deng, J. Evaluating potential ground subsidence geo-hazard of Xiamen Xiang’an new airport on reclaimed land by SAR interferometry. Sustainability 2020, 12, 6991. [Google Scholar] [CrossRef]
  26. Casu, F.; Elefante, S.; Imperatore, P.; Zinno, I.; Manunta, M.; De Luca, C.; Lanari, R. SBAS-DInSAR parallel processing for deformation time-series computation. IEEE J. Sel. Top. Appl. Earth Obs. Remote Sens. 2014, 7, 3285–3296. [Google Scholar] [CrossRef]
  27. Can, E.; Kuscu, S.; Mekik, C. Determination of underground mining induced displacements using GPS observations in Zonguldak-Kozlu Hard Coal Basin. Int. J. Coal Geol. 2012, 89 (Suppl. S1), 62–69. [Google Scholar] [CrossRef]
  28. Orhan, O. Monitoring of land subsidence due to excessive groundwater extraction using small baseline subset technique in Konya, Turkey. Environ. Monit. Assess 2021, 193, 174. [Google Scholar] [CrossRef]
  29. Orhan, O.; Oliver-Cabrera, T.; Wdowinski, S.; Yalvac, S.; Yakar, M. Land subsidence and its relations with sinkhole activity in Karapınar region, Turkey: A multi-sensor InSAR time series study. Sensors 2021, 21, 774. [Google Scholar] [CrossRef]
  30. Zhu, W.; Li, W.L.; Zhang, Q.; Yang, Y.; Zhang, Y.; Qu, W.; Wang, C.S. A decade of ground deformation in Kunming (China)revealed by multi-temporal synthetic aperture radar interferometry (InSAR) technique. Sensors 2019, 19, 4425. [Google Scholar] [CrossRef] [Green Version]
  31. Xiong, P.; Zuo, X.; Li, Y.; You, H. Application of dual-polarized Sentinel-1 data to subsidence monitoring in Kunming. Prog. Geophys. 2020, 4, 1317–1322. [Google Scholar]
  32. Jiang, N.; Zuo, X.; Wang, Z.; You, H.; Zhao, Y. Monitoring land settlement in the main urban area of Kunming based onPS-InSAR and SBAS-InSAR. J. Guizhou Univ. (Natural Sci.) 2020, 37, 72–78. [Google Scholar]
  33. Wang, L.; Lian, Z.; Liu, J. Urban surface subsidence monitoring based on SBAS-InSAR technology and Sentinel-1A. Geospat. Inf. 2022, 20, 59–64. [Google Scholar]
  34. Wang, Z. Sustainable Development Suffering Over exploitation of Ground water Land Subsidence and its Conflicting in Suzhou Wuxi Changzhou area, Jiangsu Province. Chin. J. Geol. Hazard Control. 1998, 9, 18–26. [Google Scholar]
  35. Li, F.; Gong, H.; Chen, B.; Gao, M.; Zhou, C.; Guo, L. Understanding the Influence of Building Loads on Surface Settlement: A Case Study in the Central Business District of Beijing Combining Multi-Source Data. Remote Sens. 2021, 13, 3063. [Google Scholar] [CrossRef]
  36. Harnischmacher, S.; Zepp, H. Mining and its impact on the earth surface in the Ruhr District (Germany). Z. Fur Geomorphol. 2014, 58 (Suppl. S3), 3–22. [Google Scholar] [CrossRef]
  37. Lee, D.K.; Mojtabai, N.; Lee, H.B.; Song, W.K. Assessment of the influencing factors on subsidence at abandoned coal mines in South Korea. Environ. Earth Sci. 2013, 68, 647–654. [Google Scholar] [CrossRef]
  38. Tian, F.; Yang, Y.; Wu, K. Application of time series InSAR technology in monitoring land subsidence in Macun District. Beijing Surv. Mapp. 2020, 34, 96–99. [Google Scholar]
  39. Dong, H.W. Monitoring and analysis of land subsidence in Jiaozuo based on SBAS InSAR technology. Master’s Thesis, Chang’an University, Xi’an, China, 2021. [Google Scholar] [CrossRef]
  40. Liu, C.; Fan, D.; Wei, Y.; Zhang, D. Evaluation and Development of Shallow Groundwater Resources in Jiaozuo City. J. Yellow River Water Conserv. Vocat. Tech. Coll. 2022, 34, 1–6+17. [Google Scholar]
Figure 1. The location of Jiaozuo city in China and the study area.
Sustainability 15 11737 g001
Figure 2. The DEM of the study area.
Sustainability 15 11737 g002
Figure 3. Technical flow chart of SBAS-InSAR.
Sustainability 15 11737 g003
Figure 4. Spatiotemporal baseline distribution.
Sustainability 15 11737 g004
Figure 5. Time-position Delaunay 3D baseline.
Sustainability 15 11737 g005
Figure 6. Data processing results (partial). (a) Coherence coefficient map, (b) filtered interferogram, (c) flattened interferogram, and (d) phase unwrapping map.
Sustainability 15 11737 g006
Figure 7. Map of settlement process after geocoding, (a) 19/03/2017–23/06/2017, (b) 19/03/2017–14/11/2017, (c) 19/03/2017–07/04/2018, (d) 19/03/2017–29/08/2018, (e) 19/03/2017–20/01/2019, (f) 19/03/2017-13/06/2019, (g) 19/03/2017–04/11/2019, (h) 19/03/2017–08/04/2020, (i) 19/03/2017–23/09/2020.
Sustainability 15 11737 g007
Figure 8. Research on key subsidence areas.
Sustainability 15 11737 g008
Figure 9. Daiwang railway station settlement monitoring points. (a) The monitoring points of Daiwang railway station. (b) Monitoring point settlement process curve.
Sustainability 15 11737 g009
Figure 10. On-site investigation of the Macun subsidence area.
Sustainability 15 11737 g010
Figure 11. Analysis of settlement monitoring in the urban–rural integration demonstration zone of Jiaozuo city. (a) The monitoring points of urban–rural integration demonstration zone. (b) Monitoring point settlement process curve.
Sustainability 15 11737 g011
Figure 12. Deformation characteristics of ground and settlement rate.
Sustainability 15 11737 g012
Figure 13. Analysis of building settlement process.
Sustainability 15 11737 g013
Table 1. Relevant parameters of Sentinel-1A SAR images.
TimeData PatternPolarization ModeNumber of ImagesIncident Angle
(°)
Ascending/Descending
Orbits
19/03/2017~22/03/2021IW SLCVV3138.96Ascending
Table 2. Baseline parameters table.
No.TimeDayPosition
(m)
Pixel Spacing Ground Range (m)Pixel Spacing Azimuth (m)Doppler Difference
(Hz)
119-03-201719248.28343.971813.911146.2154
206-05-2017144−36.66353.971313.911240.8638
323-06-20179696.14473.971313.911224.6913
410-08-20174891.01103.971513.911148.9420
Master27-09-201700.00003.971613.91110.0000
614-11-201748132.15793.971913.911011.1395
701-01-201896225.84763.972013.910966.0587
818-02-201814472.48643.971913.911057.6407
907-04-201819285.63673.971713.911132.8287
1025-05-20182402.33753.971413.911239.7597
1112-07-2018288143.69963.971413.911222.0503
1229-08-201833639.50043.971513.911131.8539
1316-10-201838424.99853.971713.911134.2897
1403-12-2018432117.97133.972013.910940.7119
1520-01-2019480116.15983.971913.911046.3325
1609-03-201952833.50863.971913.911020.7520
1726-04-201957658.06753.971413.91122.0768
1813-06-2019624134.67593.971513.91127.7040
1931-07-2019672125.95163.971513.911119.2722
2017-09-201972086.41143.971513.911113.0131
2104-11-201976814.58883.971913.911018.0836
2222-12-2019816124.66733.972013.910932.5743
2308-02-2020864123.56703.971913.910930.4780
2408-04-2020924126.91133.971713.911016.3682
2507-06-2020984150.09123.971413.9114−28.8088
2606-08-2020104499.03883.971513.911128.5824
2723-09-2020109226.14653.971513.91113.9321
2810-11-2020114067.48733.971913.911016.1891
2928-12-20201188157.40883.972013.910919.5262
3002-02-2021122448.47913.972013.91095.1707
3122-03-2021127275.48563.971813.911010.3901
Disclaimer/Publisher’s Note: The statements, opinions and data contained in all publications are solely those of the individual author(s) and contributor(s) and not of MDPI and/or the editor(s). MDPI and/or the editor(s) disclaim responsibility for any injury to people or property resulting from any ideas, methods, instructions or products referred to in the content.

