Article

Can Global Value Chain Upgrading Promote Regional Economic Growth? Empirical Evidence and Mechanism Analysis Based on City-Level Panel Data in China

1
School of Business Administration, Northeastern University, Shenyang 110167, China
2
School of Financial Management, Hainan College of Economics and Business, Haikou 571127, China
3
Research Institute for Global Value Chains, University of International Business and Economics, Beijing 100029, China
4
Laboratory for Global Value Chains, University of International Business and Economics, Beijing 100029, China
5
Agricultural Information Institute, Chinese Academy of Agricultural Sciences, Beijing 100081, China
6
Key Laboratory of Agricultural Big Data, Ministry of Agriculture and Rural Affairs, Beijing 100081, China
*
Authors to whom correspondence should be addressed.
Sustainability 2023, 15(15), 11732; https://doi.org/10.3390/su151511732
Submission received: 26 June 2023 / Revised: 27 July 2023 / Accepted: 27 July 2023 / Published: 29 July 2023

Abstract

:
Since launching its reforms and opening up, China has actively integrated itself into global value chains (GVCs) and experienced continuous growth. However, there exists a significant imbalance between GVC upgrading and economic growth across regions in China. Can GVC upgrading promote economic growth at the regional level? Despite the theoretical foundations and empirical evidence provided at the national level, research on GVC upgrading at the subnational level remains limited. This study constructs a temporal indicator to measure GVC upgrading at the finest subnational level, including cities at the prefecture level and above, and employs panel fixed effects (FE) and mediation models to examine the impact and mechanism of GVC upgrading on regional economic growth, aiming for a meaningful exploration in this area. The results show that GVC upgrading has a significant positive effect on regional economic growth with robust performance. Specifically, a 1-standard-deviation improvement in GVC upgrading leads to a 0.054-standard-deviation increase in the logarithm of per capita gross domestic product (GDP). Heterogeneity analysis shows that the promotion effect is more pronounced in coastal areas and administrative centers. Mechanism analysis indicates that GVC upgrading promotes regional economic growth by facilitating capital accumulation, promoting technological progress, and enhancing human resources, among which, facilitating capital accumulation plays the most significant role, accounting for over 70% of the economic growth effects associated with GVC upgrading. Thus, China should create an enabling environment for promoting GVC upgrading, enhance capital accumulation, foster regional innovation systems, improve the quality of human capital, and promote domestic market integration.

1. Introduction

The global economy is becoming increasingly organized around global value chains (GVCs) for production and trade [1]. Enterprises carry out their investment, production and trade activities on a global scale, and many countries participate in the production of each product. This has become the most prominent feature of current international trade [2]. The proportion of GVCs in world trade, economic aggregates and employment continue to rise, making it the core mode of global trade expansion [3]. This has supported decades of economic growth and brought unprecedented opportunities for developing countries [4]. Since its reform and opening up, China has actively integrated itself into the global production network. According to statistics from the World Trade Organization (WTO), in 2018, China’s GVC participation rate was 36.6%, with an average annual growth rate of 6.8% from 2010 to 2018. While China is deeply involved in GVCs, its participation and economic growth show great regional imbalances [5]. As the largest developing country, is GVC upgrading conducive to regional economic development in China? What are the mechanisms through which GVC upgrading influences regional economic growth? Do the effects show heterogeneity among different regions? These are the main questions this study aims to answer.
GVCs refer to the networks of production division and trade that involve many countries and regions [6,7] or the “fragmentation” and internationalization of the production process, leading to the trade of intermediate goods and services [8]. From a developmental perspective, a new feature of GVCs is that factories in developing countries have become full participants in international manufacturing networks [9]. Existing studies have verified mainly the relationship between GVCs and specific aspects of economic development, such as technological progress [10,11], investment [12,13], and employment [14,15], in developing countries at the national, sectoral, and firm levels. Findings indicate that the continuous expansion and deepening of GVCs provides unprecedented opportunities for developing countries to improve their own economic development level and production efficiency by participating in the global division of production, imitating international advanced technology and learning management experiences [16]. This makes effective GVC upgrading crucial to their development [17]. However, there is limited empirical research examining the direct relationship between GVCs and economic growth, with some studies suggesting a positive relationship between GVC participation and economic growth [18,19] and others indicating a potentially negative relationship [20,21].
Overall, existing research provides a solid foundation on which to understand the impact of GVC upgrading on economic growth in developing countries. However, there is a lack of empirical studies directly analyzing the impact [22] and mechanisms of GVC upgrading on economic growth at the subnational level. Against the background of deepening globalization and global production divisions, the economic development of a region depends not only on its own domestic environment but also on its position in the global production and trade network [23]. Taking China as an example, significant differences in GVC upgrading and economic growth among different regions can be seen, but existing studies mostly focus on the factors influencing GVC upgrading [24,25] or the relationship between GVC upgrading and innovation [26].
In contrast to most of the literature, this study focuses on the finest subnational level—cities at the prefecture level and above—to examine the impact of GVC upgrading on regional economic growth and analyze the underlying mechanisms. In this regard, this work is one of the early attempts. The development of the Chinese economy is based mainly on cities at the prefecture level and above. There are significant differences in resource endowments among different cities, which in turn affect their GVC upgrading and economic development [27]. The city perspective provides richer information and is more meaningful in reality, offering deeper empirical evidence and insights into the impact and mechanisms of GVCs on regional economic growth. The analysis results demonstrate that GVC upgrading significantly contributes to the economic growth of Chinese cities as a whole, but there are significant heterogeneities across regions. Capital accumulation, technological progress, and human resource improvement are important pathways through which GVC upgrading promotes regional economic growth, with capital accumulation playing the most significant role, explaining over 70% of the economic growth effects brought about by GVC upgrading.
This study makes several contributions to the literature. First, it matches customs trade data to cities at the prefecture level and above and constructs indicators to measure GVC upgrading in Chinese cities based on product complexity. This approach represents the most detailed sample selection method currently feasible, enabling the more effective capture of the dynamic characteristics and heterogeneity of regional GVC upgrading in China. Second, this study examines the impact of GVC upgrading on regional economic growth, enriching the relevant research on GVC and regional economic growth. Third, it investigates the channels through which GVC upgrading affects regional economic growth, including capital accumulation, technological progress, and human capital enhancement, providing policy recommendations to harness the positive effects of GVC upgrading on economic growth. Fourth, this study examines the heterogeneity of the impact of GVC upgrading on economic growth across different regions, which is crucial for identifying strategies to promote economic transformation and regional coordination in developing economies like China.
The rest of this paper is organized as follows. Section 2 provides a literature review. Section 3 presents the theoretical explanations and transmission mechanisms of GVC upgrading on regional economic growth and proposes research hypotheses. Section 4 describes the empirical model, data and methods adopted in this study. Section 5 presents the empirical results. Section 6 concludes the study and provides policy recommendations.

2. Literature Review

2.1. Impact of GVCs on Economic Growth

In the various stages of the development of economic growth theory, economists have paid close attention to the role of international trade in economic growth and established systematic theories of international trade. Trade theories, such as comparative advantage theory, factor endowment theory, and new trade theory, form an important theoretical foundation for studying the dynamic relationship between GVCs and economic growth as GVCs fundamentally involve international production specialization and trade. The possible pathways through which trade promotes economic growth include promoting specialization and division of labor, achieving economies of scale, generating technology spillovers, promoting competition and selection effects, and improving resource allocation efficiency [28].
The literature has found a positive correlation between GVCs and economic growth [4]. Jangam and Rath studied a sample of 58 countries involved in GVCs from 2005 to 2015 and found that trade, particularly that related to GVCs, drives economic growth and that the impact of GVC participation on economic growth varies across sectors [18]. Boffa et al. found a positive effect of GVC participation on GDP per capita, which diminishes as per capita GDP increases, indicating that low-income countries can obtain greater economic growth effects from GVC participation [19].
Due to data limitations, empirical studies on the impact of GVCs on economic growth are still relatively limited. Most studies analyze the impact of GVCs on economic growth in developing economies through indirect effects such as technology spillovers and competition promotion. Latecomer countries can acquire higher-quality intermediate inputs [29], leverage foreign knowledge (technology) embedded in GVCs to promote innovation [30], and achieve catch-up through a “learning-by-doing” or “learning-by-using” process [31]. GVC participation can also enhance productivity through “selection effects” and “resource reallocation,” thereby increasing the proportion of highly skilled labor, promoting the upgrading of human capital [32], and ultimately stimulating economic growth. Most of these studies examine the role of GVC participation in technological progress and upgrading in developing countries at the national, industry, or firm level [33,34].
However, a considerable number of studies have expressed concerns about the possible negative effects of GVCs on developing countries. These concerns include the possibility of hindering skill-biased technological progress [11], resulting in “low-end lock-in” [21] and capture effects [35], as well as being trapped in the lower value-added production and assembly stages within GVCs. Developing countries may struggle to leverage their abundant unskilled labor endowments and lose comparative advantage in manufacturing [10]. Some studies have found that GVCs have a positive impact on economic growth in countries with higher economic growth, but they have a negative or nonsignificant [36] impact on economic growth in less developed countries [20].

2.2. Measurement of GVCs

Accurately measuring the GVC participation and upgrading levels in a country or region has been a core issue in GVC research. Early studies attempted to describe the actual structure of GVCs based on “product-level” data and cases of individual multinational enterprises [37], but the application of this approach is limited when considering macroeconomic issues such as trade policies. In their pioneering study, Hummels et al. proposed the concept of vertical specialization (VS), which measures the degree of an economy’s GVC integration by measuring the foreign value-added component contained in its exports [16]. The above authors found that GVC accounted for a significant share of trade growth in world trade from the 1970s to the 1990s. The introduction of VS was groundbreaking and laid the theoretical foundation for many studies, such as those by Koopman et al. [38]. However, this indicator does not account for the domestic value-added components absorbed by foreign countries. In recent studies, this indicator has rarely been used independently to measure a country’s level of GVC position or upgrading. After an improvement by Upward et al. [39], the VS measure has recently been commonly used to assess the level of GVC embeddedness [40,41].
Koopman et al. developed a comprehensive approach that decomposes total exports into different value-added sources [38,42], and Wang et al. created value-added-based indices for GVC participation and GVC position [43], both using international input—output (IO) tables. The larger the GVC position index, the closer the economy is to the upstream of the GVCs as a provider of intermediate goods rather than as a demander of foreign intermediates [44]. This method has been widely applied [45,46], but its calculation is complex and limited by the availability of IO data, making it difficult to directly apply it to regional- or city-level analysis.
Regarding research on regional GVC participation in China, some studies start by combining provincial multiregional IO tables and international IO tables to construct a GVC decomposition framework [47]. However, a problem lies in the fact that regional IO tables in China are compiled only once every five years, leading to significant time gaps; thus, this method cannot accurately capture the dynamic characteristics of GVC upgrading. Moreover, this method is also constrained by the timing of updates to international IO tables [24]. The most commonly used international IO tables, such as those from the World Input–Output Database (WIOD), are updated only until 2014, and the United Nations Conference on Trade and Development (UNCTAD)-Eora database is updated only until 2016 [48].
In regard to more detailed subnational levels, such as cities at the prefecture level and above, GVC analysis faces limitations due to the unavailability of city-level IO tables provided by the National Bureau of Statistics of China. There are two other methods in existing research that can allow for the measurement of GVC upgrading without requiring IO data. The first method is the export product price index, which compares the relative export prices of two countries to the same country [49]. This method is relatively simple but less accurate, providing limited information. Some research has constructed a GVC bargaining power index based on this index to measure the GVC division position [50].
The other method is the export technical complexity index, which is derived from the trade specialization index proposed by Michaely [51] and improved and formally proposed by Rodrik and Hausmann [52]. Hausmann and Hidalgo further refined the index based on the “reflection method” from the perspectives of ubiquity and diversity [53]. Export technical complexity can be measured at the product- or industry-specific level by using the data on the export and income level of the exporting country, without requiring specific data on the R&D input of specific products. Due to this advantage, the export technical complexity index has been widely applied in the study of GVC position at the national, regional, industry, and even firm levels [54,55]. This study adopts this index to analyze GVC upgrading in Chinese cities, and the required microdata on product exports are obtained from the China Customs database. However, due to the time span limitations of the database, almost all recent studies on GVCs at the city level in China have based their research on data only until 2016 [27,56].

2.3. Literature Evaluation

In summary, the literature provides rich and profound insights into understanding the impact of GVC upgrading on economic growth at the subnational level in developing countries, laying a solid foundation for this study. These achievements serve as theoretical references, logical starting points, and methodological references, which are undoubtedly important and necessary. However, there remains limited research specifically investigating the direct impact of GVC upgrading on economic growth, particularly at the subnational level in China. As the largest developing country, China exhibits significant variations in GVC upgrading and economic growth across regions. A deeper understanding of the characteristics and mechanisms of the impact of GVC upgrading on regional economic development from a more detailed perspective is essential to provide more practical policy recommendations for promoting regional GVC upgrading and driving economic transformation and coordinated development in developing economies like China. Therefore, this study focuses on the finest subnational level, namely, cities at the prefecture level and above, to analyze the impact of GVC upgrading on regional economic development and to examine the underlying mechanisms within a feasible scope. Furthermore, traditional GVC indicators based on IO tables are insufficient for measuring GVC upgrading at the city level. Therefore, this study constructs suitable indicators for measuring GVC upgrading in Chinese cities based on the customs micro database, which establishes panel data for consecutive years to capture the dynamic effects of GVC upgrading on regional economic growth.

3. Theoretical Analysis and Research Hypotheses

3.1. Theoretical Explanations of the Influence of GVC Upgrading on Regional Economic Growth

First, GVC specialization refers to the global division of labor within industries or products, representing a form of international production sharing. The economic mechanism applicable to the economic effect of the international division of production is also applicable to GVC specialization. According to the comparative advantage theory, the GVC division of labor enables a country or region to leverage its comparative advantage. Based on new trade theory, or the theory of increasing returns to scale, a country’s specialization in a specific production stage is conducive to the exploitation of the scale benefits of production links within the context of the GVC division of labor. Additionally, according to new economic geography theory, the spatial agglomeration of production stages can reduce transaction costs and improve production efficiency [57]. Furthermore, according to Melitz’s (2003) new trade theory (or heterogeneous firm theory) [58], the GVC division of labor allows resources to be reallocated among firms within the same industry or production stage through the “selection effect” and “resource reallocation effect”, thereby improving the production efficiency and resource utilization efficiency [32].
Second, GVC upgrading provides greater opportunities for regional economic growth. According to the “smile curve,” moving from downstream production, such as assembly stages, to upstream research and service stages within GVCs can yield higher returns and promote economic development. Through intermediate goods trade, developing countries can learn and absorb advanced technologies from developed countries, achieve GVC upgrading, and stimulate economic growth.

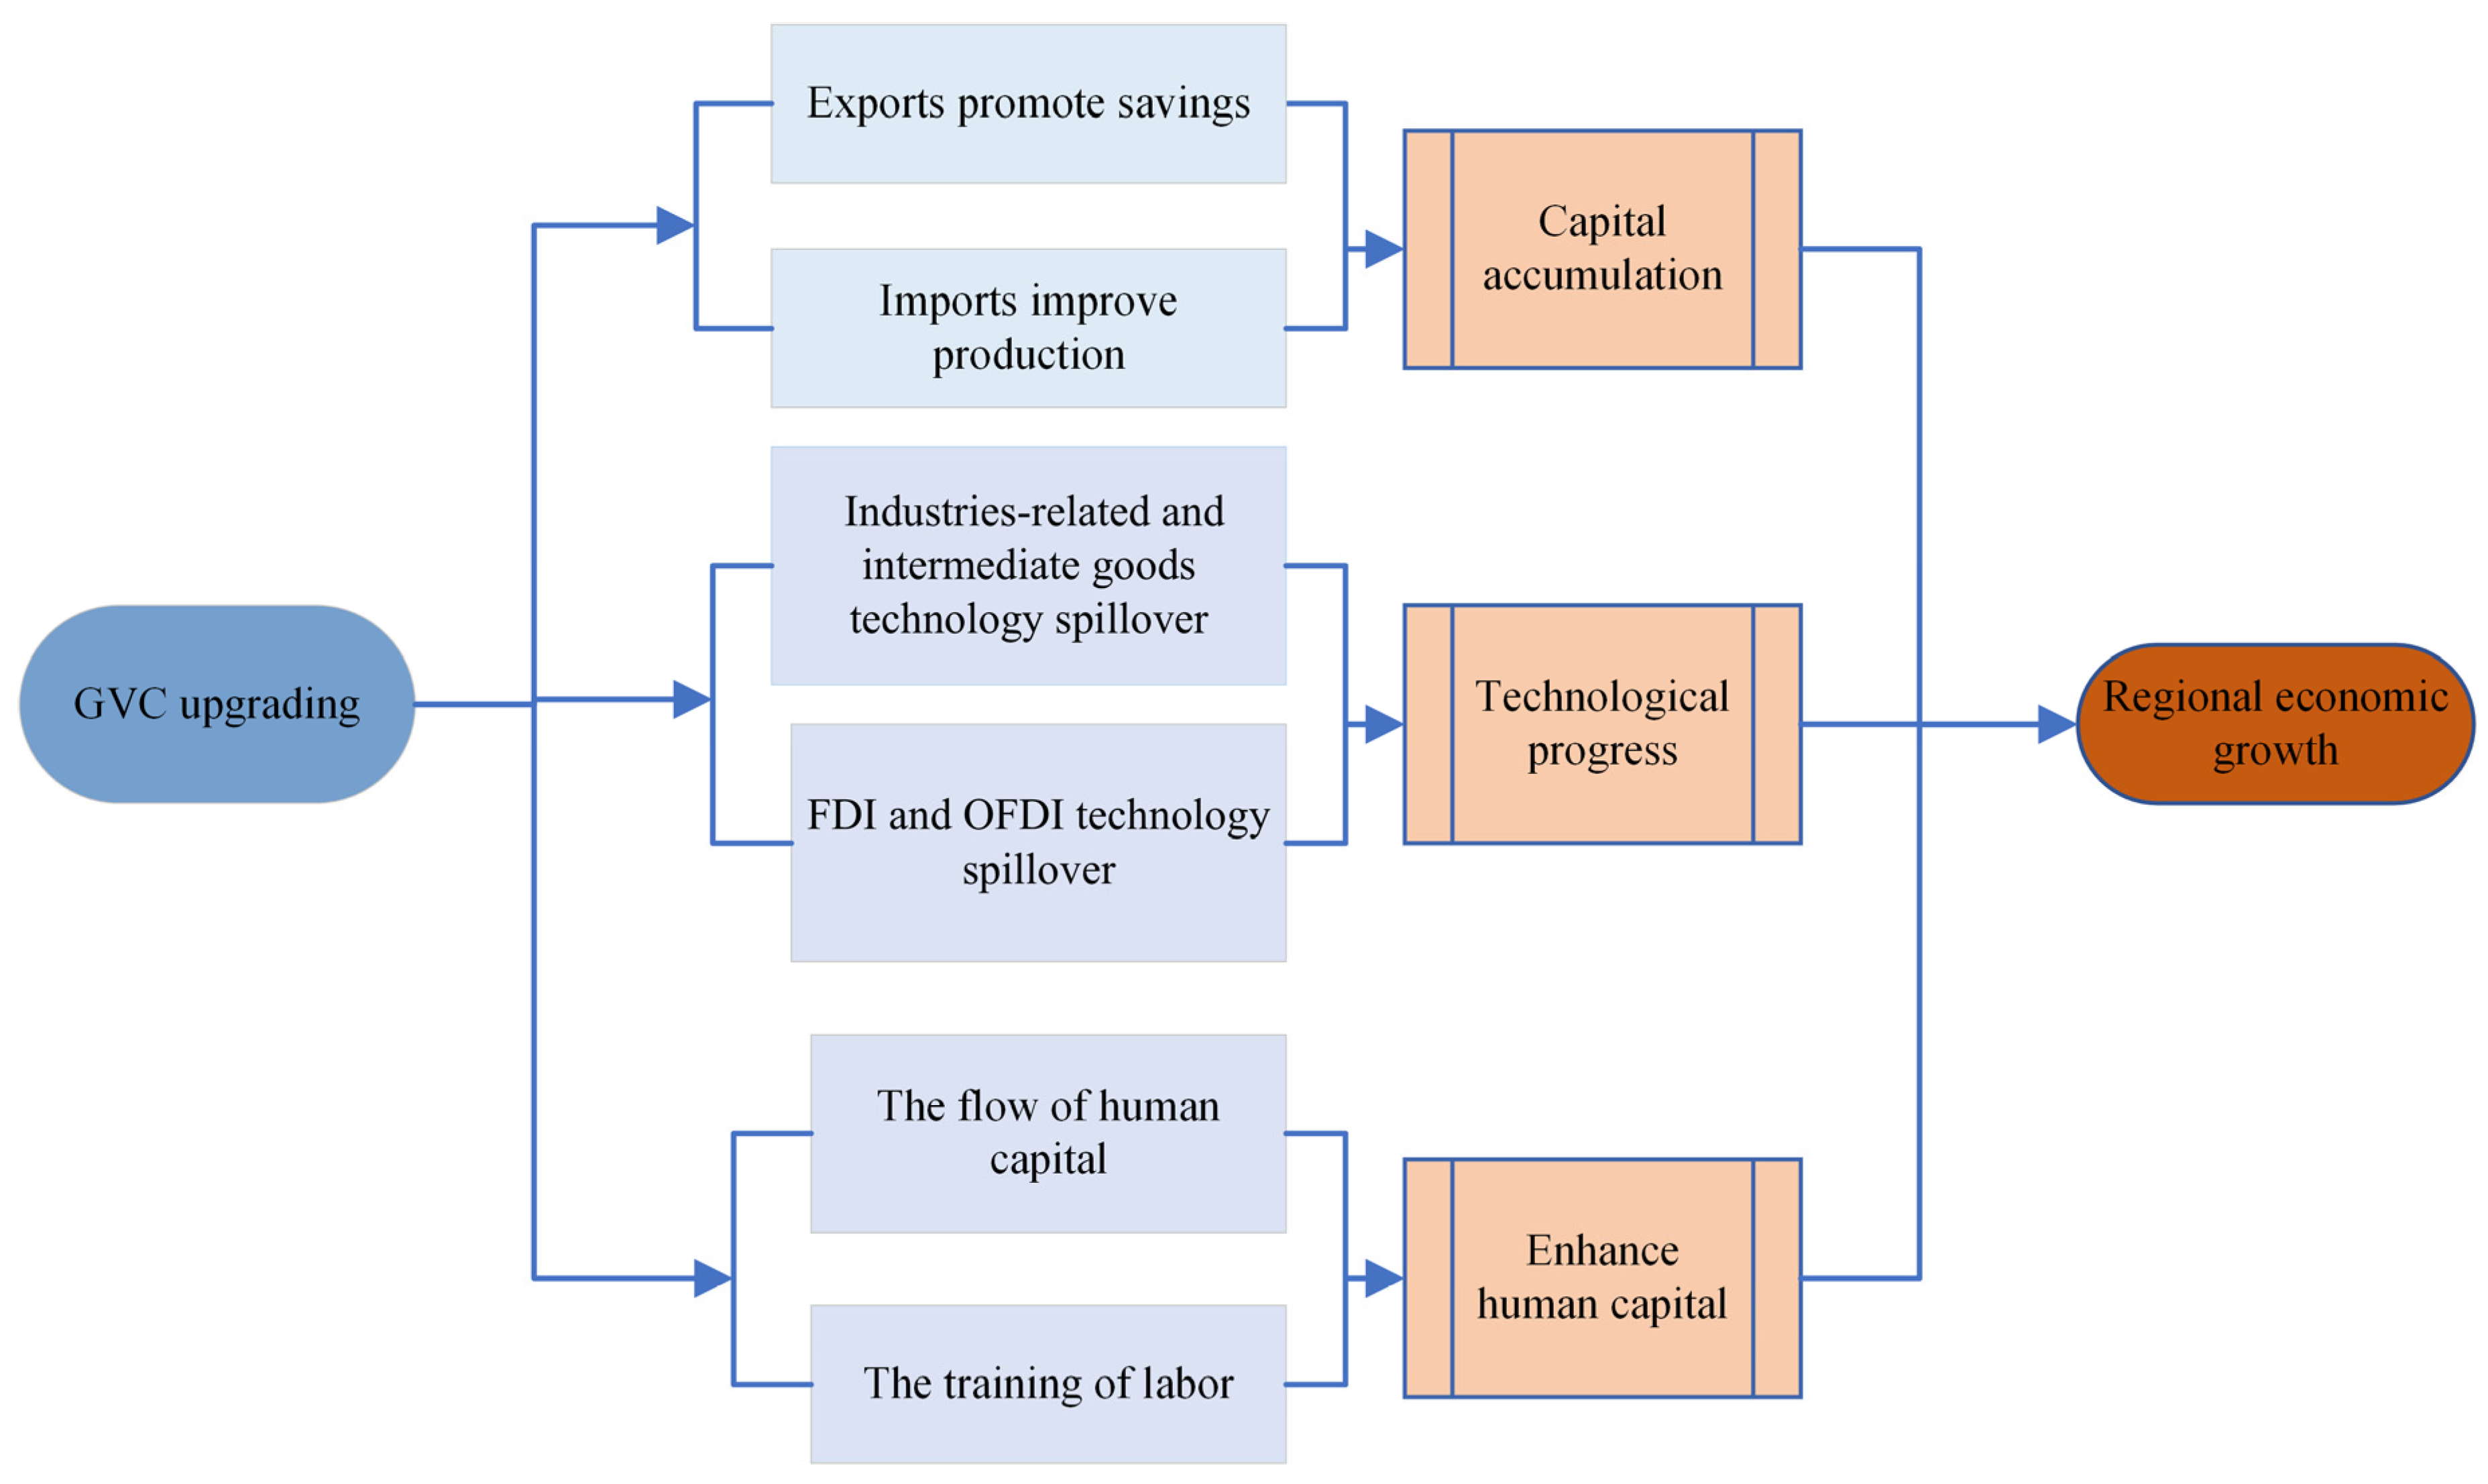
3.2. Impact Mechanisms of GVC Upgrading on Regional Economic Growth

3.2.1. Facilitating Capital Accumulation

Participation in GVCs can influence the level of capital accumulation in a country or region through two channels: exports and imports. First, exporting serves as a form of saving, and savings and investment can be mutually converted under certain conditions. Promoting exports through GVC upgrading can improve the capital stock level in the next period. Importantly, the impact of exports on capital accumulation varies in different stages of GVC upgrading. In the initial stage of GVC upgrading, the country or region mostly exports primary products, such as agricultural and mineral products, which have a single structure, low demand elasticity, strong price fluctuation and low technological content. As a result, the short-term investment effect is small and unstable, leading to relatively low contributions to capital accumulation. In the second stage of GVC upgrading, the exported products are diversified industrial goods. In this case, GVC participation can effectively stimulate investment, delay the decline in capital returns, attract foreign capital, rapidly increase short-term investment and promote capital accumulation. When countries enter the advanced stage of GVC upgrading, their exported products are highly specialized knowledge-intensive and technology-intensive products. In this case, the short-term investment brought about by exports is of higher quality, although the growth rate may decline. Thus, GVCs play a more prominent role in promoting economic development through technological progress and human capital enhancement.
Second, through the import of intermediate and capital goods, enterprises cannot only obtain materials and inputs that are relatively scarce in their own countries but can also realize innovation and improvement in domestic production processes to enhance productivity.

3.2.2. Promoting Technological Advancement

In an open economic system, GVC upgrading is not only an effective way to increase investment but also an important channel to realize technological progress. Developing countries like China can achieve technological advancement by participating in the global production network dominated by multinational enterprises from developed countries [59]. This can be achieved through industry-related technology spillover, intermediate goods technology spillover, foreign direct investment (FDI) technology spillover and outward FDI (OFDI) reverse technology spillover.
By GVC upgrading through exports, developing countries can gain more opportunities to receive technology transfer, patent transfer and process outsourcing from developed countries. Export enterprises have more opportunities to access cutting-edge technologies in the international market and can improve their technology level actively or passively under the requirements, guidance, and training of importers. Developing countries can also obtain technology spillover by importing high-quality intermediate products and improve their technological level through imitation, learning, and secondary innovation [33]. Moreover, GVC upgrading can increase FDI, leading to more opportunities for technological spillover effects. These effects encompass technology imitation, technological market competition, and technology personnel mobility. Conversely, developing countries can also take the initiative to acquire advanced technologies from multinational companies in developed countries through OFDI reverse technology spillover, thereby promoting the technological innovation level of domestic enterprises and improving productivity.

3.2.3. Enhancing Human Capital

GVC upgrading is an important means of improving a country’s human capital level both directly and indirectly, especially for developing countries. This upgrading can directly facilitate the flow of human capital within GVCs, enabling technical personnel in developing countries to communicate and learn from their counterparts in developed countries. It may even involve the introduction of skilled personnel, directly contributing to the flow and upgrading of human capital. Moreover, GVC upgrading amplifies the demand for high-quality human capital, encouraging importers and exporters to bolster labor skills training, thereby promoting the cultivation of human capital.
According to new trade theory and endogenous trade theory, the key channels through which GVC upgrading influences economic growth are innovation, learning by doing, and technology diffusion at the international technological frontier [60]. Proactive innovation requires a higher level of human capital accumulation, and the experience gained through learning by doing itself contributes to enhancing the human capital stock [61]. Additionally, GVC upgrading increases the relative demand for skilled labor, widening the wage gap between skilled and nonskilled labor [62], stimulating investment in human capital, and promoting improvements in its quality.
Based on the above analysis, the following hypotheses are proposed:
Hypothesis 1 (H1). 
The upgrading of GVC participation can promote regional economic growth.
Hypothesis 2 (H2). 
GVC upgrading positively impacts regional economic growth by facilitating capital accumulation.
Hypothesis 3 (H3). 
GVC upgrading positively impacts regional economic growth by promoting technological progress.
Hypothesis 4 (H4). 
GVC upgrading positively impacts regional economic growth by enhancing human capital.
The theoretical model of this study is shown in Figure 1.

4. Empirical Models and Data Processing

4.1. Empirical Models

To examine the direct effect of regional GVC upgrading on economic growth, a benchmark regression model is constructed following the modified and developed equations of Hoeriyah et al. (2022) [63], Stojkoski and Kocarev (2017) [64], Zhu and Li (2016) [65], and Hausmann et al. (2014) [66]:
l n Y i t = α 0 + α 1 G V C i t + j = 1 n γ j Z j i t + μ i + ε i t
where subscripts i , j and t represent the city and year, respectively. The dependent variable l n Y i t represents regional economic growth, measured as the logarithm of real GDP per capita (at constant prices); G V C i t represents GVC upgrading; Z j i t represents the other control variables; α 1 and γ j represent regression coefficients; μ i represents city fixed effects (FE); and ε i t represents the random error term.

4.2. Variable Selection

4.2.1. Core Explanatory Variable: GVC Upgrading Index

The technical complexity of exports can be measured at the product-specific level by using trade data and the income level of the exporting country, without requiring data on the R&D input of specific products and industries [67]. Due to this advantage, the export technical complexity index has been widely used in the study of GVC status at the country, regional, industry and even enterprise levels.
As mentioned in Section 2.3, export complexity offers unique advantages for measuring the level of GVC upgrading of Chinese cities because it is not affected by the discontinuity of the IO table between regions in China and only requires data on product exports and city income levels. Therefore, this study constructs an export complexity index based on the product complexity index (PCI) to measure the level of GVC upgrading of Chinese cities. The PCI is derived from the Atlas of Economic Complexity (https://atlas.cid.harvard.edu/. Accesed on 11 February 2023) using the method of reflection of Hausmann et al. (2010) [53]. The basic assumption is that if the product is of higher technical complexity and requires more capacity for production, then relatively fewer countries have the capacity to produce it [66]. To prevent the deviation caused by the scarcity of natural resources required for production, whether these countries have the capacity to produce other products simultaneously is used as a correction. If fewer countries export a product and these countries’ exports are more diverse, then the product’s complexity will be higher. If a country produces diversified and unique products simultaneously, then the export complexity will be higher [68], indicating a higher status of GVC upgrading.
To analyze GVC upgrading at the city level, this study refers to the Observatory of Economic Complexity (OEC) [69] and uses the following calculation formula:
G V C i = 1 M i p M i p P C I p
where subscripts i and p represent the city and product, respectively, and P C I p is the complexity index of the product p , which measures the amount and complexity of expertise required to produce it. M i p is calculated according to the modified revealed comparative advantage (RCA) index. (The RCA index is defined as the ratio of two shares. The numerator is the share of a country’s total exports of the commodity of interest in its total exports. The denominator is the share of world exports of the same commodity in total world exports. This index takes a value between 0 and +∞. A country is said to have an RCA if the value exceeds unity). When city i has an apparent comparative advantage of p products ( R C A i p > 1 ), the dummy variable M i p = 1; otherwise, M i p = 0. M i is the sum of M i p for city i .
The modified RCA calculation formula at the city level is as follows:
R C A i p = X i p X i X w p X w
where subscripts w , i , and p represent the world, city and product, respectively; X i p X i is the proportion of product p in the exports of city i ; and X w p X w is the proportion of product p in the exports of the world.
Comparing the share of each product in a city’s total exports with its share in global exports to calculate a modified RCA index better fits the aim of examining GVC upgrading and facilitates an international comparison of the results [69].
As the PCI has been standardized, its value is near 0 (for example, the maximum value of the PCI was 3.91 and the minimum value was −2.79 among 1244 kinds of products at HS4 level in 2016), and the GVC upgrading index calculated by Equation (2) is also approximately 0 and may take a negative value. Therefore, there is no need to take its logarithm.

4.2.2. Control Variables

Based on related studies such as Mankiw et al. (1992) [70], Su and Shao (2017) [5], and Hoeriyah et al. (2022) [63], this study selects the following control variables:
(1)
Per capita capital stock (PC), which is represented by dividing the city’s physical capital stock by the total population at the end of the year. The physical capital stock is calculated using the perpetual inventory method proposed by Goldsmith (1951) [71], based on the city’s fixed asset investment, fixed asset investment price index, depreciation rate, etc. Its basic formula is as follows:
K t = K t 1 1 δ + I t
where δ is the average depreciation rate, K t 1 is the capital stock at the end of the previous period, and I t is the newly added fixed asset investment in the current period.
Two key indicators must be calculated first in this method: δ , the depreciation rate; and K 0 , the capital stock in the base year. On the one hand, referring to Huang et al. (2002) [72] and Zhang et al. (2004) [73], this study adopts the depreciation rate data of the province in which each city is located. The depreciation rate is first calculated according to the depreciation life of various capital goods and then weighted by their share of total capital goods. The average depreciation rate of provinces from 2001 to 2016 is 9.6935%, which is close to the reference.
On the other hand, K 0 is estimated by referring to the dynamic calculation method of Reinsdorf et al. (2005) [74] and Ke et al. (2012) [75] using the following calculation formula:
K 0 = I 0 1 + g g + δ
where I 0 is the value of the city’s fixed asset investment at constant prices in the base period, g is the average annual growth rate of constant-price investment I t , and δ is the average depreciation rate.
(2)
Other control variables include employment, research and development, openness, infrastructure, government intervention, etc. Employment (EM) is measured by the number of persons employed in various units at year-end. Research and development (RD) is represented by the share of science and technology expenditure in total public finance expenditure. Openness is measured by the share of imports and exports in GDP. Infrastructure (INFRA) is measured by the road area per capita. Government intervention (GOV) is measured by the proportion of government fiscal expenditure in GDP.
In the empirical analysis, logarithms are taken for employment (EM), technological innovation (TECH) and infrastructure (INFRA), while research and development (RD), openness (OPEN) and government intervention (GOV) are relative measures and do not require logarithmic transformation.

4.3. Data Description

To maintain consistency in statistical measurement, this paper uses panel data of 239 cities at the prefecture level and above in China from 2001 to 2016 as research samples. In the empirical analysis, balanced panel data are obtained, comprising a maximum of 3824 observations. The main data sources used in this study include trade data from the General Administration of Customs of China, global trade data from the CEPII-BACI database, and the PCI from the Harvard University Dataverse database, which are used to measure regional GVC upgrading. Additionally, production and population data at the city level from the China City Statistical Yearbook, China Statistical Yearbook for Regional Economy and provincial and municipal statistical yearbooks over the years are used to construct the dependent and control variables.
The descriptive statistical results of the main variables are shown in Table 1, where the PCI used to measure GVC upgrading in cities has been standardized. Additionally, the maximum value of the variance inflation factor (VIF) of the variables is 4.8, and the minimum value is 1.2, both of which are less than six, indicating that there is no concern about multicollinearity problems.
To preliminarily investigate the correlation between GVC upgrading and regional economic growth, this study uses Stata 14.0 to plot the regression fitting trend line and two-dimensional scatterplot between GVC upgrading and regional economic growth.
As shown in Figure 2, the GVC upgrading index is mostly distributed between −2 and 1, and the slope of the fitting trend line between GVC and lnY is positive. Based on the scatterplot, there appears to be a relatively clear positive correlation between GVC upgrading and economic growth, which requires further empirical analysis to confirm.

5. Empirical Results

5.1. Results of Panel Unit Root and Cointegration Tests

Before conducting regression analysis on the empirical model, it is necessary to perform unit root tests on the panel data to ensure data stability and avoid spurious regression. This study adopts the Levin–Lin–Chu (LLC) [76] and Im–Persaran–Shin (IPS) [77] tests to test the unit roots of GVC upgrading and its related indicators, thereby ensuring data stationarity. The LLC test serves as a homogeneous unit root test, while the IPS test serves as a heterogeneous unit root test that allows for different individual autoregressive coefficients [78]. The test results are presented in Table 2. All the variables pass the LLC test, but lnY and lnpc are not stationary in the level under the IPS test. All the variables are stationary after the first difference at the 1% significance level. All the variables are first-order differenced stationary, satisfying the prerequisite conditions for cointegration tests.
This study then employs Pedroni’s residual-based heterogeneous panel cointegration test [79] to examine the model, with results presented in Table 3. All the statistics reject the null hypothesis of no cointegration at the 1% significance level, indicating that the variables considered in this study are cointegrated. This provides support for investigating the long-term relationships among the variables. Consequently, subsequent estimation of the regression equation using econometric methods should yield relatively efficient and precise results, without the issue of spurious regression.

5.2. Baseline Regression Results

Table 4 presents the results of the benchmark regression of the impact of GVC upgrading on economic growth. Column (1) shows the results of the mixed OLS regression. When all the data are treated equally, the coefficient of GVC upgrading is significantly positive at the 1% level, indicating that GVC upgrading significantly contributes to the economic growth of Chinese cities. Column (2) shows that this conclusion remains valid when using an FE model. The estimated results are robust under different settings, indicating that GVC upgrading significantly promotes economic growth, supporting H1 in this paper. This implies that a one-standard-deviation improvement in GVC upgrading leads to a 0.054-standard-deviation increase in GDP per capita.

5.3. Robustness Test

5.3.1. Replacement of the Core Explanatory Variable: Changing the RCA Threshold

When calculating the GVC upgrading index at the city level according to Equations (2) and (3), the threshold value of RCA is set at 1. However, Ourens (2013) [80] suggests that the estimation results of the effect of complexity on economic growth are sensitive to the chosen RCA threshold. Following the approach of reference [65], this study sets the threshold values of RCA to 0.8 and 1.2 and replaces the core explanatory variable GVC with the newly calculated explanatory variables GVC1 and GVC2, respectively, to conduct the robustness test. The results are shown in columns (1) and (2) of Table 5. (The completed table with all results of the indicators can be provided upon request and the same is true for all the following tables.) The coefficients of GVC1 and GVC2 are positive at the 1% significance level, verifying the robustness of the benchmark regression results.

5.3.2. Replacement of the Dependent Variable

The economic growth and development level studied in this paper is based on the comprehensive development of cities, including industrial development, industrialization, and trade capacity of the city embedded in GVCs, rather than the per capita living standard. In view of this, this study replaces the logarithm of real GDP per capita with the logarithm of real GDP (lnRGDP) of cities as the independent variable, and the test results are shown in column (3) of Table 5. After replacing the explained variable, the coefficient of GVC remains positive at the 1% significance level, consistent with the benchmark regression results.

5.3.3. Treatment of Endogeneity Issues

To overcome the potential endogeneity issues caused by reverse causality arising from bidirectional causality between GVC upgrading and economic growth, this study employs instrumental variable (IV) estimation. GVC upgrading can promote economic growth, and vice versa. This study adopts the lagged one- and two-period GVC upgrading index as the IVs of GVC and conducts two-stage least squares (2SLS) estimation to ensure that the benchmark test results are scientifically robust. This is a common practice in the literature [18] as it is assumed that the current value of the explanatory variable has no effect on the lagged value of the endogenous variable. The issues of endogenous relationships caused by bidirectional causality can be effectively avoided through this time-staggering approach.
Table 6 shows the estimation results of the 2SLS regression. Columns (1) and (3) show that the regression coefficients of the IVs to GVC in the first stage are significantly positive at the level of 1%, indicating that the Ivs are significantly positively correlated with the explanatory variables. Columns (2) and (4) show that regardless of whether the selected IV is the first or second lag of the independent variable, the estimated coefficients of GVC are significantly positive, indicating that the influence of GVC upgrading on regional economic growth remains valid after addressing endogeneity issues.
This paper also uses various methods to test the effectiveness of the selected Ivs. The KP-LM statistic shows that the null hypothesis of the insufficient identification of Ivs is rejected with significance at the 1% level, suggesting that there is no correlation between the non-included Ivs and endogenous variables. Testing with the Wald rk F statistic rejects the null hypothesis that the Ivs are weakly identified, with significance at the 1% level. Both tests show that the 2SLS regression results are robust and that the selected Ivs are valid.

5.4. Heterogeneity Analysis

Considering the differences in the levels of economic development and population distribution among cities, this study examines the variations in the impact of GVC upgrading on economic growth across cities from multiple perspectives, using GDP size and employment scale as proxies for material and labor resources.
As shown in Table 7, GVC upgrading has a significant effect on the economic growth of cities with different economic development scales and employment scales, but with notable differences. Specifically, columns (2) and (4) show that cities with a larger economic scale and larger employment scale present a stronger promoting effect of GVC upgrading on economic growth, possibly because cities with abundant material and labor resources have a stronger ability to absorb intermediate product technology spillovers through imports than other cities. At the same time, such cities also have more competitive advantages in terms of exports and can obtain more capital accumulation, which makes it easier for them to upgrade productivity and promote economic growth through GVC upgrading.
To further investigate the time effect of GVC upgrading on regional economic growth, this study processed the samples by period, selecting 2007 as the first time node to investigate the possible impact of the global financial crisis. Moreover, considering the increasing downward pressure on China’s economy since 2010, 2010 is selected as the second time node to test the impact of GVC upgrading on regional economic growth by period. Columns (5), (6) and (7) in Table 7 show that GVC upgrading had a promoting effect on regional economic growth in the two periods of 2001–2006 and 2010–2016. However, it can be seen that after the global financial crisis, the promoting effect of GVC upgrading on economic growth declined significantly. Specifically, the coefficient during 2007–2009 dropped substantially to less than one-tenth of that during 2001–2006. From 2010 to 2016, the promoting effect of GVC upgrading on economic growth recovered relative to the previous period. This finding indicates that on the one hand, the impact of the global financial crisis gradually diminished, and on the other hand, although China’s economy entered a slower growth period, China enhanced the positive impact of GVC upgrading on economic growth by implementing a series of strategies to promote technological innovation and transform its growth mode.
The multicenter agglomeration economy represented by city clusters has become the growth pole of China’s economy and the core force of China’s participation in GVC cooperation. Considering that China’s economic development presents regional differences, different urban clusters have different positions in the division of labor within the production value chain, leading to different impacts of GVC upgrading on regional economic growth. Therefore, five urban clusters are selected from the 239 cities in the sample, namely, the Beijing–Tianjin–Hebei, Yangtze River Delta, Pearl River Delta, and Chengdu–Chongqing urban agglomerations as well as the middle reaches of the Yangtze River, to investigate the impact of GVC upgrading on economic growth in different urban clusters. From 2001 to 2016, exports of these five selected urban clusters accounted for more than 73% of the total exports of all cities, indicating their importance for GVC upgrading. Table 8 shows differences in the impact of GVC upgrading on economic growth across different urban clusters. Columns (1), (2) and (3) show that GVC upgrading has a significant promoting effect on the economic growth of the Beijing–Tianjin–Hebei, Yangtze River Delta and Pearl River Delta urban agglomerations; among these, its contribution to economic growth is the largest in the Yangtze River Delta urban cluster. Columns (4) and (5) show that the influence of GVC upgrading on the economic growth of the middle reaches of the Yangtze River and the Chengdu–Chongqing urban agglomeration is positive but not significant. This finding suggests that GVC upgrading plays a larger role in economically developed areas in China, such as coastal areas and administrative centers, than it does in other areas. Although inland urban clusters are gradually undertaking industrial production transferred from coastal areas, GVC upgrading remains challenging for these clusters because it requires better production, communication and transportation conditions. For regions with relatively weak industrial foundations, it will take some time to realize the positive effect of GVC upgrading on economic growth. At present, these regions may participate indirectly in GVCs by engaging in the division of domestic value chains.

5.5. Test of Mediation Mechanism

As described in H2, H3 and H4, GVC upgrading can promote regional economic growth by promoting capital accumulation, technological advancement, and human capital improvement. To demonstrate these points further, this section employs a mediating model to test the mechanism through which GVC upgrading affects regional economic growth. The mediating effects model consists of the following three equations:
l n Y i t = α 1 + β 1 G V C i t + γ 1 Z i t + ε 1 i t
M i t = α 2 + β 2 G V C i t + γ 2 Z i t + ε 2 i t
l n Y i t = α 3 + β 3 G V C i t + ω 3 M i t + γ 3 Z i t + ε 4 i t
M i t represents the mediating variables, including capital accumulation (cap-effect), technological progress (tec-effect), and human capital upgrading (hum-effect), which are proxied by per capita capital (PC), the number of patents granted per ten thousand people (TECH), and the number of students enrolled in general higher education per ten thousand people (HC), respectively. The definitions of the other variables are consistent with those in model (1). Model (6) has the same function as model (1) to verify the impact of GVC upgrading on regional economic growth. Model (7) is used to verify the influence of GVC upgrading on the mediating variables (capital accumulation, technological progress, and human capital upgrading), while model (8) tests the mediating effect of intermediary variables in the relationship between GVC upgrading and regional economic growth. The results of the mediation mechanism test are presented in Table 9.

5.5.1. Mechanism 1: Promoting Capital Accumulation

Since the mediating variable is the same as the control variable at this time, the logarithm of per capita capital (lnPC) is excluded from the baseline regression of the effect of GVC upgrading on economic growth in column (1) in Table 9. The regression results show that GVC upgrading plays a greater role in promoting economic growth when the direct effect of capital growth on economic growth is not considered. The results in column (2) show that GVC upgrading can significantly promote an increase in capital accumulation. In column (3), both GVC and lnPC are significant, indicating that the mediating effect brought about by capital accumulation is incomplete. The presence of the mediating effect of capital accumulation reduces the magnitude of the effect of GVC upgrading on regional economic growth from 0.572 units to 0.159 units. According to the calculation, the mediating effect ratio of capital accumulation is 0.722, which indicates that capital accumulation, as a mediating variable, can explain more than 70% of the economic growth effect brought about by GVC upgrading. GVC upgrading is an important method of capital accumulation, and capital accumulation is the most important channel through which GVC upgrading affects China’s economic growth. Thus, H2 is verified.

5.5.2. Mechanism 2: Promoting Technological Progress

Column (4) of Table 9 shows that the estimated coefficient of GVC is positive at the significance level of 5%, indicating that GVC upgrading has a positive impact on technological progress. Column (5) shows that both GVC and lnTECH are significant at the same time, but that the estimated coefficient of GVC is lower than that in the baseline regression. These results indicate that promoting technological progress is an important channel through which GVC upgrading affects regional economic growth, which supports H3. According to the calculation, the mediating effect ratio of technological progress is 0.053, indicating that technological progress, as a mediating variable, can explain approximately 5.3% of the economic growth effect brought about by GVC upgrading and that GVC upgrading plays a positive role in promoting technological progress; however, the overall level of technological benefits is relatively low.

5.5.3. Mechanism 3: Promoting Human Capital Upgrading

Column (6) of Table 9 shows that the estimated coefficient of GVC is significantly positive at the 5% level, indicating that GVC upgrading can promote the improvement in human capital. In column (7), both GVC and lnHC are significant, but the estimated coefficient of GVC is lower than that in the benchmark regression, which supports H4. Namely, improvement in human capital is the channel through which GVC upgrading promotes regional economic growth. The mediating effect ratio of human capital is 0.038, indicating that human capital, as an intermediary variable, can explain approximately 3.8% of the impact of GVC upgrading on economic growth.
The summary of the magnitude of the three mediating variables is presented in Table 10. In terms of the ratio of the mediating effect to the total effect, the effect of capital accumulation is the largest, followed by those of technological progress and human capital upgrading. This finding indicates that capital accumulation is the most important pathway through which GVC upgrading influences regional economic growth. Since joining the WTO, the economic effects of GVC upgrading in China have manifested mainly in the investment field. Through GVC upgrading, China has gained access to high-quality intermediate inputs and effectively stimulated investment through the production and export of industrial goods. This has facilitated industrial agglomeration, improved capital accumulation efficiency, mitigated the decline in capital returns, and significantly promoted economic growth.
The mediating effects of technological progress and human capital improvement are relatively small, indicating that although GVC upgrading can generate knowledge spillovers, promote technological progress, and enhance the quality of human capital, its mediating effects are not prominent in the current stage of development in China. On the one hand, this result suggests that the technological progress brought about by GVC upgrading is suboptimal for social innovation in China. On the other hand, it also implies that China has not effectively achieved alignment between the regional and international innovation systems and human capital, limiting the spillover effects obtained through GVCs.

6. Conclusions and Implications

This paper measures the level of GVC upgrading of 239 Chinese cities from 2001 to 2016 by constructing a city export complexity index and tests its impact on regional economic growth. The research finds that first, GVC upgrading promotes regional economic growth. This conclusion remains robust after replacing explanatory variables and explained variables and addressing endogeneity problems. Second, the promoting effect of GVC upgrading on regional economic growth is more prominent in cities with abundant material and labor resources. From the temporal perspective, this promoting effect was greatly weakened by the global financial crisis in 2007. From the regional perspective, the promoting effect is more significant in coastal areas and administrative centers and not significant in inland areas. Third, capital accumulation, technological progress, and human capital improvement are crucial mechanisms through which GVC upgrading enhances regional economic growth. Among these, the impact of capital accumulation is the most significant, accounting for over 70% of the economic growth effects resulting from GVC upgrading. In recent years, there have been profound changes in the global geopolitical landscape, with the rise in nationalism and trade protectionism posing significant challenges to GVCs. However, the 20th National Congress of the Communist Party of China emphasized a consistent commitment to promoting high-level opening up, drawing on the fact that GVC upgrading could make a positive contribution to regional economic growth.
Based on the above findings, this paper proposes the following:
First, a favorable environment and conditions should be created to promote GVC upgrading and encouraging regional economic development. According to this study, GVC upgrading is an effective way to promote regional economic growth. Therefore, China should continue to support and uphold the multilateral trading system, actively engage in WTO reforms, and contribute to the construction of GVCs and regional value chains. Additionally, further efforts should be made to advance multilateral cooperation and the establishment of free trade zones, facilitating the matching of supply and demand between enterprises participating in the GVC division of labor, and supporting policies aimed at increasing enterprise integration into GVCs, such as investment policies, contract enforcement systems, and business facilitation.
Second, capital accumulation should be promoted, and the efficiency of capital utilization should be improved. Given the analysis of the transmission mechanisms by which GVC upgrading affects regional economic growth, capital accumulation is the most critical transmission mechanism. GVC upgrading can promote capital accumulation by increasing short-term investment and attracting foreign capital, thereby positively impacting economic growth. Therefore, efforts should be made to further promote capital accumulation, improve the efficiency of capital utilization, and avoid redundant investments. The transmission effects of capital accumulation in the context of GVC upgrading and regional economic growth should be fully utilized.
Third, regional innovation systems should be actively fostered, and the quality of human capital should be improved. According to the mechanism analysis, the mediating effects of technology advancement and human capital enhancement are relatively small, suggesting that the technological progress brought about by relying on learning by doing, learning by exporting, cost discovery and demand discovery is suboptimal for social innovation. It is necessary to cultivate independent domestic research and development capability and regional innovation systems and prioritize the cultivation of regional human capital. These efforts can promote the integration of regional and international technology and human capital, supporting the absorption of the spillover effect brought about by GVC upgrading.
Fourth, institutional barriers between coastal and inland areas, and between inland areas and other inland areas should be reduced, and the integration of the domestic market should be promoted. It is important to strengthen infrastructure construction in the central and western regions to undertake industrial transfers from coastal cities. Accelerating the transfer of industrial gradients would promote GVC upgrading of cities in the central and western regions.
Due to the limitations of quantitative analysis in this study, future research should aim to further improve the research methodology. First, this study uses the export complexity index to measure the level of GVC upgrading in Chinese cities, which avoids the influence of data inconsistency over time compared with indicators based on IO tables. Although this method continuously captures the characteristics of city-level GVC upgrading, it neglects the content and technical complexity of imported intermediates used in the production of exported goods. Hence, future research should continue to pay attention to the latest research progress regarding GVCs and constantly improve the measurement index of GVC upgrading at the city level, providing a more accurate and comprehensive measurement method. Second, future studies should more comprehensively explore the impact of GVC upgrading on institutional quality, total factor productivity, industrial structure, and other factors that also have significant implications for regional economic growth. Third, future studies may investigate the presence of a spatial spillover effect of GVC upgrading and whether this effect can extend the benefits of GVC upgrading to neighboring regions. Fourth, it is also a key direction for future research to examine whether GVC upgrading can reduce regional disparities in China, promote balanced development among regions, and foster regional equity. Finally, since 2016, there have been significant changes in the global economic and political landscape, particularly due to the outbreak of the coronavirus disease 2019 (COVID-19) pandemic, which has majorly impacted GVCs. Future research should make efforts to capture the effects of these new geopolitical changes by improving data availability or adopting new methodological frameworks.

Author Contributions

Conceptualization, C.L. and Q.H.; Methodology, C.L.; Software, C.L.; Validation, H.J. and Q.H.; Formal analysis, C.L.; Investigation, C.L. and Q.H.; Resources, Q.H.; Data curation, C.L. and Q.H.; Writing—original draft preparation, C.L.; Writing—review and editing, Q.H. and H.J.; Visualization, C.L.; Supervision, Q.H.; Project administration, Q.H.; and Funding acquisition, H.J. and Q.H. All authors have read and agreed to the published version of the manuscript.

Funding

This research was funded by the National Natural Science Foundation of China (grant numbers 72104048), the National Social Science Foundation of China (grant numbers 20CGJ023; 21BGL158), the Agricultural Science and Technology Innovation Program (ASTIP) of the Chinese Academy of Agricultural Sciences (CAAS-ASTIP-2023-AII), the Central Public-interest Scientific Institution Basal Research Fund (NO. BYW-AII-2023-05; JBYW-AII-2023-22) and the Hainan Philosophy and Social Science Planning Project (HNSK(ZC)21-140).

Institutional Review Board Statement

Not applicable.

Informed Consent Statement

Not applicable.

Data Availability Statement

The data can be obtained from the corresponding author upon reasonable request.

Conflicts of Interest

The authors declare no conflict of interest.

References

  1. Li, X.; Meng, B.; Wang, Z. Recent patterns of global production and GVC participation. Glob. Value Chain Dev. Rep. 2019, 2019, 9. [Google Scholar]
  2. Lee, E.; Yi, K.-M. Global value chains and inequality with endogenous labor supply. J. Int. Econ. 2018, 115, 223–241. [Google Scholar] [CrossRef]
  3. Baldwin, R.; Lopez-Gonzalez, J. Supply-chain trade: A portrait of global patterns and several testable hypotheses. World Econ. 2015, 38, 1682–1721. [Google Scholar] [CrossRef]
  4. WTO. Global Value Chain Development Report 2019: Technological Innovation, Supply Chain Trade, and Workers in Globalized World; WTO: Geneva, Switzerland, 2019. [Google Scholar]
  5. Su, D.; Shao, C. Global Value Chain, Regional Economic Growth and Spatial Spillover. J. Int. Trade 2017, 11, 48–59. (In Chinese) [Google Scholar] [CrossRef]
  6. Gereffi, G. Global value chains in a post-Washington Consensus world. Rev. Int. Polit. Econ. 2014, 21, 9–37. [Google Scholar] [CrossRef]
  7. Kersan-Škabić, I. The drivers of global value chain (GVC) participation in EU member states. Econ. Res. Ekon. Istraž. 2019, 32, 1204–1218. [Google Scholar] [CrossRef]
  8. UNCTAD. World Investment Report 2013: Global Value Chains: Investment and Trade for Development; UN: Geneva, Switzerland, 2013. [Google Scholar]
  9. Taglioni, D.; Winkler, D. Making Global Value Chains Work for Development; World Bank Publications: Washington, DC, USA, 2016. [Google Scholar]
  10. Rodrik, D. New Technologies, Global Value Chains, and Developing Economies; National Bureau of Economic Research: Cambridge, MA, USA, 2018. [Google Scholar] [CrossRef]
  11. Shen, C.; Zheng, J. Does global value chains participation really promote skill-biased technological change? Theory and evidence from China. Econ. Model. 2020, 86, 10–18. [Google Scholar] [CrossRef]
  12. Sposi, M.; Yi, K.-M.; Zhang, J. Trade integration, global value chains, and capital accumulation. IMF Econ. Rev. 2021, 69, 505–539. [Google Scholar] [CrossRef]
  13. Martínez-Galán, E.; Fontoura, M.P. Global value chains and inward foreign direct investment in the 2000s. World Econ. 2019, 42, 175–196. [Google Scholar] [CrossRef]
  14. Hollweg, C.H. Global value chains and employment in developing economies. Glob. Value Chain Dev. Rep. 2019, 2019, 63. [Google Scholar]
  15. Banga, K. Impact of global value chains on employment in India. J. Econ. Integr. 2016, 31, 631–673. [Google Scholar] [CrossRef] [Green Version]
  16. Hummels, D.; Ishii, J.; Yi, K.-M. The nature and growth of vertical specialization in world trade. J. Int. Econ. 2001, 54, 75–96. [Google Scholar] [CrossRef]
  17. Gereffi, G.; Fernandez-Stark, K. Global Value Chain Analysis: A Primer, 2nd ed.; Center on Globalization, Governance & Competitiveness (CGGC), Duke University: Durham, NC, USA, 2016. [Google Scholar]
  18. Jangam, B.P.; Rath, B.N. Do global value chains enhance or slog economic growth? Appl. Econ. 2021, 53, 4148–4165. [Google Scholar] [CrossRef]
  19. Boffa, M.; Kumritz, V.; Santoni, G.; Taglioni, D.; Winkler, D. Overcoming the Middle-Income Trap: The Role of GVC Integration for Climbing-Up the Income Ladder; University Geneva: Geneva, Switzerland, 2016. [Google Scholar]
  20. Jithin, P.; Ashraf, S.; Umar, Z. Does global value chain participation induce economic growth? Evidence from panel threshold regression. Appl. Econ. 2023, 55, 2788–2800. [Google Scholar] [CrossRef]
  21. Pietrobelli, C.; Rabellotti, R. Global Value Chains Meet Innovation Systems: Are There Learning Opportunities for Developing Countries? World Devel. 2011, 39, 1261–1269. [Google Scholar] [CrossRef] [Green Version]
  22. Yu, Y.; Rong, K.; Su, D.; Zhang, W. The Degree of Global Value Chain Embedment and Total Factor Productivity in Chinese Cities-Empirical Research from 230 Cities. China Soft Sci. 2019, 341, 80–96. (In Chinese) [Google Scholar] [CrossRef]
  23. Li, S.; He, J.; Liu, Y. Research on Division of Labor of China’s Domestic Value Chain from the Perspective of Global Value Chain. Manag. Rev. 2018, 30, 9–18. [Google Scholar]
  24. Kan, D.; Lyu, L.; Huang, W.; Yao, W. Digital economy and the upgrading of the global value chain of China’s service industry. J. Theor. Appl. Electron. Commer. Res. 2022, 17, 1279–1296. [Google Scholar] [CrossRef]
  25. Wu, L.; Chen, G.; Peng, S. Human Capital Expansion and Global Value Chain Upgrading: Firm-level Evidence from China. China World Econ. 2021, 29, 28–56. [Google Scholar] [CrossRef]
  26. Pan, H.; Yang, J.; Zhou, H.; Zheng, X.; Hu, F. Global value chain embeddedness, digital economy and green innovation—Evidence from provincial-level regions in China. Front. Environ. Sci. 2022, 10, 1027130. [Google Scholar] [CrossRef]
  27. Li, G.; Zhang, X. Does GVC embedding reduce carbon emissions? Empirical evidence from 218 Chinese cities. Struct. Chang. Econ. Dynam. 2023, 66, 253–263. [Google Scholar] [CrossRef]
  28. Lederman, D.; Maloney, W.F. Natural Resources, Neither Curse Nor Destiny; Stanford University Press: Palo Alto, CA, USA, 2007; pp. 15–39. [Google Scholar]
  29. Piermartini, R.; Rubínová, S. Knowledge Spillovers through International Supply Chains; The Graduate Institute of International and Development Studies: Geneva, Switzerland, 2014. [Google Scholar]
  30. De Marchi, V.; Giuliani, E.; Rabellotti, R. Do global value chains offer developing countries learning and innovation opportunities? Eur. J. Dev. Res. 2018, 30, 389–407. [Google Scholar] [CrossRef]
  31. Lee, K. Schumpeterian Analysis of Economic Catch-Up: Knowledge, Path-Creation, and the Middle-Income Trap; Cambridge University Press: Cambridge, UK, 2013. [Google Scholar]
  32. Antràs, P.; Chor, D. Organizing the global value chain. Econometrica 2013, 81, 2127–2204. [Google Scholar] [CrossRef] [Green Version]
  33. Gereffi, G.; Lee, J. Why the world suddenly cares about global supply chains. J. Supply Chain. Manag. 2012, 48, 24–32. [Google Scholar] [CrossRef]
  34. Baldwin, J.R.; Yan, B. Global Value Chains and the Productivity of Canadian Manufacturing Firms; Statistics Canada: Ottawa, Ontario, Canada, 2014.
  35. Zhang, J.; Zheng, W. The Innovative Effect of Chinese Domestic Firms under the Global Value Chain. Econ. Res. J. 2017, 52, 151–165. (In Chinese) [Google Scholar]
  36. Raei, M.F.; Ignatenko, A.; Mircheva, M. Global Value Chains: What Are the Benefits and Why Do Countries Participate? International Monetary Fund: Washington, DC, USA, 2019. [Google Scholar]
  37. Dedrick, J.; Kraemer, K.L.; Linden, G. Who profits from innovation in global value chains? A study of the iPod and notebook PCs. Ind. Corp. Chang. 2010, 19, 81–116. [Google Scholar] [CrossRef] [Green Version]
  38. Koopman, R.; Powers, W.; Wang, Z.; Wei, S.-J. Give Credit Where Credit Is Due: Tracing Value Added in Global Production Chains; National Bureau of Economic Research: Cambridge, MA, USA, 2010. [Google Scholar] [CrossRef]
  39. Upward, R.; Wang, Z.; Zheng, J. Weighing China’s export basket: The domestic content and technology intensity of Chinese exports. J. Compare Econ. 2013, 41, 527–543. [Google Scholar] [CrossRef]
  40. Wang, S.; Chen, H. Could Chinese enterprises real benefit from embedding in global value chains? Environ. Dev. Sustain. 2022, 1–30. [Google Scholar] [CrossRef]
  41. Chen, H.; Wang, S.; Song, M. Global environmental value chain embeddedness and enterprise production efficiency improvement. Struct. Chang. Econ. Dynam. 2021, 58, 278–290. [Google Scholar] [CrossRef]
  42. Koopman, R.; Wang, Z.; Wei, S.-J. Tracing value-added and double counting in gross exports. Am. Econ. Rev. 2014, 104, 459–494. [Google Scholar] [CrossRef] [Green Version]
  43. Wang, Z.; Wei, S.-J.; Yu, X.; Zhu, K. Characterizing Global Value Chains. In Proceedings of the 19th Annual Conference on Global Economic Analysis, Washington DC, USA, 15–17 June 2016; Global Trade Analysis Project (GTAP). Available online: https://www.gtap.agecon.purdue.edu/resources/download/8178.pdf (accessed on 5 March 2023).
  44. Qu, C.; Shao, J.; Cheng, Z. Can embedding in global value chain drive green growth in China’s manufacturing industry? J. Clean. Prod. 2020, 268, 121962. [Google Scholar] [CrossRef]
  45. Wang, Z.; Wei, S.-J.; Yu, X.; Zhu, K. Measures of Participation in Global Value Chains and Global Business Cycles; National Bureau of Economic Research: Cambridge, MA, USA, 2017. [Google Scholar] [CrossRef]
  46. Ge, Y.; Dollar, D.; Yu, X. Institutions and participation in global value chains: Evidence from belt and road initiative. China Econ. Rev. 2020, 61, 101447. [Google Scholar] [CrossRef]
  47. Xie, R.; Niu, M.; Su, B.; Ge, J. Are global value chains merely global? The case of Chinese Provinces in global value chains. Appl. Econ. 2021, 53, 3778–3794. [Google Scholar] [CrossRef]
  48. Friedt, F.L.; Zhang, K. The triple effect of Covid-19 on Chinese exports: First evidence of the export supply, import demand and GVC contagion effects. Covid Econ. 2020, 53, 72–109. [Google Scholar]
  49. Schott, P.K. Across-product versus within-product specialization in international trade. Q. J. Econ. 2004, 119, 647–678. [Google Scholar] [CrossRef] [Green Version]
  50. Li, F.; Lin, Z.; Huang, L.; Yang, C. Environmental regulation and global value chain division position: Analysis based on global transnational data. Energy Policy 2022, 168, 113101. [Google Scholar] [CrossRef]
  51. Michaely, M. Trade, Income Levels, and Dependence; North-Holland Amsterdam: Amsterdam, The Netherlands, 1984; Volume 8. [Google Scholar]
  52. Hausmann, R.; Hwang, J.; Rodrik, D. What you export matters. J. Econ. Growth 2007, 12, 1–25. [Google Scholar] [CrossRef]
  53. Hausmann, R.; Hidalgo, C. Country Diversification, Product Ubiquity, and Economic Divergence; HKS Working Paper No. RWP10-045; Harvard University: Cambridge, MA, USA, 2010. [Google Scholar] [CrossRef] [Green Version]
  54. Peng, F.; Kang, L.; Liu, T.; Cheng, J.; Ren, L. Trade agreements and global value chains: New evidence from China’s Belt and Road Initiative. Sustainability 2020, 12, 1353. [Google Scholar] [CrossRef] [Green Version]
  55. Dai, X.; Zheng, L. Impact of Institution Quality on China’s Position in Global Value Chain. J. Int. Trade 2015, 51–63+132. (In Chinese) [Google Scholar] [CrossRef]
  56. Du, W.; Fang, G.; Gao, T.; Jiang, W. Public credit institutions, export activities, and global value chain participation: Evidence from China’s credit demonstration city construction program. Econ. Model. 2023, 126, 106409. [Google Scholar] [CrossRef]
  57. Krugman, P.R.; Venables, A. The Seamless World: A Spatial Model of International Specialization; National Bureau of Economic Research Cambridge: Cambridge, MA, USA, 1995. [Google Scholar] [CrossRef] [Green Version]
  58. Melitz, M.J. The impact of trade on intra-industry reallocations and aggregate industry productivity. Econometrica 2003, 71, 1695–1725. [Google Scholar] [CrossRef] [Green Version]
  59. Bank, W. World Development Report 2020: Trading for Development in the Age of Global Value Chains; The World Bank: Washington, DC, USA, 2019. [Google Scholar]
  60. Unel, B. Human capital formation and international trade. BE J. Econ. Anal. Policy 2015, 15, 1067–1092. [Google Scholar] [CrossRef] [Green Version]
  61. Davidson, C.; Sly, N. A simple model of globalization, schooling and skill acquisition. Eur. Econ. Rev. 2014, 71, 209–227. [Google Scholar] [CrossRef] [Green Version]
  62. Acemoglu, D. Patterns of skill premia. Rev. Econ. Stud. 2003, 70, 199–230. [Google Scholar] [CrossRef]
  63. Hoeriyah, L.; Nuryartono, N.; Pasaribu, S.H. Economic complexity and sustainable growth in developing countries. Econ. Dev. Anal. J. 2022, 11, 23–33. [Google Scholar] [CrossRef]
  64. Stojkoski, V.; Kocarev, L. The Relationship between Growth and Economic Complexity: Evidence from Southeastern and Central Europe; Munich Personal RePEc Archive, MPRA paper 77837; University Library of Munich: Munich, Germany, 2017; revised. [Google Scholar]
  65. Zhu, S.; Li, R. Economic complexity, human capital and economic growth: Empirical research based on cross-country panel data. Appl. Econ. 2016, 49, 3815–3828. [Google Scholar] [CrossRef]
  66. Hausmann, R.; Hidalgo, C.A.; Bustos, S.; Coscia, M.; Simoes, A. The Atlas of Economic Complexity: Mapping Paths to Prosperity; Mit Press: Cambridge, MA, USA, 2014. [Google Scholar] [CrossRef]
  67. Zhou, D. Influence of Imported Services Intermediate Input on Manufacturing Industry’s Export Sophistication in China. World Econ. Stud. 2015, 27–36+127. (In Chinese) [Google Scholar] [CrossRef]
  68. Wang, F.; Shi, X. Measurement of High-Quality Development Level of China’s Manufacturing and Its Influencing Factors. China Soft Sci. 2022, 37, 22–31. (In Chinese) [Google Scholar]
  69. Simoes, A.J.G.; Hidalgo, C.A. The economic complexity observatory: An analytical tool for understanding the dynamics of economic development. In Proceedings of the Workshops at the Twenty-Fifth AAAI Conference on Artificial Intelligence, San Francisco, CA, USA, 7–11 August 2011. [Google Scholar]
  70. Mankiw, N.G.; Romer, D.; Weil, D.N. A contribution to the empirics of economic growth. Q. J. Econ. 1992, 107, 407–437. [Google Scholar] [CrossRef]
  71. Goldsmith, R.W. A perpetual inventory of national wealth. In Studies in Income and Wealth; NBER: Cambridge, MA, USA, 1951; Volume 14, pp. 5–73. [Google Scholar]
  72. Huang, Y.; Ren, R.; Liu, X. Capital Stock Estimates in Chinese Manufacturing by Perpetual Inventory Approach. China Econ. Q. 2002, 1, 377–396. [Google Scholar]
  73. Zhang, J.; Zhang, Y. Recalculating the Capital of China and a Review of Li and Tang’s Article. Econ. Res. J. 2003, 7, 35–43+90. [Google Scholar]
  74. Reinsdorf, M.; Cover, M. Measurement of Capital Stocks, Consumption of Fixed Capital, and Capital Services. Report on a Presentation to the Central American Ad Hoc Group on National Accounts, Santo Domingo, Dominican Republic, 2005. Available online: https://www.google.com.hk/url?sa=t&rct=j&q=&esrc=s&source=web&cd=&cad=rja&uact=8&ved=2ahUKEwir2oa6gLOAAxUsqVYBHfxODNgQFnoECAkQAQ&url=https%3A%2F%2Funstats.un.org%2Funsd%2Fnationalaccount%2Faeg%2Fpapers%2Fm3Views15.PDF&usg=AOvVaw34jpEU1IVRHHw41aU6P3po&opi=89978449 (accessed on 5 March 2023).
  75. Ke, S.; Xiang, J. Estimation of the Fixed Capital Stocks in Chinese Cities for 1996–2009. Stat. Res. 2012, 29, 19–24. (In Chinese) [Google Scholar] [CrossRef]
  76. Levin, A.; Lin, C.-F.; Chu, C.-S.J. Unit root tests in panel data: Asymptotic and finite-sample properties. J. Econom. 2002, 108, 1–24. [Google Scholar] [CrossRef]
  77. Im, K.S.; Pesaran, M.H.; Shin, Y. Testing for unit roots in heterogeneous panels. J. Econom. 2003, 115, 53–74. [Google Scholar] [CrossRef]
  78. Afjal, M.; Kathiravan, C.; Dana, L.P.; Nagarajan, C.D. The Dynamic Impact of Financial Technology and Energy Consumption on Environmental Sustainability. Sustainability 2023, 15, 9327. [Google Scholar] [CrossRef]
  79. Pedroni, P. Panel cointegration: Asymptotic and finite sample properties of pooled time series tests with an application to the PPP hypothesis. Econom. Theory 2004, 20, 597–625. [Google Scholar] [CrossRef] [Green Version]
  80. Ourens, G. Can the Method of Reflections Help Predict Future Growth? LIDAM Discussion Papers IRES 2013008; Université catholique de Louvain, Institut de Recherches Economiques et Sociales (IRES): Louvain-la-Neuve, Belgium, 2013. [Google Scholar]
Figure 1. Theoretical pathways by which GVC upgrading influences regional growth. Source: Authors’ creation.
Sustainability 15 11732 g001
Figure 2. Scatterplot and fitting line of GVC upgrading and economic growth for Chinese cities.
Sustainability 15 11732 g002
Table 1. Descriptive statistics of the variables.
VariableVariable DescriptionObs.MeanStd. Dev.Min.Max.
lnYLog(GDP per capita)38249.830.837.7312.67
GVCExport complexity of a city3824−0.120.28−1.681.05
lnPCLog(per capita capital stock)382410.361.127.4213.41
lnEMLog(employment)38243.610.751.706.89
RDResearch and development38241.481.210.0712.15
lnINFRALog(infrastructure)38240.860.94−3.874.29
OPENOpenness382422.3239.940.14564.88
GOVGovernment intervention382413.366.072.7967.50
lnTECHLog(patents granted per ten thousand people)38246.221.730.6911.53
lnHCLog(students enrolled in general higher education per ten thousand people)38244.361.37−4.617.18
Note: This table shows the sample size, median, standard deviation and minimum and maximum values of each variable in this study. In particular, lnY is the explained variable in the baseline regression; GVC is the explanatory variable in the baseline regression; lnPC, lnTech, and lnHC are the moderating variables; and lnPC, lnEM, RD, lnINFRA, OPEN and GOV are the control variables.
Table 2. Results of panel unit root test.
VariableLLCIPS
LevelFirst DifferenceLevelFirst Difference
lnY−26.230 ***−16.997 ***7.494−14.545 ***
GVC2−16.563 ***−26.830 ***−18.209 ***−31.427 ***
lnpc−54.063 ***−20.385 ***15.383−3.578 ***
lnEM−6.986 ***−11.331 ***−6.756 ***−26.203 ***
rd−28.255 ***−26.527 ***−12.387 ***−28.567 ***
lninfra−24.047 ***−31.053 ***−12.899 ***−28.523 ***
open−18.092 ***−28.713 ***−14.508 ***−33.184 ***
gov−8.353 ***−16.731 ***−8.706 ***−27.006 ***
lntech−10.871 ***−23.250 ***−9.745 ***−29.148 ***
lnhc−30.371 ***−29.142 ***−16.726 ***−29.002 ***
Note: *** p < 0.01.
Table 3. Results of cointegration test.
Statisticp-Value
Modified Phillips–Perron t23.8400.000
Phillips–Perron t−9.1570.000
Augmented Dickey–Fuller t−6.7680.000
Table 4. Benchmark regression results.
Variable(1)(2)
OLSFE
GVC0.0383 **0.159 ***
(0.0160)(0.0249)
lnPC0.618 ***0.497 ***
(0.00616)(0.0122)
lnEM0.0652 ***0.129 ***
(0.00636)(0.0217)
RD−0.0129 ***0.0450 ***
(0.00360)(0.00959)
lnINFRA0.0864 ***0.0536 ***
(0.00698)(0.0158)
OPEN0.00207 ***−0.000135
(0.000113)(0.000245)
GOV−0.0223 ***0.00218
(0.000720)(0.00162)
_cons3.398 ***4.100 ***
(0.0562)(0.103)
N38243824
R 2 0.9180.961
Note: Standard errors are in parentheses. ** p < 0.05, and *** p < 0.01.
Table 5. Robustness test (FE).
Variable(1)(2)(3)
lnYlnYlnRGDP
GVC 0.197 ***
(0.0273)
GVC10.161 ***
(0.0258)
GVC2 0.166 ***
(0.0247)
_cons4.097 ***4.112 ***9.568 ***
(0.102)(0.103)(0.0974)
Control
variables
YesYesYes
N382438243824
R20.9610.9610.961
Note: Standard errors are in parentheses. *** p < 0.01.
Table 6. Endogeneity treatment (2SLS).
Variable(1)(2)(3)(4)
FirstSecondFirstSecond
GVClnYGVClnY
GVC 0.232 *** 0.341 ***
(5.35) (4.22)
L.GVC0.532 ***
(18.25)
0.292 ***
L2.GVC (5.87)
Control
variables
YesYesYesYes
KP-LM83.65 *** 45.13 ***
Shea partial R-sq0.2791 0.0828
Wald rk F333.054 *** 34.43 ***
Observations3585358533463346
R20.5350.9600.3670.957
Number of cities239239239239
Note: T-statistics in parentheses. *** p < 0.01.
Table 7. Heterogeneity analysis (FE).
VariableEconomic ScaleEmployment ScaleYear
GDP < 60 Billion YuanGDP ≥ 60 Billion YuanEM < 300,000EM > 300,0002001–20062007–20092010–2016
(1)(2)(3)(4)(5)(6)(7)
GVC0.116 ***0.270 ***0.123 ***0.230 ***0.0991 ***0.007190.0273 *
(0.0242)(0.0395)(0.0266)(0.0404)(0.0234)(0.0136)(0.0162)
_cons4.146 ***4.146 ***4.104 ***4.162 ***4.048 ***4.092 ***4.861 ***
(0.178)(0.111)(0.184)(0.150)(0.160)(0.118)(0.0962)
Control
variables
YesYesYesYesYesYesYes
N170721171622220114347171673
R20.9480.9610.9570.9640.9200.9370.928
Note: Standard errors are in parentheses. * p < 0.1, and *** p < 0.01.
Table 8. Regional heterogeneity analysis (FE).
Variable(1)(2)(3)(4)(5)
lnYlnYlnYlnYlnY
GVC0.475 ***0.936 ***0.372 ***0.1170.0164
(0.161)(0.211)(0.0998)(0.0816)(0.0438)
_cons3.549 ***4.849 ***5.324 ***4.394 ***3.166 ***
(0.471)(0.273)(0.524)(0.267)(0.287)
Control
variables
YesYesYesYesYes
N288144208448192
R20.9860.9560.9760.9730.985
Note: Standard errors are in parentheses. *** p < 0.01.
Table 9. Mechanism test (FE).
Variable(1)(2)(3)(4)(5)(6)(7)
lnYlnPClnYlnTECHlnYlnHClnY
GVC0.572 ***0.831 ***0.159 ***0.200 **0.151 ***0.340 **0.153 ***
(0.0669)(0.113)(0.0249)(0.0846)(0.0235)(0.158)(0.0250)
lnPC 0.497 ***0.765 ***0.464 ***0.461 ***0.489 ***
(0.0122)(0.0454)(0.0161)(0.0769)(0.0124)
lnTECH 0.0425 ***
(0.0110)
lnHC 0.0179 *
(0.00989)
_cons7.317 ***6.471 ***4.100 ***−5.441 ***4.332 ***−0.3544.107 ***
(0.199)(0.372)(0.103)(0.394)(0.117)(0.598)(0.103)
Control
variables
YesYesYesYesYesYesYes
N3824382438243824382438243824
R20.8230.8080.9610.8620.9620.3620.962
Note: Standard errors are in parentheses. * p < 0.1, ** p < 0.05, and *** p < 0.01.
Table 10. Mediating effects.
VariableMediating Effect
Capital accumulation72.2%
Technological progress5.3%
Human capital upgrading3.8%
Note: Calculated by the authors based on the regression results.
Disclaimer/Publisher’s Note: The statements, opinions and data contained in all publications are solely those of the individual author(s) and contributor(s) and not of MDPI and/or the editor(s). MDPI and/or the editor(s) disclaim responsibility for any injury to people or property resulting from any ideas, methods, instructions or products referred to in the content.

