Article

Effectiveness of Polyvinylidene Fluoride Fibers (PVDF) in the Diffusion and Adsorption Processes of Atrazine in a Sandy Soil

by
Gabriella Melo de Deus Vieira
*,
Moisés Antônio da Costa Lemos
,
André Luís Brasil Cavalcante
and
Michéle Dal Toé Casagrande
Geotechnical Laboratory, Department of Civil and Environmental Engineering, University of Brasília, Federal District, Brasília 70910-900, Brazil
*
Author to whom correspondence should be addressed.
Sustainability 2023, 15(15), 11729; https://doi.org/10.3390/su151511729
Submission received: 30 May 2023 / Revised: 10 July 2023 / Accepted: 26 July 2023 / Published: 29 July 2023

Abstract

:
Sustainable solutions are increasingly being sought in the containment and remediation of contaminated soil and groundwater, and the use of fibers is promising. In this context, polyvinylidene fluoride fibers (PVDF) have potential applications in various fields due to their mechanical and hydraulic properties, highlighting the sorption capacity due to their hydrophobic nature and large surface area. This study aimed to evaluate the sorption capacity, adsorption, and diffusion of atrazine by PVDF fibers with a concentration of 555.63 ppm in diffusion cells containing sandy soil and a composite of the fibers in blanket format at different contents (2% and 4%) relative to the dry mass of the soil. The diffusion and determination coefficients for each cell were calculated using Wolfram Mathematica software by means of a 3D model (Space × Time × cw/c0). The absorption results showed a mass gain, with and without prior drying of the fibers, of 70% and 60%, respectively, while the adapted adsorption tests showed retained amounts of atrazine of 0%, 11.4%, and 21.8%, respectively, for the samples without fiber, with 1.5 g of fiber, and with 4 g of fiber. And finally, the diffusion coefficients resulted in 6.25 × 10⁻¹³ m2/s, 6.03 × 10⁻¹³ m2/s, and 3.64 × 10⁻¹³ m2/s, respectively, for the sample without fibers, with 1.5% fiber, and with 4% fiber. This suggests that the use of PVDF fibers may be a viable solution for the containment of contaminated soil and groundwater.

1. Introduction

There is increasing concern over the presence of toxic substances in soil and groundwater as a result of industrial activities and their associated methods since they can affect both biotas, soil, and water. This is particularly problematic in Brazil, where the economy is heavily reliant on agriculture, and the use of pesticides is a growing issue.
Pesticides are commonly used to control insects, animals, microbes, and weeds, and are divided into various classes based on their intended use. One such class is herbicides, of which atrazine is used specifically for weed control.
According to data from [1], atrazine is the fifth most widely sold active ingredient in Brazil. Studies have shown that exposure to atrazine can have negative effects on the central nervous system, endocrine system, and immune system of humans [2,3,4,5,6]. Due to these health concerns and environmental issues, atrazine was banned in Italy and Germany in 1991 and by the European Union as a whole in 2004. The Maximum Residue Limit (MRL) of atrazine allowed in the EU is 0.1 μg/L, while in Brazil it is 2 μg/L [7], 20 times higher than the EU limit. In the USA, it is 3 μg/L. The World Health Organization (WHO) has established a value of 100 μg/L, which is the sum of atrazine and its metabolites, and this value has been adopted by countries such as New Zealand. Canada, on the other hand, has an MRL of 5 μg/L for all substances.
Atrazine can be transported from the soil via advection and dispersion, and the fate of atrazine during migration can be affected by several chemical and biological processes, including sorption. Advection is the transport of a substance through the flow of water or in a porous medium without a change in concentration. Hydrodynamic dispersion is a physical-chemical process that occurs through diffusion and mechanical dispersion. Diffusion involves the migration of ionic and molecular constituents from high to low-concentration areas in a fluid. Mechanical dispersion is caused by variations in pore size and deviation of particle trajectory. In geotechnical engineering, absorption and adsorption (referred to as sorption) can affect the concentration and mobility of solutes. Absorption is the retention of substances in the pores of soil or absorbent material, while adsorption is the accumulation of contaminants on the surface of particles. Desorption is the opposite of sorption and involves the release of previously sorbed substances.
To address the issue of contamination, geosynthetics and polymer fibers are commonly utilized in the geotechnical field. These materials are favored for their good mechanical properties and diverse functions, such as separation, filtration, drainage, and barrier. One specific material that has been studied is polyvinylidene fluoride (PVDF), which can be found in different forms, such as membranes, fibers, binders, and foams, with membranes being the most common in research.
PVDF is a high-performance polymer belonging to the family of fluoropolymers. It is a thermoplastic and semi-crystalline material that was introduced to the market in the 1960s by Arkema Inc. under the trade name Kynar® PVDF. It has a high density compared to other conventional fibers and a crystallinity level of approximately 50% [8]. PVDF exhibits good mechanical, thermal, and chemical resistance. Due to its low extraction levels, PVDF is considered a pure polymer and is non-toxic, making it suitable for food contact applications. In a study by [9], PVDF was combined with other substances to form a foam and it was observed that PVDF-based materials exhibit excellent chemical resistance, thermal stability, and mechanical properties, involving fast and selective performance and high sorption capacity (see the mechanisms that occur between PVDF fibers and atrazine in Figure 1). Additionally, they suggest that such materials should be cost-effective, efficient, easy to manufacture, and capable of large-scale production.
Other studies have also examined the use of PVDF in a variety of applications. Ref. [10] studied the separation of a mixture of oil and water using a hydrophobic PVDF membrane. Ref. [11] used a PVDF membrane as a strain gauge, while Refs. [12,13] studied the use of PVDF in hemodialysis membranes.
In the fiber format, there are studies like [14] that used PVDF fibers to fabricate a mechanomyography (MMG) sensor. However, in the geotechnical field, only one article was found using this material, where [15] studied PVDF sand-fiber composites using 3D X-ray imaging.
In view of the scarcity of studies with this promising material, this study aims to evaluate the use of PVDF fibers in sandy soil as an adsorption element so that the fibers can act as a barrier to atrazine. Specifically, the study will conduct diffusion tests with the soil-PVDF fiber composites in a blanket format, with 2% and 4% in relation to the dry mass of soil.

2. Materials and Methods
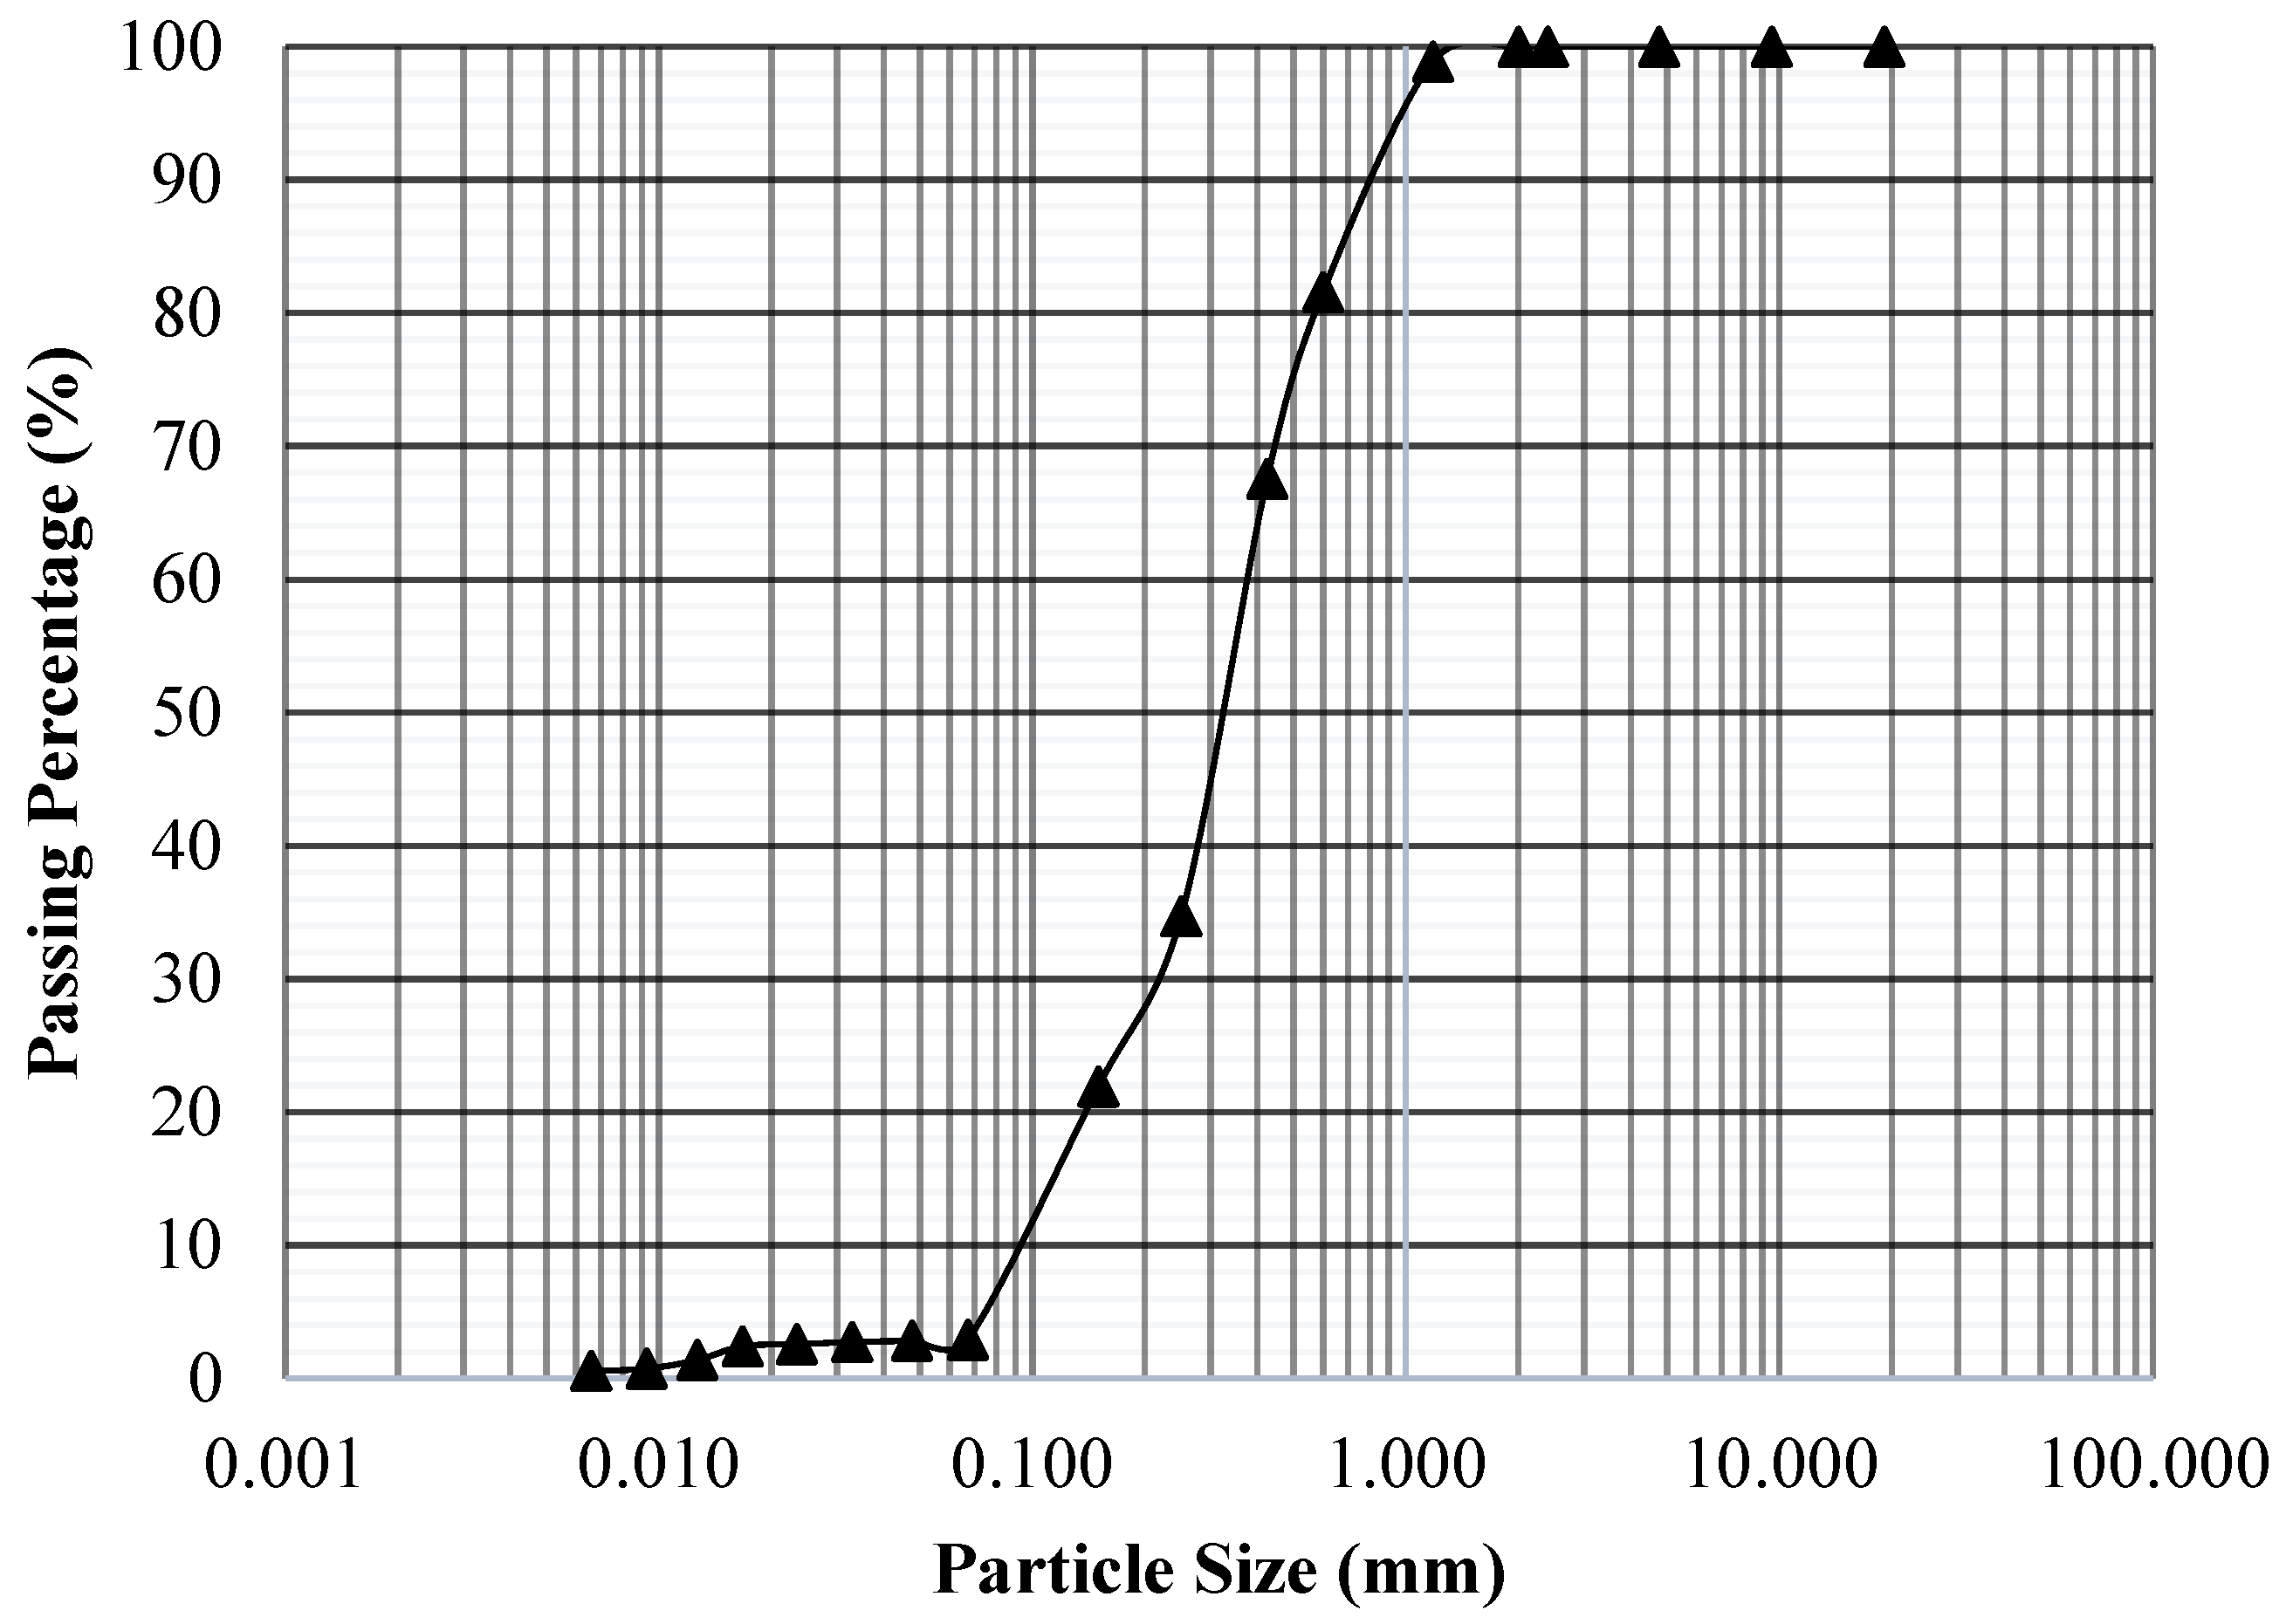
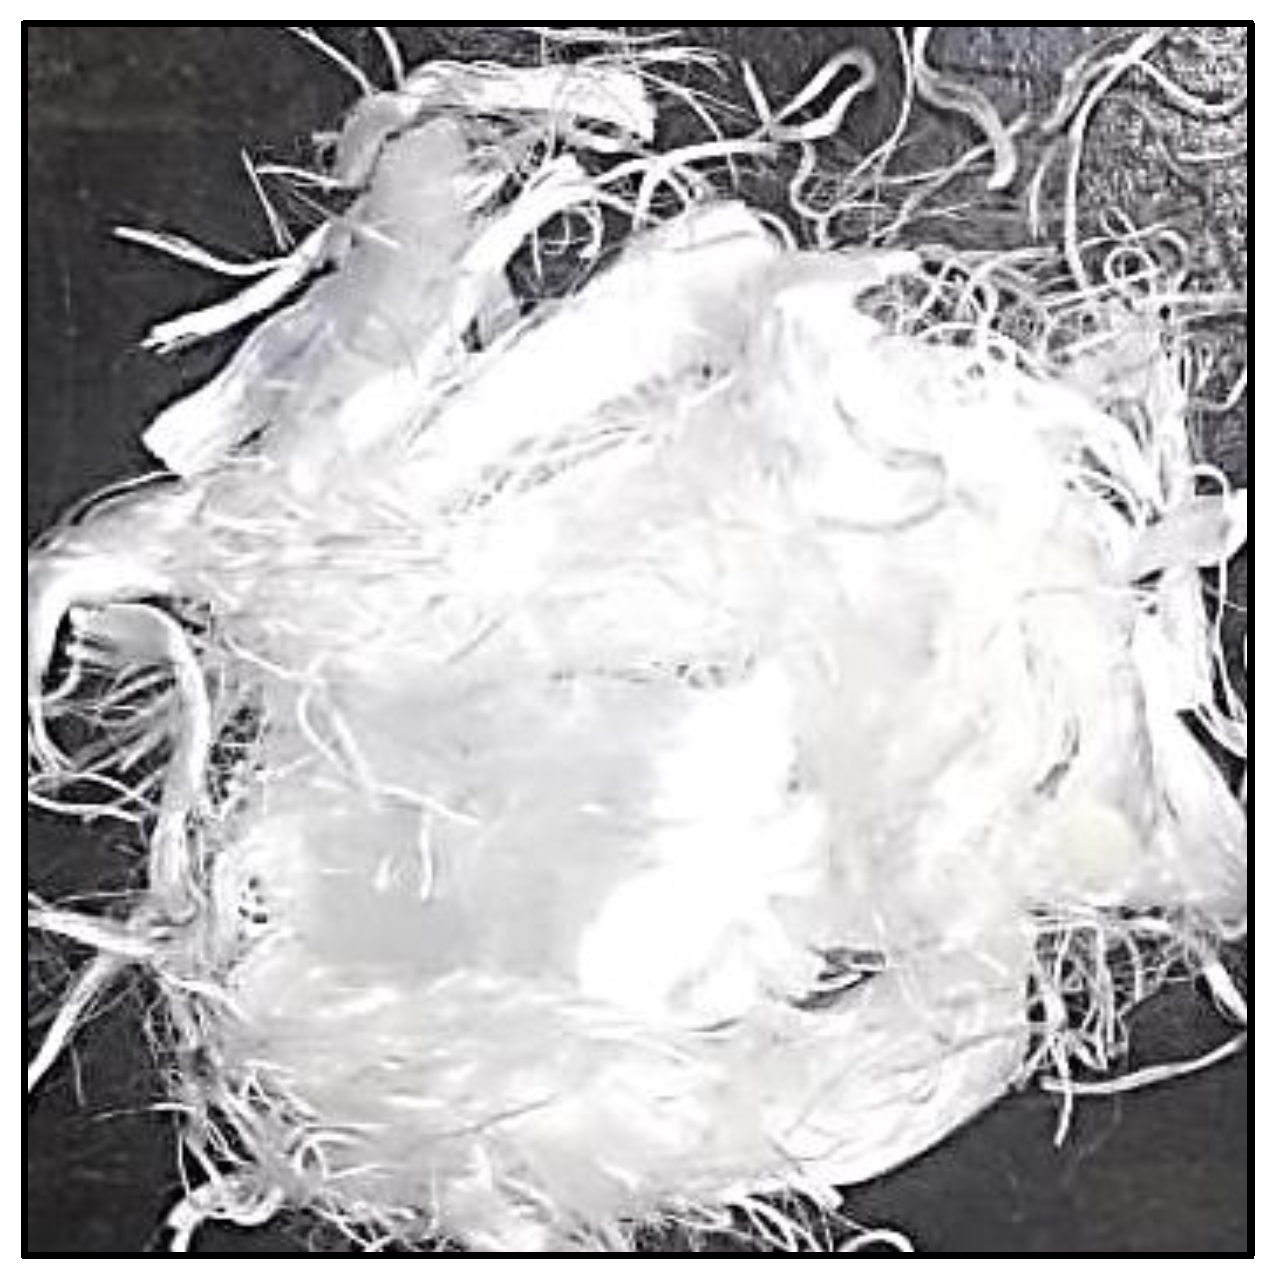
2.1. Materials

The soil used in this study is well-graded sand with a specific gravity of solids of 2.67 mg/m3 measured by means of a pycnometer (Pentapyc model 5200e), a uniformity coefficient (Cu) of 4.1, a curvature coefficient (Cc) of 1.5, an effective diameter of 0.33 mm obtained through the granulometry test by the Brazilian standard [16], and minimum and maximum void ratios of 0.586 and 0.894 obtained by the standards [17,18], respectively. The choice to use sand was made due to its inert nature, which minimizes the likelihood of a reaction with the PVDF fibers and atrazine contaminant. Figure 2 shows the granulometric distribution curve obtained for the soil used in the study.
According to the data obtained from the granulometry test, the soil has 0.58% clay (<0.002 mm), 2.33% silt (0.002 to 0.06 mm), 31.78% fine sand (0.06 to 0.2 mm), 46.89% medium sand (0.2 to 0.6 mm) and 18.43% coarse sand (0.6 to 2.0 mm). Therefore, because it is a soil consisting of 97.1% sand, mostly medium sand, it is considered, by the Unified Soil Classification System (USCS), as a well-graded sand (SW), without plastic characteristics.
The PVDF fibers used in the research were sourced from Arkema in Johnson City, Tennessee, USA. These fibers have a diameter of 3 deniers per filament (0.0154 mm), a length of 25 mm, and a density of 1.78 g/cm3 (as shown in Figure 3).
The atrazine contaminant used in the study was obtained from Siptran (located in the city of São Paulo, State of São Paulo, Brazil). The concentration of atrazine applied in the trials was based on a concentration of 556 ppm (mg/L) of atrazine in soil exposed to the substance after rainfall events [19].

2.2. Experimental Study

2.2.1. Absorption Test

The fiber absorption test has no specific existing standard, so the test performed in this research followed the procedure of two absorption tests in the literature [20,21], based on the [21] that portrays the determination of water absorption by immersion in concrete.
To determine the absorption of atrazine by PVDF fibers in this study, 1 g of the 25 mm length fibers was used in each test. For comparison purposes, the tests were performed with and without prior drying of the fibers before immersion during the determination of the dry weight of the fibers (Pe). The samples subjected to previous drying were placed in an oven at 105 °C for approximately 4 h. Then, the samples were immersed in the substance at intervals of 1, 2, 4, 8, 15, 30, 60, 120, 240, and 480 min and weighed to obtain the wet weight of the fiber (Pht), in order to determine the absorbance according to Equation (1), expressed in [22]. During the weighing, absorbent paper was used to remove the excess substance in the samples.
A = P h t P e P e × 100 %
After the absorptions were calculated, it was possible to plot curves of mass gain (%) versus time.

2.2.2. Adsorption Test

In this test, it is proposed to verify the adsorption in the PVDF fibers by means of adapted equipment, in which the fibers were arranged in a blanket in a container that has openings and that allows the flow of substances. This way, the flow rate with which atrazine passes through the fibers and the amount adsorbed that passed through the material were measured. Several tests with atrazine were performed using 50 mL of the solution with 555.63 ppm and 1.5 g and 4 g of PVDF fibers. Figure 4 depicts the scheme of the test.

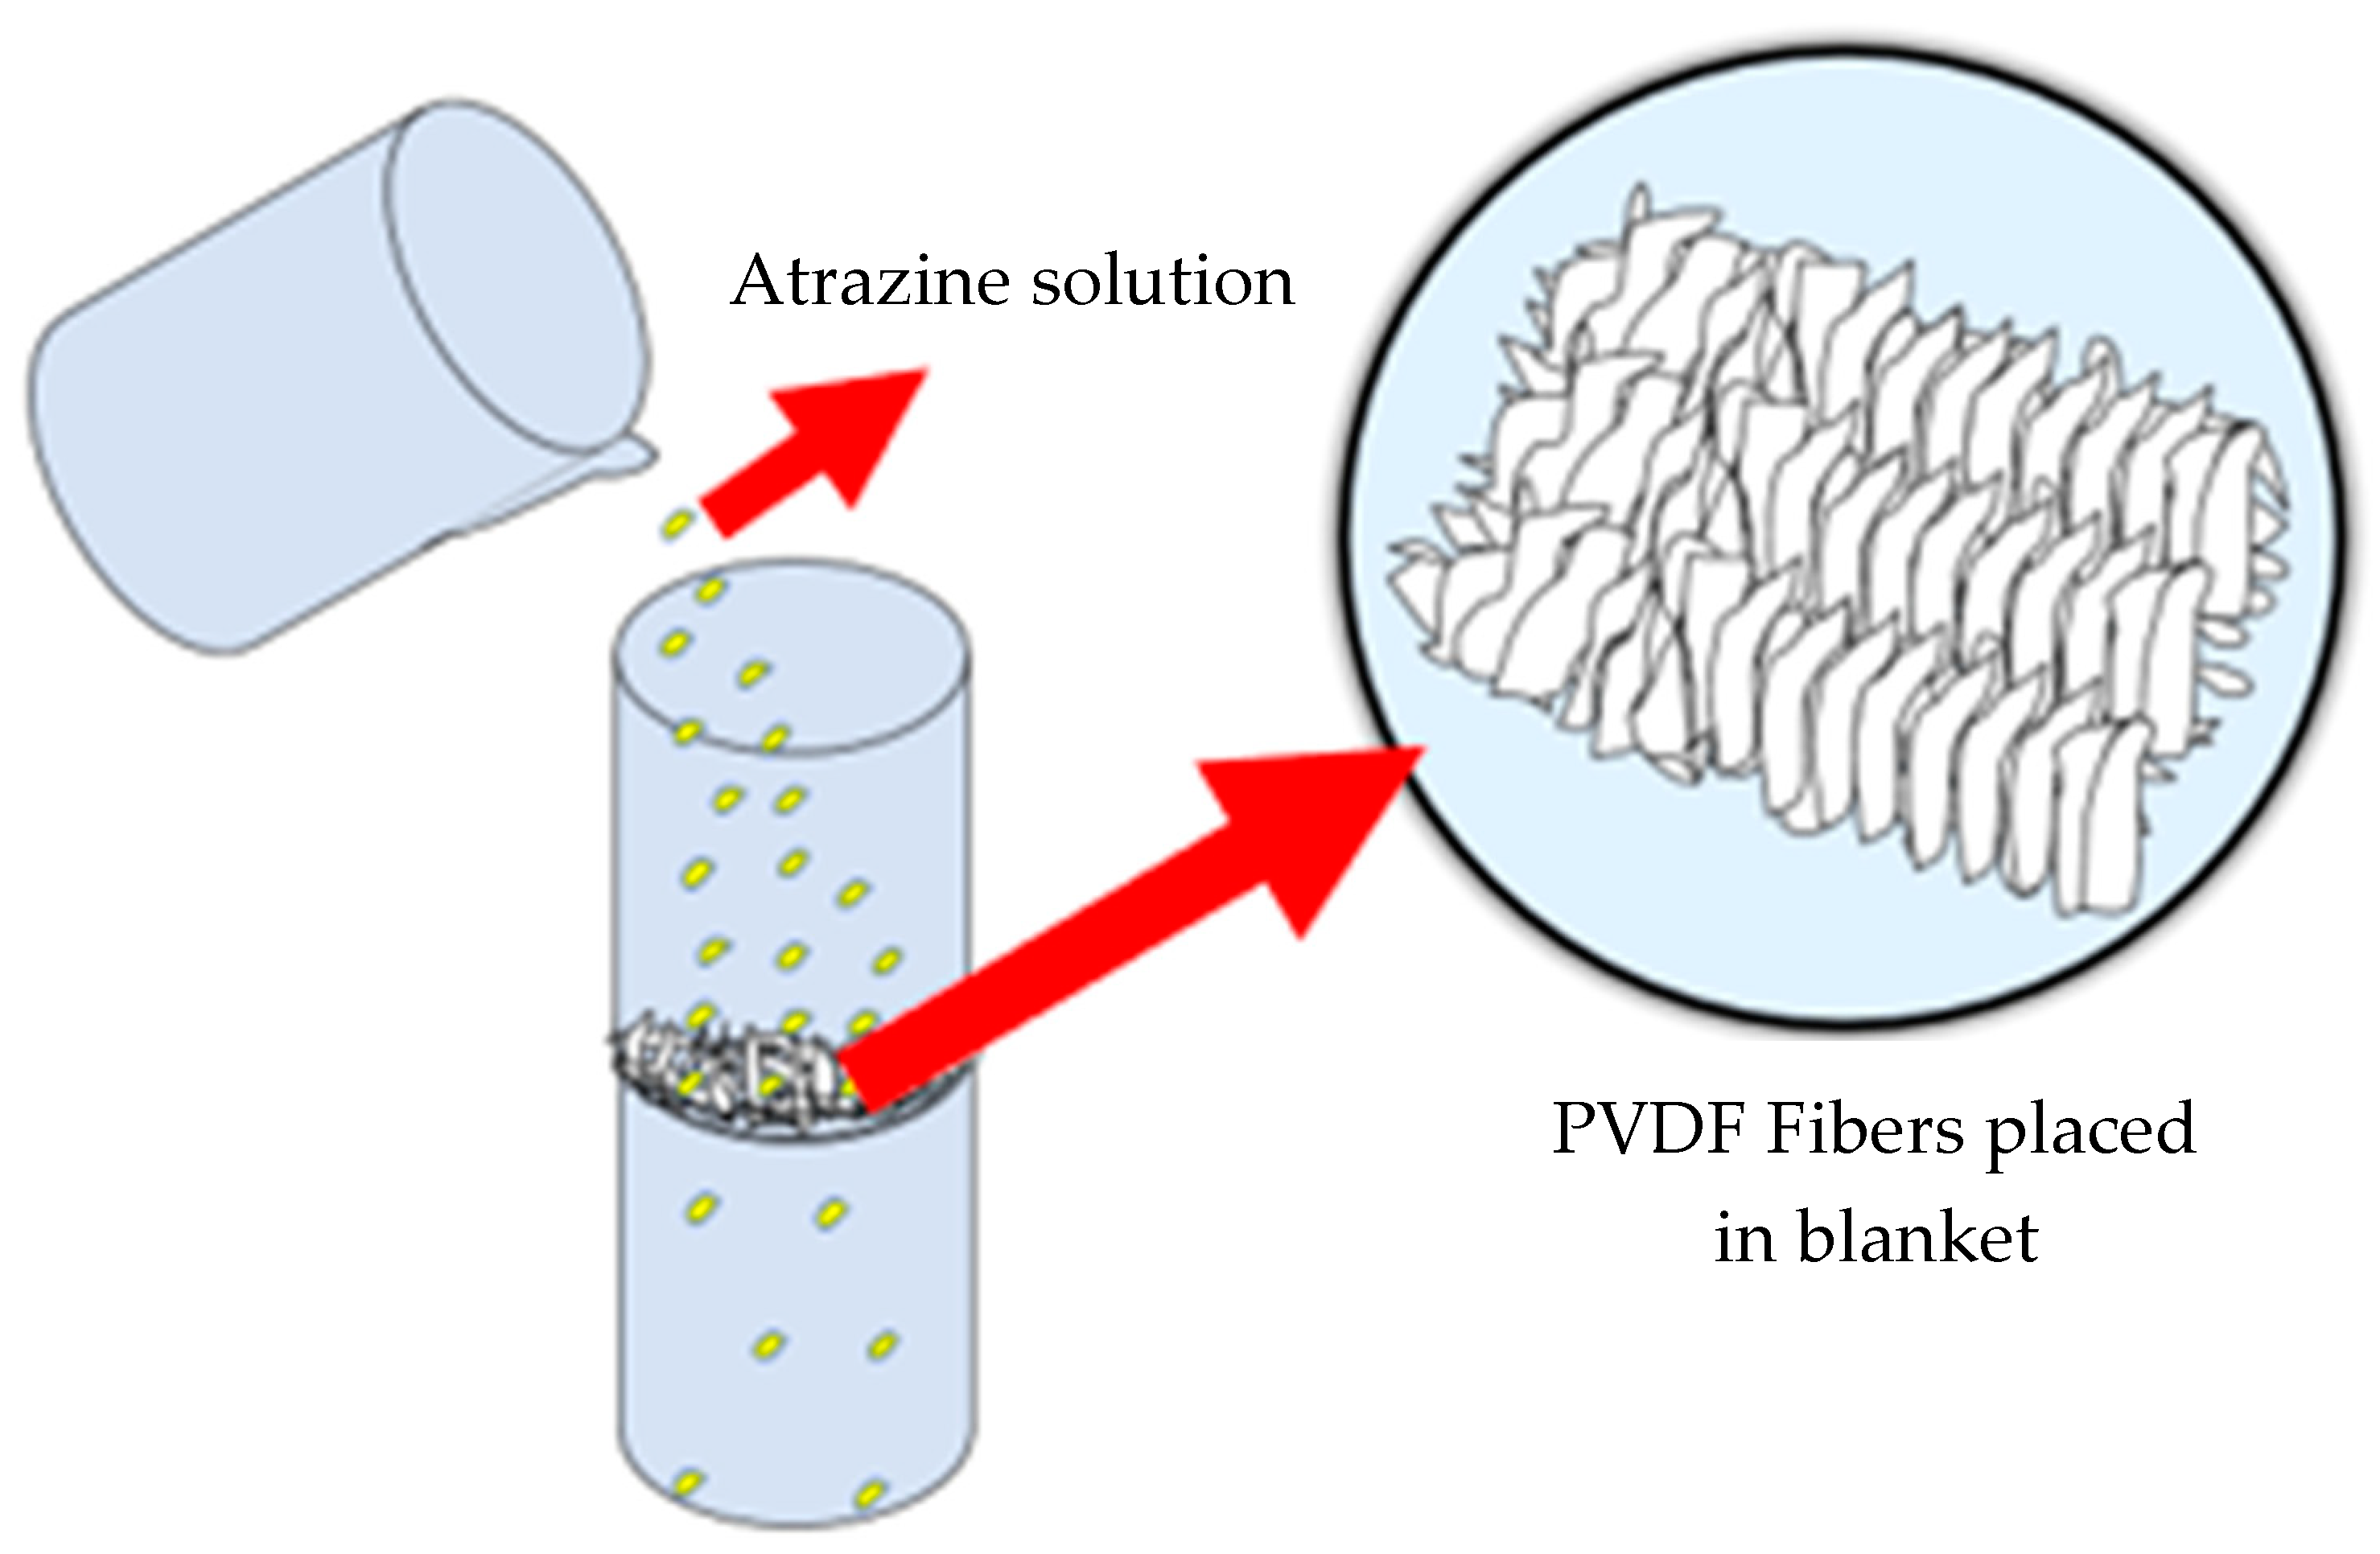
2.2.3. Diffusion Test

To conduct the diffusion tests, custom-made acrylic cells were utilized. These cells, designed specifically for the research, were developed by [23] and feature dimensions of 11.64 cm in height and 10.16 cm in diameter. The cells are connected to a base and have a removable cover that is attached using screws. In addition, there is a smaller opening on the lid that allows for the removal of samples from the liquid phase.
The test procedure involves placing the soil (or soil-fiber composite) in the lower 1/3 of the cell and filling the remaining 2/3 with the adsorbate (atrazine). With the initial contaminant concentration established, the diffusion process begins, resulting in a portion of the concentration transferring to the sandy soil (Figure 5).
In this study, three diffusion tests were conducted: Cell 1, which contained only saturated sandy soil in contact with atrazine (without fibers); Cell 2, comprised of a PVDF fiber-soil composite in a blanket format (2% in relation to the dry mass of soil); and Cell 3, also a PVDF fiber-soil composite in a blanket format, but with a content of 4% in relation to the dry mass of soil.
To prepare the atrazine solution, a dilution calculation was necessary as the atrazine used in the tests was already manufactured in the solution. Equation (2) was used for the dilution of the substance in water.
c 1 · V 1 = c 2 · V 2
where, c1 = the manufacturing concentration of the atrazine solution [M · L−3]; V1 = the volume of product (solution with atrazine) that is sought with the equation [L3]; c2 = the initial concentration of atrazine desired in the test [M · L−3] and V2 = the volume equivalent to 2/3 of the height of the cell [L3].
By setting c1 to 500,000 mg/L, c2 to 555.63 mg/L, and V2 to 0.63 L, we were able to determine that 0.69 mL of atrazine was present in each cell.
The diffusion tests were conducted for a period of 18 days. During this time, 20 mL of samples were taken every 3 days from the liquid phase of each cell, which was kept at a controlled temperature between 21 and 23 degrees Celsius. Additionally, soil samples were taken every 1 cm in-depth in the center of the cells after the tests were completed. These samples were then taken to the laboratory for chemical analysis. Figure 6 illustrates the cells that were tested.
We chose to use saturated soil in these tests to avoid any interference that may occur when using soil in unsaturated conditions, such as the contaminant infiltrating the unsaturated zone of the soil and being partially retained or the formation of air bubbles. The methodology proposed by [24,25] was implemented using Wolfram Mathematica Software to obtain the contaminant transport parameters, such as the diffusion coefficients.

2.3. Chemical Analysis

When the liquid phase samples (collected at the top of the cells) and soil samples (collected in the center of the soil layers) were obtained, they were sent to the Quinosan chemistry laboratory to determine the concentrations of atrazine in the samples.
The first step in the chemical analysis was to calibrate the equipment, a UV-340G from Gehaka. To do this, we performed blank curves or calibration curves, in which different known concentrations of the contaminant (1, 3, 5, 10, 15, 20, and 25 mg/L) were used to measure the corresponding absorbance (Figure 7). This concept is based on the Lambert-Beer Law (Equation (3)) [26]. According to the Lambert-Beer law, absorbance is directly proportional to the optical path through the medium, which can be best explained as the path taken by light in the sample and the concentration of the absorbing species. This is given by the equation:
A = ε · l · c
where: ε = the molar absorbance [M−1 · L2]; l = the optical path [L] and c = the concentration [M · L−3].

2.4. Computational Analysis

The software known as POLLUTE has gained widespread usage in soil contaminant diffusion modeling, as demonstrated by several studies [23,26,27,28,29,30,31]. Originally developed for designing liners in contamination containment systems, this software employs a semi-analytical approach to solve the Partial Differential Equation (PDE) governing the diffusion process [32].
The solution implemented in POLLUTE considers a semi-infinite domain divided into two regions by the interface between soil and contaminant solution. It incorporates the volume of the contaminant reservoir into the algorithm through an equivalent height parameter [33]. However, accurately modeling the diffusion test using POLLUTE requires iteratively adjusting the diffusivity parameters until a visual agreement between experimental and modeled data is observed. Therefore, utilizing POLLUTE for diffusion test modeling becomes an inverse problem, where parameters are repeatedly modified until visual agreement is achieved.
An analytical solution was presented by [34], considering an infinite domain. Unlike the solution implemented in POLLUTE, Ref. [34] accounted for an infinite soil deposit. They stated that their simplified solution is useful for conducting rapid sensitivity analyses, preliminary liner designs, and verifying results from more complex simulations.
Ref. [32] proposed a simplified solution that closely approximates the exact solution presented by [35]. The advantage of this approach is that it allows for numerical-analytical computation of flow time and/or clay liner thickness. However, both of these solutions do not consider single-reservoir test conditions. Ref. [36] introduced an analytical solution for the three-dimensional advective-dispersive equation (ADE) using Fourier and Laplace integral transforms. This solution addresses cases where the contaminant plume moves at an angle with respect to the coordinate axes. However, it assumes an infinite three-dimensional domain, which does not accurately represent a single-chamber test scenario.
Nevertheless, there is no consensus on the correct approach for modeling the single-chamber diffusion test. Either the boundary and initial conditions considered in the solutions do not accurately reflect the test’s nature, or the available software does not directly estimate the involved parameters.
In this paper, a more recent alternative solution, referred to as the Equivalent Contaminated Layer Solution (ECL), is employed. The ECL solution simplifies the differential equation by utilizing standard functions and is suitable for everyday situations. It was developed by [37] with the aim of calibrating the pure diffusion test. In this solution, the reservoir is represented as a contaminated soil layer with a thickness of b, and its volume is designed to possess the same diffusion resistance as the solution of height H in the reservoir (Figure 8). The authors provide a method for determining b based on experimental data obtained during the diffusion test.
At the initial time, the concentration of contaminants in the contaminated equivalent soil layer is equal to the initial concentration in the contaminant solution (c0) and is zero in the soil sample being tested. The initial conditions for the test, as proposed by [37], are as follows (Equations (4) and (5) and Figure 9):
c w 0 x b , t = 0 = c 0
and
c w b < x b + L , t = 0 = 0
where, cw = the mean solute concentration in liquid phase [M · L−3]; c0 = the initial solute concentration in the liquid phase [M · L−3]; b = the contaminated soil thickness [L]; L = the soil thickness [L]; x = the space variable [L] and t = the time variable [T].
In this solution, the spatial domain ranges from 0 to L + b, and the time domain ranges from 0 to infinity. The ECL solution also assumes that there is no flux crossing the base of the sample and that no additional contaminant mass is added to the equivalent soil layer. By applying these conditions to the diffusion equation, the following Equation (6) [38] is obtained:
c w ( x , t ) c o = b L + b + 2 π m = 1 1 m sin b · m · π L + b cos m · π · x L + b exp D * R m · π L + b 2 · t
where, D * = the effective diffusion coefficient of the soil [L · T−2]; R = the retardation factor [nondimensional]; and m = the integer greater than 1.
This solution offers a simpler method for modeling the single-chamber diffusion test, which relies on standard functions and can be easily implemented in practice. It is important to note, however, that there is currently no consensus on the most appropriate method for modeling this type of test, and that further research is needed to establish the best practices.

3. Results

3.1. Absorption Test

The curves of mass gain versus time in solution with atrazine are shown in Figure 10. Due to the exposure of atrazine in the laboratory and due to restrictions during the pandemic, it was decided to set the duration time of the tests at 480 min. Absorption peaks were observed in the initial time intervals of the assays, and the highest value of mass gain was 74%. These values were found in the curves referring to the assay with previous drying. It was expected that the previous drying of the fibers would remove part of their initial moisture, thus increasing the number of voids in the pores of the fibers to be filled by the absorbent material. However, little variation in the fiber mass after previous drying (between 0.003 and 0.005 g) was observed, indicating that the heating process of the fibers may have changed them structurally. Also, all curves showed a peak at the beginning of the tests, which was interpreted as the situation in which the fibers absorbed a greater amount of water at the moment they were immersed, but in the following minutes, with shorter time intervals, they could not absorb as much as before because the pores were already filled.

3.2. Adsorption Test

Table 1 shows the results of the adsorption tests adapted with the atrazine solution.
It was possible to observe in the tests with PVDF fibers, lower flow rates with which the solution percolated when compared to test 1 without fibers. This behavior can be explained by the hydrophobicity characteristic and the contact surface of PVDF. It is suggested that the fibers are able to adsorb substances for a while but start to open voids between them that allow contaminants to pass through. Comparing tests 2 and 4, it can be seen that with the increase in the number of fibers, there is a slight reduction in the flow rate and an increase in the amount of contaminant solution retained. It is worth mentioning the sensitivity of the adsorption tests. It was possible to observe that in some cases the sum of the amount retained and passing did not result in the initial amount of the substances, this may be associated with the loss of material on the walls of the containers and also in the weighing of fibers since they go through a drying process with absorbent paper to remove the excess substances.

3.3. Diffusion Test

The diffusion test was conducted over 18 days (432 h) and the results were recorded in Table 2, which shows the concentrations of the liquid phase samples. Table 3 presents the concentrations of atrazine in soil samples at depths of 0.5 to 4.5 cm. A deeper depth was recorded in Cell 3 due to the higher fiber content in the soil.

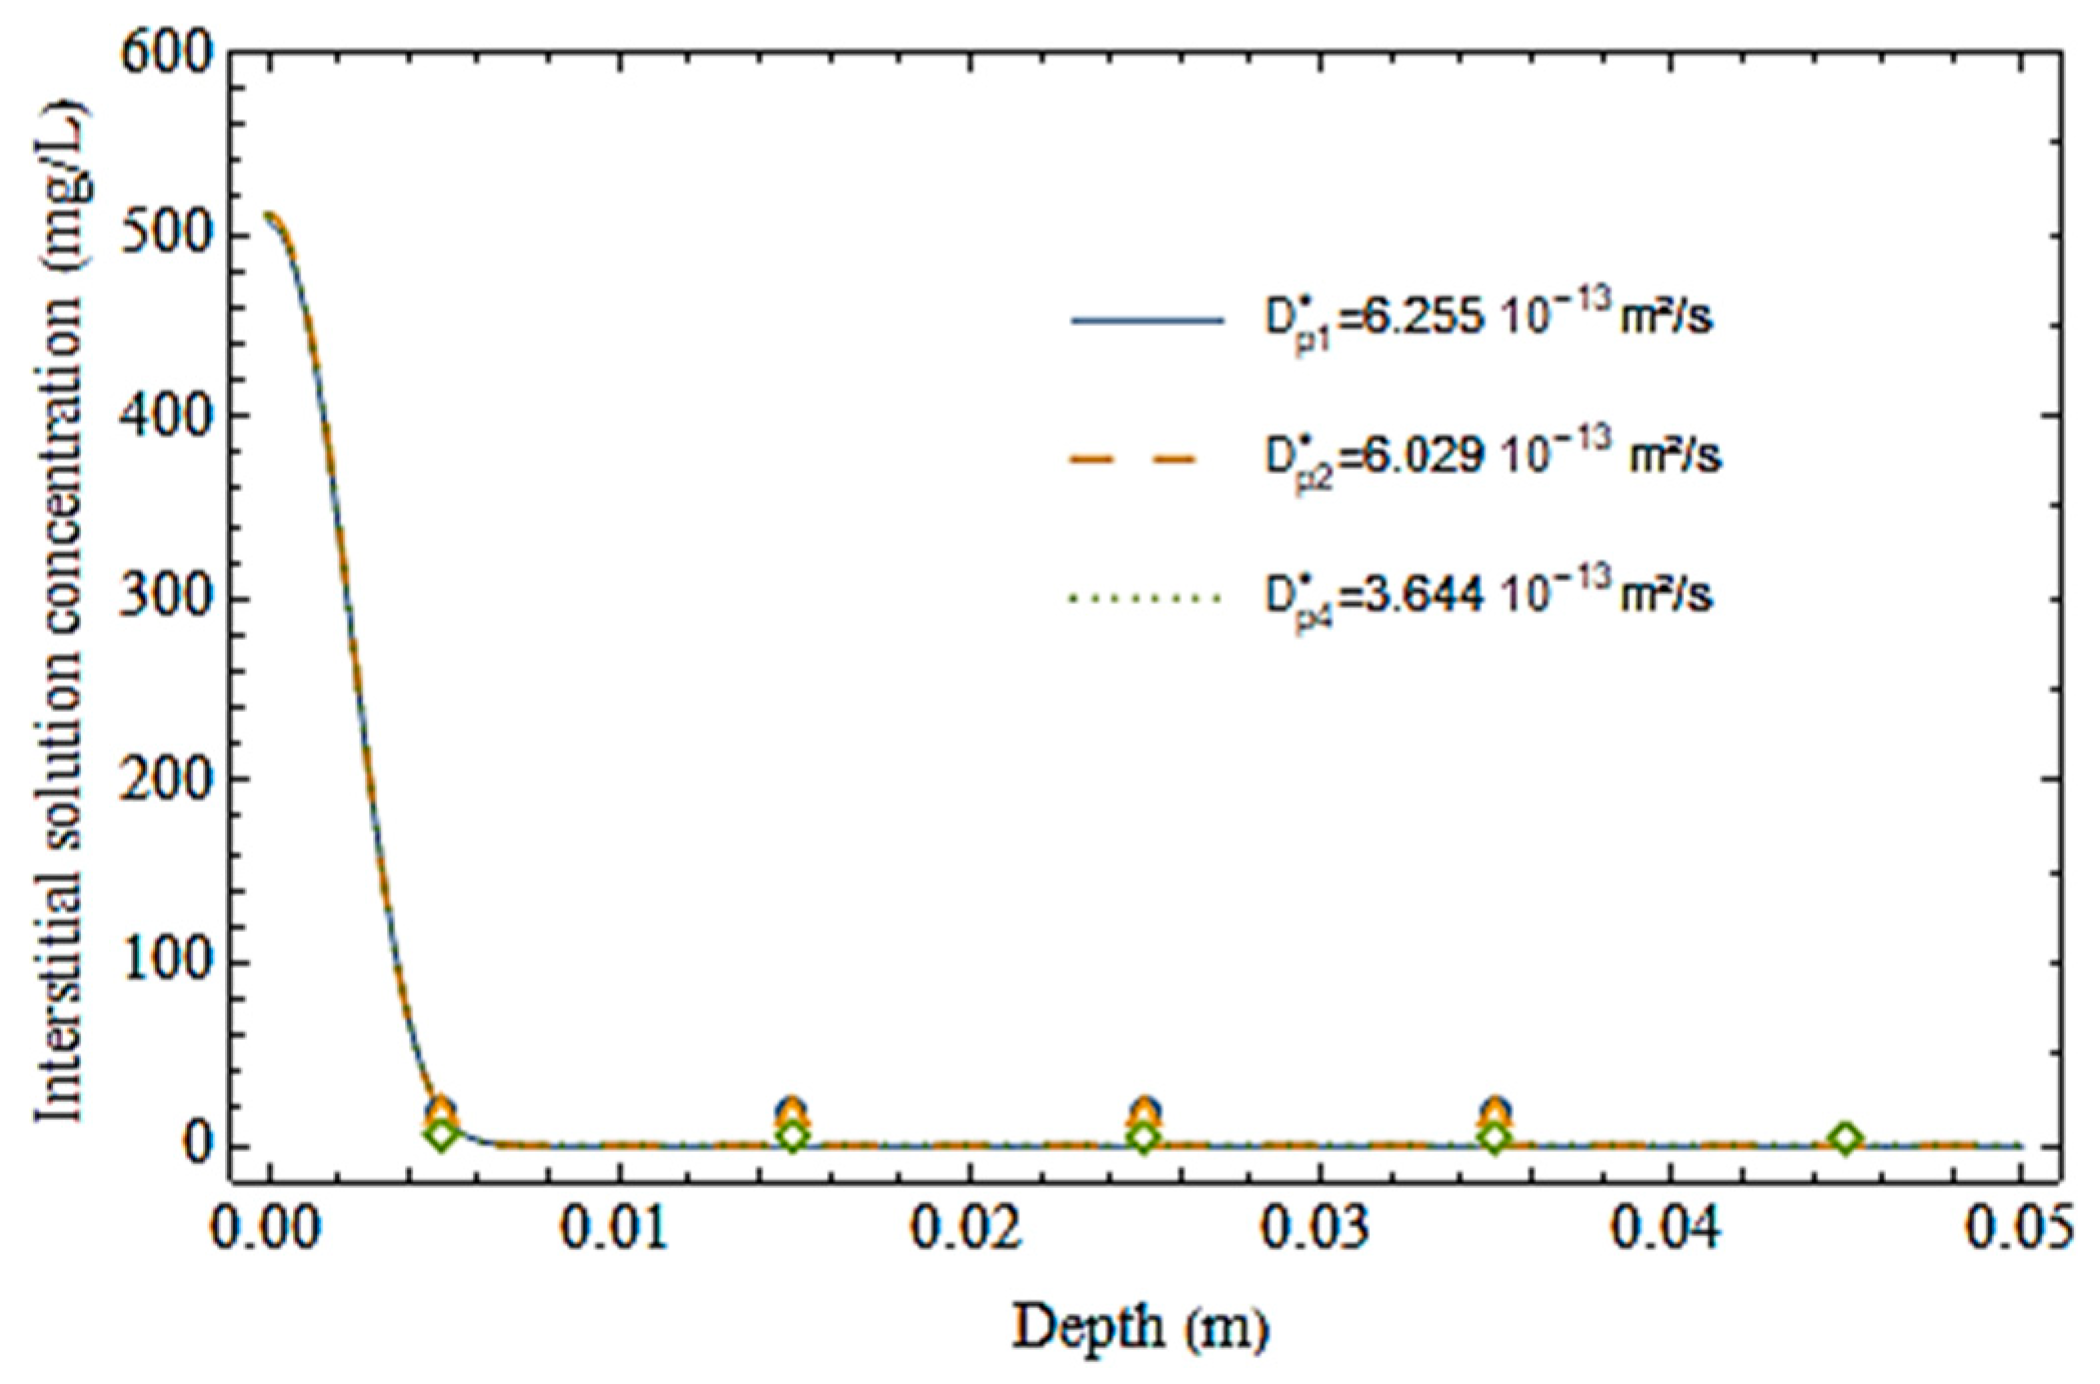
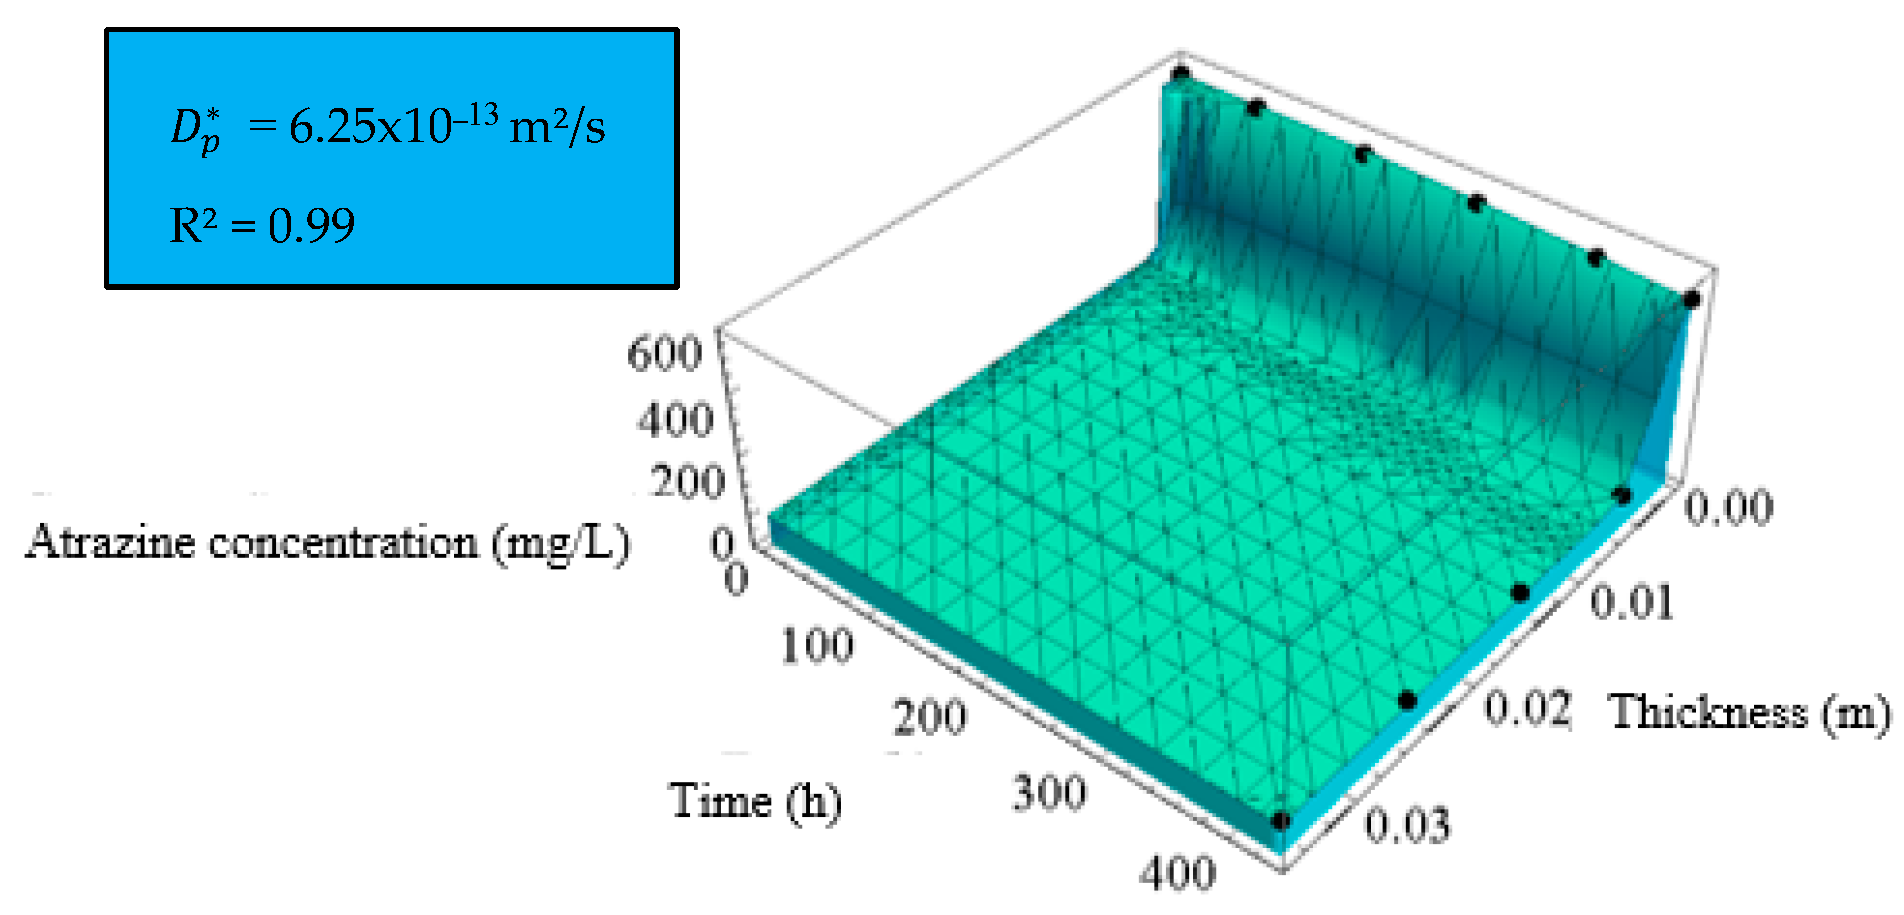
3.4. Computational Analysis

A computational analysis was conducted utilizing the solution proposed by [39] and the Wolfram Mathematica software to calibrate diffusion tests. The model facilitated the calculation of diffusion coefficients and the adjustment of the three-dimensional model (space × time × cw/c0) as proposed by [40,41]. The developed tool is able to adjust parameters both in time and space, simultaneously, which can be visualized as a three-dimensional surface. Table 4 presents the results obtained from the model.
Figure 11 illustrates that there was minimal variation in the concentration of atrazine during the 18 days of testing in all cells. However, the curve for the cell in which 4% PVDF fibers were used in the blanket format demonstrated the best behavior, as the variation in concentration in the upper part was significantly smaller compared to the other cells. This suggests that most of the contaminants remained in the upper part of the cell and did not penetrate the soil layers.
Previous studies [42,43,44] have proposed that the liquid phase can be divided into mobile and immobile regions, where the immobile regions are those in which sorption occurs immediately and the mobile regions are time-dependent. In the model proposed by [44], the mobile zones of substances potassium bromide (KBr) and atrazine were evaluated and the results revealed that in different situations, the concentrations of these substances changed over time and their curves showed concentration peaks ranging from 400 h to 2000 h. It is important to note that the sorption/adsorption of a substance will depend on the properties of the soil and the experimental conditions.
Figure 12 displays the concentrations of atrazine in the interstitial solutions in the soil samples according to the depth of the specimen. As the content of the substance that percolated into the soil was low compared to the initial concentration in all cells, it was not noticeable in the model graph. To better visualize the curves, Figure 13 was generated.
Finally, Figure 14, Figure 15 and Figure 16 show the 3D fits (space × time × cw/c0) of the model.
In the literature, there have been several studies that have investigated the diffusion and adsorption of atrazine in various types of soils. For example, Ref. [43] determined the diffusion coefficient of atrazine in sandy soil to be 6.5 × 10⁻¹⁰ m2/s, while [44] conducted column tests on disturbed soil samples and found that the dispersion coefficient values ranged from 4.89 × 10⁻⁶ m2/s to 1.22 × 10⁻⁵ m2/s for sandy clay soil and from 5.22 × 10⁻⁶ m2/s to 1.23 × 10⁻⁵ m2/s for clayey soil. These results demonstrate a significant variation in the diffusion and adsorption of atrazine in different types of soils.
Several factors have been identified as influencing the adsorption of atrazine, such as the organic carbon content, water pH, soil mineralogy, and particle size distribution [45]. Additionally, Refs. [46,47] noted that the type of pesticide and the specific surface of the mineral can also affect the process.
Ref. [48] studied the impact of soil texture on herbicide transport and found that the initial leaching rates of atrazine were higher in silty-clay soils than in sandy-clay soils. The authors suggested that this behavior may be related to macro-pore flux in the silty-clay soils. Ref. [49] simulated the adhesion and diffusion of atrazine in sandy soils, and one of the conclusions of the study was that atrazine has a more pronounced tendency to remain bound to water molecules rather than the silica present in the soil.
In summary, the diffusion and adsorption of atrazine in soils are influenced by various factors such as soil mineralogy, organic carbon content, water pH, particle size distribution, and type of pesticide. The research proposal of this study, however, aimed to evaluate the influence of fiber insertion in the soil, under the same conditions for all tested cells.

4. Conclusions

In general, in the absorption tests, the PVDF fibers showed a high potential for absorption (above 50%), whose greatest gain in mass was 74%. In the adapted adsorption tests, with the fibers arranged in a blanket format, a reduction in the flow rate and in the passing amount of the analyte was observed. It was possible to verify that increasing the number of fibers inserted also increases the adsorption, reducing even more the flow and the throughput of the analyte. Regarding the diffusion tests, the results of the concentration of the solution samples over time revealed that there was a slight reduction of atrazine concentration at the top of the diffusion cell with time in all tests. Cell 1, which did not have the insertion of fibers, displayed the greatest difference between the final and initial concentrations. In contrast, cell 3, which incorporated 4% PVDF fibers in relation to the dry mass of soil in the blanket format, exhibited the lowest concentration variation. It was determined that the increase in the insertion of PVDF fibers led to a reduction in the diffusion of atrazine over time.
In terms of the interstitial concentration in the cell specimens, it was observed that most of the contaminant remained above the first soil layer (0.5 cm deep) during the 18 days of testing, making it difficult to evaluate the effectiveness of the fibers in this case. However, it was possible to notice a brief change in the slope of the curves from the points of 1.5 cm and 2.5 cm (in the case of cell 3), which is exactly where the fibers were placed.

Author Contributions

Conceptualization, M.D.T.C.; methodology, G.M.d.D.V.; software, G.M.d.D.V.; validation, A.L.B.C. and M.D.T.C.; data analysis, M.A.d.C.L.; writing—original draft preparation, G.M.d.D.V.; writing—review and editing, A.L.B.C.; supervision, M.D.T.C.; project administration, M.D.T.C.; funding acquisition, M.D.T.C. All authors have read and agreed to the published version of the manuscript.

Funding

The APC was funded by the University of Brasília and the National Council for Scientific and Technological Development (CNPq), with process number 405486/2022-7.

Institutional Review Board Statement

Not applicable.

Informed Consent Statement

Not applicable.

Data Availability Statement

Not applicable.

Acknowledgments

The authors wish to express their gratitude for the financial support provided by the Brazilian government through the Federal District Research Support Foundation (FAP/DF) and National Council for Scientific and Technological Development (CNPq).

Conflicts of Interest

The authors declare no conflict of interest.

References

  1. Brazilian Institute of the Environment and Renewable Natural Resources (IBAMA). 2021. Available online: http://www.ibama.gov.br/phocadownload/qualidadeambiental/relatorios/2019/Os_10_IAs_vendidos_2019.xls (accessed on 16 November 2022).
  2. Mencoboni, M.; Lerza, R.; Bogliolo, G.; Flego, G.; Pannacciulli, I. Effect of atrazine on hemopoietic system. In Vivo 1992, 6, 41–44. [Google Scholar]
  3. Cooper, R.L.; Goldman, J.M.; Stoker, T.E. Neuroendocrine and reproductive effects of contemporary-use pesticides. Toxicol. Ind. Health 1999, 15, 26–36. [Google Scholar] [CrossRef]
  4. Sanderson, J.T.; Letcher, R.J.; Heneweer, M.; Giesy, J.P.; Vandenberg, M. Effects of chloro-s-triazine herbicides and metabolites on aromatase activity in various human cell lines and on vitellogenin production in male carp hepatocytes. Environ. Health Perspect. 2001, 109, 1027–1031. [Google Scholar] [CrossRef] [PubMed]
  5. Rodriguez, V.M.; Thiruchelvam, M.; Cory-Slechta, D.A. Sustained exposure to the widely used herbicide atrazine: Altered function and loss of neurons in brain monoamine systems. Environ. Health Perspect. 2005, 113, 708–715. [Google Scholar] [CrossRef] [PubMed] [Green Version]
  6. Rowe, A.M.; Brundage, K.M.; Barnett, J.B. In vitro atrazine exposure inhibits human natural killer cell lytic granule release. Toxicol. Appl. Pharmacol. 2007, 221, 179–188. [Google Scholar] [CrossRef] [PubMed] [Green Version]
  7. Brazil—Ministry of the Environment, Conama Resolution No. 357. Classificação das Águas, Doce, Salobra e Salgada do Território Nacional. D.O.U. nº 053: Brasília, Brazil, 2005; pp. 58–63. Available online: https://www.icmbio.gov.br/cepsul/images/stories/legislacao/Resolucao/2005/res_conama_357_2005_classificacao_corpos_agua_rtfcda_altrd_res_393_2007_397_2008_410_2009_430_2011.pdf (accessed on 16 November 2022).
  8. Salmazzo, G.R.; Falcão, E.A.; Caires, A.R.L.; Garcia, D.; Eiras, J.A.; Botero, E.R. Síntese e caracterização estrutural de compósitos a base de poli(fluoreto de vinilideno)/(Pb0.91La0.09)(Zr0.65Ti0.35)0.98O3. Cerâmica 2014, 60, 83–87. [Google Scholar] [CrossRef] [Green Version]
  9. Bentini, R.; Pola, A.; Rizzi, L.G.; Athanassiou, A.; Fragouli, D. A highly porous solvent free PVDF/expanded graphite foam for oil/water separation. Chem. Eng. J. 2019, 372, 1174–1182. [Google Scholar] [CrossRef]
  10. Kong, J.; Li, K. Oil removal from oil-in-water emulsions using PVDF membranes. Sep. Purif. Technol. 1999, 16, 83–93. [Google Scholar] [CrossRef]
  11. Meng, Y.; Yi, W. Application of a PVDF-based stress gauge in determining dynamic stress-strain curves of concrete under impact testing. Smart Mater. Struct. 2011, 20, 065004. [Google Scholar] [CrossRef]
  12. Zhang, Q.; Lu, X.; Zhao, L. Preparation of Polyvinylidene Fluoride (PVDF) Hollow Fiber Hemodialysis Membranes. Membranes 2014, 4, 81–95. [Google Scholar] [CrossRef]
  13. Zhang, Q.; Lu, X.; Liu, J.; Zhao, L. Preparation and preliminary dialysis performance research of polyvinylidene fluoride hollow fiber membranes. Membranes 2015, 5, 120–135. [Google Scholar] [CrossRef] [PubMed] [Green Version]
  14. Pan, C.T.; Chang, C.C.; Yang, Y.S.; Yen, C.K.; Kao, Y.H.; Shiue, Y.L. Development of MMG sensors using PVDF piezoelectric electrospinning for lower limb rehabilitation exoskeleton. Sens. Actuators A Phys. 2019, 301, 111708. [Google Scholar] [CrossRef]
  15. Soriano, I. 3D Characterization of a Fiber-Reinforced Sand Using X-ray Tomography and Image Analysis. Master’s Thesis, Université Joseph Fourier, Grenoble, France, 2015; 54p. [Google Scholar]
  16. NBR ISSO 7181; Solo—Análise Granulométrica de Solos. Brazilian Association of Technical Standards. ABNT: Rio de Janeiro, Brazil, 2016; 7p.
  17. NBR ISO 12051; Solo—Determinação do Índice de Vazios Mínimo de Solos Não-Coesivos. ABNT: Rio de Janeiro, Brazil, 1991; 15p.
  18. NBR ISO 12004; Solo—Determinação do Índice de Vazios Máximo de Solos Não Coesivos. ABNT: Rio de Janeiro, Brazil, 1990; 6p.
  19. Zaffani, A.G.; Figueiredo, C.M.; Anache, J.A.A.; Wendland, E.C.; Crestana, S. Transporte do herbicida atrazina em diferentes solos brasileiros. In Proceedings of the IX Congresso Brasileiro de Geotecnia Ambiental (REGEO 2019), São Carlos, Brazil, 14–16 August 2019. [Google Scholar]
  20. Picanço, M.S. Compósitos Cimentícios Reforçados com Fibras de Curauá. Master’s Thesis, Pontifícia Universidade Católica do Rio de Janeiro (PUC Rio), Rio de Janeiro, Brazil, 2005; 101p. [Google Scholar]
  21. Silveira, L.R. Aspectos Geotécnicos e Ambientais para a Disposição Adequada de Lodo de Esgoto. Ph.D. Thesis, Department of Civil and Environmental Engineering, University of Brasília, Brasília, Brazil, 2014; 193p. [Google Scholar]
  22. NBR 9778; Argamassa e Concreto Endurecidos—Determinação da Absorção de Água, Índice de Vazios e Massa Específica. ABNT: Rio de Janeiro, Brazil, 2009; 4p.
  23. Barone, F.S.; Yanful, E.K.; Quigley, R.M.; Rowe, R.K. Effect of multiple contaminant migration on diffusion and adsorption of some domestic waste contaminants in a natural clayey soil. Can. Geotech. J. 1989, 26, 189–198. [Google Scholar] [CrossRef]
  24. Fonseca, M.C.; Ritter, E.; Cavalcante, A.L.B. Application of semi-analytical solution for modeling sorption and pure diffusion assays with leachate. Eng. Sanit. Ambient. 2019, 24, 965–973. (In Portuguese) [Google Scholar] [CrossRef] [Green Version]
  25. Baran, C.T.; Cavalcante, A.L.B. Application of a physical-mathematical model of leachate ion diffusion through compacted soils from diffusion tests. In Challenges and Innovations in Geomechanics: Proceedings of the 16th International Conference of IACMAG, Turin, Italy, 30 August–2 September 2021; Springer International Publishing: Berlin/Heidelberg, Germany, 2021; Volume 2, pp. 932–940. [Google Scholar]
  26. Bouguer, P. Essai d’Optique sur la Gradation de la Lumière, 1st ed.; Hachette Livre Bnf: Paris, France, 1729; 214p. [Google Scholar]
  27. Shackelford, C.; Daniel, D.; Liljestrand, H.M. Diffusion of inorganic chemical species in compacted clay soil. J. Contam. Hydrol. 1989, 4, 241–273. [Google Scholar] [CrossRef]
  28. Barone, F.; Rowe, R.; Quigley, R. A laboratory estimation of diffusion and adsorption coefficients for several volatile organics in a natural clayey soil. J. Contam. Hydrol. 1992, 10, 225–250. [Google Scholar] [CrossRef]
  29. Shackelford, C.; Daniel, D. Diffusion in saturated soil. i: Background. J. Geotech. Eng. 1991, 117, 467–484. [Google Scholar] [CrossRef]
  30. Boscov, M.E.G. Contribuição ao Projeto de Sistemas de Contenção de Resíduos Perigosos Utilizando Solos Lateríticos. Ph.D. Thesis, Escola Politecnica University of Sao Paulo, Sao Paulo, Brazil, 1997. [Google Scholar]
  31. Gurjão, C. Estimativa de Propriedade Geoambientais de Camadas Impermeabilizantes de Solos Tropicais. Ph.D. Thesis, University of New Brunswick, Brasilia, Brazil, 2005. [Google Scholar]
  32. Rowe, R.K.; Booker, J.R. Pollute Version 7 Reference Guide. User Guide; GAEA Technologies Ltd.: Whitby, ON, Canada, 2004; Available online: http://www.gaea.ca/public/Pollute7_Users_Guide.pdf (accessed on 15 September 2022).
  33. Rowe, R.K.; Booker, J.R. 1-d pollutant migration in soils of finite depth. J. Geotech. Eng. 1985, 111, 479–499. [Google Scholar] [CrossRef]
  34. Rowe, R.K.; Caers, C.J.; Barone, F. Laboratory determination of diffusion and distribution coefficients of contaminants using undisturbed clayey soils. Can. Geotech. J. 1988, 25, 108–118. [Google Scholar] [CrossRef]
  35. Cavalcante, A.L.B.; Farias, M.M. Alternative solution for advective-dispersive flow of reagent solutes in clay liners. Int. J. Geomech. 2013, 13, 49–56. [Google Scholar] [CrossRef]
  36. Ogata, A.; Banks, R.B. A Solution of the Differential Equation of Longitudinal Dispersion in Porous Media; Report, U.S. Geological Survey Professional Paper; United States Government Printing Office: Washignton, DC, USA, 1961; pp. A1–A7.
  37. Ozelim, L.C.S.M.; Cavalcante, A.L.B. Integral and closed-form analytical solutions to the transport contaminant equation considering 3D advection and dispersion. Int. J. Geomech. 2013, 13, 686–691. [Google Scholar] [CrossRef]
  38. Paz, Y.P.L. Solução Semi-Analítica para Modelagem das Condições Inicial e de Contorno Aplicáveis ao Ensaio de Difusão Pura. Master’s Thesis, Departamento de Engenharia Civil e Ambiental, Universidade de Brasília, Brasília, Brazil, 2015; p. 139f. [Google Scholar]
  39. Ozelim, L.C.S.M.; Paz, Y.P.L.; Cunha, L.S.; Cavalcante, A.L.B. Enhanced landfill’s characterization by using an alternative analytical model for diffusion tests. Environ. Monit. Assess. 2021, 193, 739. [Google Scholar] [CrossRef] [PubMed]
  40. Ma, L.; Selim, H.M. Evaluation of disequilibrium models for predicting atrazine transport in soils. Soil Sci. Soc. Am. J. 1997, 61, 1299. [Google Scholar] [CrossRef]
  41. Mao, M.; Ren, L. Simulating Nonequilibrium Transport of Atrazine through Saturated Soil. Groudwater 2004, 42, 500–508. [Google Scholar] [CrossRef]
  42. Celestino Ladu, J.L.; Zhang, D. Modeling atrazine transport in soil columns with HYDRUS-1D. Water Sci. Eng. 2001, 4, 258–269. [Google Scholar]
  43. Park, J.-H.; Feng, Y.; Pingsheng, J.; Voice, T.C.; Boyd, S.A. Assessment of bioavailability of soil-sorbed atrazine. Appl. Environ. Microb. 2003, 69, 3288–3298. [Google Scholar] [CrossRef] [Green Version]
  44. Abu-Zreig, M.; Abu-Ashour, J. Chloride and atrazine transport trough saturated soil columns. Toxicol. Environ. Chem. 2004, 86, 181–190. [Google Scholar] [CrossRef]
  45. Karickhoff, S.W. Organic Pollutant Sorption in Aquatic Systems. J. Hydraul. Eng. 1984, 110, 707–735. [Google Scholar] [CrossRef]
  46. Beltran, J.; Gerritse, R.G.; Hernandez, F. Effect of flow rate on the adsorption and desorption of glyphosate, simazine and atrazine in columns of sandy soils. Eur. J. Soil Sci. 1998, 49, 149–156. [Google Scholar] [CrossRef]
  47. Clausen, L.; Fabricius, I.; Madsen, L. Adsorption of Pesticides onto Quartz, Calcite, Kaolinite and α-Alumina. J. Environ. Qual. 2001, 30, 846–857. [Google Scholar] [CrossRef]
  48. Sadeghi, A.M.; Isensee, A.R.; Shirmonhammadi, A. Influence of soil texture and tillage on herbicide transport. Chemosphere 2000, 41, 1327–1332. [Google Scholar] [CrossRef] [PubMed]
  49. Cosoli, P.; Fermeglia, M.; Ferrone, M. Molecular Simulation of Atrazine Adhesion and Diffusion in a Saturated Sand Model. Soil Sediment Contam. 2009, 19, 72–87. [Google Scholar] [CrossRef]
Figure 1. Mechanisms between atrazine and PVDF fibers.
Sustainability 15 11729 g001
Figure 2. Granulometric distribution curve.
Sustainability 15 11729 g002
Figure 3. PVDF fibers used in the research.
Sustainability 15 11729 g003
Figure 4. Adsorption test.
Sustainability 15 11729 g004
Figure 5. Schematic of the fiber diffusion cell assembly.
Sustainability 15 11729 g005
Figure 6. (a) Cell with soil (no fibers); (b) Cell with 2% PVDF fibers and (c) Cell with 4% PVDF fibers.
Sustainability 15 11729 g006
Figure 7. Calibration curve.
Sustainability 15 11729 g007
Figure 8. Representative equivalent model in the CCE solution (Modified from Paz, 2015 [38]).
Sustainability 15 11729 g008
Figure 9. Variation of contaminant concentration at the initial instant (Paz, 2015) [39].
Sustainability 15 11729 g009
Figure 10. Results of absorption in solution with atrazine for 8 h (480 min).
Sustainability 15 11729 g010
Figure 11. Concentration in the solution samples over the test time.
Sustainability 15 11729 g011
Figure 12. Concentration of atrazine along the depth of the specimen.
Sustainability 15 11729 g012
Figure 13. Concentration of atrazine along the depth of the specimen.
Sustainability 15 11729 g013
Figure 14. 3D adjustment of cell 1, without fibers.
Sustainability 15 11729 g014
Figure 15. 3D adjustment of cell 2, with 2% PVDF fibers.
Sustainability 15 11729 g015
Figure 16. 3D adjustment of cell 3, with 4% PVDF fibers.
Sustainability 15 11729 g016
Table 1. Results of adsorption tests.
TestsAmount of Solutions (g)Transport Time (s)Flow Rate
(m3/s)
Retained Amount (g)Passing Amount (g)
Without fibers50.07.07.1 × 10−60.050.0
1.5 g of PVDF fibers50.025.02.0 × 10−65.743.5
4 g of PVDF fibers50.028.01.8 × 10−610.937.8
Table 2. Results of atrazine concentration over time.
Diffusion TestWavelength [nm]Estimated Concentration [ppm]—Test Hours
072168264360432
Cell 1—Without fibers205552.9548.1541.1533.2517.5511.2
Cell 2—2% PVDF fibers203554.7552.1544.5539.6523.1513.5
Cell 3—4% PVDF fibers198554.4554.1548.7548.5548.0547.1
Table 3. Results of atrazine concentration along the depth of the specimen.
Diffusion TestWavelength [nm]Estimated Concentration [ppm]—Depth [cm]
0.51.52.53.54.5
Cell 1—Without fibers19817.116.816.516.3-
Cell 2—2% PVDF fibers19816.215.315.314.9-
Cell 3—4% PVDF fibers2005.14.43.73.63.5
Table 4. Results obtained from the pure diffusion model.
Diffusion Test D p * [10–13 m2/s] b [m]R2
Cell 1—Without fibers6.250.00240.99
Cell 2—2% PVDF fibers6.030.00240.99
Cell 3—4% PVDF fibers3.640.00260.99
Disclaimer/Publisher’s Note: The statements, opinions and data contained in all publications are solely those of the individual author(s) and contributor(s) and not of MDPI and/or the editor(s). MDPI and/or the editor(s) disclaim responsibility for any injury to people or property resulting from any ideas, methods, instructions or products referred to in the content.

