Article

Comprehensive Research on the Near-Zero Energy Consumption of an Office Building in Hefei Based on a Photovoltaic Curtain Wall

School of Environment and Energy Engineering, Anhui Jianzhu University, Hefei 230601, China
*
Author to whom correspondence should be addressed.
Sustainability 2023, 15(15), 11701; https://doi.org/10.3390/su151511701
Submission received: 6 July 2023 / Revised: 25 July 2023 / Accepted: 26 July 2023 / Published: 28 July 2023

Abstract

:
The near-zero energy design of a building is linked to the regional climate in which the building is located. On the basis of studying the cavity size and ground height of a photovoltaic curtain wall, the power generation efficiency of the photovoltaic curtain wall under different ground heights is compared in this paper. According to the “Technical Standard for Near-Zero Energy Buildings”, the personnel and lighting of a 12-m office building in Hefei were parametrically arranged and three design schemes for near-zero energy buildings were proposed. The energy consumption of the benchmark building and the design energy consumption of each scheme were calculated by using the energy consumption simulation software Design Builder V 7.0.0.096; the feasibility of realizing the near-zero energy consumption building by using each scheme was checked. The results show that when the cavity width of the photovoltaic curtain wall of the office building is 70 mm, the cavity heat transfer coefficient is the lowest and the heat insulation of the building is the best. When the height from the ground is 0.7 m, the power generation efficiency of the photovoltaic curtain wall reaches a maximum of 18.39% and the south façade of the building is more suitable for the layout and installation of the photovoltaic curtain wall. The single-façade photovoltaic curtain wall should be combined with a high-efficiency air conditioning system and lighting system; the installation of a photovoltaic rooftop at the same time can meet the design requirements of near-zero energy buildings in hot-summer and cold-winter areas. This paper provides some guidance for exploring the design of near-zero energy office buildings, which is of practical significance.

1. Introduction

The concept of “Near-zero buildings” was originally proposed by the European Union; countries are developing strategies and methods to achieve near-zero energy buildings. In 2019, the Chinese government issued the design requirements of the GBT51350-2019 “Technical Standard for Near-Zero Energy Buildings” [1]. In September 2020, at the 75th session of the United Nations General Assembly, the Chinese government put forward the strategic goals of achieving a carbon peak in 2030 and carbon neutrality in 2060. With the expansion of the scale and increasing number of buildings, building energy consumption accounts for about 40% of the world’s total energy consumption [2]; meanwhile, in China, building energy consumption accounts for about 45% of the country’s total energy consumption [3]. Therefore, in order to reduce building energy consumption and reduce carbon emissions, achieving near-zero energy buildings has become the focus of researchers [4,5].
Various technical and environmental factors should be considered in the decision-making process of near-zero energy building developments [6,7,8]; it is reasonable to achieve near-zero energy buildings through multi-criteria decision analysis [9,10]. Including the use of renewable energy to reduce building energy consumption is an important implementation measure [11,12]. With the increasing demand for sustainable development and environmental protection, people’s demand for thermal comfort in buildings is also increasing. Giacomo Capizzi et al. [13] used dynamic model calculation methods to simulate the thermal behaviour of buildings and the energy consumption of buildings. Kciuk Marek et al. [14] proposed a neural network calculation method, which improved the efficiency of data collection and classification and provided a basis for the thermal comfort analysis of office buildings. As solar energy is becoming more and more widely used in the construction sector [15,16], and due to the continuous development of solar technology, solar energy systems are more efficient and flexible and they can also be applied to near-zero energy buildings as renewable clean energy [17,18,19]. In this context, a photovoltaic curtain wall, as an innovative building façade material, not only has the functional and aesthetic requirements required for building design but also can convert solar energy into electric energy to achieve self-sufficiency in building energy [20], which can effectively reduce building energy consumption [21]. The structure of the photovoltaic curtain wall is shown in Figure 1; it is mainly composed of three parts: PV glass, cavity, and building wall. The cavity size of the photovoltaic curtain wall will affect the thermal insulation performance of the wall. When photovoltaic panels are irradiated by the sun, they not only generate electricity but also heat, which is manifested as an increase in the temperature of the module. Increasing the height from the ground will increase the heat transfer effect of the cavity and reduce the temperature of the photovoltaic surface. When the height of the photovoltaic curtain wall is low, its surface temperature will increase by nearly 50 °C in the summer, resulting in a decrease in photovoltaic power generation efficiency [22]. Therefore, it is necessary to study the cavity size and ground height of photovoltaic curtain walls for the design of near-zero energy buildings.
In recent years, photovoltaic curtain walls have gradually attracted the attention of many researchers [23,24]. Jiayi Zhu et al. [25] used the DSF model to study the heat transfer of cavities and found that a double-layer epidermis has better thermal insulation than single-layer glass. Siddharth et al. [26] used EnergyPlus 8.9 software to study the application of translucent photovoltaics in commercial buildings and found that integrating transparent organic photovoltaics into the building envelope can save energy and generate electricity. Changyu Qiu et al. [27] used DAYSIM software to study and compare the lighting performances of photovoltaic glass and ordinary glass in five Chinese cities, Harbin, Beijing, Wuhan, Hong Kong, and Kunming; they found that photovoltaic glass can prevent daylight glare to a large extent in low latitudes. Yujiao Huo et al. [28] used CFD software to simulate the heat difference of photovoltaic curtain wall vents at different building heights; but, the study did not calculate the temperature distribution of photovoltaic surfaces at different ground heights. Muhammad et al. [29] conducted an experimental study on two different photovoltaic wall systems and found that the BIPV south facade generated 38.6% more electricity than the BIPV Trombe wall; but, they did not study other facades. Cheng Yuqian [30] used Fluent software to analyze the heat transfer of photovoltaic curtain walls with different cavity sizes and found that the photovoltaic heat transfer effect was the best when the cavity size was 80 mm in Shenyang; but, the study did not calculate the building energy consumption.
In the past, there were few studies on the combination of the application of photovoltaic curtain walls and near-zero energy buildings; this paper took the design base map of an office building in Hefei as the research object and, based on this research object, the cavity size and height of the photovoltaic curtain wall were studied and the power generation efficiency of the photovoltaic curtain wall at different ground heights was compared. The Design Builder V 7.0.0.096 software, with EnergyPlus as the embedded computing engine, was used to simulate energy consumption [31] and the hourly dry-bulb temperature data (as shown in Figure 2) of typical outdoor meteorological years in Hefei were selected by the software for calculation. According to its architectural design base drawing, the benchmark building model was established, the power generation and daylighting effect of photovoltaic curtain wall per unit area of each facade of the building was calculated, and the best facade of the building was selected for the photovoltaic layout. Three renovation schemes are proposed to conduct near-zero energy building design research on the benchmark building model: check whether each scheme meets the design goals of GBT51350-2019 "Near-zero Energy Building Technical Standard" that the energy saving rate of the building body in hot-summer and cold-winter area is not less than 20%, and the comprehensive energy saving rate is not less than 60%. The feasibility of applying photovoltaic curtain wall to near-zero energy office buildings in Hefei was studied.

2. Model Analysis Process

Regarding the building base drawing, Design Builder V7 is used to establish the benchmark building model and set the relevant parameters to solve the benchmark building energy consumption. The photovoltaic curtain wall system is then arranged according to the benchmark building; on the basis of calculating the cavity size of the photovoltaic curtain wall, the height from the ground of the photovoltaic curtain wall is studied and analyzed by using Fluent software. According to the benchmark building model, three energy-saving schemes suitable for the building are designed by improving the energy efficiency of the heating and cooling source equipment and arranging the facade photovoltaic curtain wall. To conduct analysis, one should calculate the energy-saving rate of the building itself and the comprehensive energy-saving rate of the building under different schemes and check whether the designed building meets the requirements of the energy efficiency index of a near-zero energy building.

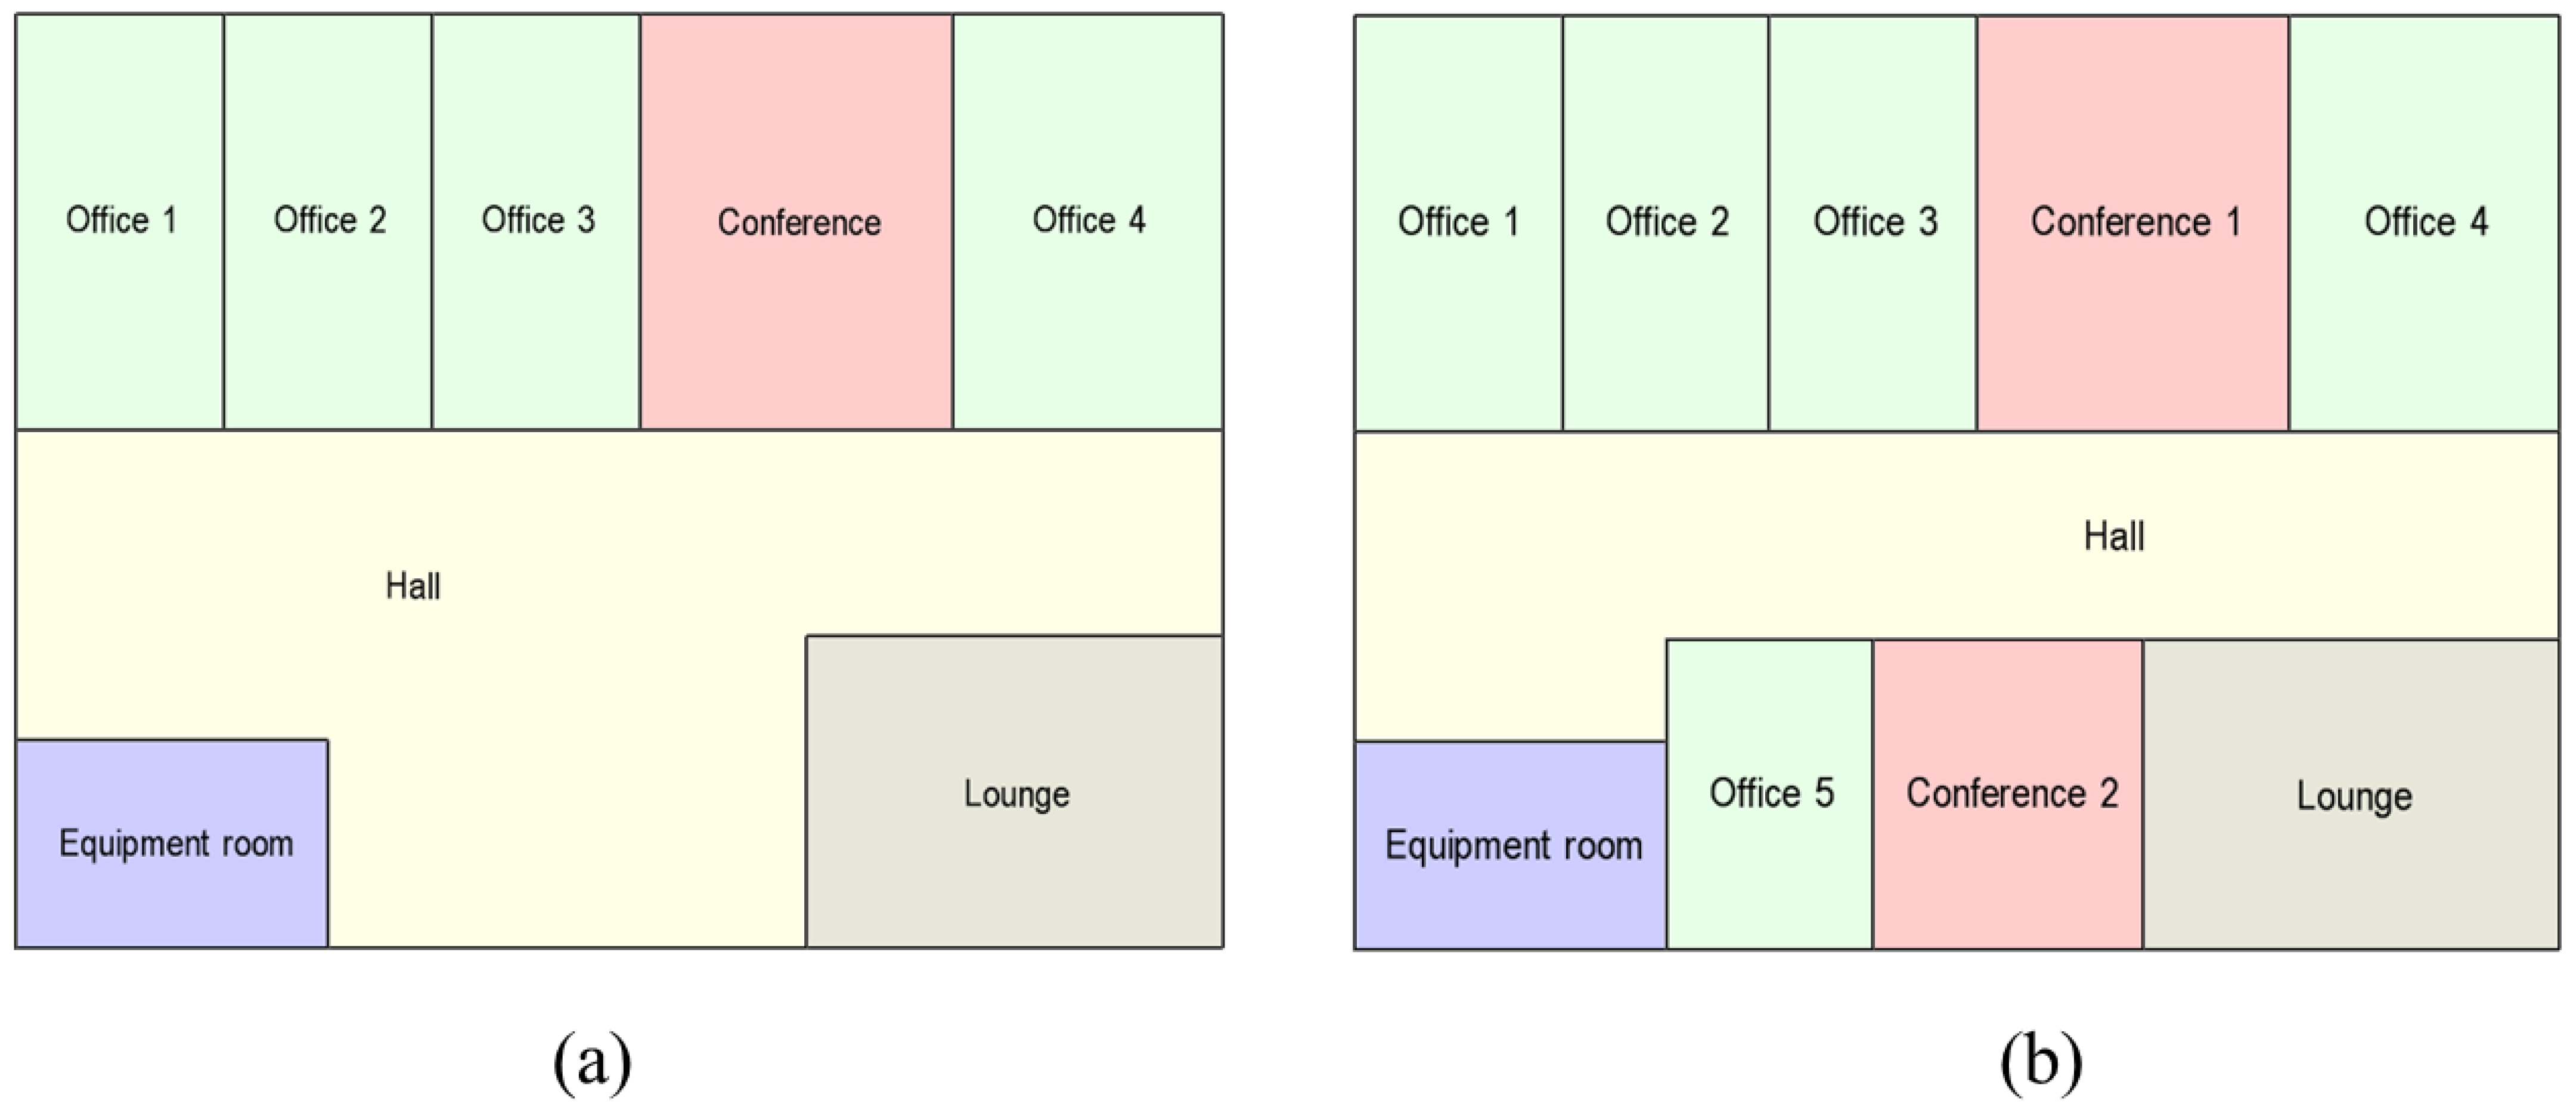
2.1. Overview of the Benchmark Building

The benchmark building is located in Hefei City, Anhui Province, at 31°52′ north latitude and 117°17′ east longitude; the climate in this area belongs to the hot-summer and cold-winter categories. The total construction area of the building is 7830 m2; there is a total of three floors, each floor height is 4 m, the total height is 12 m, and the roof adopts a 28-degree sloped roof. The building is a typical office building; the office building has offices, lounges, conference rooms, equipment rooms, and other rooms (as shown in Figure 3). This building covers a large area, and the energy consumption is more complex.
Referring to the benchmark building requirements of the GBT51350-2019 “Technical Standard for Near-Zero Energy Buildings” [1], the window-to-wall area ratio of office buildings is set to 0.31. As shown in Table 1, because the building has a number of different functional areas, each room has different functions, personnel density, and lighting power; we refer to this standard to set the parameters of the personnel, lighting, and equipment power in each room. The lighting is controlled by the Linear/off [32] module in the software. According to the GB 50736-2012 “Code for the Design of Heating, Ventilation and Air Conditioning in Civil Buildings” [33], we find the design requirements for the fresh air volume of the office buildings in the area and set the fresh air volume to 10 m3/(h·person) for the lobby foyer of the benchmark building and 30 m3/(h·person) for offices and conference rooms. The thermal resistance of winter clothes is 1.5 clo and that of summer clothes is 0.5 clo. The benchmark building adopts split air conditioning in which the air conditioning operation time is 08:00–18:00; the heating season is from 5 December to 5 March of the following year and the cooling season is from 1 May to 30 September. According to the GB50189-2015 “Energy-saving Design Standards for Public Buildings” [34], by inquiring about the design specifications of maintenance structures in this area, the heat transfer coefficient of the envelope structure of the benchmark building is parameterized and the heat transfer coefficient of the external wall of the building is set to 0.5 K [W/(m2·K)]. The heat transfer coefficient of the exterior window is 2.1 K [W/(m2·K)] and the heat transfer coefficient of the roof is 0.4 K [W/(m2·K)]. The thermal performance of each envelope will be used for a comparative analysis of energy consumption between the benchmark building and the design building.

2.2. Model Optimization Scheme

Based on this study of the energy consumption of the benchmark building model, three energy-saving schemes are designed. scheme 1: The benchmark building is arranged with a single facade photovoltaic curtain wall. scheme 2: On the basis of the research of scheme 1, the air conditioning system is replaced with an air-source heat pump (heating COP is 2.8, refrigeration COP is 3.0) and the lighting system adopts an LED lighting system with a 50% energy saving rate [35]. scheme 3: Based on this study of scheme 2, 314.96 m2 of photovoltaic panels are laid on the south roof of the building. On the basis of studying the size of the photovoltaic curtain wall, the energy consumption of the above three energy-saving schemes is calculated separately, as well as whether the energy-saving effect of each scheme meets the energy efficiency index of near-zero energy buildings in the area.

3. Photovoltaic Curtain Wall Size Analysis

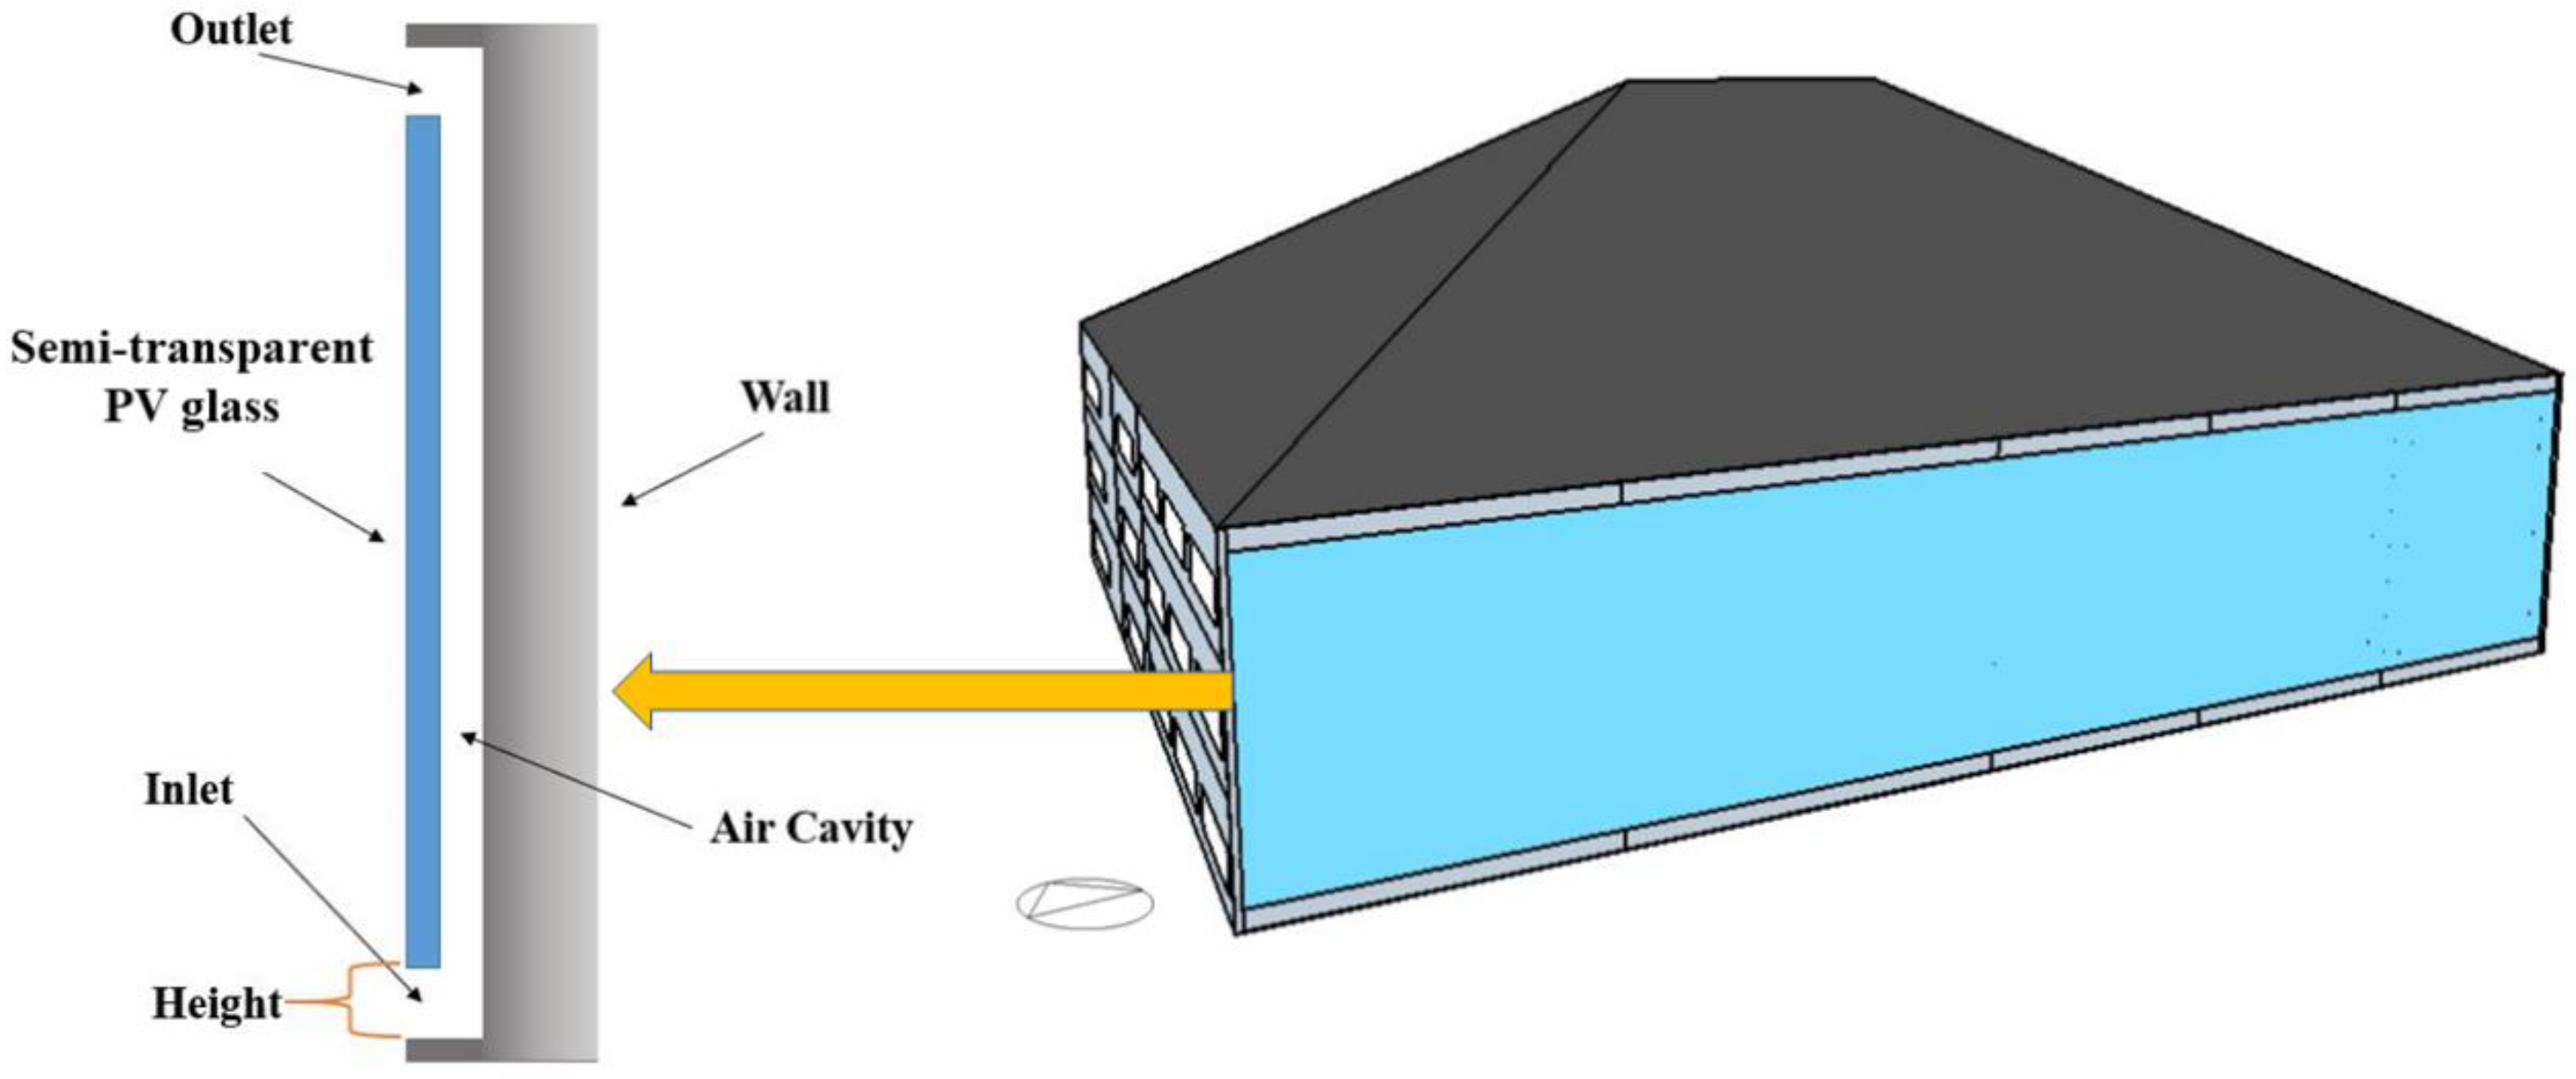
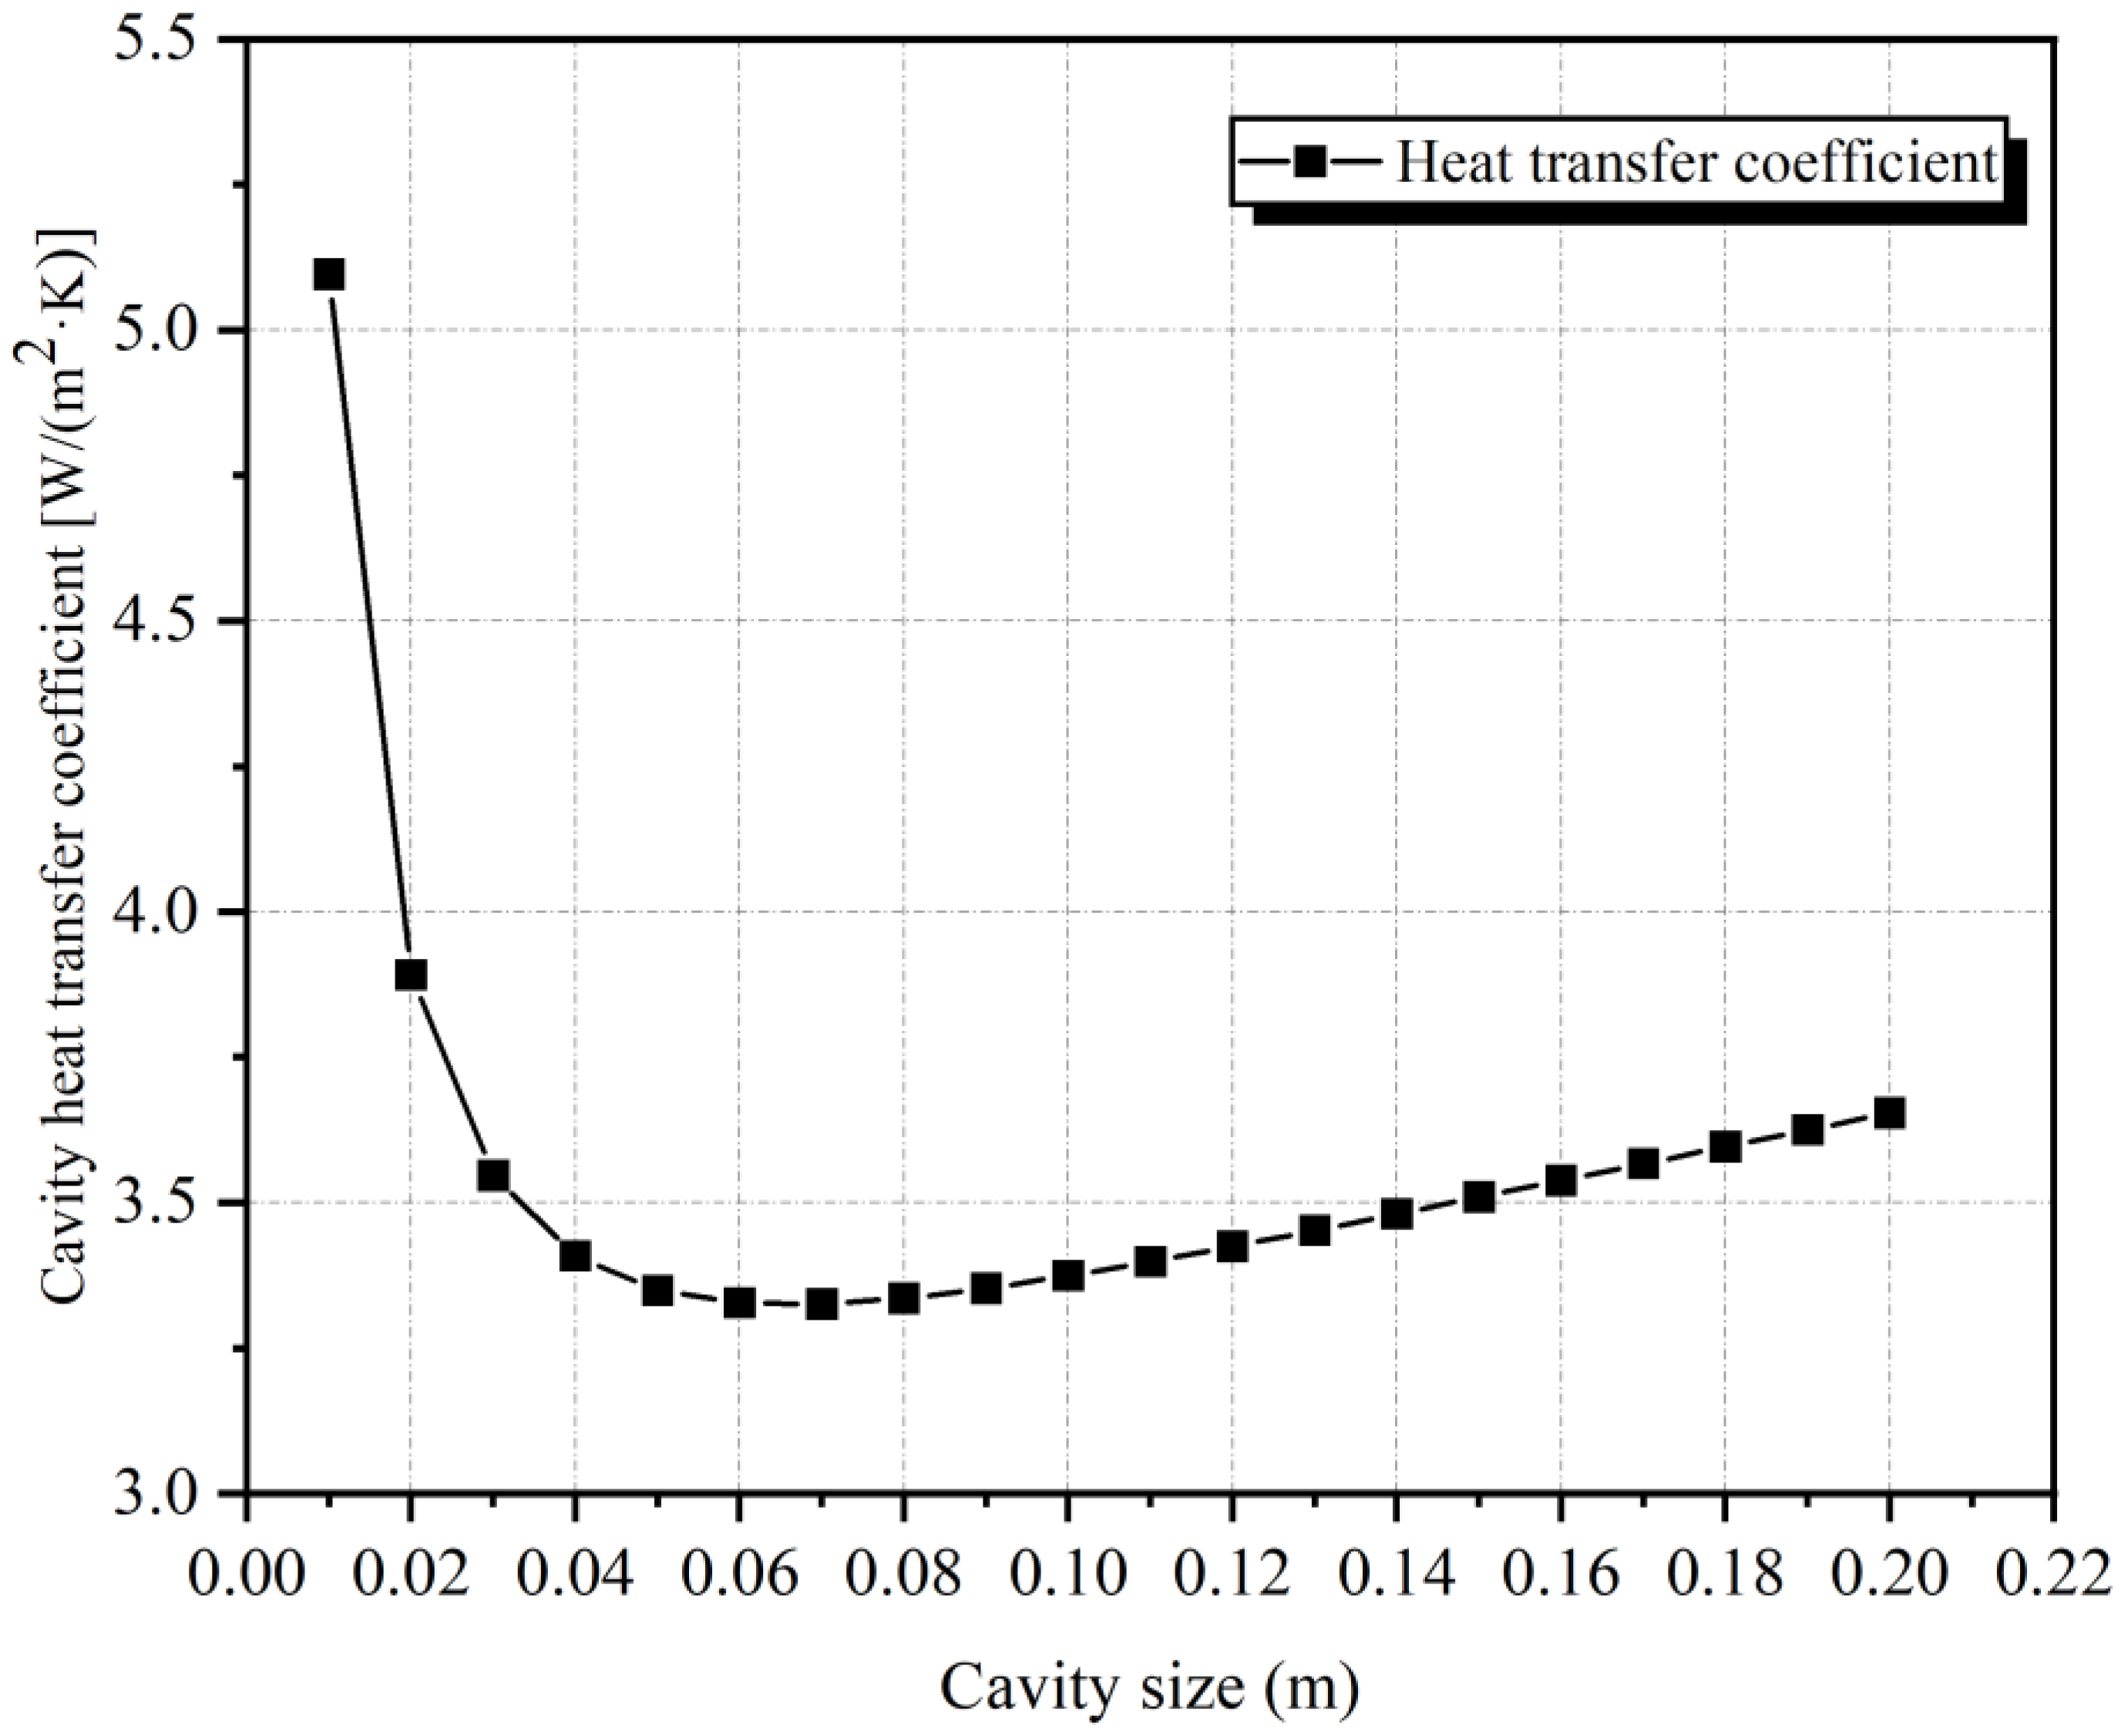
3.1. Photovoltaic Cavity Size

The cavity size of the photovoltaic curtain wall will affect the heat transfer coefficient of the cavity; so, different cavity sizes have an impact on the heat insulation performance of the building. The change in the average air temperature will cause the thermal conductivity of the air equivalent of the cavity interlayer to change; the average air temperature calculation formula is:
T m = T 1 + T 2 2
where T m is the average temperature, °C; T 1 is the outdoor comprehensive temperature in summer, °C; and T 2 is the room temperature, °C.
The most unfavourable dry bulb temperature outdoors in summer in Hefei is 37.2 °C, the indoor temperature is 26 °C by air conditioning, and the calculated Tm is 31.6 °C. The equivalent thermal conductivity λa of the air layer can be obtained by querying “Heat Transfer” (as shown in Table 2) as 0.0267 W/(m·K)−1.
The convective thermal conductivity of the cavity air layer is calculated as [36]:
λ c = 0.942 Δ t 1 / 2 d 3 / 2
Δ t = T 1 T 2
where   λ c is the convection heat conduction of the air layer, W/(m·K)−1; d is the width of the air interlayer layer, m; and t is the temperature difference between indoor and outdoor, °C.
The radiant heat transfer of sandwich air is:
q r = [ T 1 4 T 2 4 ] C O 1 ε 1 + 1 ε 2 1
Meantime:
q r = λ r d ( T 1 T 2 )
The radiant thermal conductivity of the cavity air layer is calculated as:
λ r = T 1 2 + T 2 2 T 1 + T 2 C O 1 ε 1 + 1 ε 2 1
where q r is the heat transfer radiated by the surface, W; λ r is air layer radiant thermal conductivity, W/(m·K)−1; C O is the Stefan-Boltzmann constant, 5.67 × 10⁻⁸ W/(m2·K4); ε 1 is the glass surface emissivity, 0.84; and ε 2 is the wall surface emissivity, 0.54.
Under steady-state conditions, the calculation formula of the cavity heat transfer coefficient is:
R k = d λ a + λ c + λ r
K i = 1 / R k
where   R K is the thermal resistance of the cavity, (m²·K)/W; K i is the cavity heat transfer coefficient, W/(m2·K).
The results of the above λ a , λ c ,   λ r are substituted into Equation (6):
K i = ( 0.0267 + 3.153 d 3 / 2 + 2.11 d ) / d
According to Formula (7), the relationship between cavity air-layer thickness and heat transfer is obtained, as shown in Figure 4.
As shown in Figure 4, the cavity heat transfer coefficient decreases with the increase of width when the width is 0.01–0.07 m; the cavity heat transfer coefficient increases with the increase of width when the width is 0.07–0.2 m. Then, when the cavity size is 0.07 m, the cavity heat transfer coefficient is the lowest and the heat insulation of the building is the best. Therefore, the photovoltaic curtain wall with a 0.07-m cavity size is used for the office building.

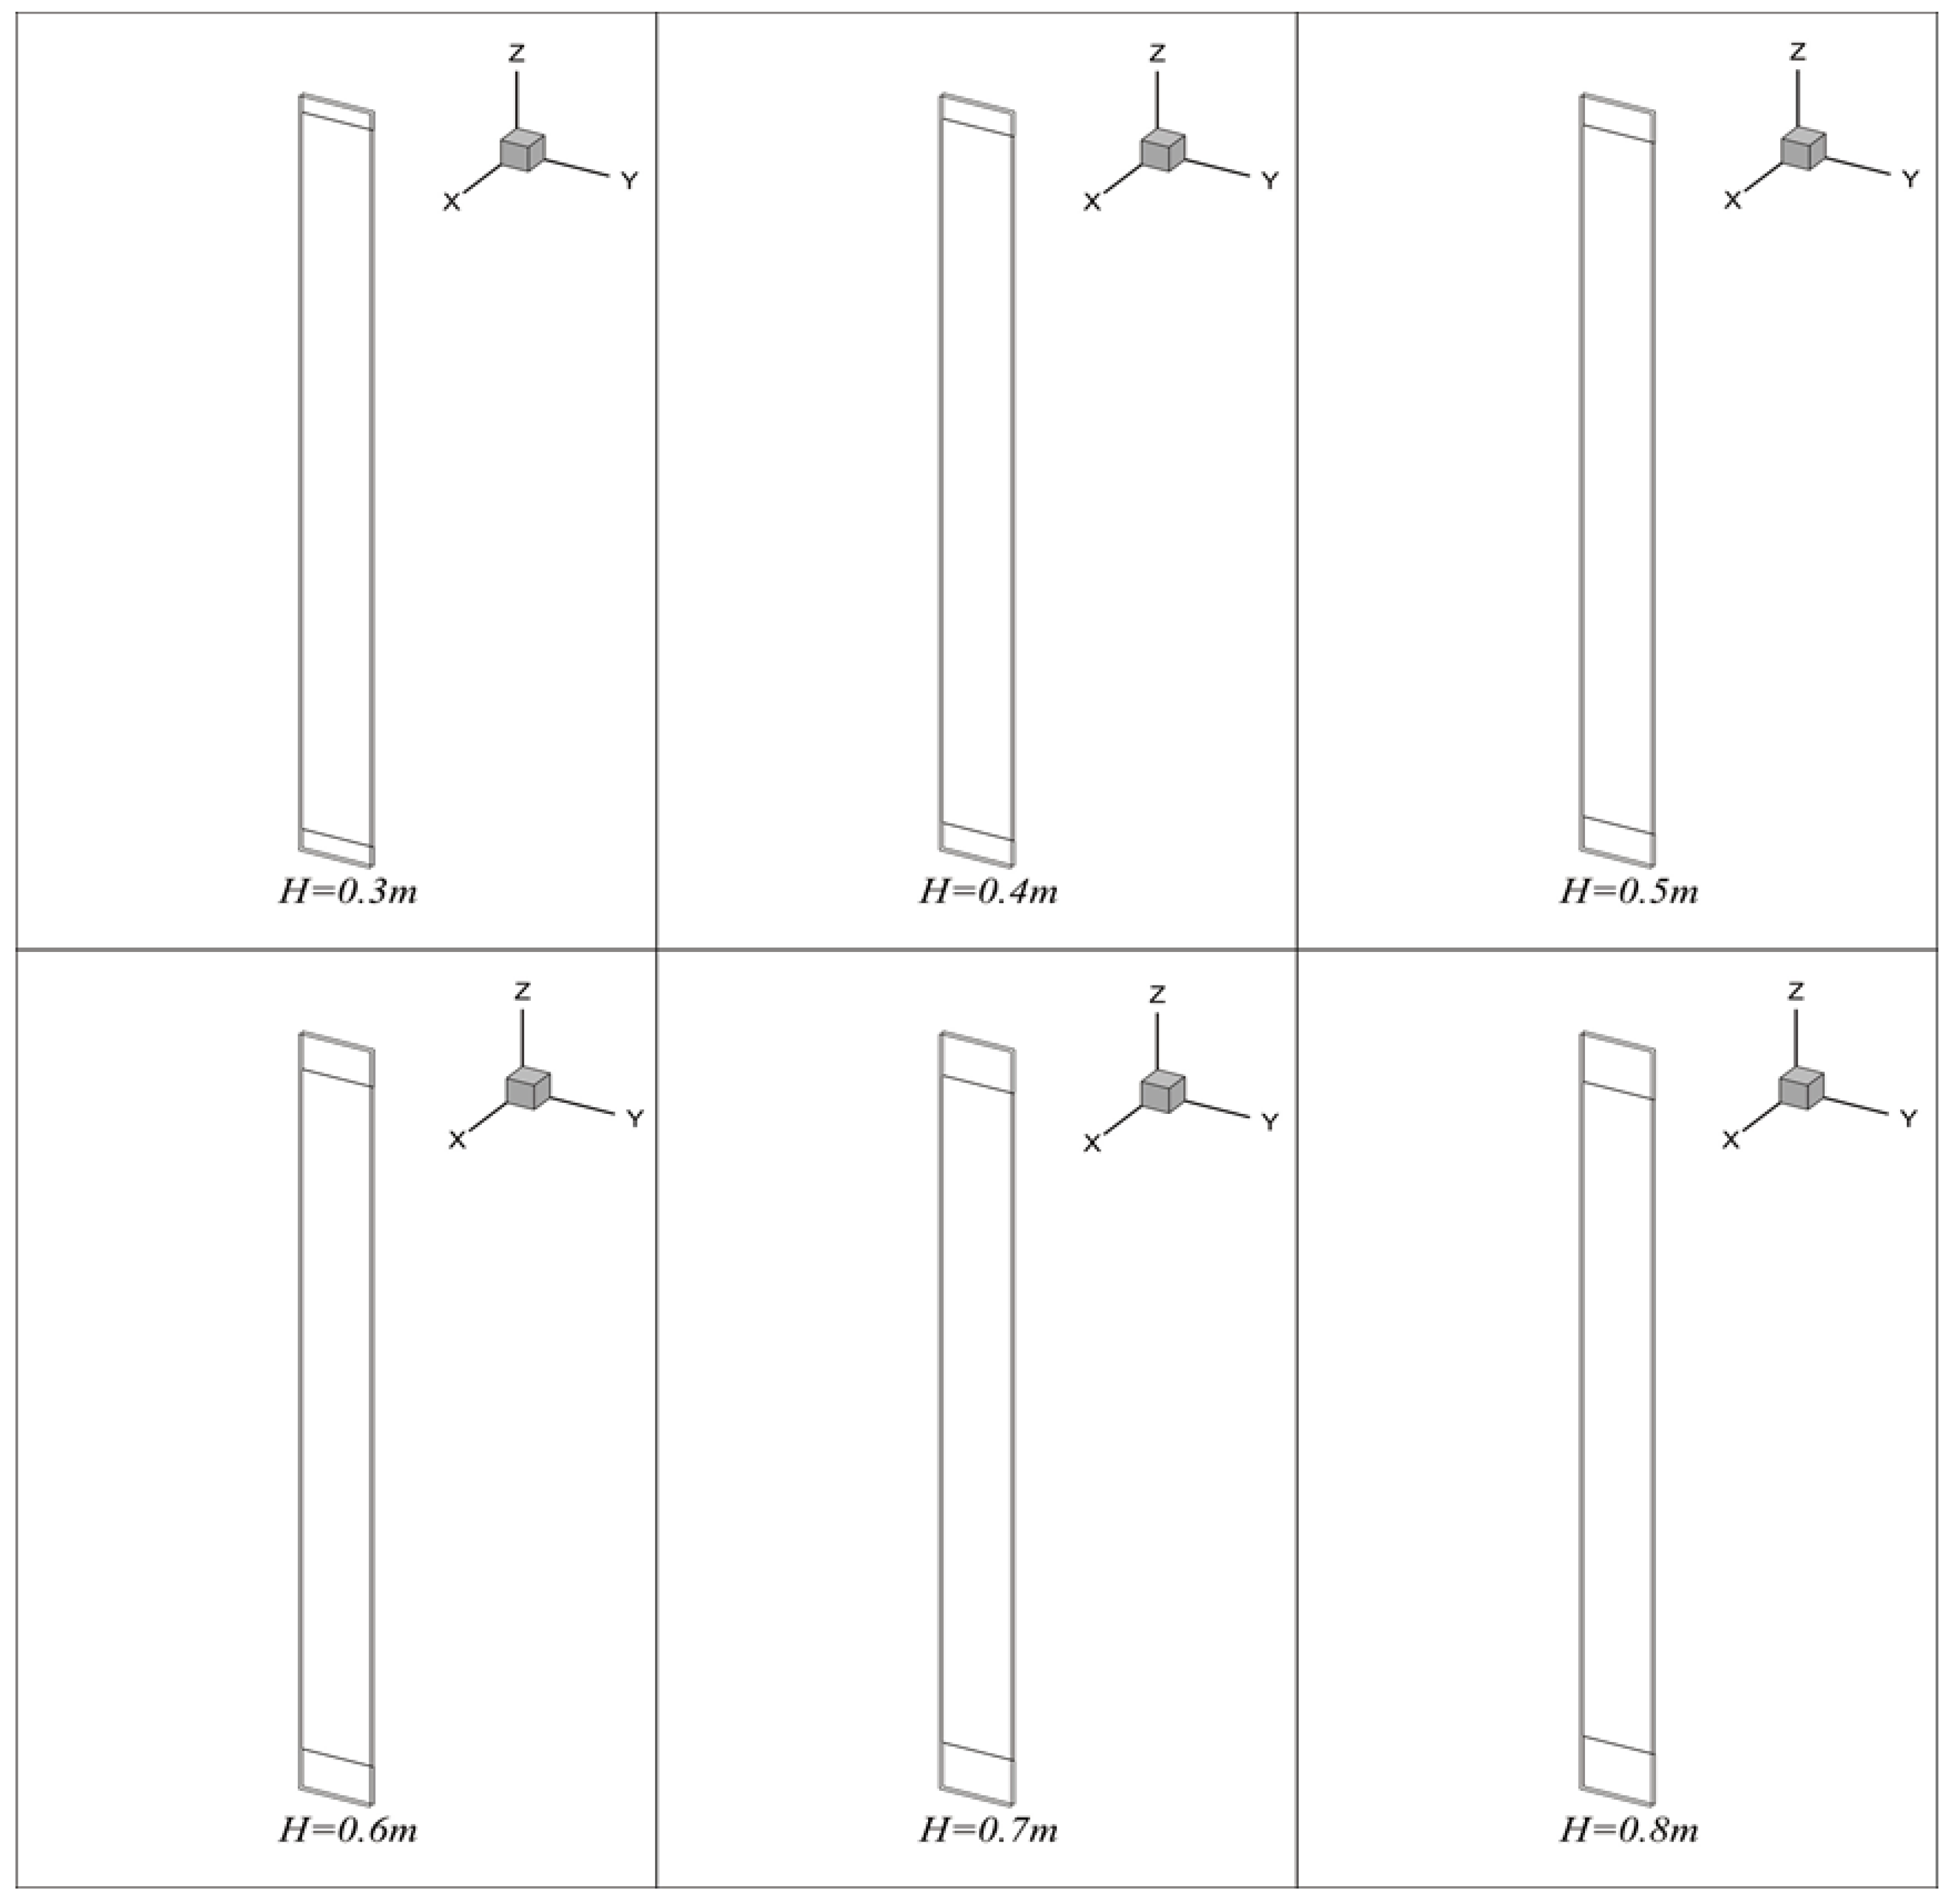
3.2. PV Curtain Wall Model Construction

In computational fluid dynamics software, Fluent software is widely used in the study of fluid flow and heat transfer; this study uses Fluent software to physically model, mesh, and set boundary conditions of photovoltaic curtain walls. Since the photovoltaic curtain wall in this study needs to be applied to the benchmark building, the 12 m photovoltaic curtain wall model is adopted, as shown in Figure 5. The model adopts a unit length; the total height of the model is 12 m, the curtain wall thickness is 0.008 m, the cavity size is 0.07 m, and the wall thickness is 0.26 m. The surface temperature of the photovoltaic curtain wall under the threshold of a ground height of 0.3–0.8 m is also studied and analyzed.

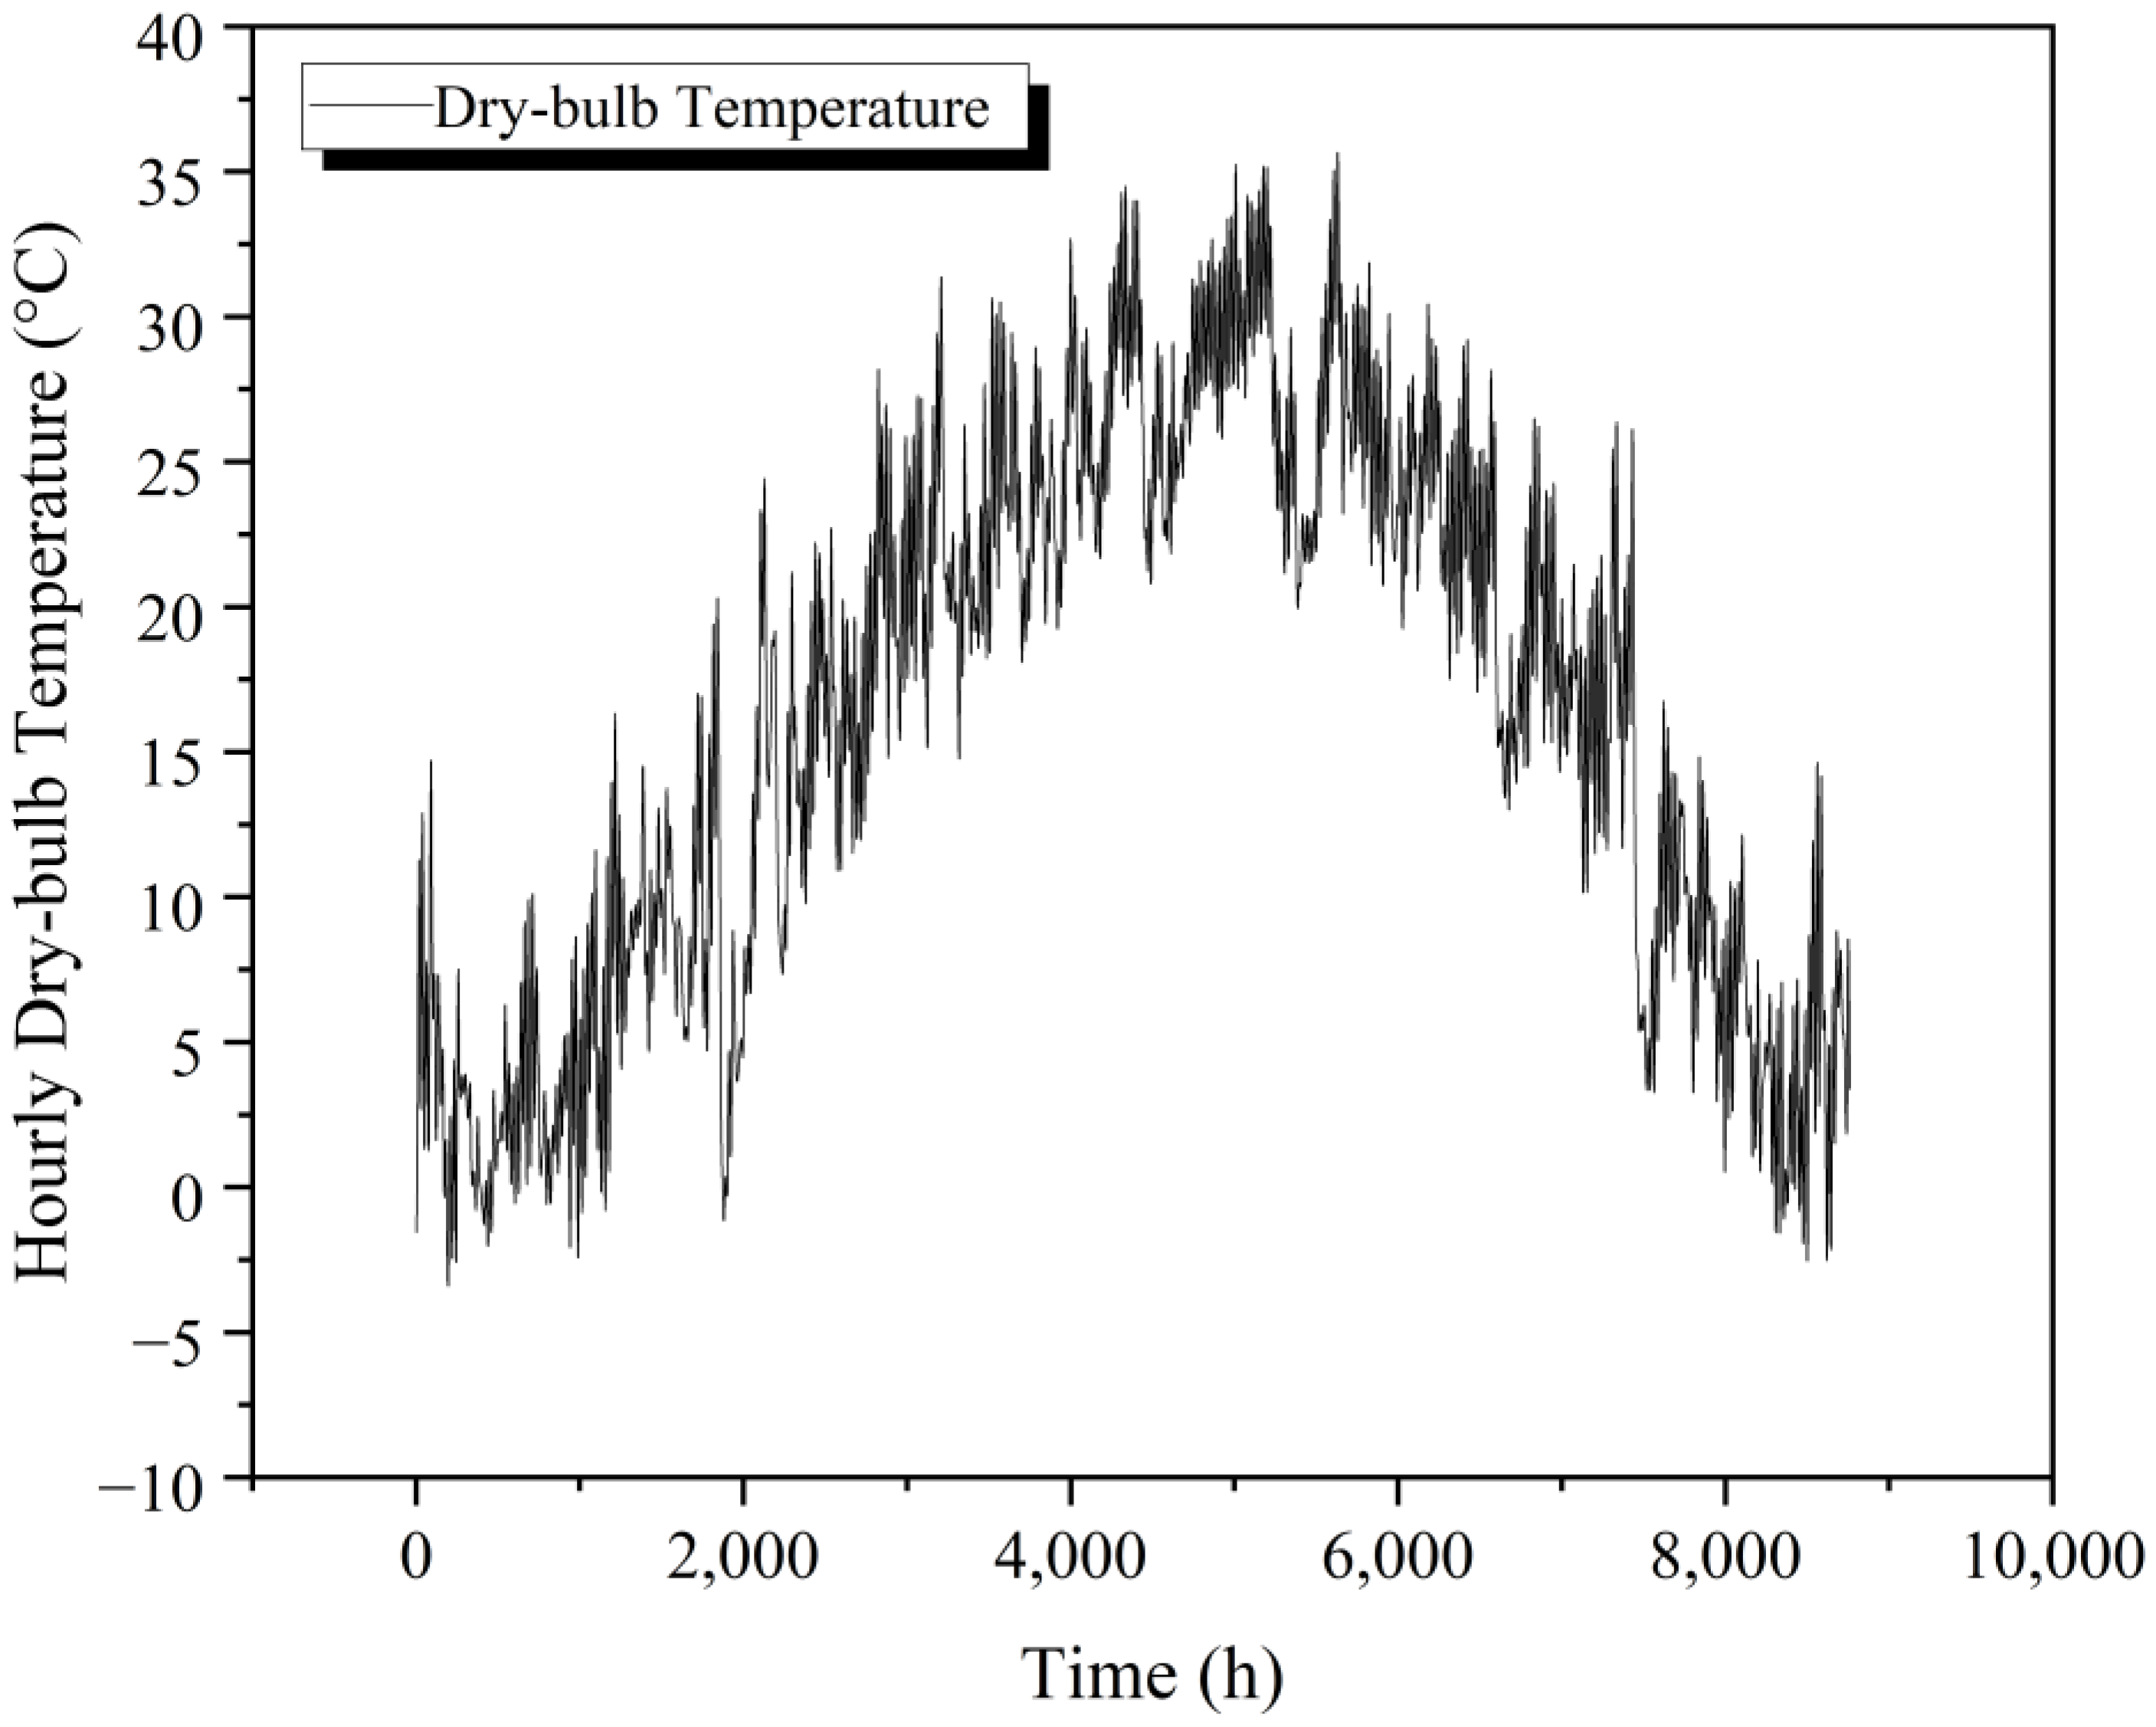
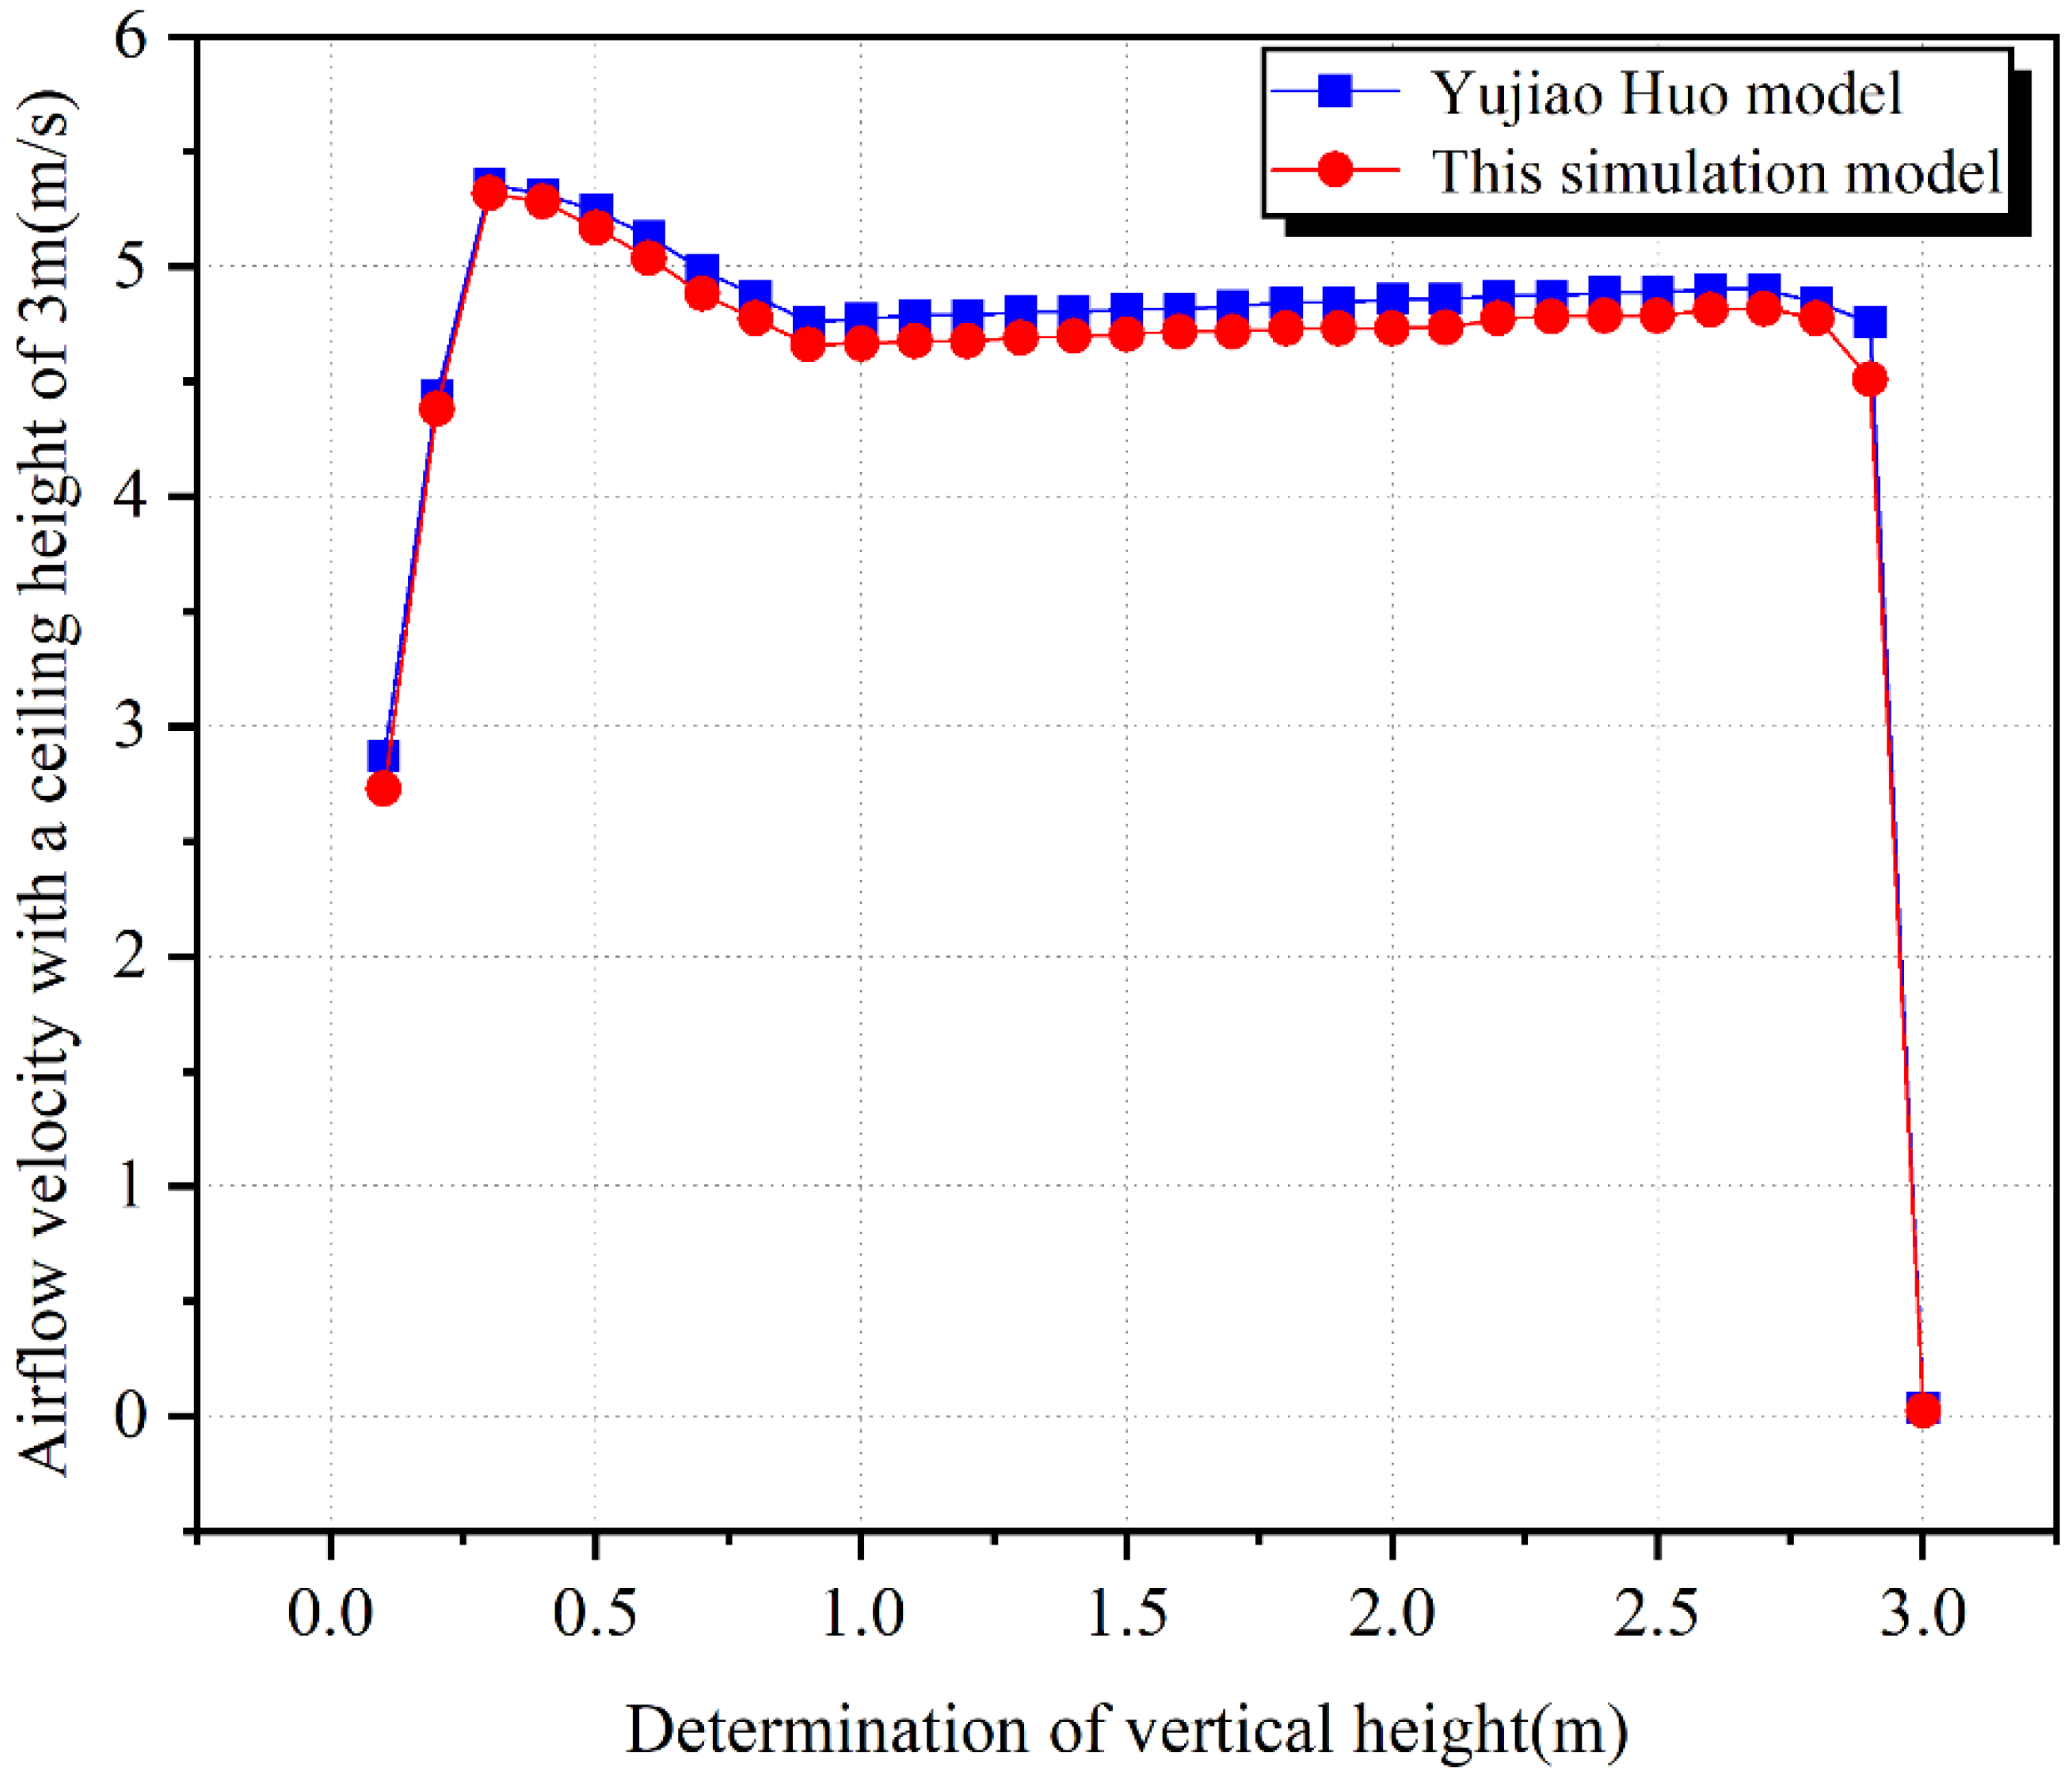
3.3. Boundary Conditions and Numerical Processes

This model is used to simulate the surface temperature of photovoltaic curtain walls at different heights from the ground in Hefei in summer. The inlet wind speed is set to 2.1 m/s in Hefei in summer, the outlet is set to the pressure outlet, and the outlet pressure is set to standard atmospheric pressure. The outdoor ambient temperature is set to 37.2 °C in Hefei and the indoor temperature is set to 26 °C. The air physical property parameters and photovoltaic curtain wall parameters are shown in Table 3 and Table 4.
Because the Fluent software is based on the grid, there will be an error in the calculation result when the number of meshes is thin. As shown in Figure 6, when the number of meshes is 121,500, some obvious errors will occur before the model height is 0–4 m; the error will not be obvious if the number of meshes is increased after the height reaches 4 m. When the number of meshes reaches 1,191,030, as the number of meshes continues to increase, the simulation results will not change significantly. Therefore, after the verification of grid independence, all models in this simulation use more than 1.19 million meshes.
The law of conservation of energy is the basic law for studying gas heat exchange; the model needs to turn on gravity during the simulation process and set g = −9.81 m/s. At the same time, the energy equation needs to include the transient term, the convection term, the diffusion term, and the heat source term, which can be expressed as follows:
( ρ ϕ ) t + d i v ( ρ u i ¯ ϕ ) = d i v ( Γ g r a d T ) + s ϕ
where ϕ is the dependent variable; Γ is the diffusion coefficient. In this paper, the PV surface temperature T is the dependent variable. The fluid diffusion coefficient Γ is:
Γ = k c p
So, the energy equation here is:
( ρ T ) t + d i v ( ρ u i ¯ T ) = d i v ( k c p g r a d T ) + s ϕ
where ρ is the fluid density, kg/m3; T is the temperature, K; t is the time, s; u i ¯ is the velocity vector in i-dimensional space, m/s; k is the heat transfer coefficient of the fluid, W/(m2·K); c p is the specific heat capacity of the fluid, J/(kg·K); and S ϕ is a heat source item.
In this paper, the natural convection problem of air in the cavity of the photovoltaic curtain wall needs to be studied; the RNG k-ε model can be used for a simulation calculation. Since the airflow in the cavity belongs to the air flow in a limited space, the air flow will be affected by the photovoltaic curtain wall and the building wall; so, the treatment method of strengthening the wall is adopted. During the day, the photovoltaic curtain wall will be affected by sunlight radiation; this paper uses the DO radiation model to make calculations, select the option to turn on the Solar Ray Tracing module, and enter the latitude and longitude of Hefei to load solar radiation onto the photovoltaic curtain wall. The simulation adopts a pressure-based solver; the coupling method of pressure and velocity is calculated by a simple algorithm and the function relationship between density and temperature adopts the Boussinesq hypothesis. In order to verify the feasibility of the numerical method of the model, it is compared and analyzed with Yujiao Huo’s 3-m double-layer photovoltaic curtain wall model. During verification, the height of this model is set to 3 m and the boundary conditions are set to be the same, so as to verify the centerline velocity of the model and the centerline velocity of the cavity of Yujiao Huo’s model [28] under the same conditions. The results are shown in Figure 7.
Compared with Yujiao Huo’s model, a vertical speed monitoring point is set every 0.1 m in this model, the average speed error of each monitoring point is 2.23%, the maximum speed error is 5.17%, and all the results are less than 10%; thus, the numerical method of this model is reasonable.

4. Results and Analysis

4.1. Analysis of Photovoltaic Curtain Wall Layout

According to the above Fluent numerical simulation, the cloud map results of the surface temperature distribution of photovoltaic curtain wall under the condition of unit length, a height of 12 m and a simulated height of 0.3–0.8 m from the ground are obtained (as shown in Figure 8).
From the temperature field distribution results in Figure 8, it can be found that with the increasing height from the ground, the surface temperature of the photovoltaic curtain wall is constantly decreasing. The temperature decreases very significantly, at 0.3–0.7 m; the surface temperature of the photovoltaic curtain wall is 316 K at 0.7 m and the photovoltaic surface temperature does not change significantly with the change of height from the ground after reaching 0.7 m. Therefore, when the building height is 12 m, a photovoltaic curtain wall with a height of 0.7 m from the ground is selected; the height of 0.7 m from the ground has the best heat exchange effect on the surface temperature of the photovoltaic curtain wall. The calculation formula for photovoltaic curtain wall power generation efficiency at different ground heights is [37]:
η c e l l = η o 1 β ( T p v 298.15 )
where η c e l l is the power generation efficiency of the photovoltaic curtain wall at different ground heights, %; η o is the power generation efficiency of photovoltaic curtain wall under standard conditions, 20%; β is the photovoltaic surface temperature coefficient, take 0.0045; and the average surface temperature of the photovoltaic curtain wall is T P V , K.
According to Equation (9), plotting the photovoltaic power generation efficiency at each height from the ground (as shown in Figure 9) shows that the photovoltaic curtain wall power generation efficiency increases with the height from the ground. The power generation efficiency reaches a maximum of 18.39% when the height from the ground reaches 0.7 m; the photovoltaic curtain wall power generation is calculated in the Design Builder V7 software.
When arranging a single façade photovoltaic curtain wall, it is necessary to consider the production capacity of each façade photovoltaic and the impact of the layout of the photovoltaic curtain wall on indoor lighting. In order to ensure that there is sufficient daylight indoors, the photovoltaic curtain wall adopts photovoltaic glass with a solar transmittance of 35% and a visible transmittance of 40%. The indoor average daylight coefficient of office buildings cannot be less than 2%; the photovoltaic capacity and average daylight coefficient per unit area of each façade are shown in Figure 10.
According to the results of Figure 10, the PV curtain wall on the south façade has the largest average capacity per cubic meter, reaching 194.366 kWh/m2; meanwhile, the PV curtain wall on the north façade has the smallest capacity per square meter, only reaching 143.49 kWh/m2. When the photovoltaic curtain wall is on the west façade, the indoor average daylight coefficient is the best, at 2.21%; but, the indoor average daylight coefficient of the photovoltaic curtain wall on each façade is more than 2%. Therefore, based on the above comparative analysis, the best layout façade of the photovoltaic curtain wall is the south façade of the building.

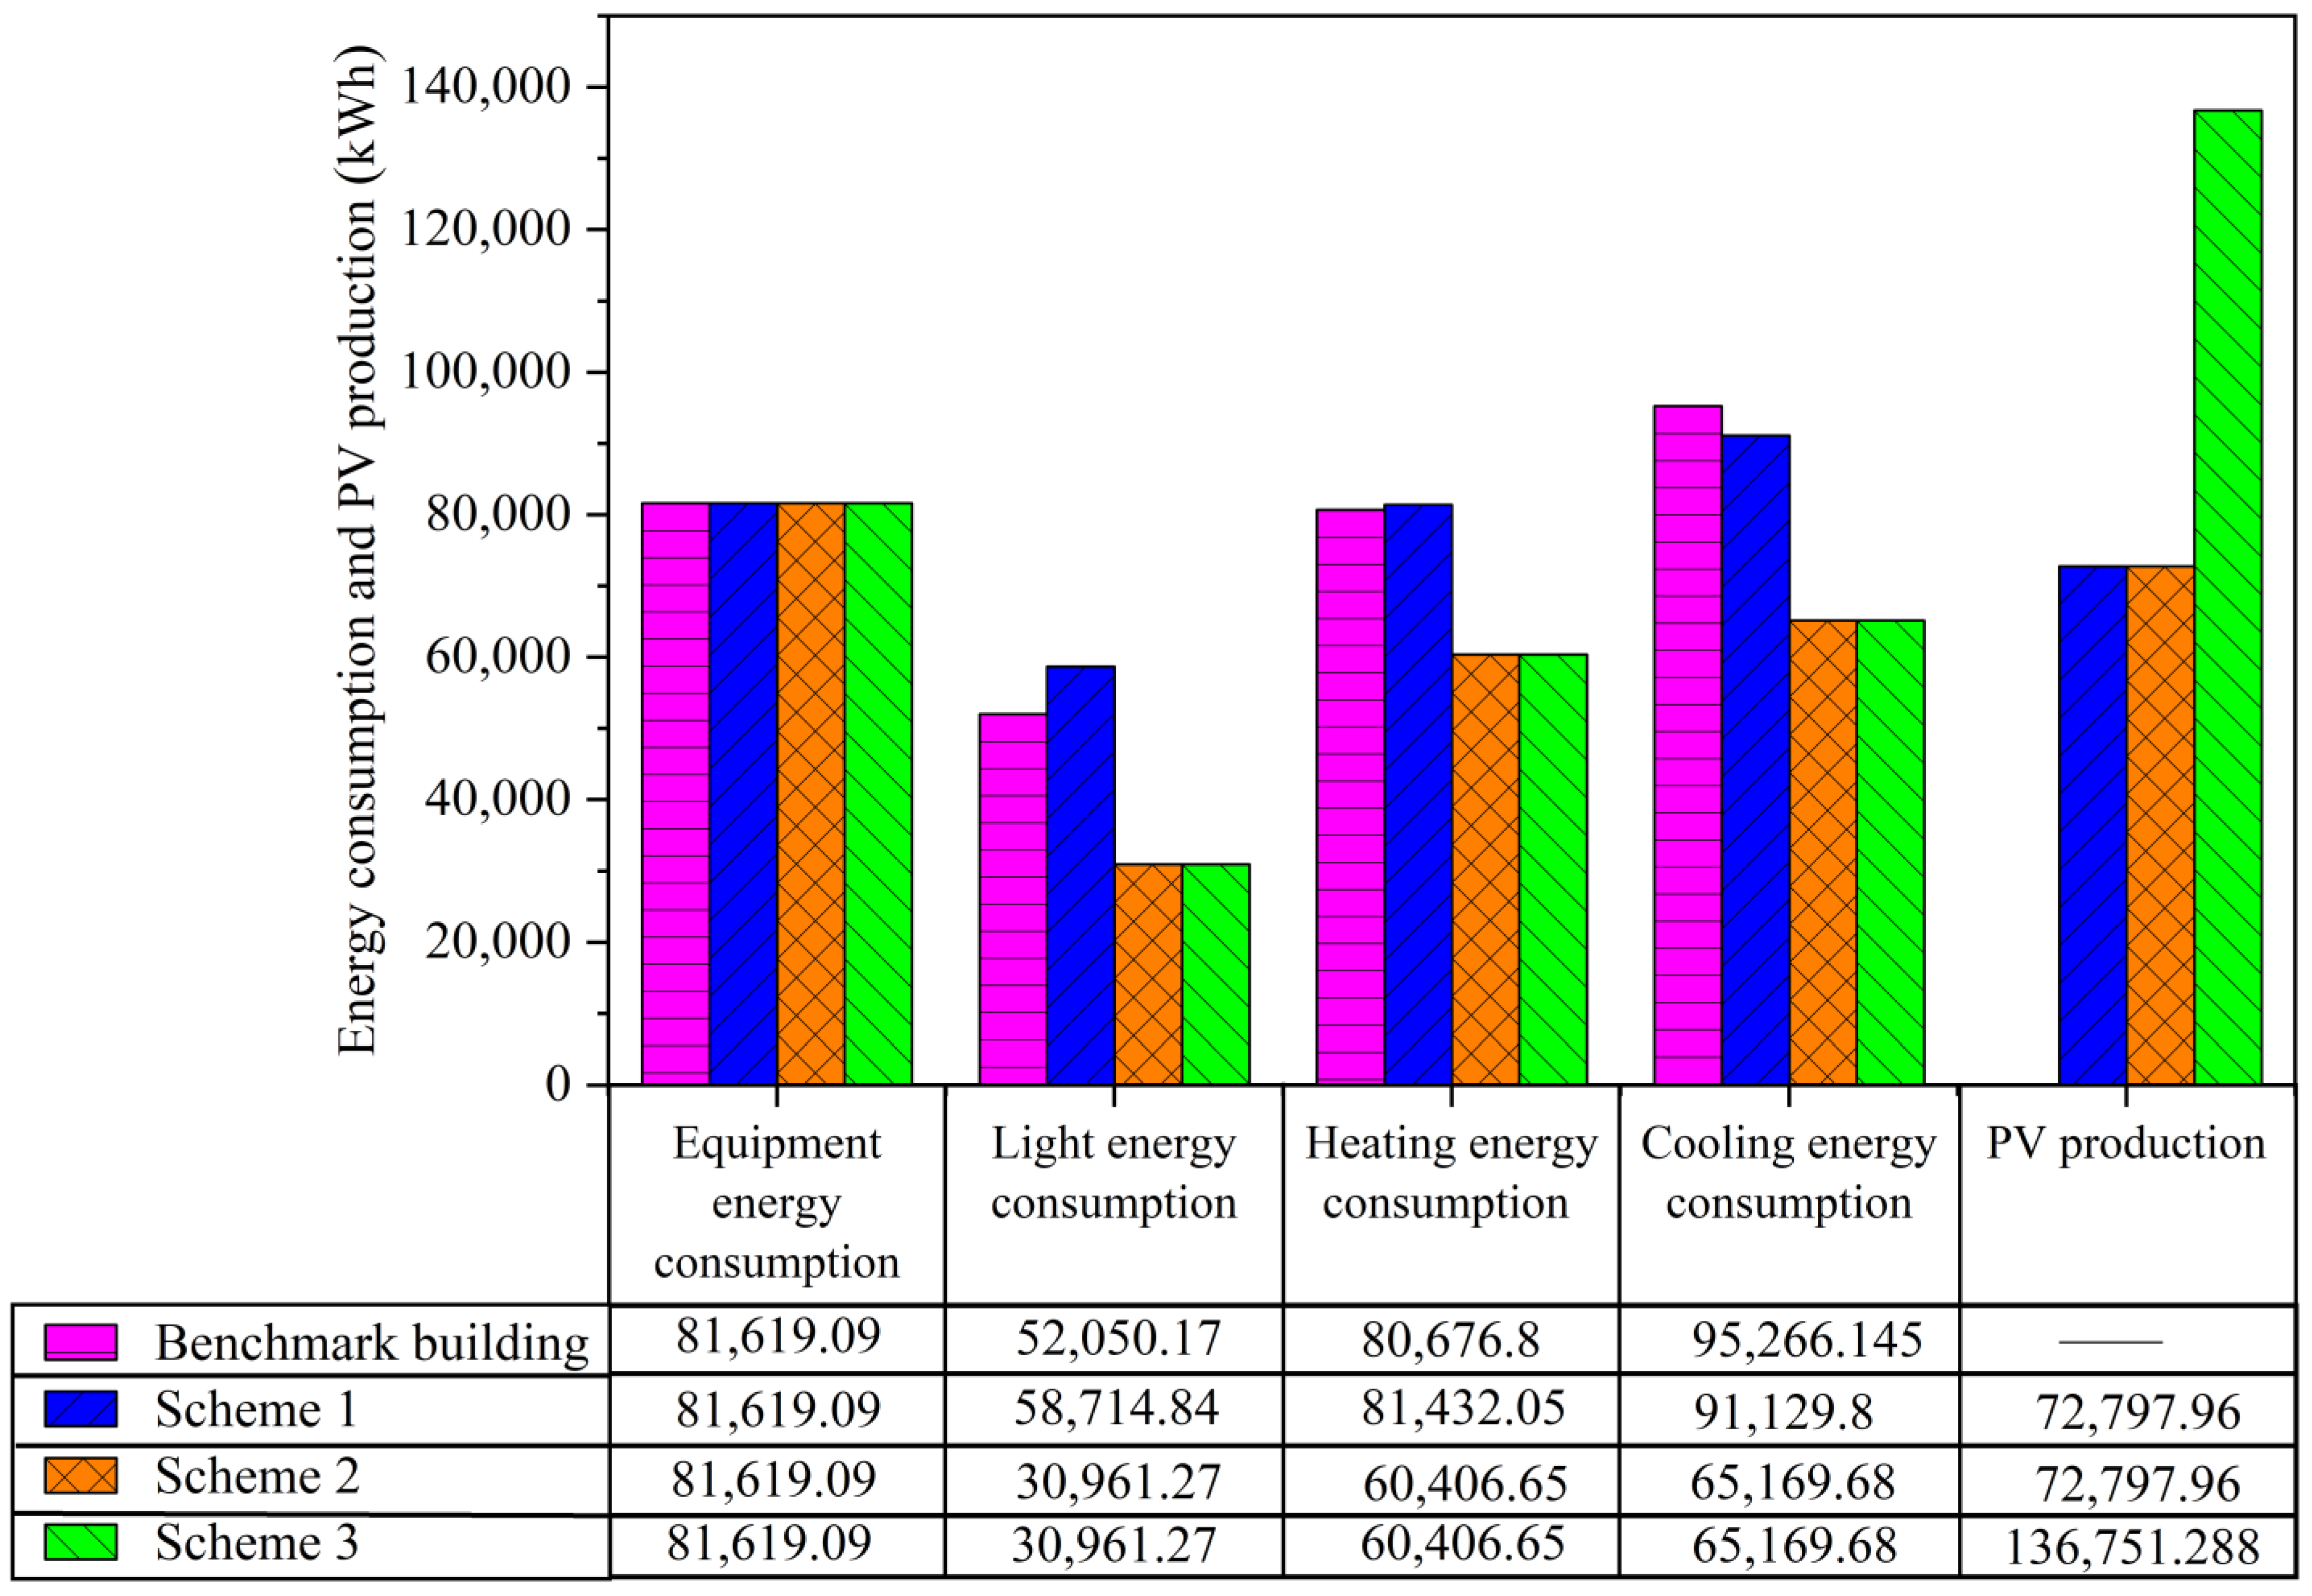
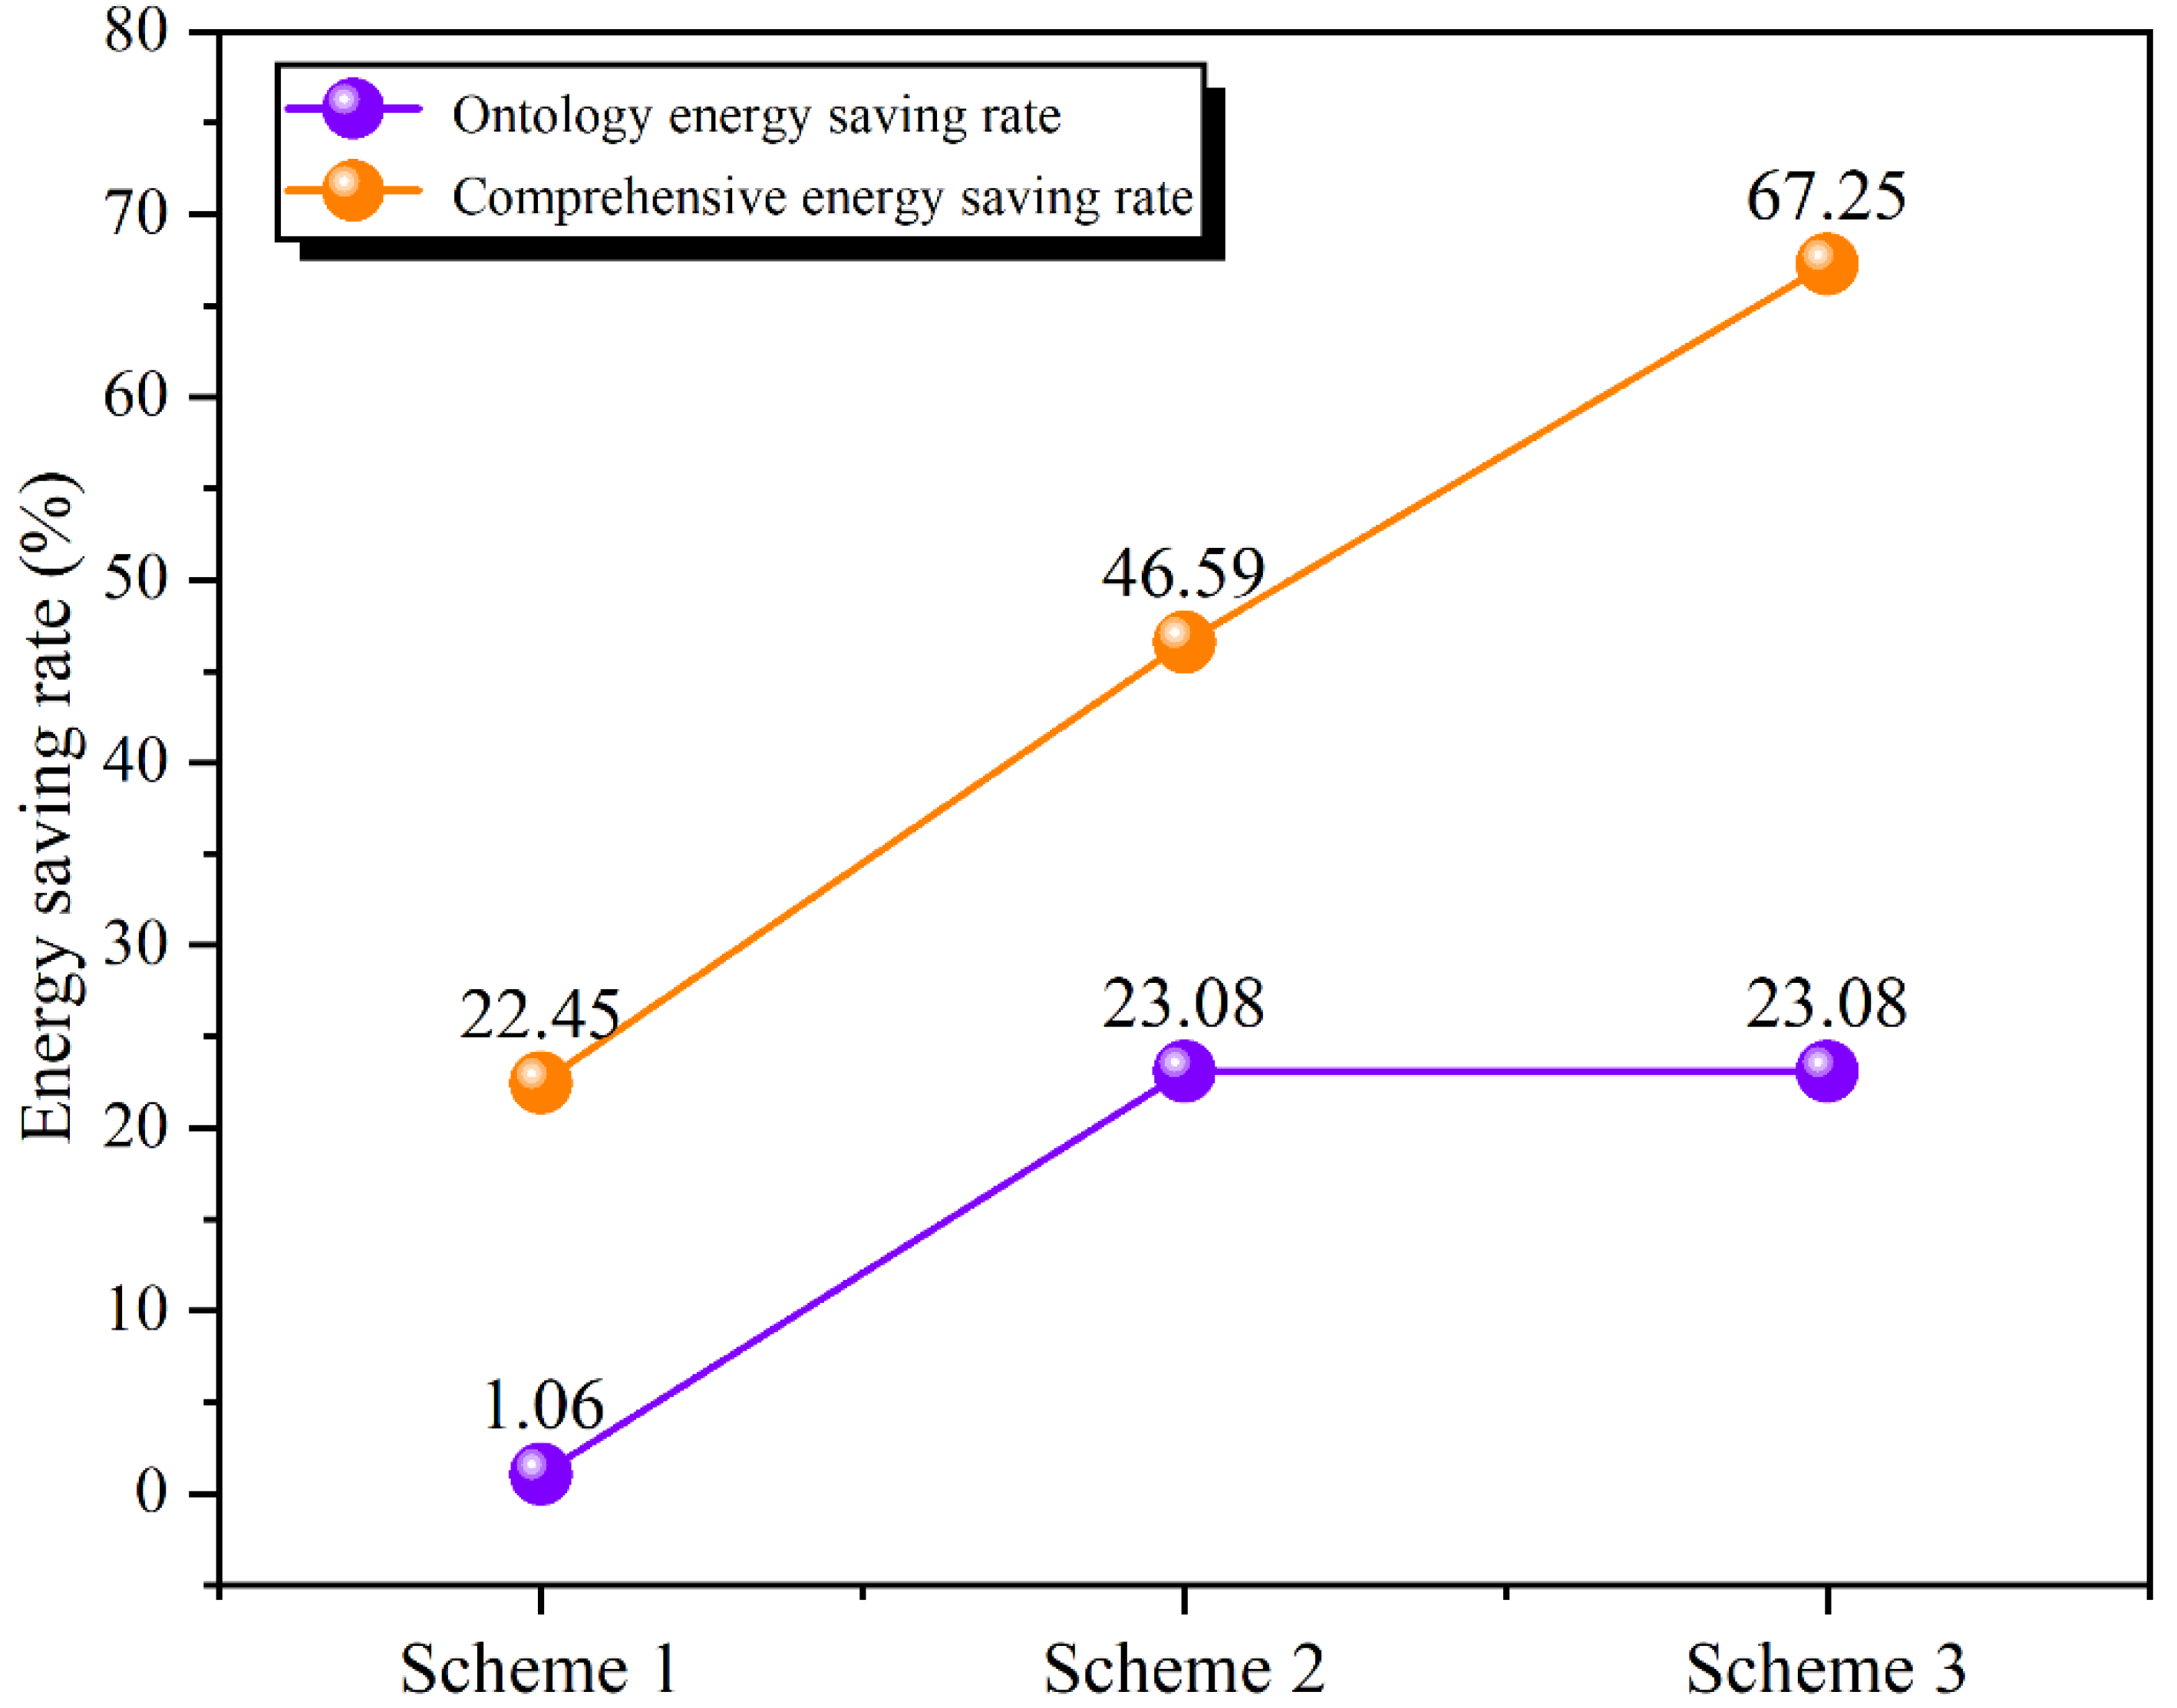
4.2. Comparison of Energy Consumption Results of Each Scheme

According to the GBT51350-2019 “Near-zero Energy Building Technical Standard”, the basic orientation energy consumption of the actual building is calculated. The office building is rotated by 90°, 180°, and 270°, in turn, and the sum of the building energy consumption in the four different directions is calculated; the average result is used as the energy consumption of the benchmark building. The building energy consumption includes equipment energy consumption, lighting energy consumption, heating energy consumption, and cooling energy consumption; the energy consumption results of each orientation are shown in Table 5.
According to the data of the building energy consumption results calculated at various rotation angles, shown in Table 5, the total energy consumption of the benchmark building is 309,612.205 kWh, of which the heating energy consumption is 80,676.8 kWh, accounting for 26.06% of the total energy consumption of the benchmark building. The cooling energy consumption is 95,266.145 kWh, accounting for 30.77% of the total energy consumption of the benchmark building; the lighting energy consumption is 52,050.17 kWh, accounting for 16.81% of the total energy consumption of the building; and the rest of the energy consumption is equipment energy consumption. On the basis of the benchmark building, the building energy consumption of the three energy-saving design schemes is calculated and analyzed separately; the energy consumption results of each scheme are shown in Figure 11.
According to the results of Figure 11, compared with the benchmark building energy consumption results, the heating energy consumption of scheme 1 increased by 1.07% and the cooling energy consumption decreased by 4.34%. This is due to the photovoltaic curtain wall adding a shading effect to the building, resulting in an increase in building heating energy consumption and a decrease in cooling energy consumption. The second scheme adopts an air-source heat pump and a 50% energy-saving lamp, resulting in a 40.52% reduction in lighting energy consumption, a 25.13% reduction in heating energy consumption, and a 31.60% reduction in cooling energy consumption. Due to the addition of photovoltaic panels on the southern roof in scheme 3, the photovoltaic production capacity of scheme 3 increased by 46.77% compared with other solutions. The ontology energy saving rate and comprehensive energy saving rate of each scheme can be based on the formula:
E E = ( E e + E l + E h + E c ) × f i A
E D = E E E r , i × f i A
η e = E E E R E R × 100 %
η p = E D E R E R × 100 %
where E E is the comprehensive value of the design building energy consumption without renewable energy generation, kWh/(m2·a); E e , E l , E h , and E C are designed building equipment energy consumption, lighting energy consumption, heating energy consumption, and cooling energy consumption, kWh; f i is the conversion coefficient of class i energy, where the energy conversion coefficient is 2.6; A is the building area, m2; E D is the comprehensive value of the energy consumption of designed buildings, including renewable energy generation, kWh/(m2·a);   E r , i refers to the Class i energy generation, kWh; E R is the comprehensive value of the benchmark building energy consumption, kWh/(m2·a); and η e and η p are the building body energy saving rate and building comprehensive energy saving rate, respectively.
According to the GBT51350-2019 “Near-zero Energy Building Technical Standard”, the energy efficiency indicators of near-zero energy public buildings in hot-summer and cold-winter areas are that the energy saving rate of the building itself is not less than 20% and the comprehensive energy saving rate is not less than 60%. According to the results of Figure 12, scheme 1 can neither meet the energy efficiency index of the ontology energy saving rate, nor can it meet the energy efficiency index of the comprehensive energy saving rate; scheme 2 can meet the energy efficiency index of the ontology energy saving rate but cannot meet the energy efficiency index of the comprehensive energy saving rate; while scheme 3 can meet the requirements of the two energy efficiency indicators at the same time.

5. Conclusions

In this paper, according to the meteorological parameters of the Hefei area, the cavity size of the photovoltaic curtain wall in this area is calculated and analyzed; also, the photoelectric efficiency of the photovoltaic curtain wall at different ground heights is analyzed on the basis of simulating the surface temperature of the photovoltaic curtain wall at different ground heights. On the basis of comparing the photovoltaic production capacity per unit area and the average daylight coefficient in the building, the best façade of the building is selected for the installation of the photovoltaic curtain wall. Three renovation schemes were proposed and the design and transformation of a 12-m high office building in Hefei were carried out via Design Builder software, as well as whether each design scheme met the energy efficiency standards of near-zero energy public buildings in the area. The following practical conclusions were obtained:
(1)
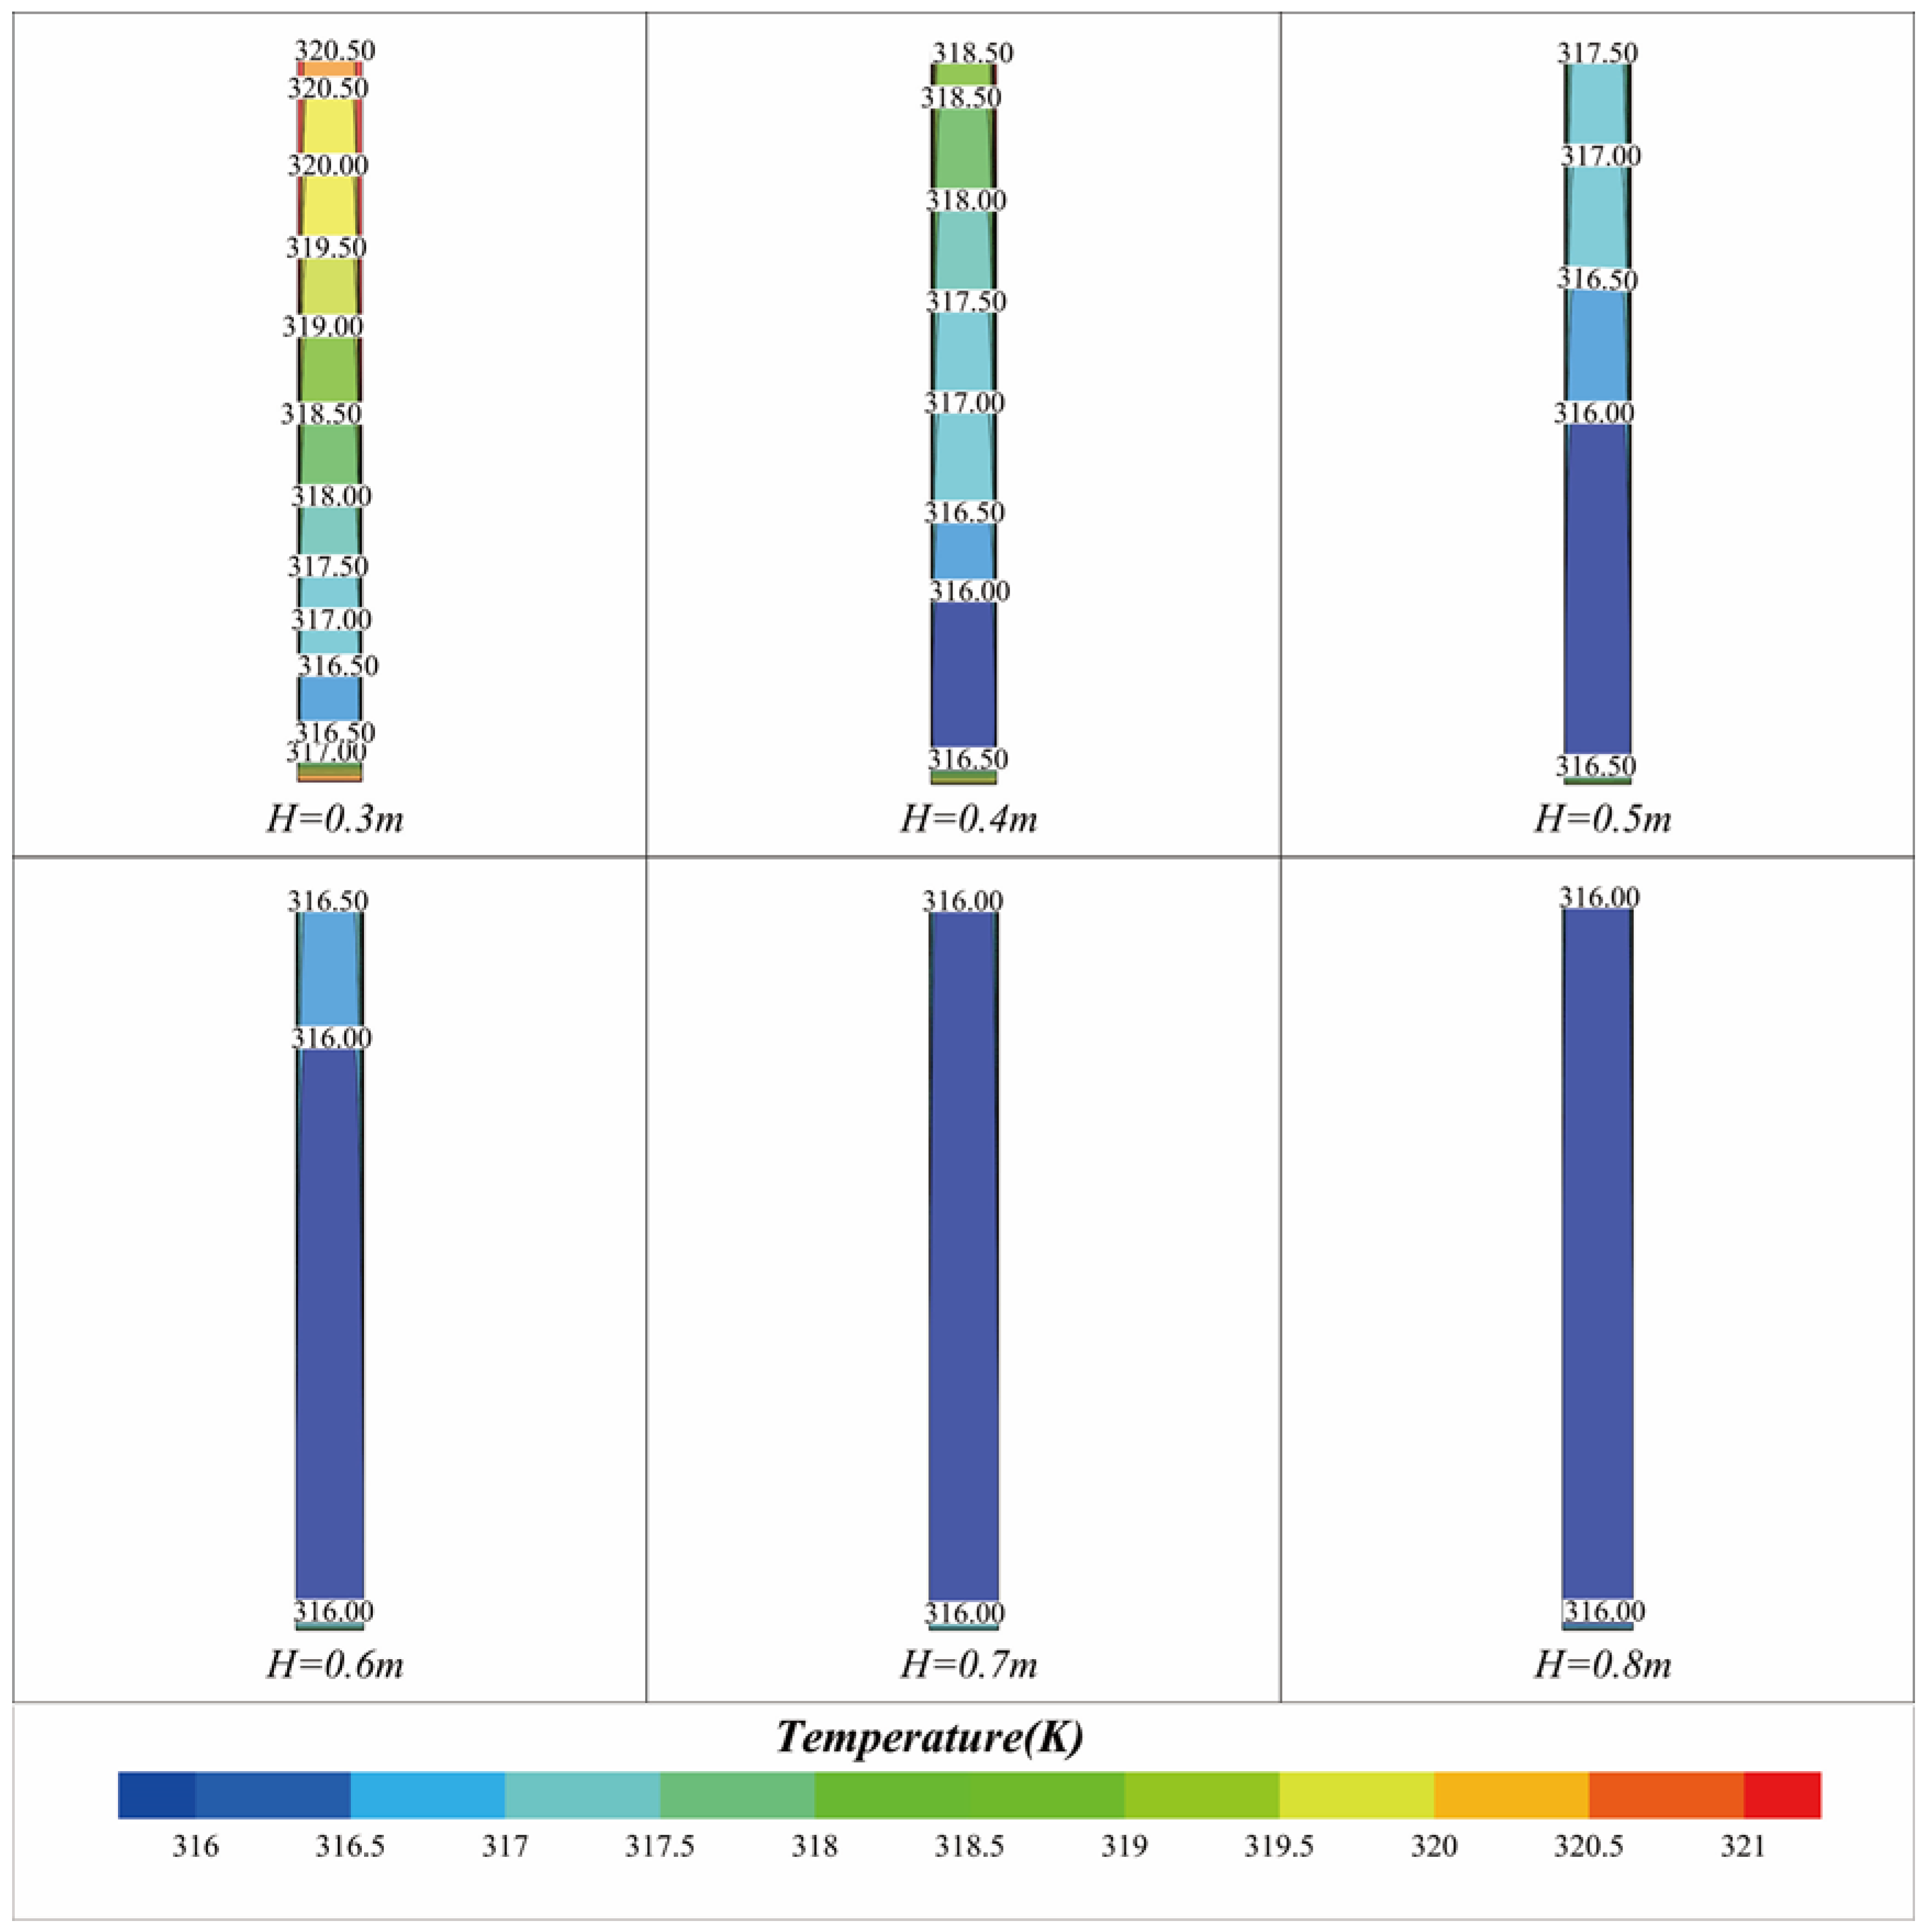
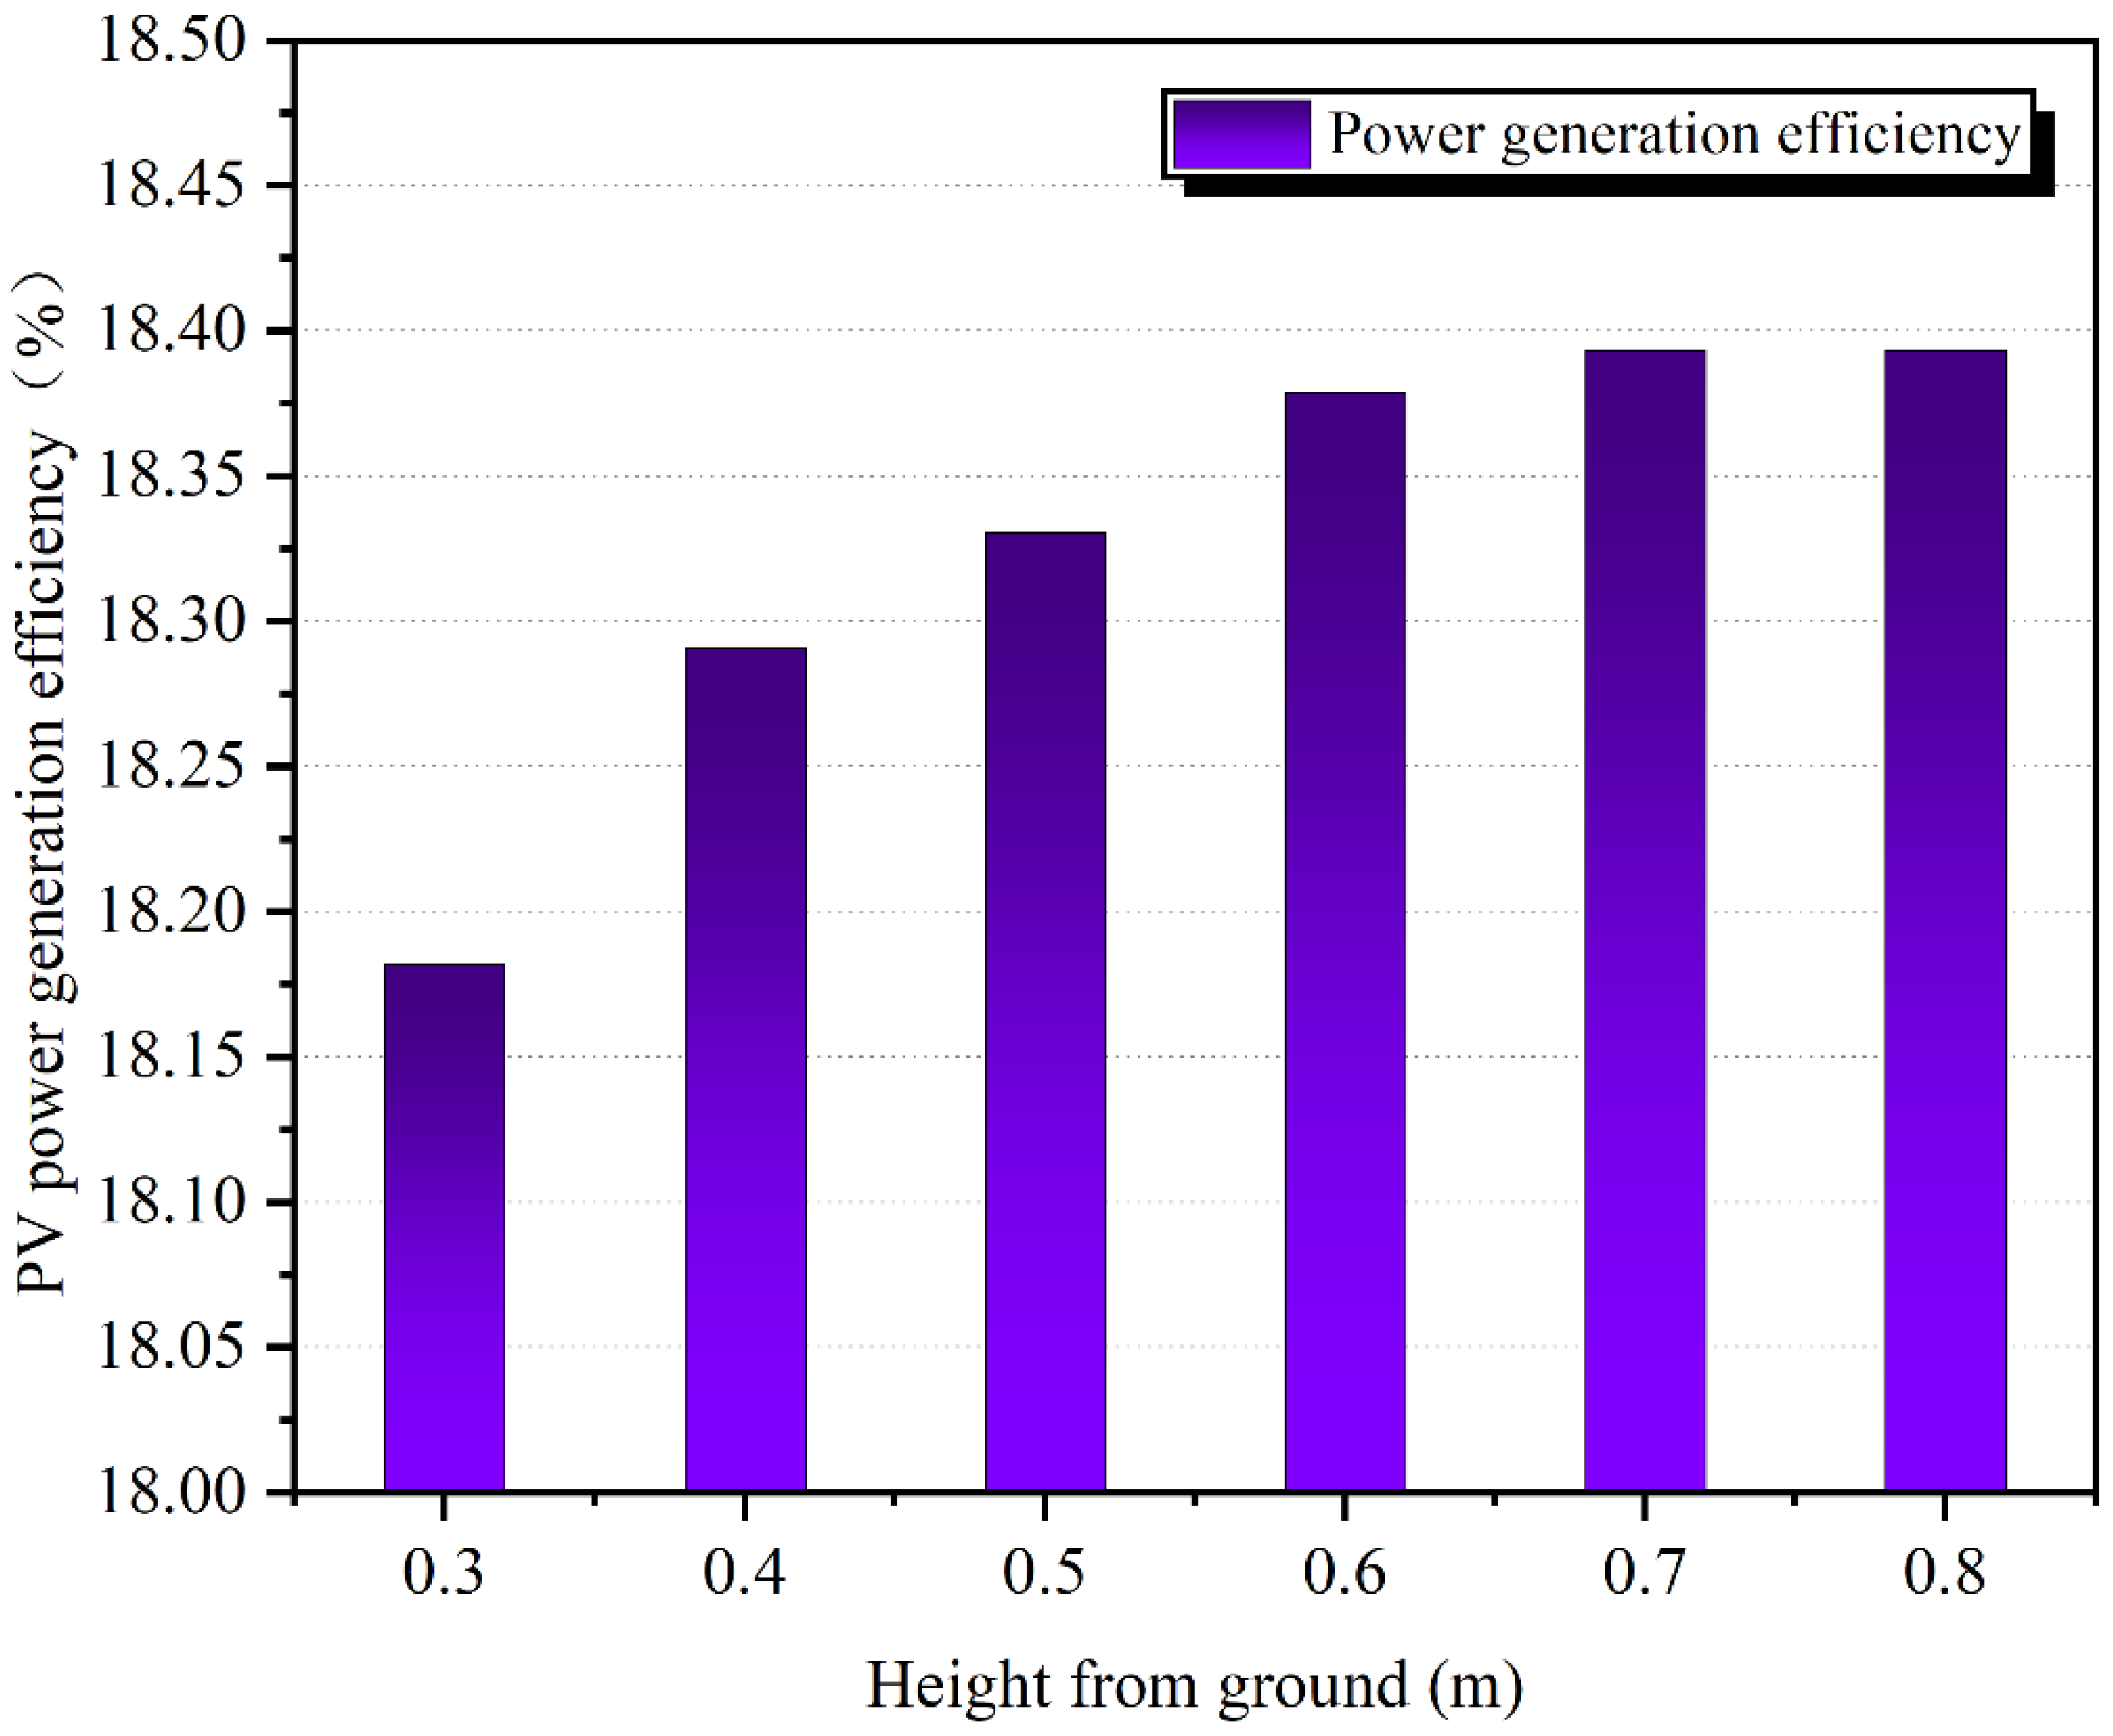
When the cavity size of the photovoltaic curtain wall in Hefei is 70 mm, the cavity heat transfer coefficient is the lowest and the heat insulation performance of the building is the best. For 12-m high public buildings, when the height is 0.7 m from the ground, the surface temperature of the photovoltaic curtain wall is the lowest and the temperature has the least impact on the efficiency of photovoltaic power generation;
(2)
The best installation position of the single-façade photovoltaic curtain wall is on the south façade of the building and the installation of a single façade wall will have a shading effect on the building, increasing the heating energy consumption of the building by 1.07% and reducing the cooling energy consumption by 4.34%;
(3)
The use of a single-façade photovoltaic curtain wall cannot meet the energy efficiency indicators of near-zero energy buildings, and it is necessary to cooperate with efficient air conditioning systems and lighting systems and install photovoltaic roofs. Only then can an energy-saving rate of not less than 20% and the comprehensive energy saving rate of no less than 60%.

Author Contributions

Conceptualization, H.W., F.W., N.L. and J.Z.; methodology, H.W. and F.W.; writing—original draft, F.W.; writing—review and editing, H.W.; visualization, N.L.; supervision, J.Z. All authors have read and agreed to the published version of the manuscript.

Funding

The authors gratefully acknowledge the financial support for this work provided by Anhui Provincial Key Research and Development Planning Foundation (202004a07020019, 202004a07020049).

Institutional Review Board Statement

Not applicable.

Informed Consent Statement

Informed consent was obtained from all subjects involved in the study.

Data Availability Statement

The data presented in this study are available on request from the corresponding author.

Conflicts of Interest

The authors declare that there are no conflict of interest. The authors state that they have no known competing financial interests or personal relationships to influence the work reported in this paper.

References

  1. GB/T51350-2019; Technical Standard for near Zero Energy Buildings. China Building Industry Press: Beijing, China, 2019.
  2. dos Santos Ferreira, G.; dos Santos, D.M.; Avila, S.L.; Albani, V.V.L.; Orsi, G.C.; Vieira, P.C.C.; Rodrigues, R.N. Short- and long-term forecasting for building energy consumption considering IPMVP recommendations, WEO and COP27 scenarios. Appl. Energy 2023, 339, 120980. [Google Scholar] [CrossRef]
  3. Research Report on Building Energy Consumption and Carbon Emissions in China (2022). Building 2023, 57–69. Available online: https://kns-cnki-net-443.webvpn.ahjzu.edu.cn/kcms/detail/detail.aspx?FileName=JANZ202302051&DbName=CJFQ2023 (accessed on 20 July 2023).
  4. Amaripadath, D.; Rahif, R.; Zuo, W.; Velickovic, M.; Voglaire, C.; Attia, S. Climate change sensitive sizing and design for nearly zero-energy office building systems in Brussels. Energy Build. 2023, 286, 112971. [Google Scholar] [CrossRef]
  5. Ahmed, A.; Ge, T.; Peng, J.; Yan, W.-C.; Tee, B.T.; You, S. Assessment of the renewable energy generation towards net-zero energy buildings: A review. Energy Build. 2022, 256, 111755. [Google Scholar] [CrossRef]
  6. D’Agostino, D.; Parker, D.; Epifani, I.; Crawley, D.; Lawrie, L. How will future climate impact the design and performance of nearly zero energy buildings (NZEBs)? Energy 2022, 240, 122479. [Google Scholar] [CrossRef]
  7. Jaysawal, R.K.; Chakraborty, S.; Elangovan, D.; Padmanaban, S. Concept of net zero energy buildings (NZEB)-A literature review. Clean. Eng. Technol. 2022, 11, 100582. [Google Scholar] [CrossRef]
  8. Sobhani, H.; Shahmoradi, F.; Sajadi, B. Optimization of the renewable energy system for nearly zero energy buildings: A future-oriented approach. Energy Convers. Manag. 2020, 224, 113370. [Google Scholar] [CrossRef]
  9. Jin, X.; Sun, Z.; Wang, D. Research on Detection and Evaluation Methods for Nearly Zero Energy Building. Build. Sci. 2022, 38, 1–10. [Google Scholar] [CrossRef]
  10. Dehwah, A.H.; Haredy, A.; Krarti, M. Retrofit analysis of historical buildings to net-zero energy: Case study of the Ain village, Saudi Arabia. Energy Build. 2022, 258, 111826. [Google Scholar] [CrossRef]
  11. Qi, H.; Huang, X.; Sheeraz, M. Green financing for renewable energy development: Driving the attainment of zero-emission targets. Renew. Energy 2023, 213, 30–37. [Google Scholar] [CrossRef]
  12. Liao, X.; Wang, W.; Zhou, Y. Investigating the Energy-Saving Effectiveness of Envelope Retrofits and Photovoltaic Systems: A Case Study of a Hotel in Urumqi. Sustainability 2023, 15, 9926. [Google Scholar] [CrossRef]
  13. Capizzi, G.; Sciuto, G.L.; Cammarata, G.; Cammarata, M. Thermal transients simulations of a building by a dynamic model based on thermal-electrical analogy: Evaluation and implementation issue. Appl. Energy 2017, 199, 323–334. [Google Scholar] [CrossRef]
  14. Kciuk, M.; Bijok, T.; Sciuto, G.L. Design and Modeling of Intelligent Building Office and Thermal Comfort Based on Probabilistic Neural Network. SN Comput. Sci. 2022, 3, 6. [Google Scholar] [CrossRef]
  15. Hachem-Vermette, C. Role of solar energy in achieving net zero energy neighborhoods. Sol. Energy Adv. 2022, 2, 100018. [Google Scholar] [CrossRef]
  16. Vassiliades, C.; Agathokleous, R.; Barone, G.; Forzano, C.; Giuzio, G.; Palombo, A.; Buonomano, A.; Kalogirou, S. Building integration of active solar energy systems: A review of geometrical and architectural characteristics. Renew. Sustain. Energy Rev. 2022, 164, 112482. [Google Scholar] [CrossRef]
  17. Kou, F.; Gong, Q.; Zou, Y.; Mo, J.; Wang, X. Solar application potential and thermal property optimization of a novel zero-carbon heating building. Energy Build. 2023, 279, 112688. [Google Scholar] [CrossRef]
  18. Panicker, K.; Anand, P.; George, A. Assessment of building energy performance integrated with solar PV: Towards a net zero energy residential campus in India. Energy Build. 2023, 281, 2244042. [Google Scholar]
  19. Tan, Y.; Peng, J.; Luo, Y.; Li, H.; Wang, M.; Zhang, F.; Ji, J.; Song, A. Daylight-electrical-thermal coupling model for real-time zero-energy potential analysis of vacuum-photovoltaic glazing. Renew. Energy 2023, 205, 1040–1056. [Google Scholar] [CrossRef]
  20. Wang, Q. Study on The Power Generation Performance of a Photovoltaic Curtain Wall System in Yunnan. Sol. Energy 2019, 5, 65–69. [Google Scholar]
  21. Shen, J. Application and Prospect of Building Integrated Photovoltaic Technology. Energy Energy Conserv. 2023, 49–52. [Google Scholar] [CrossRef]
  22. Hao, G.; Zhang, R.; Li, H.; Liu, C.; Yuan, X.; Ye, X.; Li, S.; Yang, N.; Zhang, J. Thermal Performance of Photovoltaic Skin Facades. Build. Sci. 2017, 33, 65–71, 88. [Google Scholar] [CrossRef]
  23. Reffat, R.M.; Ezzat, R. Impacts of design configurations and movements of PV attached to building facades on increasing generated renewable energy. Sol. Energy 2023, 252, 50–71. [Google Scholar] [CrossRef]
  24. Gonçalves, J.E.; Montazeri, H.; van Hooff, T.; Saelens, D. Performance of building integrated photovoltaic facades: Impact of exterior convective heat transfer. Appl. Energy 2021, 287, 116538. [Google Scholar] [CrossRef]
  25. Zhu, J.; He, G. Heat transfer coefficients of double skin facade windows. Sci.Technol. Built Environ. 2019, 25, 1143–1151. [Google Scholar] [CrossRef]
  26. Shukla, S.; Lee, E.; Lunt, R.R.; Anctil, A. Net energy and cost benefit of phthalocyanine and heptamethine transparent photovoltaics in commercial buildings. Sustain. Energy Technol. Assess. 2022, 53, 102631. [Google Scholar] [CrossRef]
  27. Qiu, C.; Yang, H. Daylighting and overall energy performance of a novel semi-transparent photovoltaic vacuum glazing in different climate zones. Appl. Energy 2020, 276, 115414. [Google Scholar]
  28. Huo, Y. Research on Daylight Environment and Energy Performance of Building Integrated See-Through Thin Film Photovoltaic Curtain Wall. Ph.D. Thesis, Tianjin University, Tianjin, China, 2016. [Google Scholar]
  29. Siddique, M.; Shahzad, N.; Umar, S.; Waqas, A.; Shakir, S.; Janjua, A.K. Performance assessment of Trombe wall and south façade as applications of building integrated photovoltaic systems. Sustain. Energy Technol. Assess. 2023, 57, 103141. [Google Scholar] [CrossRef]
  30. Cheng, Y.; Lu, X.; Feng, G.; Huang, K.; Wang, T. Heat Exchange Optimization of Photovoltaic Curtain Wall System in Near Zero Energy Building. J. Shenyang Jianzhu Univ. (Nat. Sci. Ed.) 2023, 39, 314–322. [Google Scholar]
  31. Kotarela, F.; Kyritsis, A.; Agathokleous, R.; Papanikolaou, N. On the exploitation of dynamic simulations for the design of buildings energy systems. Energy 2023, 271, 127002. [Google Scholar] [CrossRef]
  32. Hyun, J.Y.; Park, B.R.; Kim, N.H.; Moon, J.W. Building energy performance of DSSC BIPV windows in accordance with the lighting control methods and climate zones. Sol. Energy 2022, 244, 279–288. [Google Scholar]
  33. GB 50736-2012; Code for Design of Heating, Ventilation and Air Conditioning of Civil Buildings. Issued by the Ministry of Housing and Urban-Rural Development. China Architecture and Construction Press: Beijing, China, 2012.
  34. GB 50189-2015; Energy Saving Design Standard for Public Buildings. China Academy of Building Research; China Building Industry Press: Beijing, China, 2015.
  35. Jia, Y. Research on Building Intelligent Lighting Control System. Master’s Thesis, Hebei University of Science and Technology, Shijiazhuang, China, 2020. [Google Scholar] [CrossRef]
  36. Wang, F. Computational Fluid Dynamics Analysis; Tsinghua University Press: Beijing, China, 2004. [Google Scholar]
  37. Liu, R. Application of Photovoltaic Curtain Wall in Office Building. Master’s Thesis, Shenyang Jianzhu University, Shenyang, China, 2020. [Google Scholar] [CrossRef]
Figure 1. Architectural model.
Sustainability 15 11701 g001
Figure 2. Hourly dry-bulb temperature.
Sustainability 15 11701 g002
Figure 3. Building plan: (a) floor plan of the first floor; (b) floor plan of the second and third floors.
Sustainability 15 11701 g003
Figure 4. Cavity heat transfer coefficient.
Sustainability 15 11701 g004
Figure 5. Photovoltaic physical model.
Sustainability 15 11701 g005
Figure 6. Model surface temperature for different mesh sizes.
Sustainability 15 11701 g006
Figure 7. Numerical verification of the model.
Sustainability 15 11701 g007
Figure 8. Distribution of photovoltaic surface temperature field.
Sustainability 15 11701 g008
Figure 9. Photovoltaic power generation efficiency.
Sustainability 15 11701 g009
Figure 10. Comparison of production capacity and daylighting in different PV orientations.
Sustainability 15 11701 g010
Figure 11. Building energy consumption for three design schemes.
Sustainability 15 11701 g011
Figure 12. Comparison of energy efficiency indicators of the three schemes.
Sustainability 15 11701 g012
Table 1. Personnel, lighting, and equipment parameter settings.
Functional
Partitions
Floor Space Per Capita (m2)Occupancy RateEquipment Power Density (W/m2)Device UsageLighting Power Density (W/m2)Lighting Duration (h/Month)
Office1032.7%1332.7%9240
Conference 3.3316.7%561.8%9180
Lounge3.3316.7%00.0%5150
Hall2033.3%00.0%5270
Equipment room00.0%00.0%50
Table 2. Thermal conductivity of air equivalent.
Tm/°C203040
λa/W·(m·K)−10.02590.02670.0276
Table 3. Air physical property parameters.
Density kg/m³Specific Heat Capacity J/(kg·K)Thermal Conductivity W/(m·K)Viscosity Coefficient kg/(m·s)Coefficient of Expansion
1/K
1.21006.430.02421.78 × 10−53.19 × 10⁻³
Table 4. Physical parameters of photovoltaic curtain walls.
Material NameDensity kg/m3Specific Heat Capacity J/(kg·K)Thermal Conductivity W/(m·K)Absorptivity
PV glass23307121.480.9
Building walls199018801.75——
Table 5. Building energy consumption in different orientations.
Equipment kWhLighting kWhHeating
kWh
Cooling
kWh
Total
kWh
Basic orientation81,619.0951,495.9880,564.9892,159.73305,839.78
Rotate 90°81,619.0952,812.7981,168.0697,844.07313,444.01
Rotate 180°81,619.0951,934.1380,425.9592,913.83306,893.00
Rotate 270°81,619.0951,957.7880,548.2198,146.95312,272.03
Disclaimer/Publisher’s Note: The statements, opinions and data contained in all publications are solely those of the individual author(s) and contributor(s) and not of MDPI and/or the editor(s). MDPI and/or the editor(s) disclaim responsibility for any injury to people or property resulting from any ideas, methods, instructions or products referred to in the content.

