Article

Climate Change Implications for Optimal Sizing of Residential Rooftop Solar Photovoltaic Systems in Qatar

by
Muhammad Imran Khan
1,
Dana I. Al Huneidi
2,
Faisal Asfand
3,* and
Sami G. Al-Ghamdi
2,4
1
Department of Mechanical Engineering, College of Engineering, Prince Mohammad Bin Fahd University, Al-Khobar 34754, Saudi Arabia
2
Division of Sustainable Development, College of Science and Engineering, Hamad Bin Khalifa University, Qatar Foundation, Doha 2700, Qatar
3
School of Computing and Engineering, University of Huddersfield, Huddersfield HD1 3DH, UK
4
Environmental Science and Engineering Program, Biological and Environmental Science and Engineering Division, King Abdullah University of Science and Technology (KAUST), Thuwal 23955, Saudi Arabia
*
Author to whom correspondence should be addressed.
Sustainability 2023, 15(24), 16815; https://doi.org/10.3390/su152416815
Submission received: 1 November 2023 / Revised: 8 December 2023 / Accepted: 11 December 2023 / Published: 13 December 2023

Abstract

:
Climate change poses critical challenges for Qatar’s energy-intensive residential building sector. This study evaluates the impact of projected climate warming on optimizing rooftop solar photovoltaics (PV) for villas. An integrated modelling approach is employed, combining building energy simulation, PV system optimization, and performance assessment under varying climate scenarios. A typical Qatari villa is modelled in DesignBuilder and simulated under the baseline (2002) conditions and the projected years 2016, 2050, and 2100, reflecting incremental warming. Results show the villa’s annual electricity consumption will grow 22% by 2100, with summer peaks escalating to 26% driven by surging cooling demands. Techno-economic optimization in HOMER Pro (version 3.10) verifies a grid-connected rooftop PV system as optimal in all years, with capacity expanding from 7.4 kW to 8.2 kW between 2002 and 2100 to meet rising air conditioning loads. However, as temperatures increase, PV’s energy contribution declines slightly from 18% to 16% due to climate change degrading solar yields. Nonetheless, the modelled PV system maintains strong financial viability, achieving 5–8 years of paybacks across scenarios. This analysis provides empirical evidence of distributed PV’s effectiveness for Qatar’s households amidst escalating cooling consumption. However, maintaining solar mitigation potential requires evolving PV sizing methodologies and incentives to account for declining panel productivity at the country’s peak temperatures exceeding 50 °C. Overall, this study’s integrated framework evaluates residential solar PV systems’ capabilities and appropriate policy evolution under projected climate impacts for the first time in Qatar. The modelling approach and conclusions can inform building codes and pro-solar policies to accelerate adoption for emissions reduction. With villas representing over 100,000 units in Qatar, widespread rooftop PV integration can meaningfully contribute to national sustainability targets if implementation barriers are addressed considering climate change effects.

1. Introduction

Climate change poses critical challenges worldwide, with rising temperatures affecting all sectors of society and the economy. The building sector is particularly vulnerable, as higher ambient temperatures increase cooling demands and energy consumption. This sector is a major contributor to global energy consumption, accounting for 30–40% of global energy use and 27–30% of energy-related carbon emissions worldwide emissions [1,2,3,4,5,6,7,8,9]. Given its substantial energy consumption and emissions, the building sector plays a crucial role in mitigating climate change and transitioning to low-carbon economies. Therefore, there is a growing emphasis on the adoption of sustainable building systems, with a specific focus on integrating solar photovoltaic (PV) technology into residential and commercial buildings.
The integration of solar PV systems offers several benefits beyond reducing reliance on conventional grid power and mitigating carbon emissions [10,11]. It provides long-term cost savings on energy bills, enhances energy security, and contributes to the overall resilience of the residential sector [12,13]. By generating clean and renewable electricity on-site, residential buildings can achieve a degree of self-sufficiency in meeting a significant portion of their energy demand [14]. Additionally, rooftop PV systems offer the advantage of utilizing underutilized spaces, such as rooftops, to generate electricity without the need for additional land resources [15].
However, the integration of sustainable energy solutions into building designs, particularly in regions heavily reliant on grid power like Qatar, presents ongoing challenges. The hot and humid climate of Qatar necessitates extensive use of air conditioning, which accounts for over two-thirds of the sector’s energy demand [16,17]. As a result, Qatar’s residential energy consumption per capita (>17,500 kWh/year) ranks among the highest globally [16,18,19,20,21,22], in contrast to broader declining trends in most of other countries [23]. This over-consumption produces significant greenhouse gas emissions [19], as residential buildings alone represent around 60% of Qatar’s total final energy use [17]. However, efforts to reduce demand face barriers, notably the provision of highly subsidized or free electricity to citizens and nationals and highly subsidized for foreign residents, removing incentives for conservation [24,25]. Without price signals, consumers lack incentive to conserve energy [26]. With residential buildings representing such a substantial portion of Qatar’s energy burden, the integration of renewable solutions like rooftop solar photovoltaics assumes critical importance for reducing emissions. Yet the optimization of such technologies requires addressing the sector’s unique climatic and policy challenges.
To address these challenges, the integration of renewable energy sources, such as rooftop solar photovoltaics (PV), into new construction and retrofits holds significant potential for emissions reduction [27]. However, the widespread adoption of rooftop PVs faces multiple barriers, including high upfront costs and lack of awareness among home owners [21,28]. Moreover, it is crucial to consider the climate impacts on building energy performance when designing net-zero energy systems. While previous studies evaluated rooftop PV potential predominantly for educational and commercial buildings in Qatar [29,30,31], assessments incorporating residential buildings in Qatar under future climate scenarios are lacking. In this context, limited attention has been given to assessing solar PV integration and optimization under future climate scenarios. As global temperatures continue to rise at a rate of 0.3 °C per decade, the escalating cooling loads and energy demands will undoubtedly impact the performance and design of PV systems [32,33,34,35,36]. The efficiency of solar panels varies significantly between hot and cold climates due to impacts on photovoltaic (PV) cell performance [33,34]. In hot environments like Qatar solar panels tend to be less efficient because high temperatures negatively impact PV cells. As temperature increases, a solar panel’s output voltage decreases, reducing power generation. Typically, each 1 °C rise above 25 °C reduces panel efficiency by 0.3–0.5%. Consequently, extreme daytime spikes in Qatar above 50 °C could reduce panel yields over 15%. In summary, Qatar’s projected warming trajectories will likely exacerbate solar PV efficiency challenges due to the technology’s thermal sensitivity. Residential building assessments must incorporate integrated cooling systems and detailed climate impact projections to optimize rooftop PV sizing and performance. Therefore, it is imperative to evaluate the integration of solar PV technology under projected climate impacts to ensure the feasibility and viability of achieving zero-energy residential buildings.
In light of the aforementioned challenges and making a meaningful contribution to the reduction of carbon emissions, this study aims to evaluate the impact of climate change on the optimal design of rooftop PV systems in residential buildings in Qatar, considering varied climate change scenarios. The specific objectives are to:
Develop an energy model for a case study villa to simulate current and future energy demand under different climate projections.
Conduct a techno-economic optimization to design an optimal rooftop PV system for the villa minimizing costs.
Assess the energy, economic and environmental performance of the optimal rooftop PV system under present and future climate conditions.
By considering the dynamic nature of climate conditions and their influence on energy demand, this research endeavours to provide valuable insights into the effectiveness of solar energy integration as a viable solution for carbon emission reduction in the residential sector. The study entails assessing the energy demand of a residential villa over the course of a year and modelling the effects of rooftop PV installations, with a specific focus on the potential energy savings resulting from the reduction in cooling load through roof shading. The analysis of these potential energy savings, stemming from the installation of PV systems, serves as a critical component of this study, demonstrating the tangible benefits and viability of solar PV integration. This study’s findings will provide novel techno-economic evidence and performance data to support increased policy and consumer focus on residential PV integration in Qatar’s rapidly evolving climate. By determining the cost-competitiveness of rooftop PV for households under different scenarios, the analysis can inform evidence-based policies to incentivize and accelerate adoption.

Potentials of Solar PV in Qatar

Qatar possesses tremendous potential for solar photovoltaic (PV) systems, especially for rooftop installations on residential buildings. The country enjoys average daily peak sun hours of 9.6 h, with a maximum of 11.6 h during the summer months (Figure 1) [37,38]. This extensive daylight duration, along with high average annual direct normal irradiance (DNI) > 2000 kWh/m2 and diffuse horizontal irradiance (DHI) of 794 kWh/m2 provides optimal conditions for solar PV electricity generation (Figure 1) [39,40]. This combination of high solar insolation and extended daylight provides optimal conditions for both grid-scale and distributed rooftop PV generation. The timing of Qatar’s peak sunlight availability aligns well with peak electricity demand patterns, which are driven by heavy daytime cooling loads from air conditioning and appliances in the hot climate. During summer, electricity demand reaches its maximum due to increased cooling needs, corresponding with peak monthly sun hours of 11.6 h (Figure 2). Leveraging these advantages, Qatar has set the ambitious goal of meeting 20% of its electricity demand from solar PV by 2030, as outlined in the Qatar National Vision 2030 [41]. Achieving this target will require a transformation in Qatar’s energy mix, which currently relies heavily on natural gas. The integration of rooftop solar PV on residential buildings will play a key role in this transition. Widespread adoption of rooftop PV can significantly mitigate electricity demand from carbon-intensive sources while advancing Qatar’s sustainable development and climate change mitigation objectives. Recent investments affirm Qatar’s commitment to solar energy expansion. For instance, the recent inauguration of the 800 MW Al Kharsaah Solar PV Plant, Qatar’s first large-scale solar facility, marks a major milestone in the country’s renewable energy development [42]. Additional large-scale solar projects are underway, including the 458 MW Ras Laffan Industrial Solar PV Park currently in permitting [43] and 880 MW of planned capacity across Mesaieed and Ras Laffan plants expected to come online within two years [44]. Total utility scale solar PV capacity is projected to reach approximately 1700 MW by 2024 as these new plants come online [45]. Longer-term plans outlined in Qatar Energy’s sustainability strategy target scaling up solar capacity further to 5 GW by 2035 [44].
However as discussed above, the integration of rooftop solar PV into Qatar’s residential buildings faces significant policy barriers. A key challenge is the provision of highly subsidized or free electricity to citizens, which removes incentives for energy efficiency and conservation. Without appropriate price signals, consumers lack motivation to adopt technologies like solar PV to reduce grid dependence. Additionally, the lack of net metering policies and renewable energy incentives prevents homeowners from benefitting financially from generating their own solar electricity. The current absence of programs that allow feeding PV power back into the grid makes on-site solar generation less economically viable. Furthermore, building codes and regulations do not yet mandate or encourage the integration of renewables in residential developments. Overcoming these policy hurdles through measures like dynamic electricity pricing, net metering, pro-solar regulations, and subsidies or tax rebates can help catalyse the large-scale adoption of rooftop PV systems on Qatar’s households.
In summary, Qatar possesses tremendous solar resources that can be harnessed cost-effectively through both centralized and distributed PV generation. Rooftop solar PV specifically holds great potential to contribute to Qatar’s renewable energy goals while reducing the carbon footprint of the residential building sector. With supportive policies and investments, Qatar can transition its power system to leverage its abundant solar resources for sustainable development.

2. Research Methods and Approach

The research employs an integrated modelling and optimization approach to evaluate the impact of climate change on optimal rooftop PV system design for a residential villa in Qatar. The research process employed in this study is exhibited in Figure 3. While prior residential PV assessments have modelled current building energy use and optimized systems accordingly, the novel aspect here is introducing projected climate conditions into the optimization process. By simulating the villa’s electricity consumption and rerunning the PV optimization for years 2016, 2050 and 2100, the changing energy demands and solar potential are captured. This enables evaluating how escalating cooling loads could impact system sizing, economics, and renewable penetration fractions. The integrated methodology is tailored to assess these climate change effects on residential PV integration, advancing standard modelling approaches.
The methodological framework encompasses the following key steps:

2.1. Step 1: Energy Modeling of a Single Family Residential Building

To model the energy demand of a typical single family residential building, this study utilizes DesignBuilder (version 6.1), a state-of-the-art graphical interface for complex building energy modeling [47]. DesignBuilder allows for detailed 3D modelling of building geometry, zoning, construction materials, HVAC systems, occupancy, plug loads, and other parameters that influence energy performance. The software integrates advanced dynamic thermal simulation through EnergyPlus (version 9.1), a whole building energy modelling engine developed by the U.S. Department of Energy (DOE) [48]. EnergyPlus enables high-resolution simulations with sub-hourly time steps for interactions between building envelope, HVAC equipment, and environmental conditions.
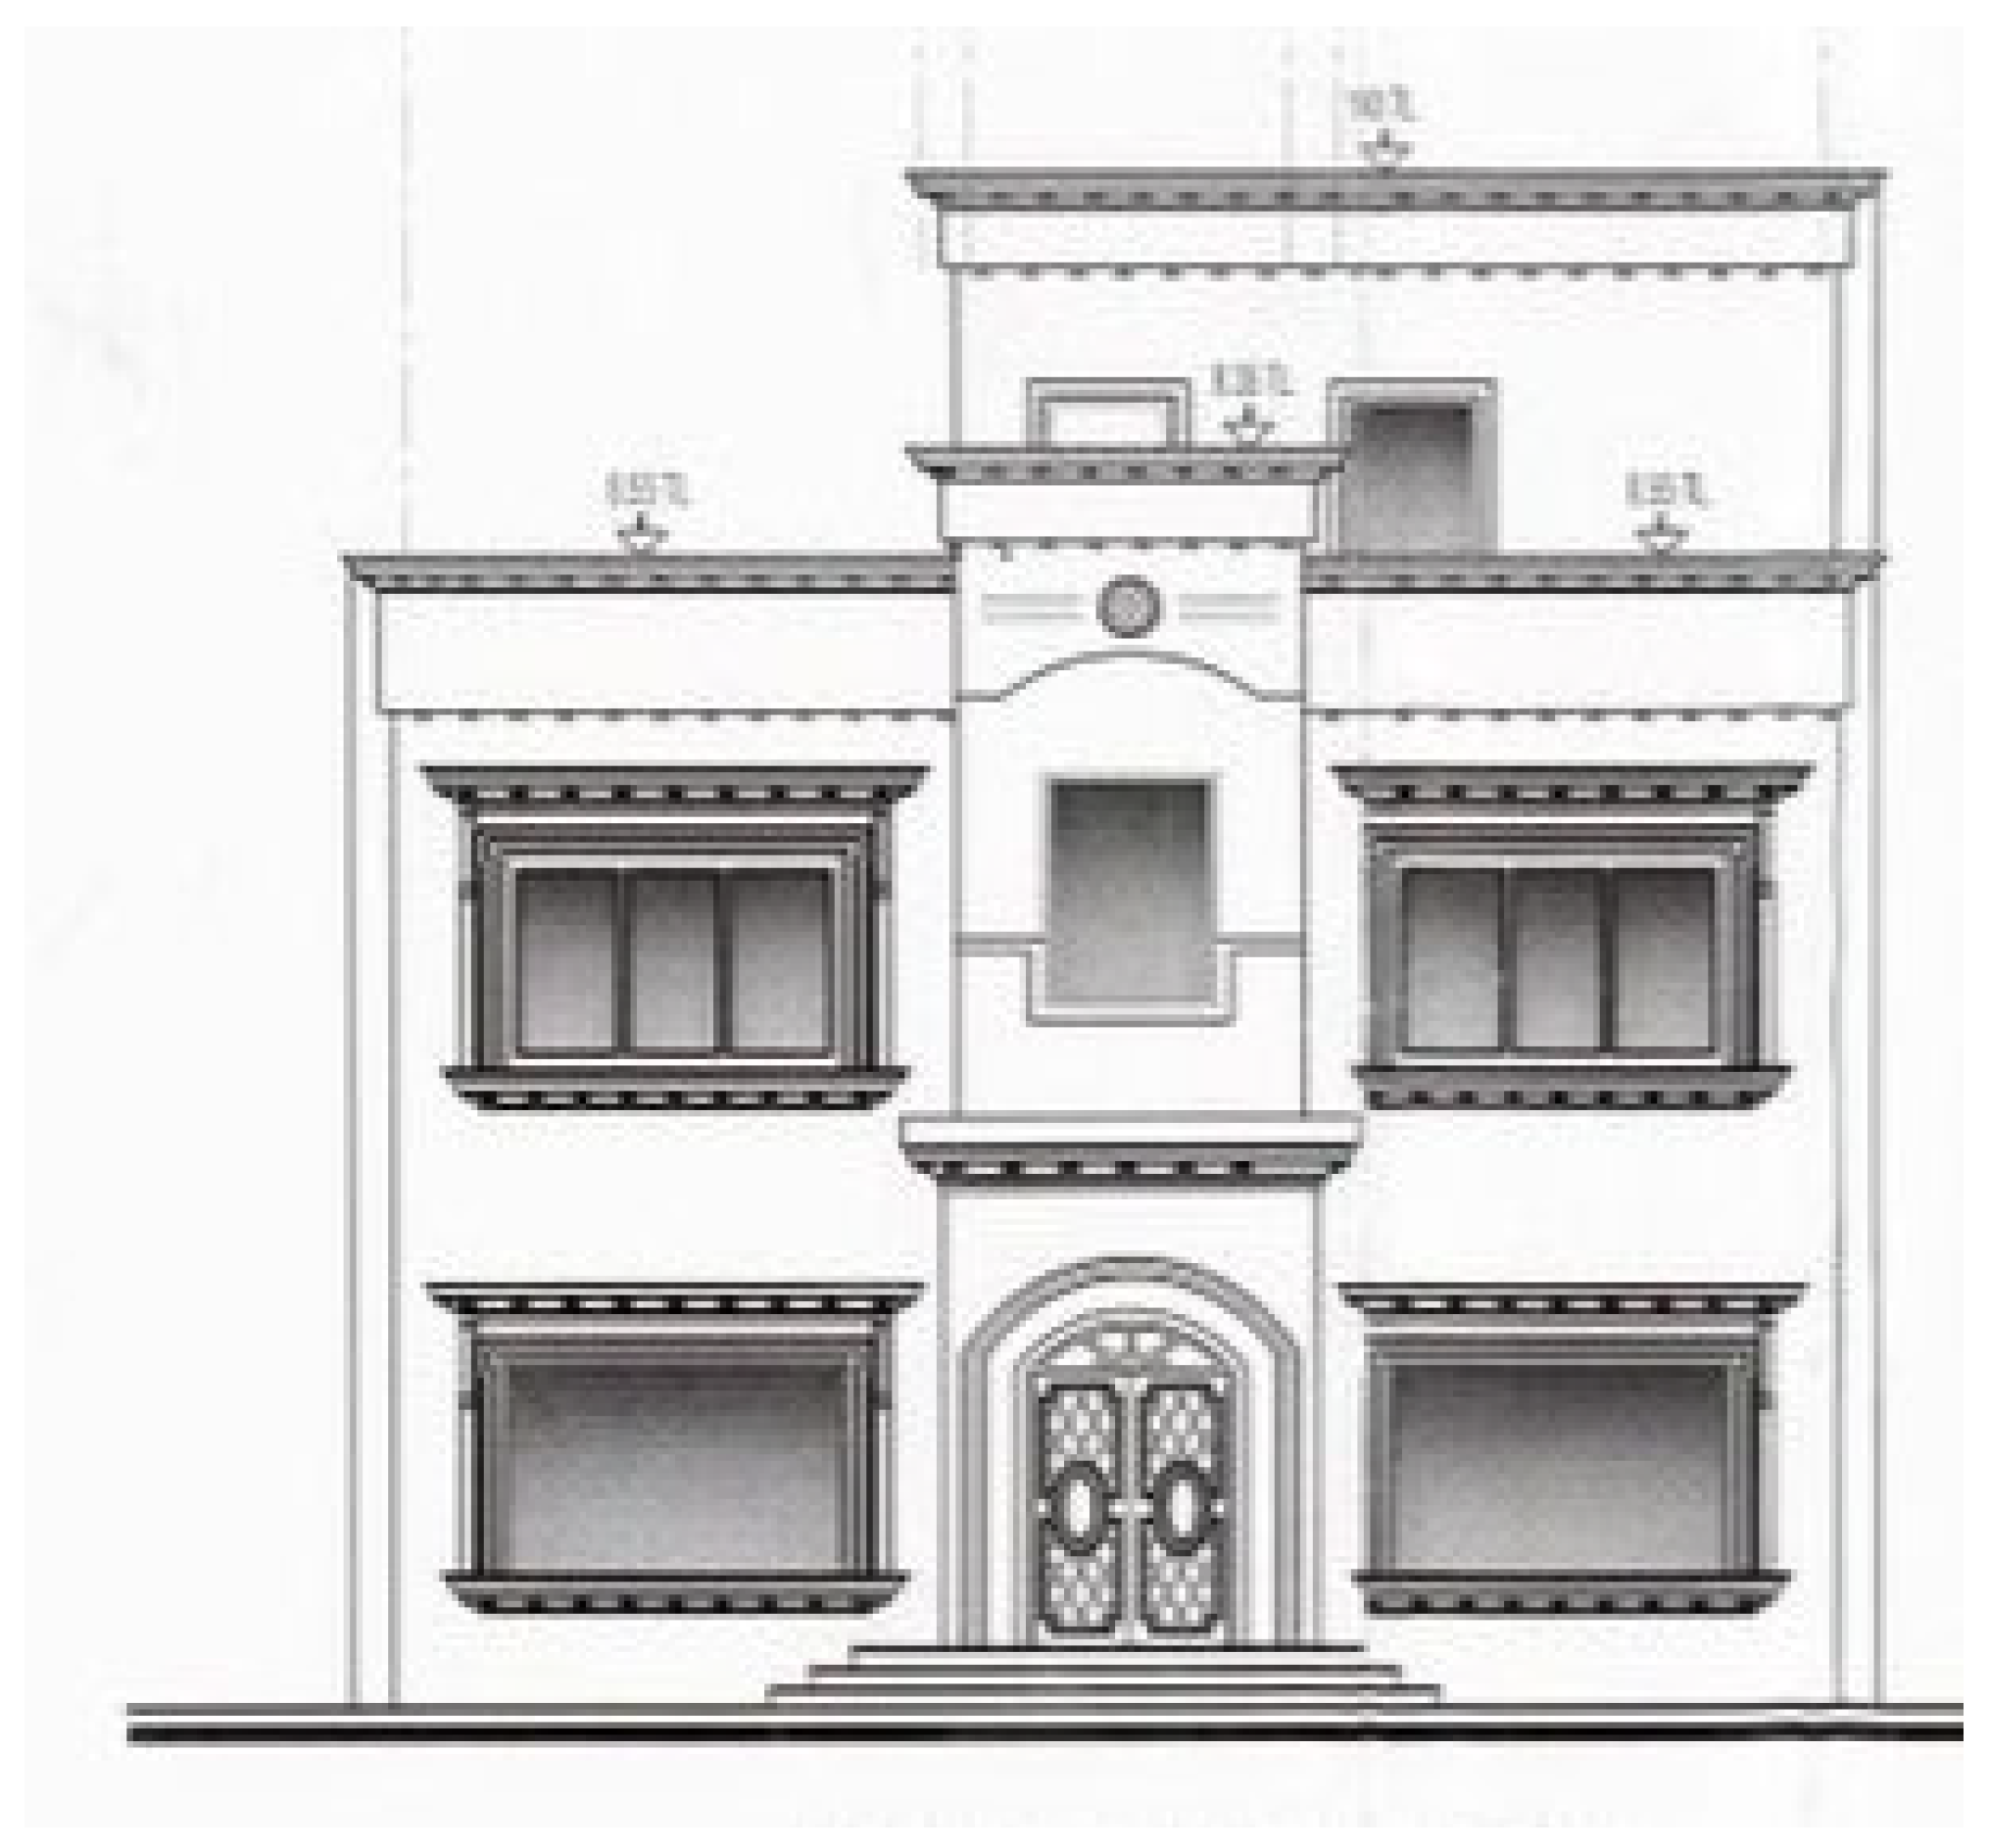
In Qatar, there are different types of residential buildings such as villas, Arabic houses, apartments, and other types of buildings. As of 2015, Table 1 presents the numbers of housing units in Qatar by the type and municipality. The villas make up the highest proportion (33.7%) of the building units in Qatar [49] which translates to 105,976 units. For this study, a typical two-story residential villa for a family seven persons is selected. The villa has a total floor area of 332.77 m2 distributed over five bedrooms, three bathrooms, two sitting areas, and other spaces. The architectural drawing of the front view of the selected villa is shown in Figure 4.
Based on the architectural drawing, the selected villa is modelled in DesignBuilder based on architectural drawings and data on typical residential building construction in Qatar (Figure 5). Envelope components like walls, roof, fenestration, etc., are defined based on typical assemblies and materials identified from literature [50,51,52,53,54,55,56] and listed in Table 2. Cooling and ventilation is provided by a centralized HVAC system with parameters set based on Code for Energy Conservation in Residential Buildings in Qatar [57]. Internal gains from occupancy, lighting and other plug loads are specified per guidance in the Qatar Construction Specifications [58]. After developing the detailed building energy model in DesignBuilder, an hourly ASHRAE weather file for the year 2002 in Qatar was selected to model the energy demand for the baseline year 2002. This provides the annual and monthly cooling, heating, lighting, equipment, and other load contributions to total electricity consumption. The annual simulation results provide hourly data on cooling, heating, lighting, equipment, fans, pumps, and other loads that sum to total electricity consumption. The software facilitated the creation of building geometry, definition of building types, and characterization of building activities. The resulting model is calibrated to match the reference benchmarks for residential building energy use in Qatar. The energy demand obtained from DesignBuilder served as input for further analysis.

2.2. Step 2: Simulations for Base Case Scenario

To evaluate how the villa’s energy performance changes under future climate scenarios, the baseline DesignBuilder model is simulated for additional years—2016, 2050 and 2100. This is accomplished by modifying the 2002 Qatar weather file to reflect projected temperature increases associated with climate change. Specifically, the temperature data in the 2002 file is adjusted by +0.3 °C per decade, consistent with climate projections for Qatar. Running simulations using the climate-adjusted weather files provides insights into how increasing outdoor air temperatures will impact the villa’s cooling loads and energy performance. The progressive rise in cooling degree days as the century progresses is quantified. At the same time, solar insolation, humidity, wind, and other weather variables are kept constant at 2002 levels, isolating the impact of rising temperatures. Additionally, the projected future weather files only adjust temperatures incrementally and do not account for potential increases in humidity, cloud cover, or precipitation that could occur with climate change. Enhancing the weather file projections to reflect broader climate impacts could improve the analysis. This approach of incrementally adjusting the historical weather file based on warming projections provides a straightforward method to assess potential impacts of climate change. However, some limitations exist. The adjusted future weather files continue to use 2002 solar radiation and humidity profiles, while climate change may alter these variables. Additionally, the incremental temperature adjustments do not reflect potential extremes or year-to-year variability. Future work could incorporate climate model projection data to capture a fuller range of warming impacts. Nonetheless, the projections used here provide a reasonable basis to evaluate first-order impacts of increasing cooling demands on residential energy use and the effectiveness of rooftop PV integration.

2.3. Step 3: Rooftop PV System Optimization

To determine the optimal rooftop PV system design for the villa, a hybrid system optimization study is set up in HOMER Pro [59]. The annual electric load profile from DesignBuilder simulations is input as the primary load. Grid purchases and PV generation can meet this load. The software takes into account various factors such as energy demand, available resources, system components, and cost considerations. HOMER Pro evaluates millions of potential system configurations consisting of: grid purchases from utility, rooftop solar PV capacity, PV module tilt and orientation, PV inverter sizing and battery storage (optional). For each system architecture, HOMER Pro simulates hourly dispatch and cash flows over a 25 year timeframe.
The solar PV array was modelled using a 370 W monocrystalline silicon panel with 19.1% efficiency consistent with products available in the Qatar market. Storage batteries were simulated using a generic 1 kWh lithium-ion model with performance parameters aligned with commercial products. The required electricity tariffs for the residential sector is provided by Kahramaa (Qatar General Electricity and Water Corporation, Doha, Qatar) [60]. The following tariffs are incorporated to HOMER Grid: $0.03/kWh, $0.04/kWh, $0.05/kWh, and $0.07/kWh for monthly consumption slabs of 2000 kWh, 4000 kWh, 15,000 kWh and over 15,000 kWh, respectively. The optimization did not consider incentive-based or net metering programs, as these are not currently available for residential PV customers in Qatar.
An optimization algorithm identifies the system configuration with the lowest total net present cost (NPC) that meets the electric load. NPC factors in upfront capital costs, component replacements, maintenance, grid purchases, and solar production incentives. Sensitivity analyses are performed around PV panel capital cost, grid electricity price, and other parameters. This enables quantifying how the optimal system sizing and economics change under different scenarios. The HOMER Pro optimization provides the cost-optimal rooftop PV system design for the villa under 2002 weather conditions. To evaluate climate impacts, the same optimization process is repeated using the building load profiles simulated for years 2016, 2050 and 2100. Comparing the optimized systems for each year reveals how warming affects optimal PV sizing and financial viability.

2.4. Step 4: Analysis of Different Scenarios

A core objective of the research is to analyse how increasing cooling demands due to rising temperatures will impact the effectiveness of rooftop PV integration. This is accomplished by: (a) simulating the villa’s energy use for years 2002, 2016, 2050 and 2100 reflecting climate change projections for Qatar (b) optimizing the rooftop PV system design for each year’s electric load profile, and (c) evaluating the performance of the optimized PV system for each year, including: solar energy contribution, cost savings, financial metrics (NPV, IRR, payback) and GHG emission reductions.
The comparative assessment across years is structured to answer key questions related to the continued effectiveness of distributed solar PV under escalating cooling demands:
How will increases in the villa’s annual cooling load from climate change impact the self-consumption ability of the rooftop PV system?
Will solar energy contribution remain stable or decline as cooling loads rise faster than PV output?
How will financial returns and the payback period change considering higher air conditioning electricity consumption?
Can rooftop PV sizes based on current code recommendations meet substantially greater future demands?
Will residential solar PV remain a cost-effective emissions reduction strategy for households given climate change?

3. Results and Discussions

3.1. Energy Demand Modeling Outcomes

The results of the annual and monthly energy demand simulations performed in DesignBuilder for the years 2002 and 2016 are presented in Figure 6a,b, respectively. The outcomes demonstrate that the energy consumption attributed to lighting, appliances, and other non-cooling loads remains relatively constant throughout the year. However, the energy demand arising from cooling loads fluctuates significantly across months, reaching a maximum of 4188 kWh in August. This aligns with expectations and verifies that space cooling represents the primary driver of residential building energy demand in Qatar’s hot and humid conditions. The cooling load comprises a major share of total electricity use, ranging from a minimum of ~2% in January to a maximum of ~63% in August. Overall, cooling accounts for ~45% of the villa’s total annual energy consumption. These results are consistent with literature characterizing the overwhelming impact of air conditioning on household energy use in Qatar and the Persian Gulf region. Studies have found cooling representing 60–75% of peak demand during the summer months [61,62,63,64,65,66,67]. The considerable growth in building stock, rising ownership of air conditioning systems, and increasing use of mechanical cooling are key factors behind the surging residential cooling load.
The simulated energy consumption patterns for 2016 follow similar monthly trends observed in 2002, with cooling electricity peaking in August. However, total cooling demand is higher, with increases of ~6% in summer months (May–August) and more substantial average rises of ~56% in winter months (December–March) compared to the 2002 baseline. The more pronounced winter demand escalation implies climate change could disproportionately impact cooler periods in Qatar and the wider Persian Gulf region. Whereas summers have always driven peak air conditioning loads, the modelling indicates winters could also see dramatic intensification of cooling usage as minimal temperature thresholds for operating AC systems are crossed more frequently with climate change [68]. The close alignment between simulated and measured electricity use for 2016, as illustrated in Figure 6b, verifies the validity of the DesignBuilder modelling approach.

3.2. Climate Change Impacts on Energy Demand

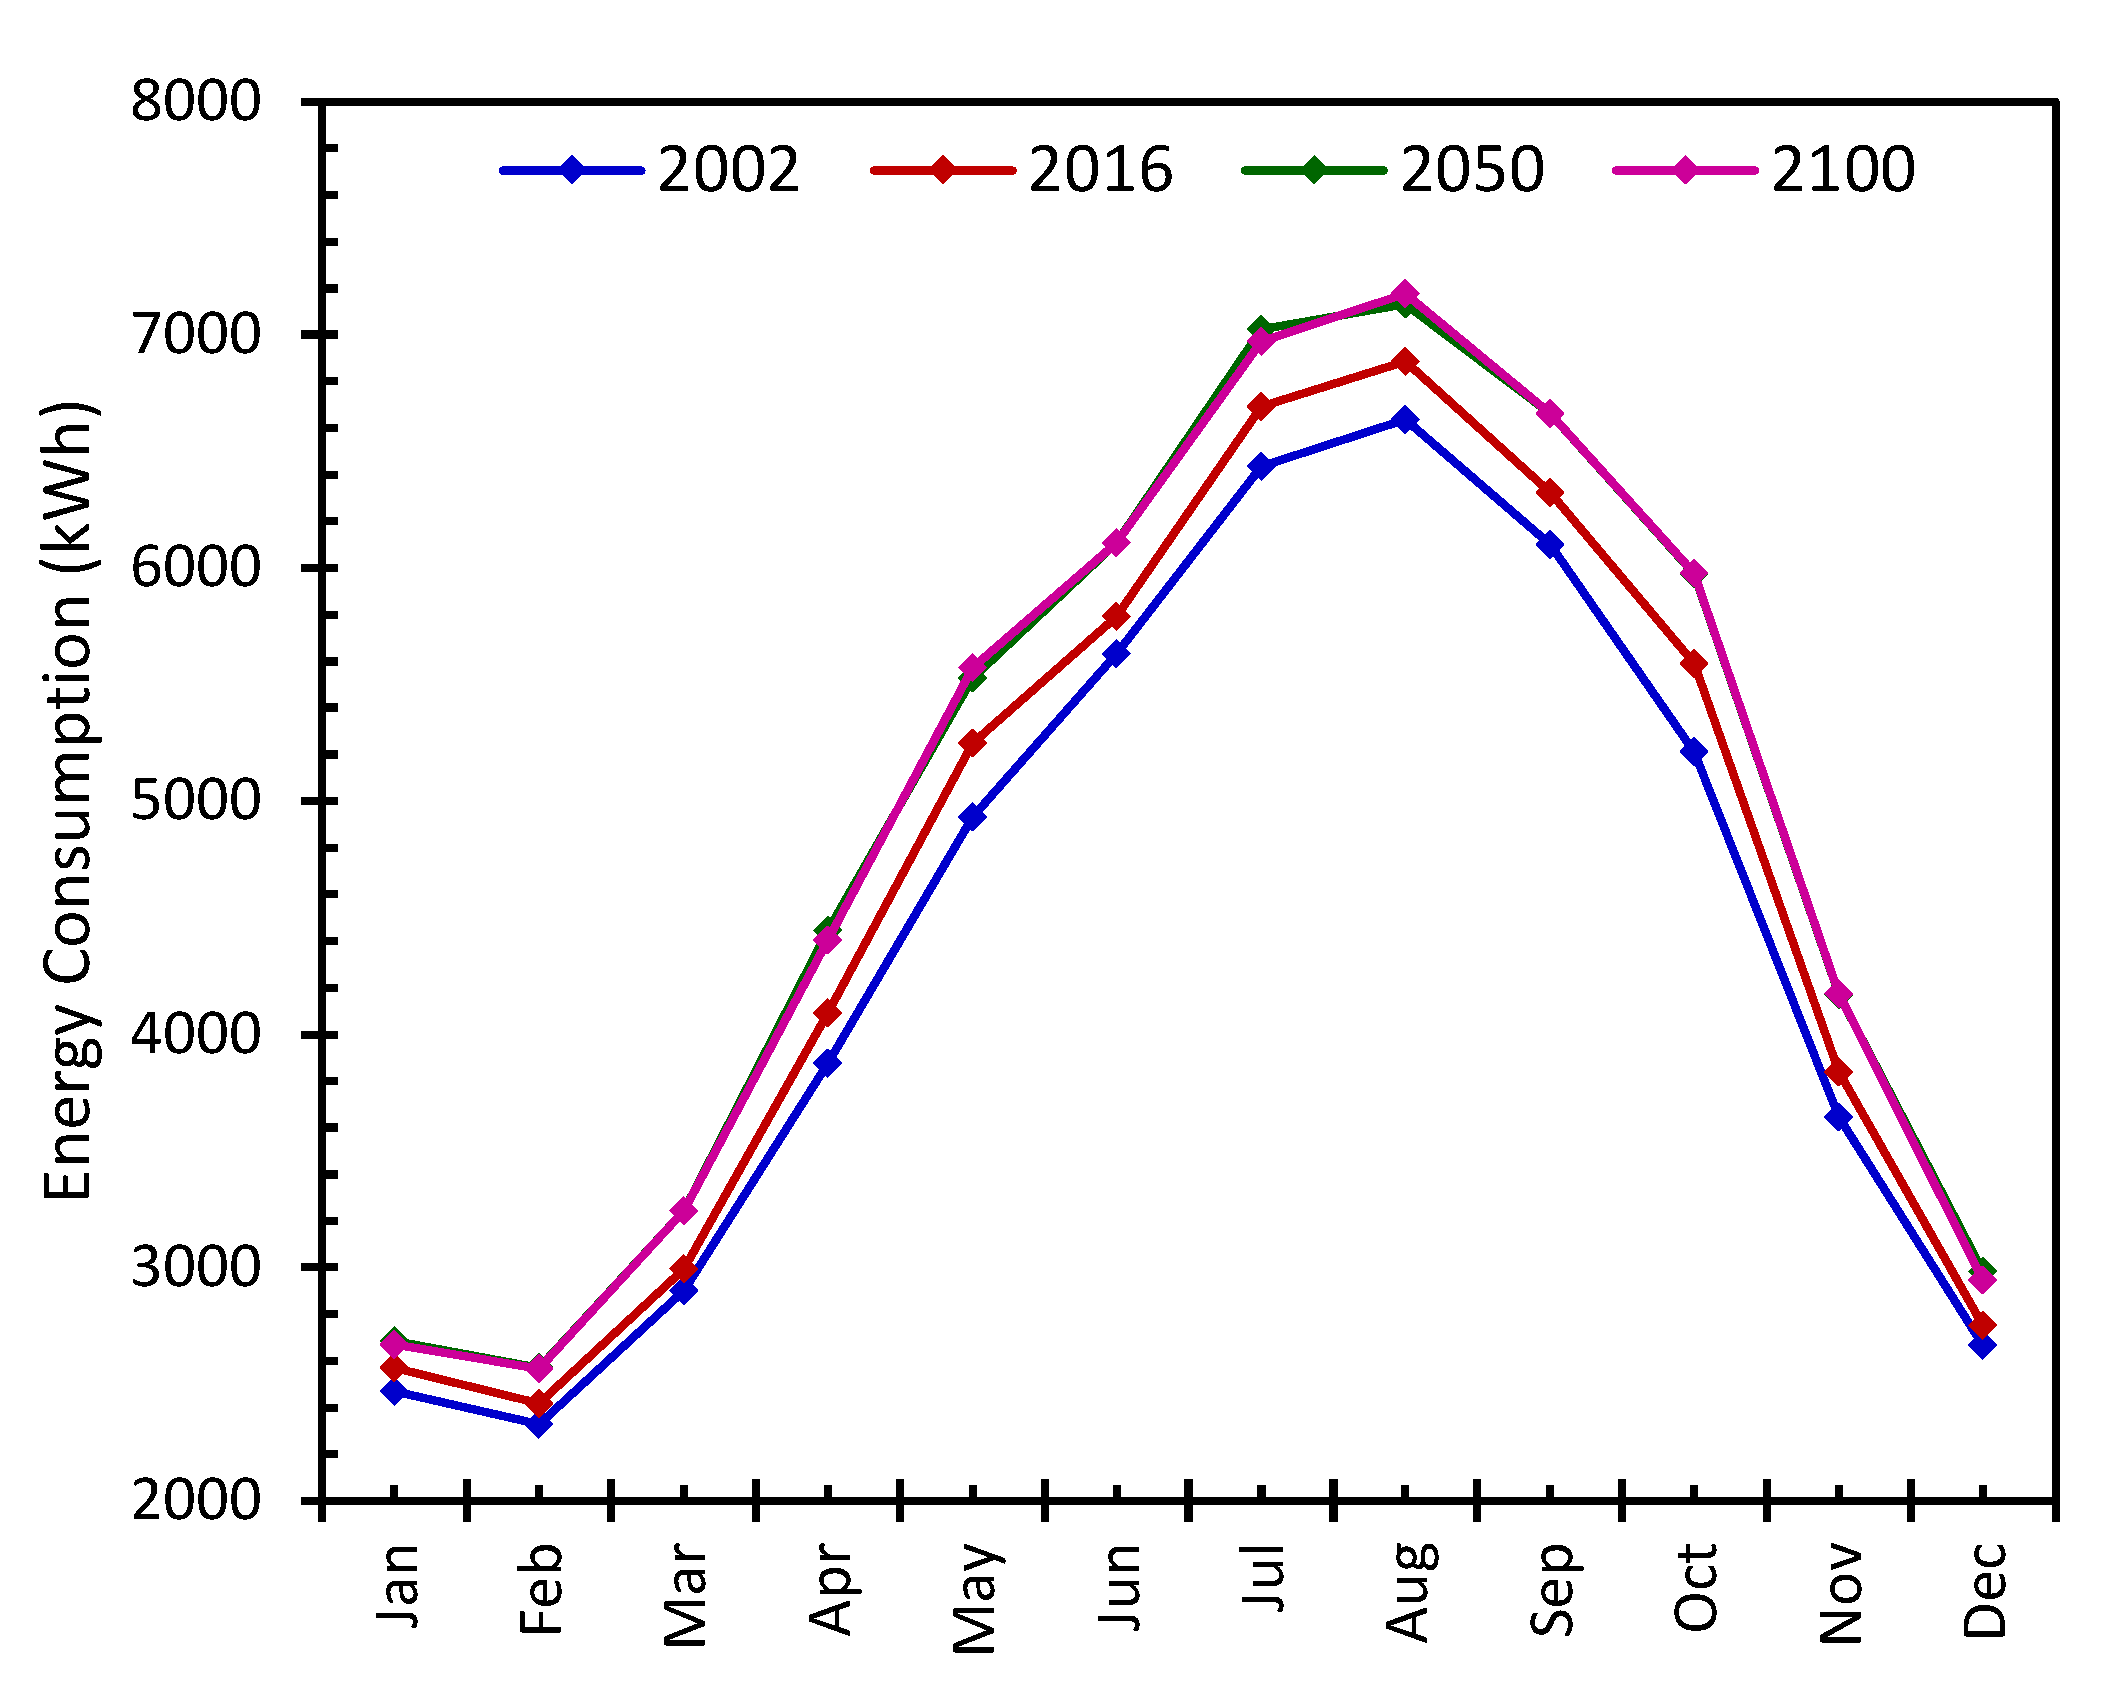
The simulated annual energy consumption for years 2002, 2016, 2050, and 2100 are compared in Figure 7 to assess climate change impacts. The results illustrate increasing energy demands over time, with significantly higher consumption occurring during summer months as cooling loads intensify under warmer conditions. By 2100, the annual electricity usage rises to 114,000 kWh, approximately 22% above the 2002 baseline. The maximum monthly peaks escalate from around 9500 kWh in 2002 to over 12,000 kWh in 2100, a 26% increase. These projections align with literature estimating 15–25% rises in Persian Gulf region building cooling demands by 2100 resulting from climate change [52,69,70]. The considerable intensification of summer peaks highlights the vulnerability of Qatar’s residential sector to rising temperatures.
The energy use profiles maintain a consistent bell-shaped curve through the years, with minimal change beyond the increased cooling-driven summer loads. This shape persists because only incremental temperature adjustments are applied to future weather files, while keeping solar radiation, humidity, wind, and other variables unchanged at 2002 levels. Also, variations in occupancy, appliances, behaviour, and other parameters are not incorporated. This approach isolates the impact of warming on energy performance, but does not capture potential climate change effects on solar resources and humidity or year-to-year demand fluctuations. The modelling could be enhanced by applying stochastic and morphing techniques to generate future weather files inclusive of broader climate change effects [71,72,73]. Nonetheless, the incremental temperature adjustments provide valuable initial insights into potential warming impacts on residential building energy use in Qatar and similar climates. The considerable escalation in cooling-driven summer peak loads quantified by the simulations underline the risks of rising energy consumption and emissions if mitigation measures are not implemented proactively. With cooling already representing the majority of household electricity use in Qatar, these findings underline the urgent need to integrate mitigation measures (e.g., energy efficiency, renewables, and other solutions) into building design and energy policy. Passive strategies like building insulation, shading, and envelope improvements can limit future cooling requirements in the residential sector [74,75,76,77].

3.3. Rooftop PV System Optimization

HOMER Pro optimization determines the cost-optimal rooftop PV system architecture for the villa under each modelled year’s electric load profile. A comparison of the optimized configurations is presented in Table 3.
The findings highlight that for all years, a grid-connected system without battery storage consistently emerges as the least cost-optimum for all years. This reflects the significant capital costs of batteries, which increase net present costs despite offering backup capabilities. The optimal PV array capacity scales up moderately over time, from 7.4 kW in 2002 to 8.2 kW in 2100. This 23% increase compensates for growing cooling demands resulting from climate change. The additional capacity helps maintain solar energy penetration rates. However, the renewable fraction declines slightly over time, from 18% in 2002 to 16% in 2100. Thus, while PV capacity scales up moderately, the solar energy contribution declines slightly relative to the total load. This indicates efficiency reductions associated with higher temperatures diminishing PV output as climate change progresses [32,33,34,35,36]. Qatar’s peak summertime temperatures exceeding 50 °C can degrade PV yields over 15% compared to standard test conditions. Overall, the techno-economic optimization verifies rooftop solar PV as a cost-effective measure for Qatar’s residential buildings, even with rising cooling load. The grid-connected system minimizes households’ life cycle costs, while reducing emissions intensity compared to grid-only electricity. Climate change does gradually erode solar performance and self-sufficiency potential. But the PV adoption remains financially viable with simple payback periods below 8 years for all cases.
Overall, the HOMER Pro simulations verify rooftop solar PV as a cost-effective building integration strategy even as cooling demands rise. The grid-connected architecture minimizes NPC for homeowners across all scenarios. The use of projected future weather data provides representative insights compared to optimizing systems based only on current climate conditions. However, the analysis could be enhanced by incorporating time series projections of solar radiation and humidity from climate models, in addition to temperature effects. Nonetheless, the modelling approach provides reasonable first-order estimates of climate change consequences on residential PV performance and sizing.

3.4. Performance of Optimal Rooftop PV System

Detailed performance modelling of the optimized PV systems provides further insights into residential solar integration. As shown in Table 2, the 7.4 kW rooftop array generates 5500 kWh/year, meeting 18% of the villa’s total electricity demand. The PV adoption provides substantial economic benefits. The initial $9300 capital investment achieves $460 annual bill savings, reflecting a 7.8 years simple payback. This rapid payback period provides a compelling financial incentive for homeowners. The 10% rate of return further highlights rooftop solar as a strong investment. Over the 25 year lifetime, the system yields $13,700 in net savings for the household, accounting for upfront costs. Based on a 2022 survey, payback concerns represent a major adoption barrier among Qatar residents [28]. The modeled returns provide tangible evidence of PV systems’ profitability. If supplemented with financing options like solar leasing and on-bill repayment programs, the value proposition for households would strengthen further [78,79,80,81].
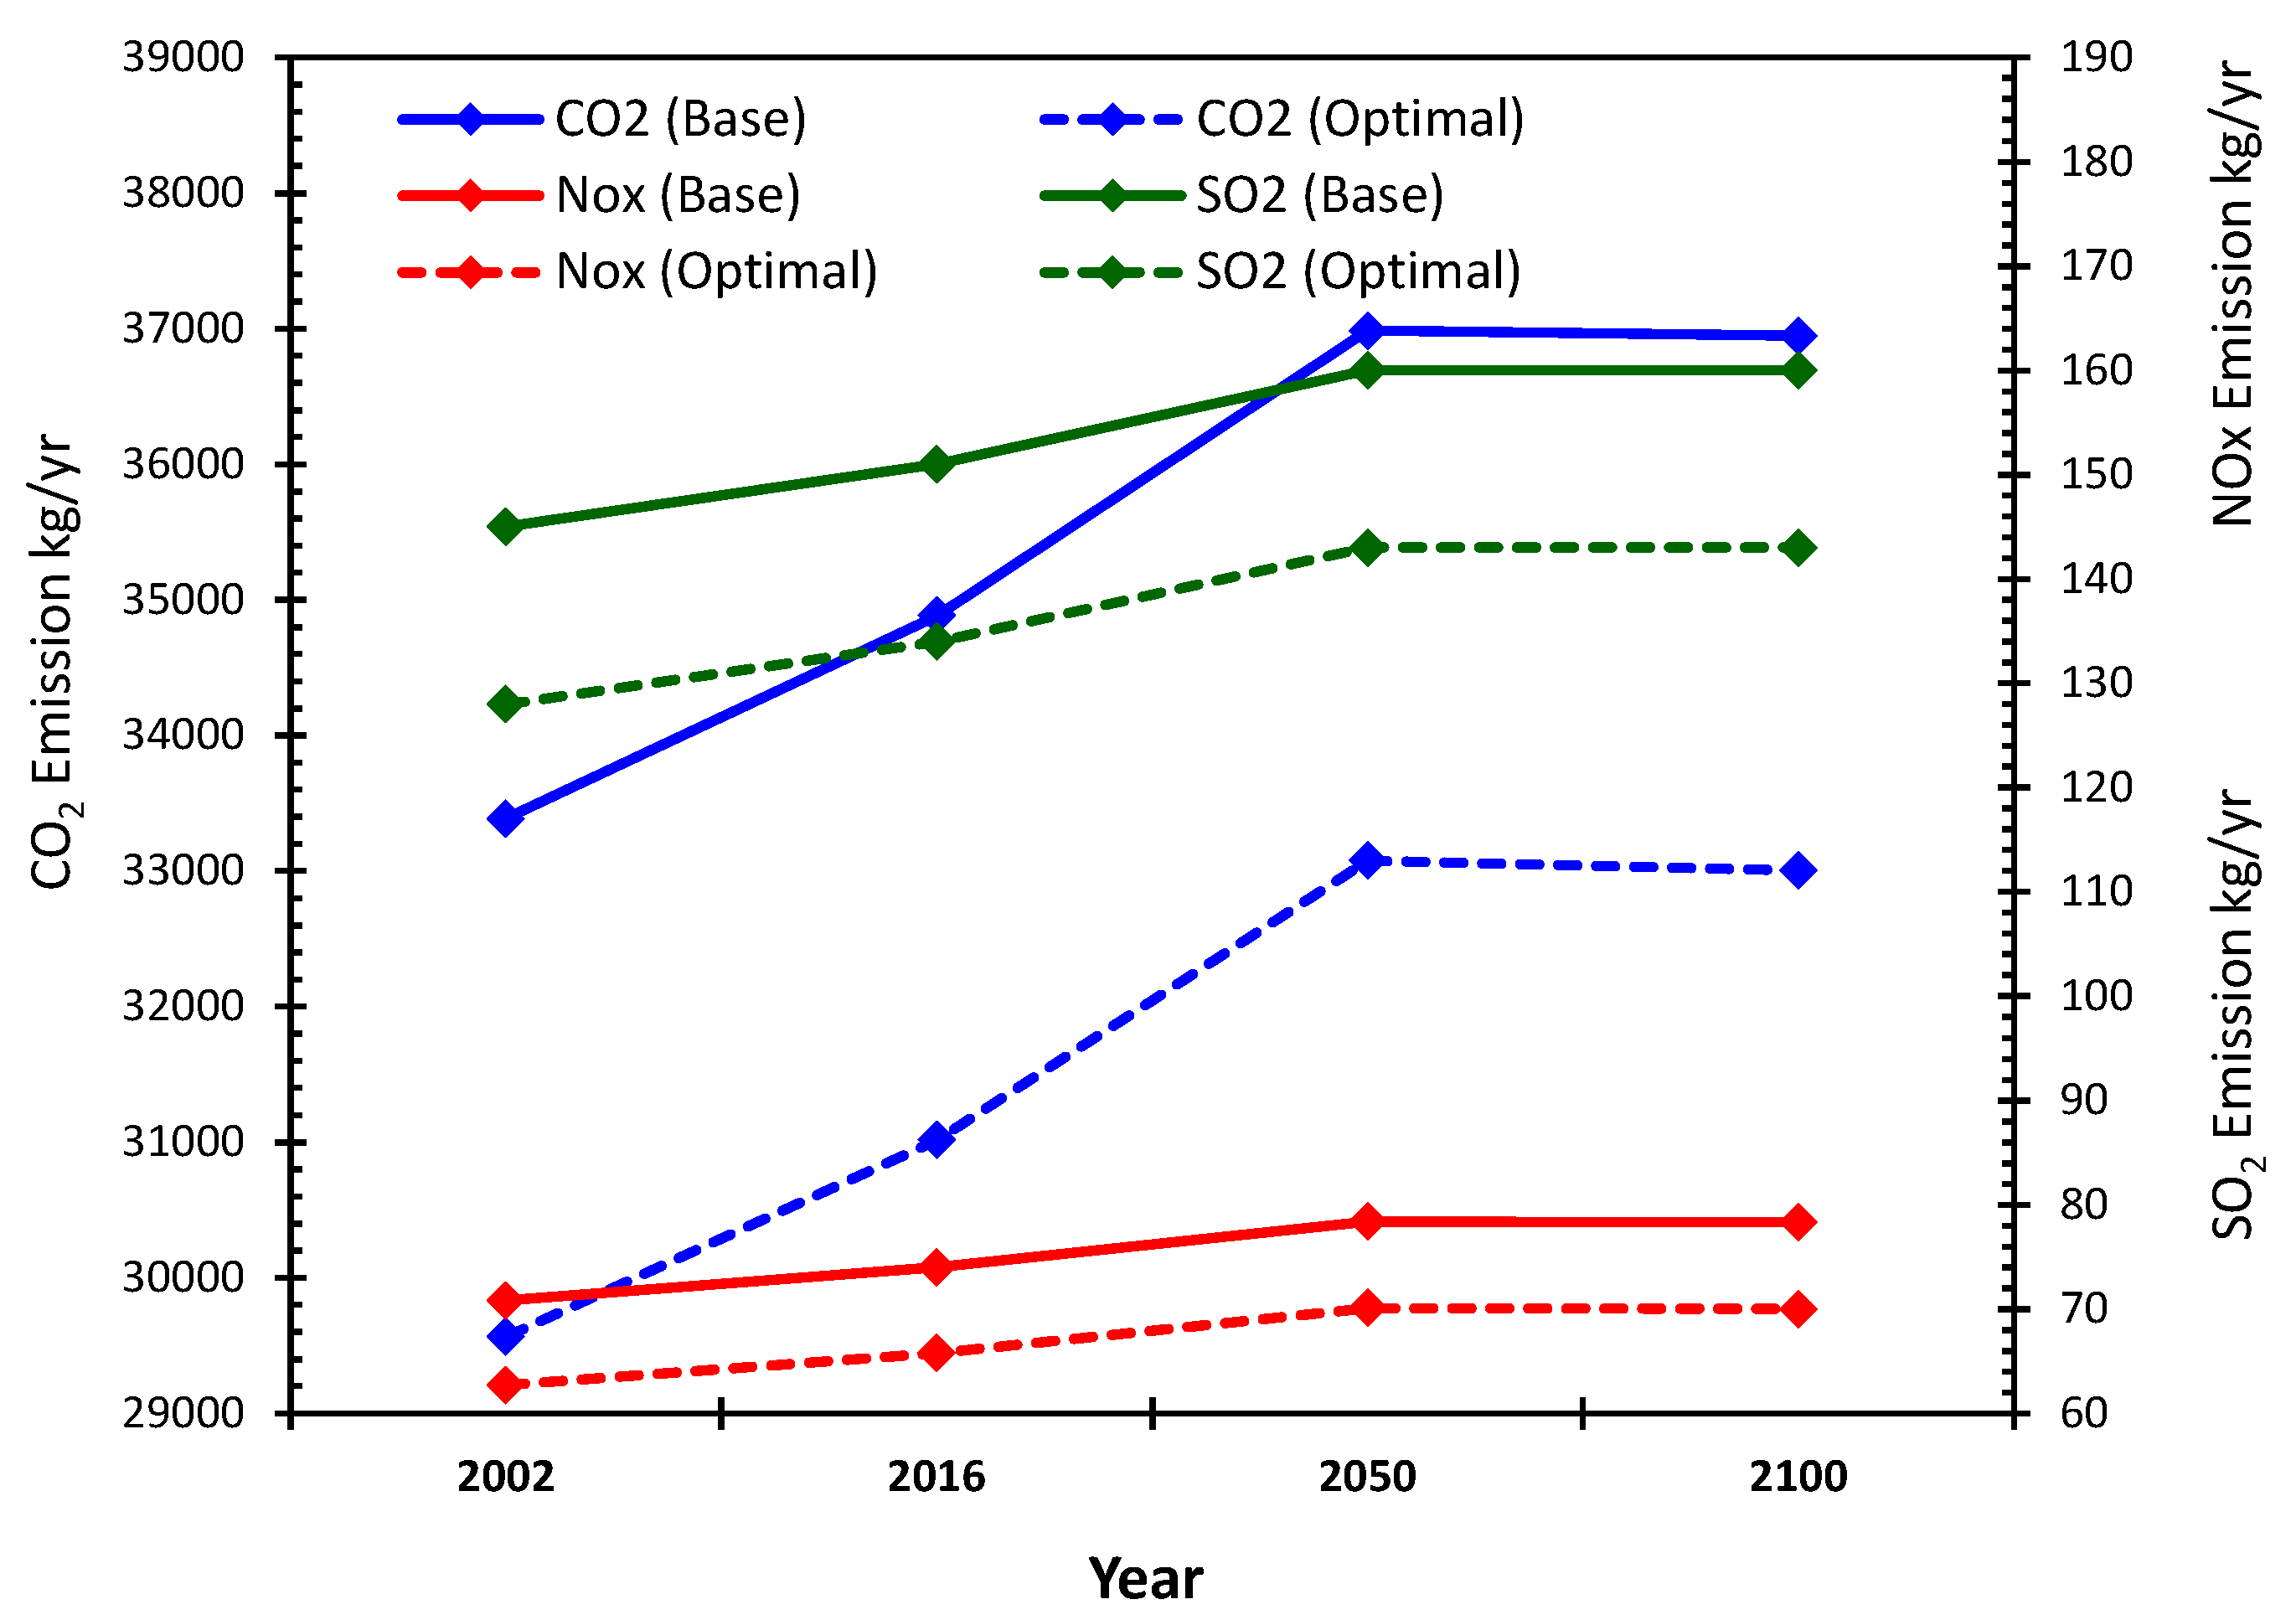
Additionally, the 7.4 kW system decreases annual carbon emissions by 3.8 tonnes CO2 (Figure 8). This 11.5% reduction has meaningful sustainability impacts, considering residential buildings account for over half of Qatar’s energy sector emissions. Extrapolating these savings across Qatar’s approximately 100,000 villas indicates rooftop PV could mitigate 380,000 tonnes CO2/year, delivering substantial progress towards national climate targets. However, the analysis uses a generic emissions factor for grid electricity. Applying a dynamic marginal emissions approach would enhance accuracy [82].

3.5. Climate Change Implications for PV Performance

While the techno-economic optimization verifies rooftop PV effectiveness under the 2002 baseline climate, further analysis is essential to determine how system performance evolves as temperatures rise over the 21st century. Qatar’s average ambient conditions already exceed standard PV test conditions for panel yield ratings. Therefore, the higher temperatures projected with climate change could have a considerable impact on solar generation and the viability of residential PV integration. However, the renewable energy penetration declines slightly from 18% to 16%, as the warmer conditions degrade solar panel productivity. The reduction arises both from electrical efficiency losses at higher temperatures and from the escalating cooling demand outstripping solar generation. As air conditioning loads grow faster than rooftop PV output, more grid purchases are needed to meet the additional demand. This reduction arises because the electrical output and conversion efficiency of crystalline silicon modules decrease as operating temperature increases [83,84].
Qatar’s ambient temperatures regularly exceed the 25 °C standard test condition. At the projected 3.5 °C average temperature rise by 2100, the hotter climate could degrade panel yields over 15% compared to nameplate power ratings, undermining gains from capacity expansion [85]. This substantial impact results from the temperature coefficient for silicon modules being in the range of −0.3 to −0.5% power loss per 1 °C increase above 25 °C [86,87]. While panel yields decline, the modelled self-consumption fractions achieved remain suitable for a grid-connected residential system. The analysis indicates that proper PV sizing methodologies accounting for local climate can maintain reasonable renewable penetration levels. Furthermore, rising electricity tariffs resulting from Qatar’s population and economic growth may outweigh PV efficiency reductions [88,89]. Nonetheless, the potential generation shortfalls underscore the need to use localized temperature-dependent yield models when planning residential solar installations. Moreover, the declining renewable fractions indicate PV installations sized based on current building codes and practices may become overscaled or underperform as climate change intensifies. This could require residential solar policies and programs to evolve the system sizing methodologies and incentives structures accordingly. The analysis provides an effective framework to evaluate these future adjustments needed to maintain the viability of distributed PV adoption aligned with Qatar’s emissions reduction trajectories. Broader implications for the decarbonization of the Persian Gulf region building sectors also emerge. As warmer conditions undermine passive measures like building envelope improvements, the analysis reiterates the urgency of expanding distributed solar generation. Integrating projected climate scenarios into energy planning can guard against overestimating future renewable contributions. Additionally, the results highlight the value of emphasizing energy conservation and load reduction to complement supply-side solutions. Overall, evaluating residential solar PV performance under incremental climate change effects provides critical insights into the complex interdependencies between ambient conditions, energy consumption, and building-integrated photovoltaics. The adoption of projected weather file modelling enables evidence-based assessment of the ongoing viability and appropriate evolution of incentives needed for distributed PV to substantially contribute to Qatar’s emission reduction commitments.

4. Conclusions

Qatar is one of the highest per capita energy consumers globally, with the residential sector accounting for 60% of total final energy use. Rising temperatures from climate change pose a major risk, as cooling demands already dominate household electricity consumption. This study uniquely applies an integrated modelling approach combining building energy simulation, PV system optimisation, and future climate projections to evaluate distributed solar PV effectiveness considering rising temperatures. The techno-economic assessment of rooftop PV for a residential villa across multiple future climate scenarios provides pioneering empirical evidence that distributed PV remains a cost-effective option amidst escalating cooling demands.
The analysis focused on a typical single family villa modelled in DesignBuilder and simulated under varied climate scenarios. The results quantified substantial escalation in the villa’s cooling-driven electricity consumption over time, with annual demand growing 22% and summer peaks increasing 26% by 2100 compared to 2002 levels under a business-as-usual warming trajectory. This escalation affirms the critical importance of proactively integrating renewable energy and efficiency measures into building design and policies to mitigate rising consumption and emissions. However, the high temperatures in Qatar may accelerate PV degradation and shorten useful life to less than 25 years. So, panel replacements may be needed over the 2002–2100 period analysed in the study. Further analysis of climate impacts on PV durability would enhance system lifetime projections.
The techno-economic optimization verified rooftop solar PV as a cost-effective building integration strategy even as cooling demands rise with climate change. A grid-connected rooftop system without storage emerged as optimal in all years modelled. The PV capacity scaled up moderately from 7.4 kW to 8.2 kW between 2002 and 2100 to compensate for growing air conditioning loads. However, the contribution of solar energy declined slightly from 18% to 16% of the household’s total electricity, indicating warming-induced efficiency losses degrading PV productivity. Nonetheless, the modelled system still achieved a 7.9 years simple payback and 10% rate of return on investment in 2100. Annual bill savings exceeded $400, providing a compelling financial incentive. Thus, the analysis substantiates distributed solar PV as an enduringly viable emissions and cost reduction strategy for Qatar’s households under both current and future climate conditions.
However, maintaining the effectiveness of rooftop PV expansion aligned with national climate targets requires evolving system design methodologies to account for climate change impacts. The results showed PV arrays sized based on current best practices may become oversized or underperform as rising ambient temperatures curb productivity. Solar yield models must better account for losses at local peak temperatures exceeding 50 °C. Adjustments to PV capacity guidelines, building integration rules, and financial incentive programs will likely be needed to prevent overestimating renewable contributions. Integrating projected climate scenarios into energy planning is essential to avoid these pitfalls and realize Qatar’s full distributed solar potential.
The adoption of projected weather file modelling provides a valuable framework to evaluate climate resilience. However, future work could enhance the approach by incorporating time series projections of solar radiation, humidity, and extremes from climate models, in addition to temperature effects. Adding battery storage optimization would also provide insights into grid independence potential under high renewable penetrations. Nonetheless, the novel methodology and evidence-based conclusions significantly advance understanding of distributed PV systems’ effectiveness under escalating warming.
This analysis provides actionable evidence to spur PV policies and incentivize residential adoption in Qatar’s evolving climate. With buildings representing over half of national emissions, distributed solar has immense potential to mitigate greenhouse gas production if deployment barriers can be overcome. The results help quantify PV’s enduring techno-economic viability and environmental benefits. This empirical case for pro-solar policies can hopefully accelerate adoption. With appropriate design evolution, deputization measures, and supporting demand reductions, the proliferation of rooftop PV systems can meaningfully contribute to Qatar’s sustainable development and climate change mitigation objectives.

Author Contributions

Conceptualization, S.G.A.-G.; Methodology, D.I.A.H. and S.G.A.-G.; Software, D.I.A.H.; Formal analysis, M.I.K., D.I.A.H., F.A. and S.G.A.-G.; writing—original draft, M.I.K.; writing—review and editing, F.A. and S.G.A.-G.; Visualization, M.I.K.; Supervision, S.G.A.-G. and M.I.K.; Proof-reading, F.A. All authors have read and agreed to the published version of the manuscript.

Funding

This research received no external funding.

Institutional Review Board Statement

Not applicable.

Informed Consent Statement

Not applicable.

Data Availability Statement

The data collected for the project can be available on request.

Conflicts of Interest

The authors declare no conflict of interest.

References

  1. Seo, S.; Zelezna, J.; Hajek, P.; Birgisdottir, H.; Rasmussen, F.N.; Passer, A.; Luetzkendorf, T.; Balouktsi, M.; Yokoyama, K.; Chae, C.-U. Evaluation of Embodied Energy and CO2eq for Building Construction (Annex 57): [Summary Report of Annex 57]; Institute for Building Environment and Energy Conservation: Tokyo, Japan, 2016. [Google Scholar]
  2. International Energy Agency. Buildings: A Source of Enormous Untapped Efficiency Potential; International Energy Agency: Paris, France, 2021.
  3. World Green Building Council. Bringing Embodied Carbon Upfront. Available online: https://worldgbc.org/article/bringing-embodied-carbon-upfront/ (accessed on 16 January 2023).
  4. Global Alliance for Buildings and Construction. Global Status Report for Buildings and Construction; Global Alliance for Buildings and Construction: Paris, France, 2020. [Google Scholar]
  5. Tricoire, J.-P. Why Buildings Are the Foundation of an Energy-Efficient Future; World Economic Forum: Cologny, Switzerland, 2021. [Google Scholar]
  6. In Focus: Energy Efficiency in Buildings. Available online: https://commission.europa.eu/news/focus-energy-efficiency-buildings-2020-02-17_en (accessed on 9 January 2023).
  7. Dean, B.; Dulac, J.; Petrichenko, K.; Graham, P. Global Status Report 2016: Towards Zero-Emission Efficient and Resilient Buildings; United Nations Framework Convention on Climate Change (UNFCCC): New York, NY, USA, 2016. [Google Scholar]
  8. Bienert, S.; Wein, J.; Spanner, M.; Kuhlwein, H.; Huber, V.; Künzle, C.; Ulterino, M.; Carlin, D.; Arshad, M. Managing Transition Risk in Real Estate: Aligning to the Paris Climate Accord. Wörgl, Austria. 2022. Available online: https://www.unepfi.org/wordpress/wp-content/uploads/2022/03/Managing-transition-risk-in-real-estate.pdf (accessed on 15 March 2022).
  9. IEA. Buildings—Energy System. Available online: https://www.iea.org/energy-system/buildings (accessed on 23 October 2023).
  10. Denholm, P.; Margolis, R.M. Evaluating the limits of solar photovoltaics (PV) in traditional electric power systems. Energy Policy 2007, 35, 2852–2861. [Google Scholar] [CrossRef]
  11. Borenstein, S. The private and public economics of renewable electricity generation. J. Econ. Perspect. 2012, 26, 67–92. [Google Scholar] [CrossRef]
  12. Manoj Kumar, N.; Ghosh, A.; Chopra, S.S. Power resilience enhancement of a residential electricity user using photovoltaics and a battery energy storage system under uncertainty conditions. Energies 2020, 13, 4193. [Google Scholar] [CrossRef]
  13. Darghouth, N.R.; Barbose, G.; Wiser, R.H. Customer-economics of residential photovoltaic systems (Part 1): The impact of high renewable energy penetrations on electricity bill savings with net metering. Energy Policy 2014, 67, 290–300. [Google Scholar] [CrossRef]
  14. Luthander, R.; Widén, J.; Nilsson, D.; Palm, J. Photovoltaic self-consumption in buildings: A review. Appl. Energy 2015, 142, 80–94. [Google Scholar] [CrossRef]
  15. Wiginton, L.K.; Nguyen, H.T.; Pearce, J.M. Quantifying rooftop solar photovoltaic potential for regional renewable energy policy. Comput. Environ. Urban Syst. 2010, 34, 345–357. [Google Scholar] [CrossRef]
  16. KAHRAMAA. Annual Statistics Report 2020; Qatar General Electricity & Water Corporation “KAHRAMAA”. 2021. Available online: https://www.km.qa/MediaCenter/Publications/Annual%20Statistics%20Report%202020%20English.pdf (accessed on 17 March 2022).
  17. KAHRAMAA. Annual Statistics Report 2022; Qatar General Electricity & Water Corporation “KAHRAMAA”. 2023. Available online: https://www.km.qa/MediaCenter/Publications/Annual%20Statistics%20Report%202022-English.pdf (accessed on 22 April 2022).
  18. Al-Marri, W.; Al-Habaibeh, A.; Watkins, M. An investigation into domestic energy consumption behaviour and public awareness of renewable energy in Qatar. Sustain. Cities Soc. 2018, 41, 639–646. [Google Scholar] [CrossRef]
  19. Kankana, D.; Howard, N.; Krarti, M. Estimating the Multiple Benefits of Building Energy Efficiency in GCC Countries Using an Energy Productivity Framework–Summary Report; King Abdullah Petroleum Studies and Research Center (KAPSARC): Riyadh, Saudi Arabia, 2019. [Google Scholar]
  20. Alhaj, M.A.E.; Amato, D.A. Implementation of Rooftop Solar in Qatar: Lessons Learnt from SolarCity Business and Finance Models in the US. In Qatar Foundation Annual Research Conference Proceedings; HBKU Press: Ar-Rayyan, Qatar, 2016; p. EEPP2390. [Google Scholar]
  21. Alrawi, O.; Bayram, I.S.; Al-Ghamdi, S.G.; Koc, M. High-resolution household load profiling and evaluation of rooftop PV systems in selected houses in Qatar. Energies 2019, 12, 3876. [Google Scholar] [CrossRef]
  22. PSA. Qatar in Figures: 2022 37th Issue, Planning and Statistics Authority, State of Qatar. Available online: https://www.psa.gov.qa/en/statistics/Statistical%20Releases/General/QIF/Qatar_in_Figures_37_2022_EN.pdf (accessed on 17 March 2022).
  23. IEA. World Energy Balances—Data Product. Available online: https://www.iea.org/data-and-statistics/data-product/world-energy-balances (accessed on 23 October 2023).
  24. Bazilian, M.; Onyeji, I.; Liebreich, M.; MacGill, I.; Chase, J.; Shah, J.; Gielen, D.; Arent, D.; Landfear, D.; Zhengrong, S. Re-considering the economics of photovoltaic power. Renew. Energy 2013, 53, 329–338. [Google Scholar] [CrossRef]
  25. Griffiths, S. A review and assessment of energy policy in the Middle East and North Africa region. Energy Policy 2017, 102, 249–269. [Google Scholar] [CrossRef]
  26. Gillingham, K.; Palmer, K. Bridging the energy efficiency gap: Policy insights from economic theory and empirical evidence. Rev. Environ. Econ. Policy 2014, 1–30. [Google Scholar] [CrossRef]
  27. Mohandes, N.; Sanfilippo, A.; Al Fakhri, M. Modeling residential adoption of solar energy in the Arabian Gulf Region. Renew. Energy 2019, 131, 381–389. [Google Scholar] [CrossRef]
  28. Alrawi, O.F.; Al-Siddiqi, T.; Al-Muhannadi, A.; Al-Siddiqi, A.; Al-Ghamdi, S.G. Determining the influencing factors in the residential rooftop solar photovoltaic systems adoption: Evidence from a survey in Qatar. Energy Rep. 2022, 8, 257–262. [Google Scholar] [CrossRef]
  29. Al-Janahi, S.A.; Ellabban, O.; Al-Ghamdi, S.G. Technoeconomic feasibility study of grid-connected building-integrated photovoltaics system for clean electrification: A case study of Doha metro. Energy Rep. 2020, 6, 407–414. [Google Scholar] [CrossRef]
  30. Abu-Rub, H.; Iqbal, A.; Amin, S.; Abdelkadar, G.; Salem, N.; Mansoor, S.; Mirza, T.; Ahmed, S. Feasibility analysis of solar photovoltaic array cladding on commercial towers in Doha, Qatar–a case study. Int. J. Sustain. Energy 2010, 29, 76–86. [Google Scholar] [CrossRef]
  31. Al-Mohannadi, S.A. Using Solar Energy in Electrification: A Case of an Office Building. Master’s Thesis, Qatar University, Doha, Qatar, 2023. Available online: https://qspace.qu.edu.qa/handle/10576/40573 (accessed on 20 March 2022).
  32. Usman, Z.; Tah, J.; Abanda, H.; Nche, C. A critical appraisal of pv-systems’ performance. Buildings 2020, 10, 192. [Google Scholar] [CrossRef]
  33. Crook, J.A.; Jones, L.A.; Forster, P.M.; Crook, R. Climate change impacts on future photovoltaic and concentrated solar power energy output. Energy Environ. Sci. 2011, 4, 3101–3109. [Google Scholar] [CrossRef]
  34. Niu, J.; Qin, W.; Wang, L.; Zhang, M.; Wu, J.; Zhang, Y. Climate change impact on photovoltaic power potential in China based on CMIP6 models. Sci. Total Environ. 2023, 858, 159776. [Google Scholar] [CrossRef]
  35. Cocco, D.S.; Costa, A.M.S. Effect of a global warming model on the energetic performance of a typical solar photovoltaic system. Case Stud. Therm. Eng. 2019, 14, 100450. [Google Scholar] [CrossRef]
  36. Altamimi, A.; Jayaweera, D. Reliability of power systems with climate change impacts on hierarchical levels of PV systems. Electr. Power Syst. Res. 2021, 190, 106830. [Google Scholar] [CrossRef]
  37. Mas’ud, A.A.; Wirba, A.V.; Alshammari, S.J.; Muhammad-Sukki, F.; Abdullahi, M.M.; Albarracín, R.; Hoq, M.Z. Solar energy potentials and benefits in the gulf cooperation council countries: A review of substantial issues. Energies 2018, 11, 372. [Google Scholar] [CrossRef]
  38. Mühlbauer, M. Smart building-integrated photovoltaics (BIPV) for Qatar. QScience Connect 2017, 2017, 3. [Google Scholar] [CrossRef]
  39. Bachour, D.; Perez-Astudillo, D. Ground-measurement GHI Map for Qatar. Energy Procedia 2014, 49, 2297–2302. [Google Scholar] [CrossRef]
  40. Martín-Pomares, L.; Martínez, D.; Polo, J.; Perez-Astudillo, D.; Bachour, D.; Sanfilippo, A. Analysis of the long-term solar potential for electricity generation in Qatar. Renew. Sustain. Energy Rev. 2017, 73, 1231–1246. [Google Scholar] [CrossRef]
  41. Qatar Solar Energy. Available online: https://www.trade.gov/market-intelligence/qatar-solar-energy (accessed on 23 October 2023).
  42. Energy & Utilities. Qatar Celebrates First Large Solar PV Plant—800 MW Now in Operation. Available online: https://energy-utilities.com/qatar-celebrates-first-large-solar-pv-plant-800-news119133.html (accessed on 24 October 2023).
  43. Power Technology. kgi-admin, “Power Plant Profile: Ras Laffan Industrial Solar PV Park, Qatar”. Available online: https://www.power-technology.com/data-insights/power-plant-profile-ras-laffan-industrial-solar-pv-park-qatar/ (accessed on 24 October 2023).
  44. Newspaper, T.P. Qatar to Build Two More 880 MW Solar Power Plants. Available online: https://thepeninsulaqatar.com/article/08/04/2023/qatar-to-build-two-more-880mw-solar-power-plants (accessed on 24 October 2023).
  45. Newspaper, T.P. Qatar to Have about 1700 MW Solar Power by 2024: Minister. Available online: https://thepeninsulaqatar.com/article/19/10/2022/qatar-to-have-about-1700-mw-solar-power-by-2024-minister (accessed on 24 October 2023).
  46. Average Monthly Hours of Sunshine in Doha, Qatar. World Weather & Climate Information. Available online: https://weather-and-climate.com:80/average-monthly-hours-Sunshine,doha,Qatar (accessed on 24 October 2023).
  47. DesignBuilder Software Ltd—Simulation. Available online: https://designbuilder.co.uk/simulation (accessed on 24 October 2023).
  48. US DOE. EnergyPlus Energy Simulation Software. DOE Office of Energy Efficiency & Renewable Energy, 2022. [version 9.1]. Available online: https://energyplus.net/ (accessed on 5 January 2022).
  49. ArcGIS 8.0 Documentation; Environmental Systems Research Institute: Esri, CA, USA, 1999.
  50. Aldawoud, A.; Salameh, T.; Ki Kim, Y. Double skin façade: Energy performance in the United Arab Emirates. Energy Sources Part B Econ. Plan. Policy 2021, 16, 387–405. [Google Scholar] [CrossRef]
  51. Mahmoud, A.S.; Asif, M.; Hassanain, M.A.; Babsail, M.O.; Sanni-Anibire, M.O. Energy and economic evaluation of green roofs for residential buildings in hot-humid climates. Buildings 2017, 7, 30. [Google Scholar] [CrossRef]
  52. Radhi, H.; Sharples, S. Global warming implications of facade parameters: A life cycle assessment of residential buildings in Bahrain. Environ. Impact Assess. Rev. 2013, 38, 99–108. [Google Scholar] [CrossRef]
  53. Alyami, M.; Omer, S. Building energy performance simulation: A case study of modelling an existing residential building in Saudi Arabia. Environ. Res. Infrastruct. Sustain. 2021, 1, 035001. [Google Scholar] [CrossRef]
  54. Haj Hussein, M.; Monna, S.; Abdallah, R.; Juaidi, A.; Albatayneh, A. Improving the Thermal Performance of Building Envelopes: An Approach to Enhancing the Building Energy Efficiency Code. Sustainability 2022, 14, 16264. [Google Scholar] [CrossRef]
  55. Abdullah, A.K.; Darsaleh, A.; Abdelbaqi, S.; Khoukhi, M. Thermal Performance Evaluation of Window Shutters for Residential Buildings: A Case Study of Abu Dhabi, UAE. Energies 2022, 15, 5858. [Google Scholar] [CrossRef]
  56. Al-Saadi, S.N.; Al-Jabri, K.S. Energy-efficient envelope design for residential buildings: A case study in Oman. In 2017 Smart City Symposium Prague (SCSP); IEEE: Piscataway, NJ, USA, 2017; pp. 1–8. [Google Scholar]
  57. GSO. GCC Building Code. Available online: https://www.gso.org.sa/wp-content/uploads/2018/02/GCCBuildingCode_En.pdf (accessed on 5 January 2022).
  58. QCS. The Qatar National Construction Standards 2010; Ministry of Environment and Climate Change, State of Qatar: Doha, Qatar, 2010.
  59. HOMER Pro—Download, Install, and License. Available online: https://homerenergy.my.site.com/supportcenter/s/article/homer-pro---download-install-and-license (accessed on 29 November 2023).
  60. Qatar General Electricity & Water Corporation—المؤسسة العامة القطرية للكهرباء والماء. Available online: https://km.qa/Pages/default.aspx/ (accessed on 29 November 2023).
  61. Atalla, T.N.; Hunt, L.C. Modelling residential electricity demand in the GCC countries. Energy Econ. 2016, 59, 149–158. [Google Scholar] [CrossRef]
  62. Almasri, R.A.; Alshitawi, M.S. Electricity consumption indicators and energy efficiency in residential buildings in GCC countries: Extensive review. Energy Build. 2022, 255, 111664. [Google Scholar] [CrossRef]
  63. Azar, E.; Alaifan, B.; Lin, M.; Trepci, E.; El Asmar, M. Drivers of energy consumption in Kuwaiti buildings: Insights from a hybrid statistical and building performance simulation approach. Energy Policy 2021, 150, 112154. [Google Scholar] [CrossRef]
  64. Krarti, M.; Aldubyan, M.; Williams, E. Residential building stock model for evaluating energy retrofit programs in Saudi Arabia. Energy 2020, 195, 116980. [Google Scholar] [CrossRef]
  65. Esmaeil, K.K.; Alshitawi, M.S.; Almasri, R.A. Analysis of energy consumption pattern in Saudi Arabia’s residential buildings with specific reference to Qassim region. Energy Effic. 2019, 12, 2123–2145. [Google Scholar] [CrossRef]
  66. Radhi, H. Evaluating the potential impact of global warming on the UAE residential buildings—A contribution to reduce the CO2 emissions. Build. Environ. 2009, 44, 2451–2462. [Google Scholar] [CrossRef]
  67. Aldossary, N.A.; Rezgui, Y.; Kwan, A. Domestic energy consumption patterns in a hot and arid climate: A multiple-case study analysis. Renew. Energy 2014, 62, 369–378. [Google Scholar] [CrossRef]
  68. Li, D.H.W.; Yang, L.; Lam, J.C. Impact of climate change on energy use in the built environment in different climate zones—A review. Energy 2012, 42, 103–112. [Google Scholar] [CrossRef]
  69. Lenton, T.M.; Xu, C.; Abrams, J.F.; Ghadiali, A.; Loriani, S.; Sakschewski, B.; Zimm, C.; Ebi, K.L.; Dunn, R.R.; Svenning, J.-C.; et al. Quantifying the human cost of global warming. Nat. Sustain. 2023, 6, 1237–1247. [Google Scholar] [CrossRef]
  70. Pal, J.S.; Eltahir, E.A.B. Future temperature in southwest Asia projected to exceed a threshold for human adaptability. Nat. Clim. Change 2016, 6, 197–200. [Google Scholar] [CrossRef]
  71. Nik, V.M. Making energy simulation easier for future climate–Synthesizing typical and extreme weather data sets out of regional climate models (RCMs). Appl. Energy 2016, 177, 204–226. [Google Scholar] [CrossRef]
  72. Fumo, N. A review on the basics of building energy estimation. Renew. Sustain. Energy Rev. 2014, 31, 53–60. [Google Scholar] [CrossRef]
  73. Jentsch, M.F.; James, P.A.B.; Bourikas, L.; Bahaj, A.S. Transforming existing weather data for worldwide locations to enable energy and building performance simulation under future climates. Renew. Energy 2013, 55, 514–524. [Google Scholar] [CrossRef]
  74. Azimi Fereidani, N.; Rodrigues, E.; Gaspar, A.R. A review of the energy implications of passive building design and active measures under climate change in the Middle East. J. Clean. Prod. 2021, 305, 127152. [Google Scholar] [CrossRef]
  75. Chan, H.-Y.; Riffat, S.B.; Zhu, J. Review of passive solar heating and cooling technologies. Renew. Sustain. Energy Rev. 2010, 14, 781–789. [Google Scholar] [CrossRef]
  76. Abdul Mujeebu, M.; Bano, F. Energy-saving potential and cost-effectiveness of active energy-efficiency measures for residential building in warm-humid climate. Energy Sustain. Dev. 2022, 67, 163–176. [Google Scholar] [CrossRef]
  77. Friess, W.A.; Rakhshan, K. A review of passive envelope measures for improved building energy efficiency in the UAE. Renew. Sustain. Energy Rev. 2017, 72, 485–496. [Google Scholar] [CrossRef]
  78. Klein, S.J.W.; Hargreaves, A.; Coffey, S. A financial benefit-cost analysis of different community solar approaches in the Northeastern US. Sol. Energy 2021, 213, 225–245. [Google Scholar] [CrossRef]
  79. Tongsopit, S.; Moungchareon, S.; Aksornkij, A.; Potisat, T. Business models and financing options for a rapid scale-up of rooftop solar power systems in Thailand. Energy Policy 2016, 95, 447–457. [Google Scholar] [CrossRef]
  80. Bertoldi, P.; Economidou, M.; Palermo, V.; Boza-Kiss, B.; Todeschi, V. How to finance energy renovation of residential buildings: Review of current and emerging financing instruments in the EU. Wiley Interdiscip. Rev. Energy Environ. 2021, 10, e384. [Google Scholar] [CrossRef]
  81. Tantiwechwuttikul, R.; Yarime, M. Financing Solar Photovoltaic Transitions: From Utility to Residential Market Adoption in Emerging Economies; ADBI Working Paper; Asian Development Bank Institute (ADBI): Tokyo, Japan, 2018. [Google Scholar]
  82. Wu, J.; Ma, C.; Tang, K. The static and dynamic heterogeneity and determinants of marginal abatement cost of CO2 emissions in Chinese cities. Energy 2019, 178, 685–694. [Google Scholar] [CrossRef]
  83. Skoplaki, E.; Palyvos, J.A. On the temperature dependence of photovoltaic module electrical performance: A review of efficiency/power correlations. Sol. Energy 2009, 83, 614–624. [Google Scholar] [CrossRef]
  84. Dubey, S.; Sarvaiya, J.N.; Seshadri, B. Temperature Dependent Photovoltaic (PV) Efficiency and Its Effect on PV Production in the World—A Review. Energy Procedia 2013, 33, 311–321. [Google Scholar] [CrossRef]
  85. Makrides, G.; Zinsser, B.; Georghiou, G.E.; Schubert, M.; Werner, J.H. Temperature behaviour of different photovoltaic systems installed in Cyprus and Germany. Sol. Energy Mater. Sol. Cells 2009, 93, 1095–1099. [Google Scholar] [CrossRef]
  86. Ghabuzyan, L.; Pan, K.; Fatahi, A.; Kuo, J.; Baldus-Jeursen, C. Thermal effects on photovoltaic array performance: Experimentation, modeling, and simulation. Appl. Sci. 2021, 11, 1460. [Google Scholar] [CrossRef]
  87. Kratochvil, J.A.; Boyson, W.E.; King, D.L. Photovoltaic Array Performance Model; Sandia National Laboratories (SNL): Albuquerque, NM, USA; Livermore, CA, USA, 2004.
  88. Thakur, J.; Chakraborty, B. Impact of increased solar penetration on bill savings of net metered residential consumers in India. Energy 2018, 162, 776–786. [Google Scholar] [CrossRef]
  89. Mateo, C.; Cossent, R.; Gómez, T.; Prettico, G.; Frías, P.; Fulli, G.; Meletiou, A.; Postigo, F. Impact of solar PV self-consumption policies on distribution networks and regulatory implications. Sol. Energy 2018, 176, 62–72. [Google Scholar] [CrossRef]
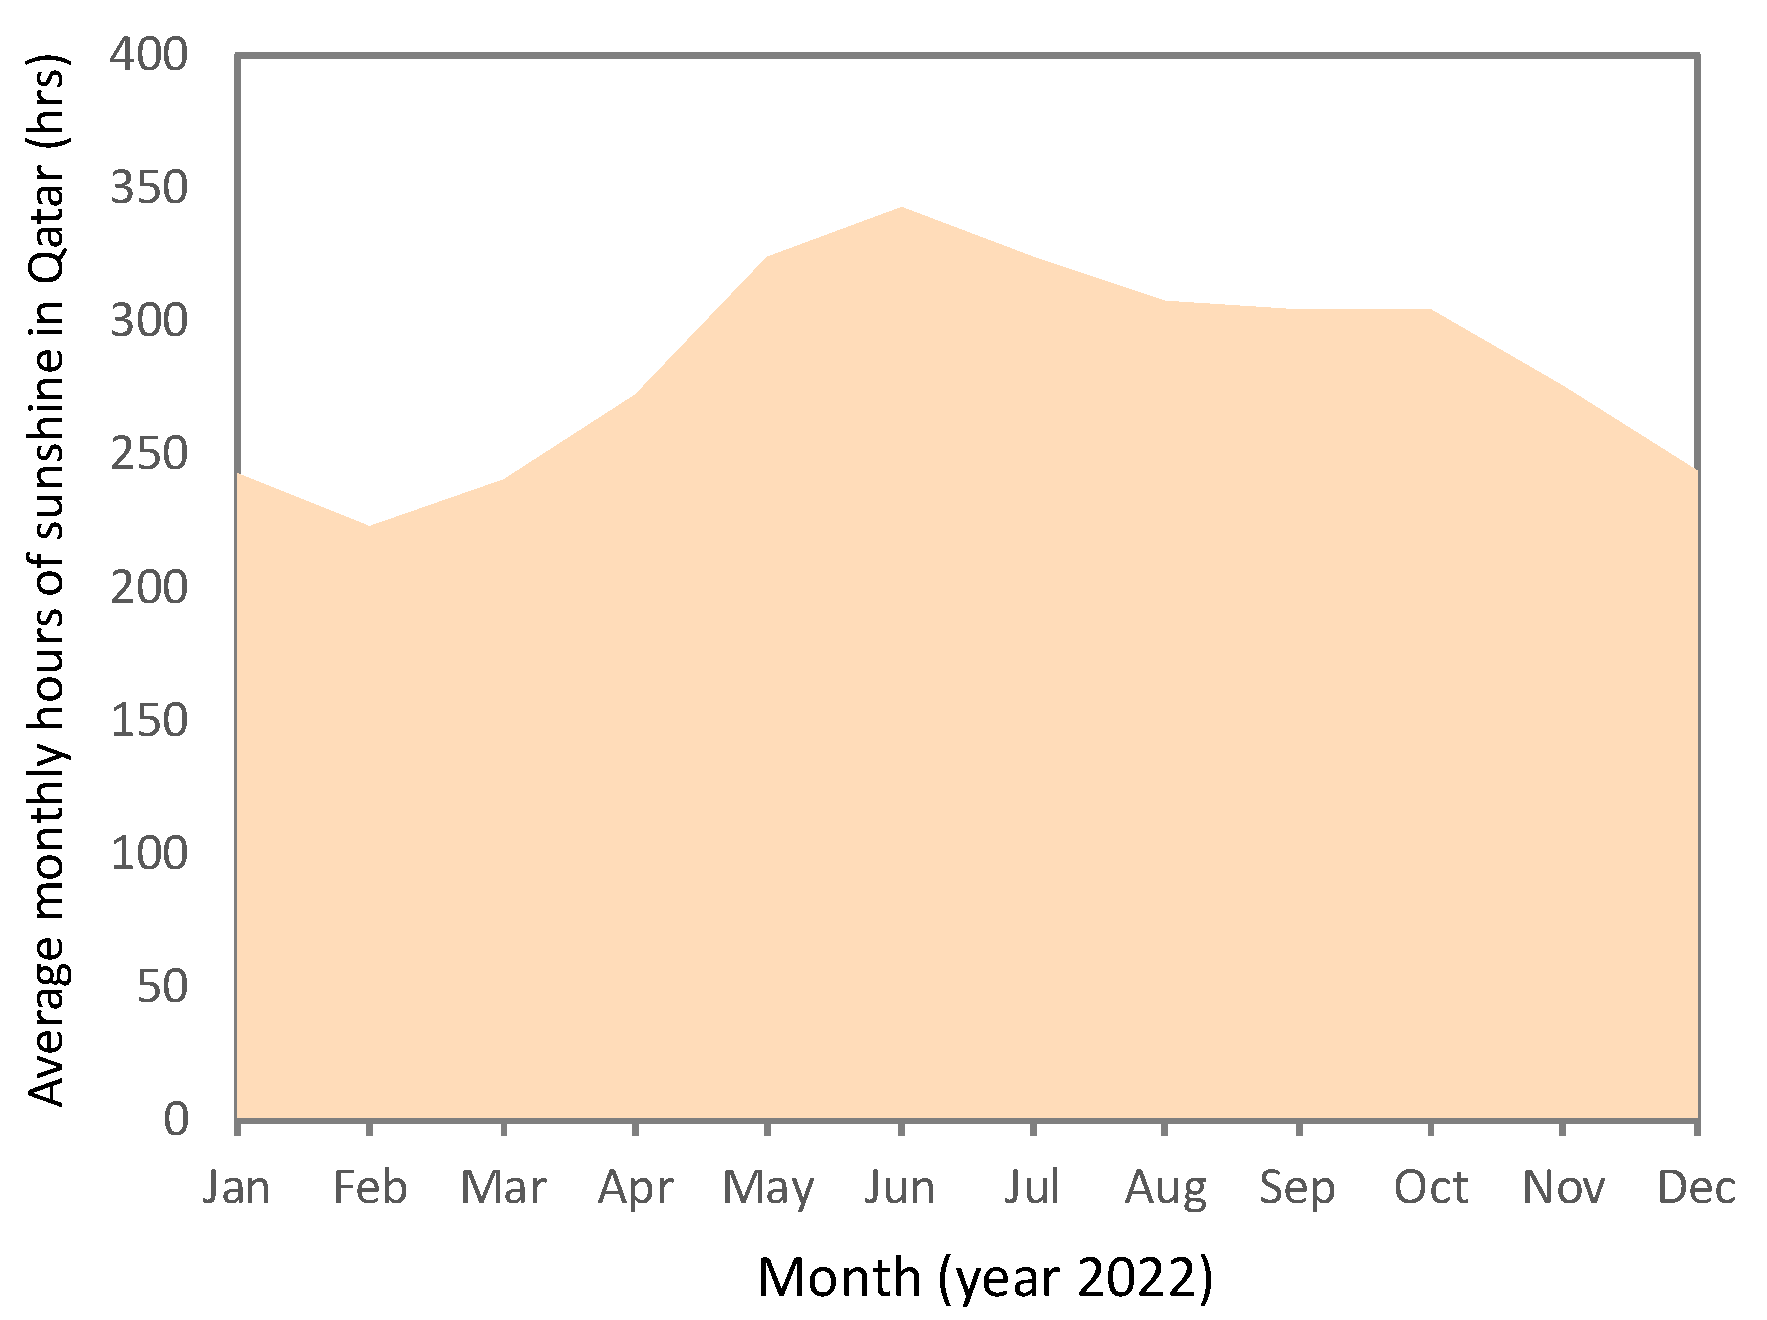
Figure 1. Average monthly hours of sunshine in Qatar. Based on data of [46].
Sustainability 15 16815 g001
Figure 2. GHI yearly average (2003–2013) in Qatar (kWh/m2 year) [40]. Copyright© 2017, Elsevier: reused with permission from Elsevier—license number 5686911098966.
Sustainability 15 16815 g002
Figure 3. Energy modelling and optimization steps for optimal PV system design under climate change projections.
Sustainability 15 16815 g003
Figure 4. Front elevation view of the selected villa.
Sustainability 15 16815 g004
Figure 5. A 3D model of the villa on DesignBuilder.
Sustainability 15 16815 g005
Figure 6. Energy consumption of villa (a) total energy and electricity consumption breakdown for year 2002 (b) total energy and electricity consumption breakdown for year 2016.
Sustainability 15 16815 g006
Figure 7. Total energy consumption for years 2002, 2016, 2050 and 2100.
Sustainability 15 16815 g007
Figure 8. Environmental impact of base system and optimized hybrid system.
Sustainability 15 16815 g008
Table 1. Qatar Housing Unit Types in 2015.
MunicipalityHousing UnitsPalace/
Villa
Arabic/
Elderly
Flats/
Apartments
Additional BuildingsOthers
Doha153,29731,685817298,606286511,969
Al Rayyan86,64644,151985419,539299510,107
Al Wakra31,7349668198217,7914431850
Umm Salal95827055882356377912
Al Khor13,0206193155526972532322
Al Shamal16074575341798501
Al Daayen6890568351478157458
Al Sheehaniya11,10510841705224012914785
QATAR313,881105,97625,198141,324847932,904
Table 2. Description of case study building.
ComponentDetails
External Walls200 mm concrete block, 24 mm of plaster inside and outside, 50 mm extruded polystyrene
Internal Walls100 mm concrete block, 15 mm plaster both sides
Internal FloorTile on 75 mm concrete slab on grade
Roof200 mm Concrete roof deck, 50 mm insulation, 10 mm ceramic tiles
CeilingSuspended acoustic tile (10 mm) ceiling
WindowsDouble glazed low-e argon filled, Aluminum frame
DoorsSolid core wood
Glazing6 mm double glass with U-value 2.5 W/(m2 °K)
Infiltration Rate5.0 m3/h/m2
Ventilation Rate7.5 L/second/person
Lighting9 W/m2 (LED bulbs)
Appliances6 W/m2
Occupancy55 m2/person
HVACSplit units
Cooling set point temperature22 °C (summer) and 26 °C (winter)
Table 3. Optimal Solar PV Results Summary.
YearArchitectureCostSRE
(%)
Compare Economic
Solar Panel
(kW)
Battery
(kWh)
GridInverter
(kW)
NPC
($)
COE
($)
Operating Cost
($/year)
Initial Capital
($)
IRR
(%)
Simple Payback (year)Utility Bill Savings ($/year)Total Bill Savings ($)
20027.4-14.4624,1780.03271623319318.1107.84635981
7.39114.4725,1090.03411657368518.37.4134656009
--1-25,6310.0375198300--00
20167.4-14.4825,5660.03331730319717.4117.84656015
7.4114.5126,4880.03461763369617.67.5134686052
--1-27,0460.0379209200--00
20507.4-14.4827,4990.0339188016.516.5117.64756140
7.4114.5128,4030.03511911369616.77.994786179
--1-29,1040.0385225100--00
21007.4-14.4827,4750.0341878319716.5117.64746132
7.4114.5128,3960.03521911369616.77.994776173
--1-29,0730.0385224900--00
Disclaimer/Publisher’s Note: The statements, opinions and data contained in all publications are solely those of the individual author(s) and contributor(s) and not of MDPI and/or the editor(s). MDPI and/or the editor(s) disclaim responsibility for any injury to people or property resulting from any ideas, methods, instructions or products referred to in the content.