Article

Assessing Human Mobility and Its Climatic and Socioeconomic Factors for Sustainable Development in Sub-Saharan Africa

1
Africa Multiple Cluster of Excellence, University of Bayreuth, 95440 Bayreuth, Germany
2
Climatology Research Group, University of Bayreuth, 95447 Bayreuth, Germany
3
Institute of Social Sciences in Agriculture, University of Hohenheim, 70593 Stuttgart, Germany
4
Leibniz-Centre for Agricultural Landscape Research (ZALF), Eberswalder Straße 84, 15374 Müncheberg, Germany
5
Bayreuth Centre of Ecology and Environmental Research, University of Bayreuth, 95448 Bayreuth, Germany
*
Author to whom correspondence should be addressed.
Sustainability 2023, 15(15), 11661; https://doi.org/10.3390/su151511661
Submission received: 11 July 2023 / Revised: 22 July 2023 / Accepted: 26 July 2023 / Published: 28 July 2023

Abstract

:
Promoting human mobility and reducing inequality among countries are the Sustainable Development Goals’ (SDGs) targets. However, measuring human mobility, assessing its heterogeneity and changes, and exploring associated mechanisms and context effects are still key challenges, especially for developing countries. This study attempts to review the concept of human mobility with complex thinking, assess human mobility across forty countries in Sub-Saharan Africa (SSA), and examine the effect of climatic and socioeconomic factors. Based on the coined definition of human mobility, international migration and cross-border trips are taken to assess human mobility in terms of permanent migration and temporary moves. The forty SSA countries are hence classified into four mobility groups. Regression models are performed to identify key determinants and estimate their effects on mobility. The results reveal that seven of these forty countries had a high mobility, whereas most experienced a decline in permanent migration. Lesotho, Cabo Verde, and Namibia presented high temporary moves, while Eritrea, Rwanda, Equatorial Guinea, and Liberia had a high permanent migration. Climatic and socioeconomic conditions demonstrated significant effects on mobility but were different for temporary moves and permanent migration. Wet extremes reduced mobility, whereas extreme temperature variations had positive effects. Dry extremes promoted permanent migration but inhibited temporary moves. Economic wealth and political instability promoted permanent migration, while the young population counteracted temporary moves. Food insecurity and migrant networks stimulated human mobility. The analysis emphasises the interest in analysing human mobility for risk reduction and sustainability management at the multi-county level.

1. Introduction

The Sustainable Development Goals (SDGs) adopted by the United Nations in 2015 have mentioned ‘orderly, safe, regular and responsible migration’ in Target 10.7 as a critical issue, including the implementation of planned and well-managed migration policies, which appears under Goal 10 to reduce inequality within and among countries [1]. However, measuring the migration and mobility of people as well as assessing human mobility changes and their associated socioeconomic and environmental effects are still key challenges for both academics and the public, due to the lack of a clear definition and solid understanding of human mobility in the interconnected world [2,3].
Mobility has been understood as movements of human and nonhuman entities (e.g., images and information) and the associated socioeconomic and environmental factors and impacts [4,5]. Mobility is a located and materialised resource that people do not equally have and occurs through people’s varied and changing activities in movement and relocation and materialisation of resources [5,6]. It denotes people’s ability to move, the freedom to move or stay, and the tendency to change quickly [7,8]. Hence, human migration and other forms of mobility depict the consequence and cause of environmental change, economic growth, social and political evolutions, and individual decisions [3,4,9,10,11]. The nexus between human mobility and environmental and socioeconomic dimensions is crucial towards peace-centred sustainable development [1,12]. It positively and negatively affects resilience building and climate change adaptation and sustainable transformations [13,14,15]. Thus, the management of human mobility is vital to increase human well-being, achieve and sustain peace locally and nationally, and decrease environmental and socioeconomic risks towards sustainability [16], especially for those least developed countries in Sub-Saharan Africa (SSA).
Based on what we coined above, complex systems thinking [10,17,18,19] can help investigate human mobility at multiple scales (i.e., national or regional, community, and individual). The actors and elements comprise socio-ecological systems within four components, i.e., human movements, nonhuman movements, associated factors, and incidental impacts, which influence one another in complex and non-linear ways (Figure 1). The movements or stay of people, goods, materials, and information define the mobility system’s components and attributes; categorise mobility by destination, distance, duration, and frequency [20,21]; and formulate the system’s ability, freedom, and tendency to move and change [7,8]. These movements interact with environmental, social, economic, political, and demographic factors. From the human perspective, this places people and their interests in the centre of social–ecological systems [22]; mobility is influenced by and affects these associated factors as the consequent and antecedent of changes. People‘s needs, capacities, and aspirations to move or stay can be clarified to measure human mobility in complex dynamics [4,7,21,23]. Scrutinising associated factors and impacts can help identify critical intervening obstacles and facilitators, providing insights into people’s exposure and vulnerability and implications for effective management schemes [3,24]. In addition, estimating nonhuman movements and the positive and negative effects of migration improves people’s knowledge and ability to cope with hazards and conflict while reducing risk [14,25]. It may promote the system’s resilience building and sustainability management. Such a framework lays the groundwork for a thorough human mobility assessment to better understand and support effective management.
Various studies on human mobility assessment have been conducted on monitoring and forecasting [26,27,28,29] and estimating the environmental and socioeconomic effects [14,30,31,32]. International efforts have been made to monitor migration and mobility by using Big Data like mobile phone location data [33], geocoded Twitter messages [34], and GPS records [35]. Big Data also offer the potential capacity to measure, monitor, and predict socioeconomic phenomena and interactions in quasi-real time [36,37,38]. Nevertheless, accessible and timely global or representative data are still a critical challenge [39]. Previous studies have consistently found that environmental and socioeconomic factors significantly influence human migration and other forms of mobility [3,24]. Although climatic conditions play a role [40,41], the impact is limited to specific periods and contexts, and it remains challenging to determine the extent [24,42]. Violence, conflict, income opportunities and growth, and demographics represent a set of significant mobility determinants [3,41,43]. In addition, migration affects sustainable development in both source and destination regions in terms of economic terms, social transformation, peace promotion, and environmental pollution [14,44]. Despite these, further attention shall be paid to enriching human mobility categories and the underlying features of each category, and identifying the critical socioeconomic and environmental factors that shape human mobility.
This paper attempts to assess human mobility and its climatic and socioeconomic factors across SSA countries, narrowing down the research gap. It proposed a conceptual framework for systems thinking of human mobility, categorised human mobility into temporary moves and permanent migration, estimated the magnitude of mobility and associated environmental and socioeconomic factors over time and space, and explored the critical determinants and their effects on mobility. Unlike most empirical work focusing on particular types of movement in specific spatial settings, we focused on temporary moves (i.e., cross-border trips) and permanent migration (i.e., international migration) for generality by using open-access data at the national level. It eliminates reliance on ideographic datasets and small-scale surveys but still misses circular and internal movement dimensions [19]. Nevertheless, this work proposes an empirical assessment of human mobility based on the complex thinking of socio-ecological systems and sustainable management. It entails a range of questions. What are SSA’s human mobility components and their features? What are the changes in mobility and associated environmental and socioeconomic factors over time? What are the significant shaping factors and their effects on human mobility? The study hence applies multivariate analysis techniques for (a) mobility clustering, (b) a determinant analysis, and (c) implications for effective management.
Following this introduction, Section 2 gives an overview of data and a statistical analysis. Section 3 presents the research results and discussion. The conclusions of this research are discussed in Section 4.

2. Methods

2.1. Data

This paper constructs a dataset (Table 1) of about forty SSA countries’ international migration and cross-border trips and the associated climatic and socioeconomic conditions (Tables S1 and S2). Data on international migration come from the World Population Prospects 2019 [45], which estimates the annual net migration flow by country between 1995 and 2020 with a 5-year interval. It is used as a proxy for permanent migration. In contrast, the temporary moves are measured through cross-border trips from the global tourism and air passenger traffic statistics between 2011 and 2016 [46]. Data on climatic conditions covering wet, dry, and temperature extremes between 1990 and 2018 (Figure S1) come from various sources: the Food and Agriculture Organization Corporate Statistical Database [47] and previously published datasets [48,49].
The socioeconomic conditions between 1990 and 2018 are represented by five variables: GDP per capita, political stability, food supply, young population ratio, and migrant networks. Data on GDP per capita and the political stability and absence of violence index are from the World Development Indicators [50]. Food supply is estimated by the average dietary energy supply adequacy index obtained from the Food and Agriculture Organization Corporate Statistical Database [47]. The young population ratio is calculated using the World Population Prospects 2019 [51]. Migrant networks are measured with the migrants of one SSA country residing in another country, which is collected from the International Migrant Stock 2019 [45]. For the sake of data integrity and consistency, climatic and socioeconomic data are transformed into the sum, maximum, or average of every 5-year interval. For instance, GDP per capita is the average, whereas dry and wet extremes take the sum data while temperature extremes use the maximum value.

2.2. Statistical Analysis

The analysis aims to classify SSA countries by their temporary moves and permanent migration, assess the magnitude of mobility across countries, and explore the key determinants. For the mobility assessment, international migration and cross-border trips are used to measure temporary moves and permanent migration. A cluster analysis is applied to divide SSA countries into divergent mobility groups. Their changes in mobility are analysed with associated climatic–socioeconomic changes in time and space. Regression models are employed to explore the key determinants of SSA’s mobility.

2.2.1. Mobility Clustering

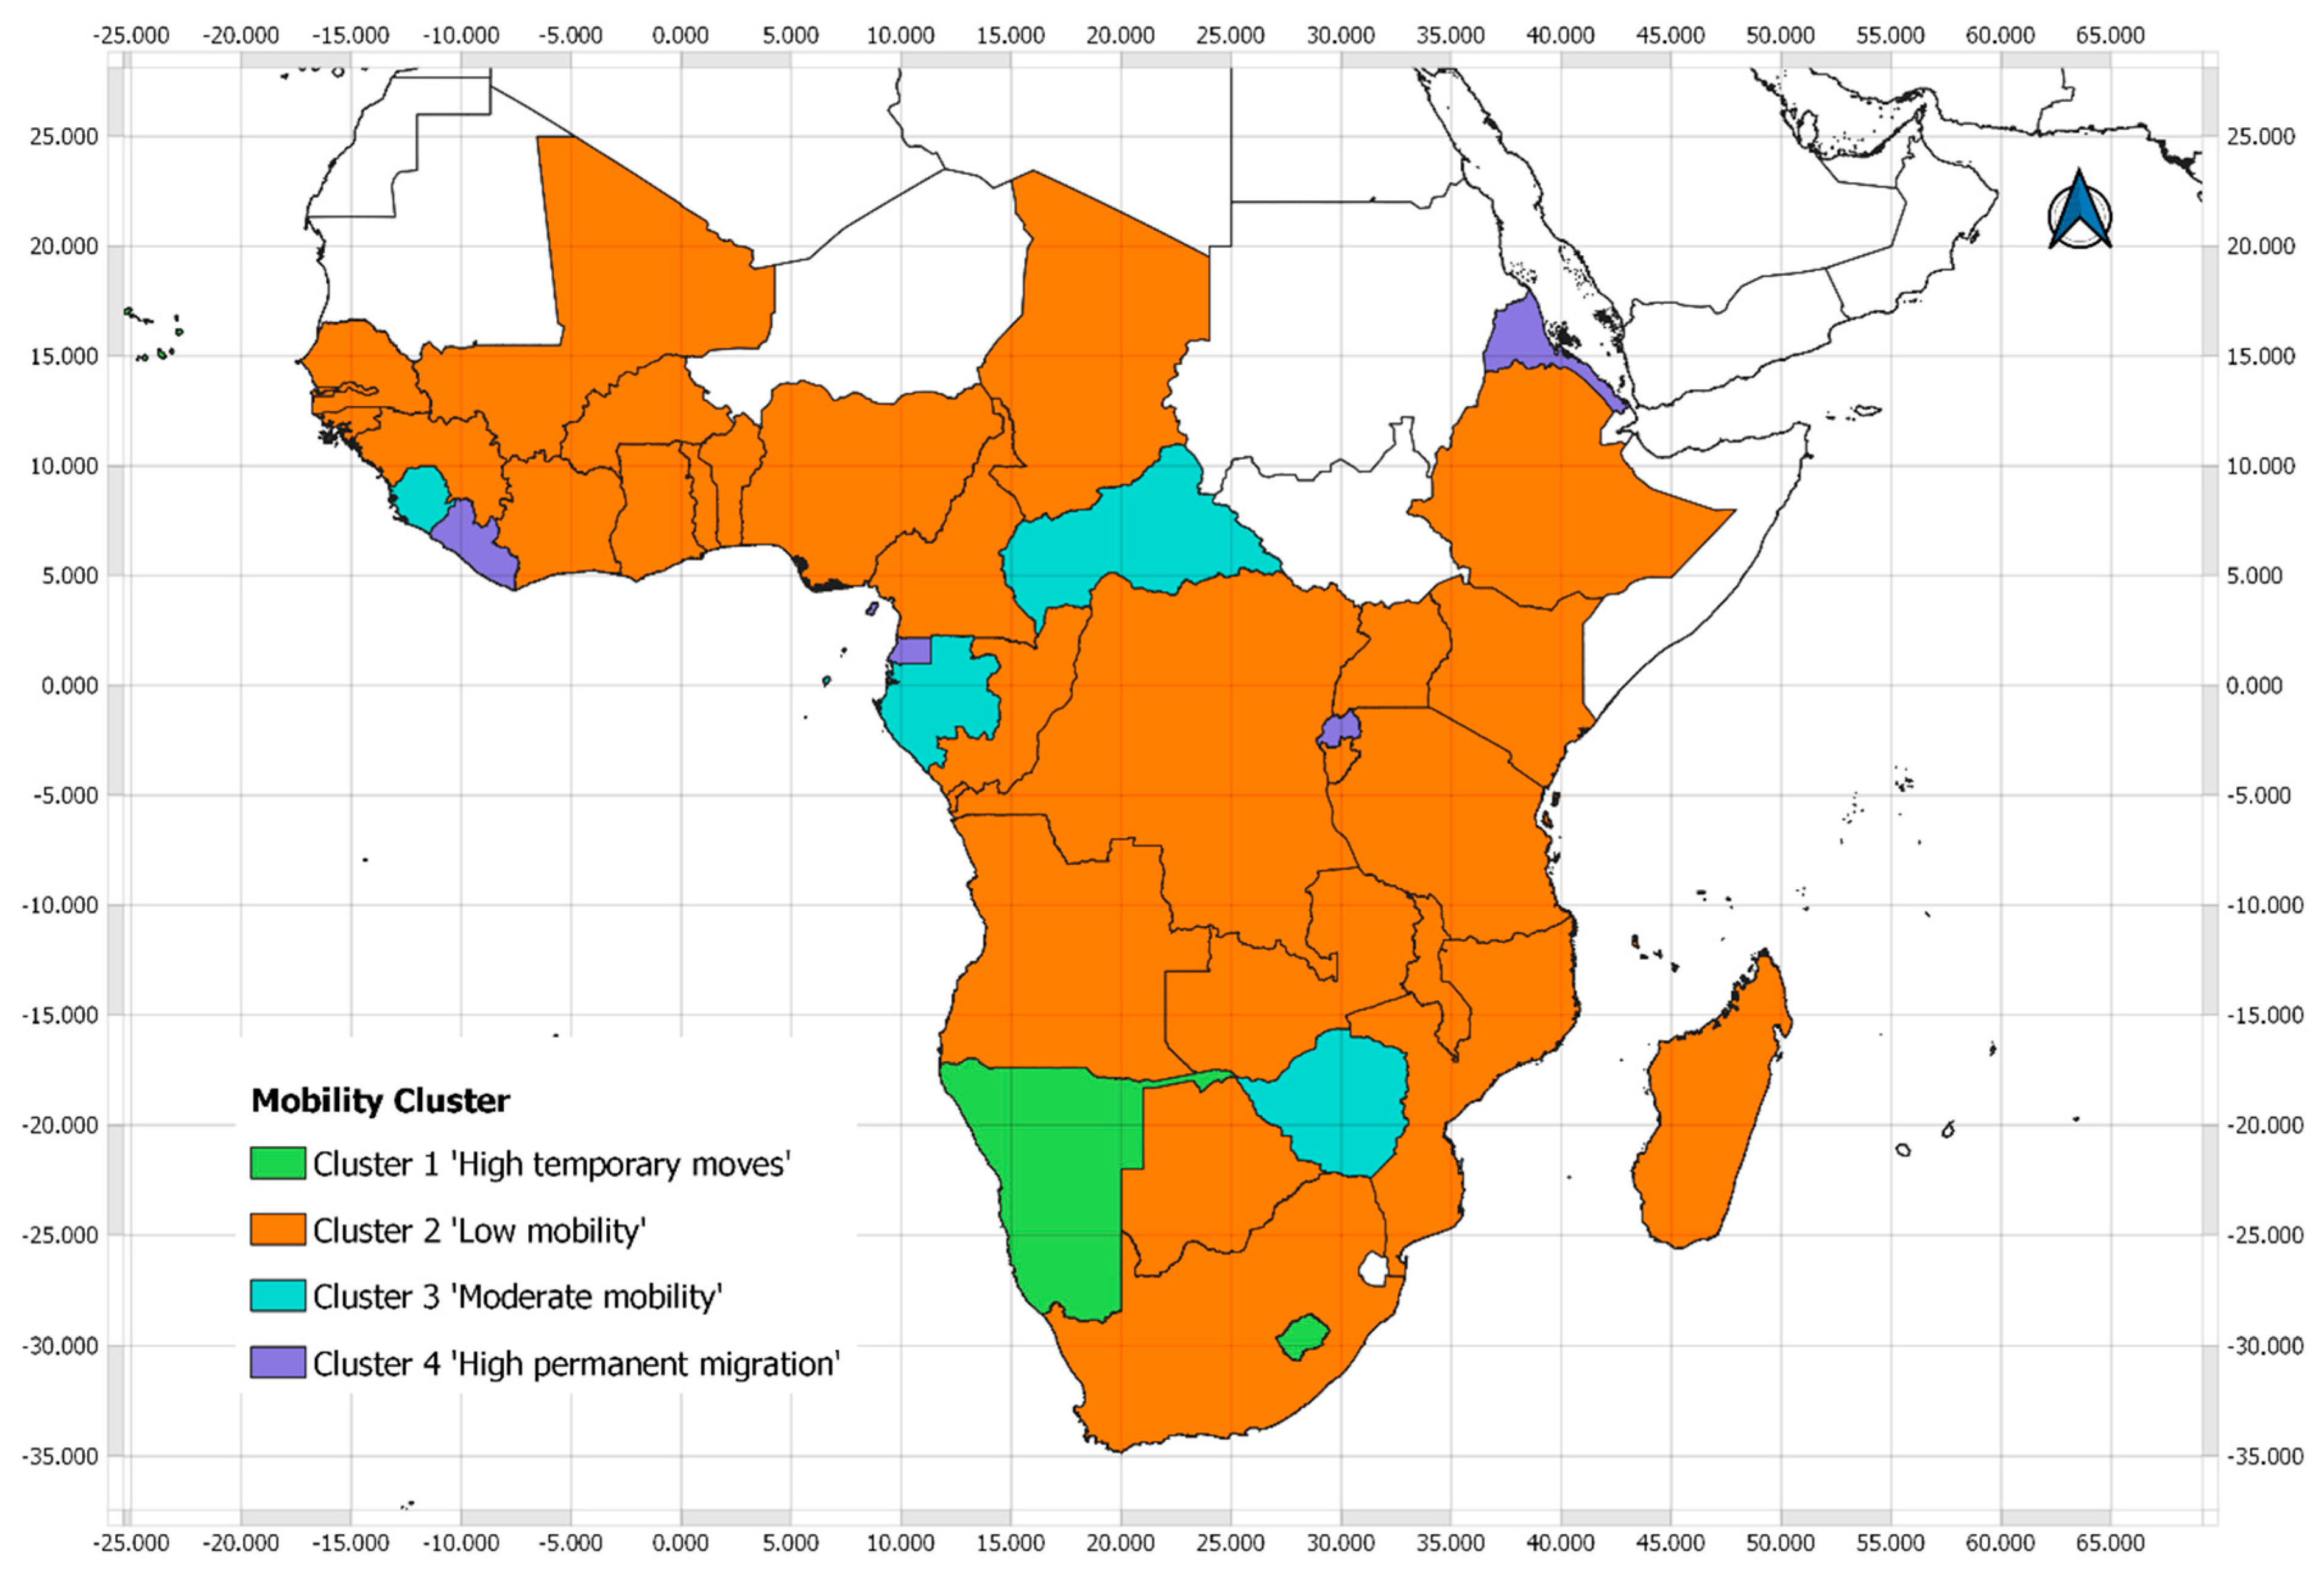
International migration and cross-border trips (Table 1) are used to measure SSA’s human mobility in terms of permanent migration and temporary moves. The values of international migration and cross-border trips are divided by the population size of the origin country. The average values of these generated variables (i.e., N M _ p o p and T r i p _ p o p ) are then transformed into standardised values comparable across countries. After that, the forty SSA countries are grouped into four mobility clusters (Figure 2 and Table 2) using Ward’s method and a K-means cluster analysis (KCA). Ward’s method was performed on the dataset for the cluster dendrogram (Figure S2) to identify the number of clusters, while KCA presents clusters (Figure S3) that are relatively homogeneous within themselves and heterogeneous between each other.

2.2.2. Determinant Analysis

Determinants of permanent migration and temporary moves are estimated by building a set of regression models (Table 3). Here, we assume that a country’s climate extremes and socioeconomic conditions influence its human mobility. For exploratory variables, dry, wet, and temperature indicators are used to measure climate extremes. Although climate change will likely impact human migration to a certain extent, previous studies have debated how temperature variation and rainfall variability affect temporary and permanent out-migration [40,42,52,53,54]. Climate change may accelerate survival migration and trap populations with low mobility levels [40,55]. Climate change affects migration by impacting agriculture and conflict incidence [42,52,53]. Climate impacts are divergent in different urban and rural areas of various geographic, socioeconomic, and demographic conditions [54]. For the socioeconomic factors, we assume that economic prosperity (i.e., GDP per capita), the absence of violence and armed conflict, and food adequacy are critical drivers for the human mobility of an SSA country. The ratio of young populations (i.e., between 15 and 34 years old) is introduced with a hypothesis that young populations are more likely and flexible to migrate. Migrant networks also reduce migration and integration costs and facilitate information and knowledge transfer [41,43].
Negative Binomial regression models (NBM) are hence performed due to the over-dispersed count data on the absolute value of net international migration (i.e., N M ) and estimates of the cross-border trips (i.e., T r i p ) whose conditional variances exceed their conditional means. NBM is a generalisation of the Poisson regression model addressing the over-dispersion issue by including a disturbance or error term (See Equation (1)). Ordinary Least Squares (OLS) regression models are developed (See Equation (2)) for dependent variables N M _ p o p and T r i p _ p o p (Table 1) whose values are transformed via the natural logarithm to limit outlier bias. The OLS and NBM models can help confirm the consistency and robustness of the findings. After that, we only include the significant regressors (ρ value < 0.05) further on to test the consistency of model results (Table S3). Robust standard errors are taken to obtain unbiased standard errors of coefficients under heteroscedasticity. The variance inflation factor (VIF) is also used to test the multicollinearity of regression models (Table S4). In particular, exploratory variables with a value of VIF that is more significant than 8 are dismissed, such as GDP per capita in Equation (2).
log Y i t = ψ t + ϕ i + β 0 + β k x i k t + σ ε i t
Y i t = ψ t + ϕ i + β 0 + β k x i k t + ε i t
where Y i t are the expected values of human mobility from country i over time intervals t = 1991–1995, 1996–2000, 2001–2005, 2006–2010, 2011–2015, and 2016–2020 for permanent migration and t = 2011 and 2016 for temporary moves, respectively. ψ t are time-fixed effects, ϕ i are origin-fixed effects, and β are corresponding regression coefficients; σ ε i j t is the error term. x i k t are the values of the kth exploratory variable for the country i calculated over time intervals t = 1990, 1995, 2000, 2005, 2010, and 2015 for permanent migration and t = 2005 and 2010 for temporary moves, respectively. Given endogeneity and reverse causality concerns, the exploratory variables are taken with lagged time intervals. They may help reduce model bias by assuming that the exploratory variables are predetermined so that mobility and the error term might only affect their contemporaneous and future values.

3. Results and Discussion

This paper assesses human mobility by comparing temporary moves and permanent migration and its climatic and socioeconomic factors across SSA countries over time. The results show that the forty SSA countries can be divided into four divergent mobility groups (Table 2 and Figure 2). Significant changes in human mobility and associated climatic–socioeconomic conditions occur over the research period across SSA countries (Figure 3, Figure 4, Figure 5 and Figure 6). The climatic and socioeconomic conditions significantly affect human mobility, but the effects differ for temporary moves and permanent migration (Table 3).

3.1. Human Mobility in Sub-Saharan Africa

SSA countries can be grouped into four mobility clusters (Table 2 and Figure 2). Cluster 1 ‘High temporary moves’, including Cabo Verde, Lesotho, and Namibia, had a high value of per capita temporary moves along with low wet extremes and migrant networks but high- temperature extremes, GDP per capita, political stability, and young population share (Table 2). The majority is named Cluster 2 ‘Low mobility’ due to the lower per capita temporary moves and permanent migration values than averages. It had high climatic extremes, food supply, and migrant networks but a low GDP per capita and political stability. Cluster 3 ‘Moderate mobility’, consisting of the Central African Republic, Gabon, Sao Tome and Principe, Sierra Leone, and Zimbabwe, had low climatic extremes and migrant networks. Cluster 4 ‘High permanent migration’ was associated with low- temperature extremes, political stability, and food supply but a high GDP per capita. It contains countries like Eritrea, Rwanda, Equatorial Guinea, and Liberia that had a high level of human mobility in terms of permanent migration rather than temporary moves (i.e., international trips). The results show that most of these forty SSA countries had low human mobility, with distinct spatial distribution between the temporary cross-border moves and permanent migration.
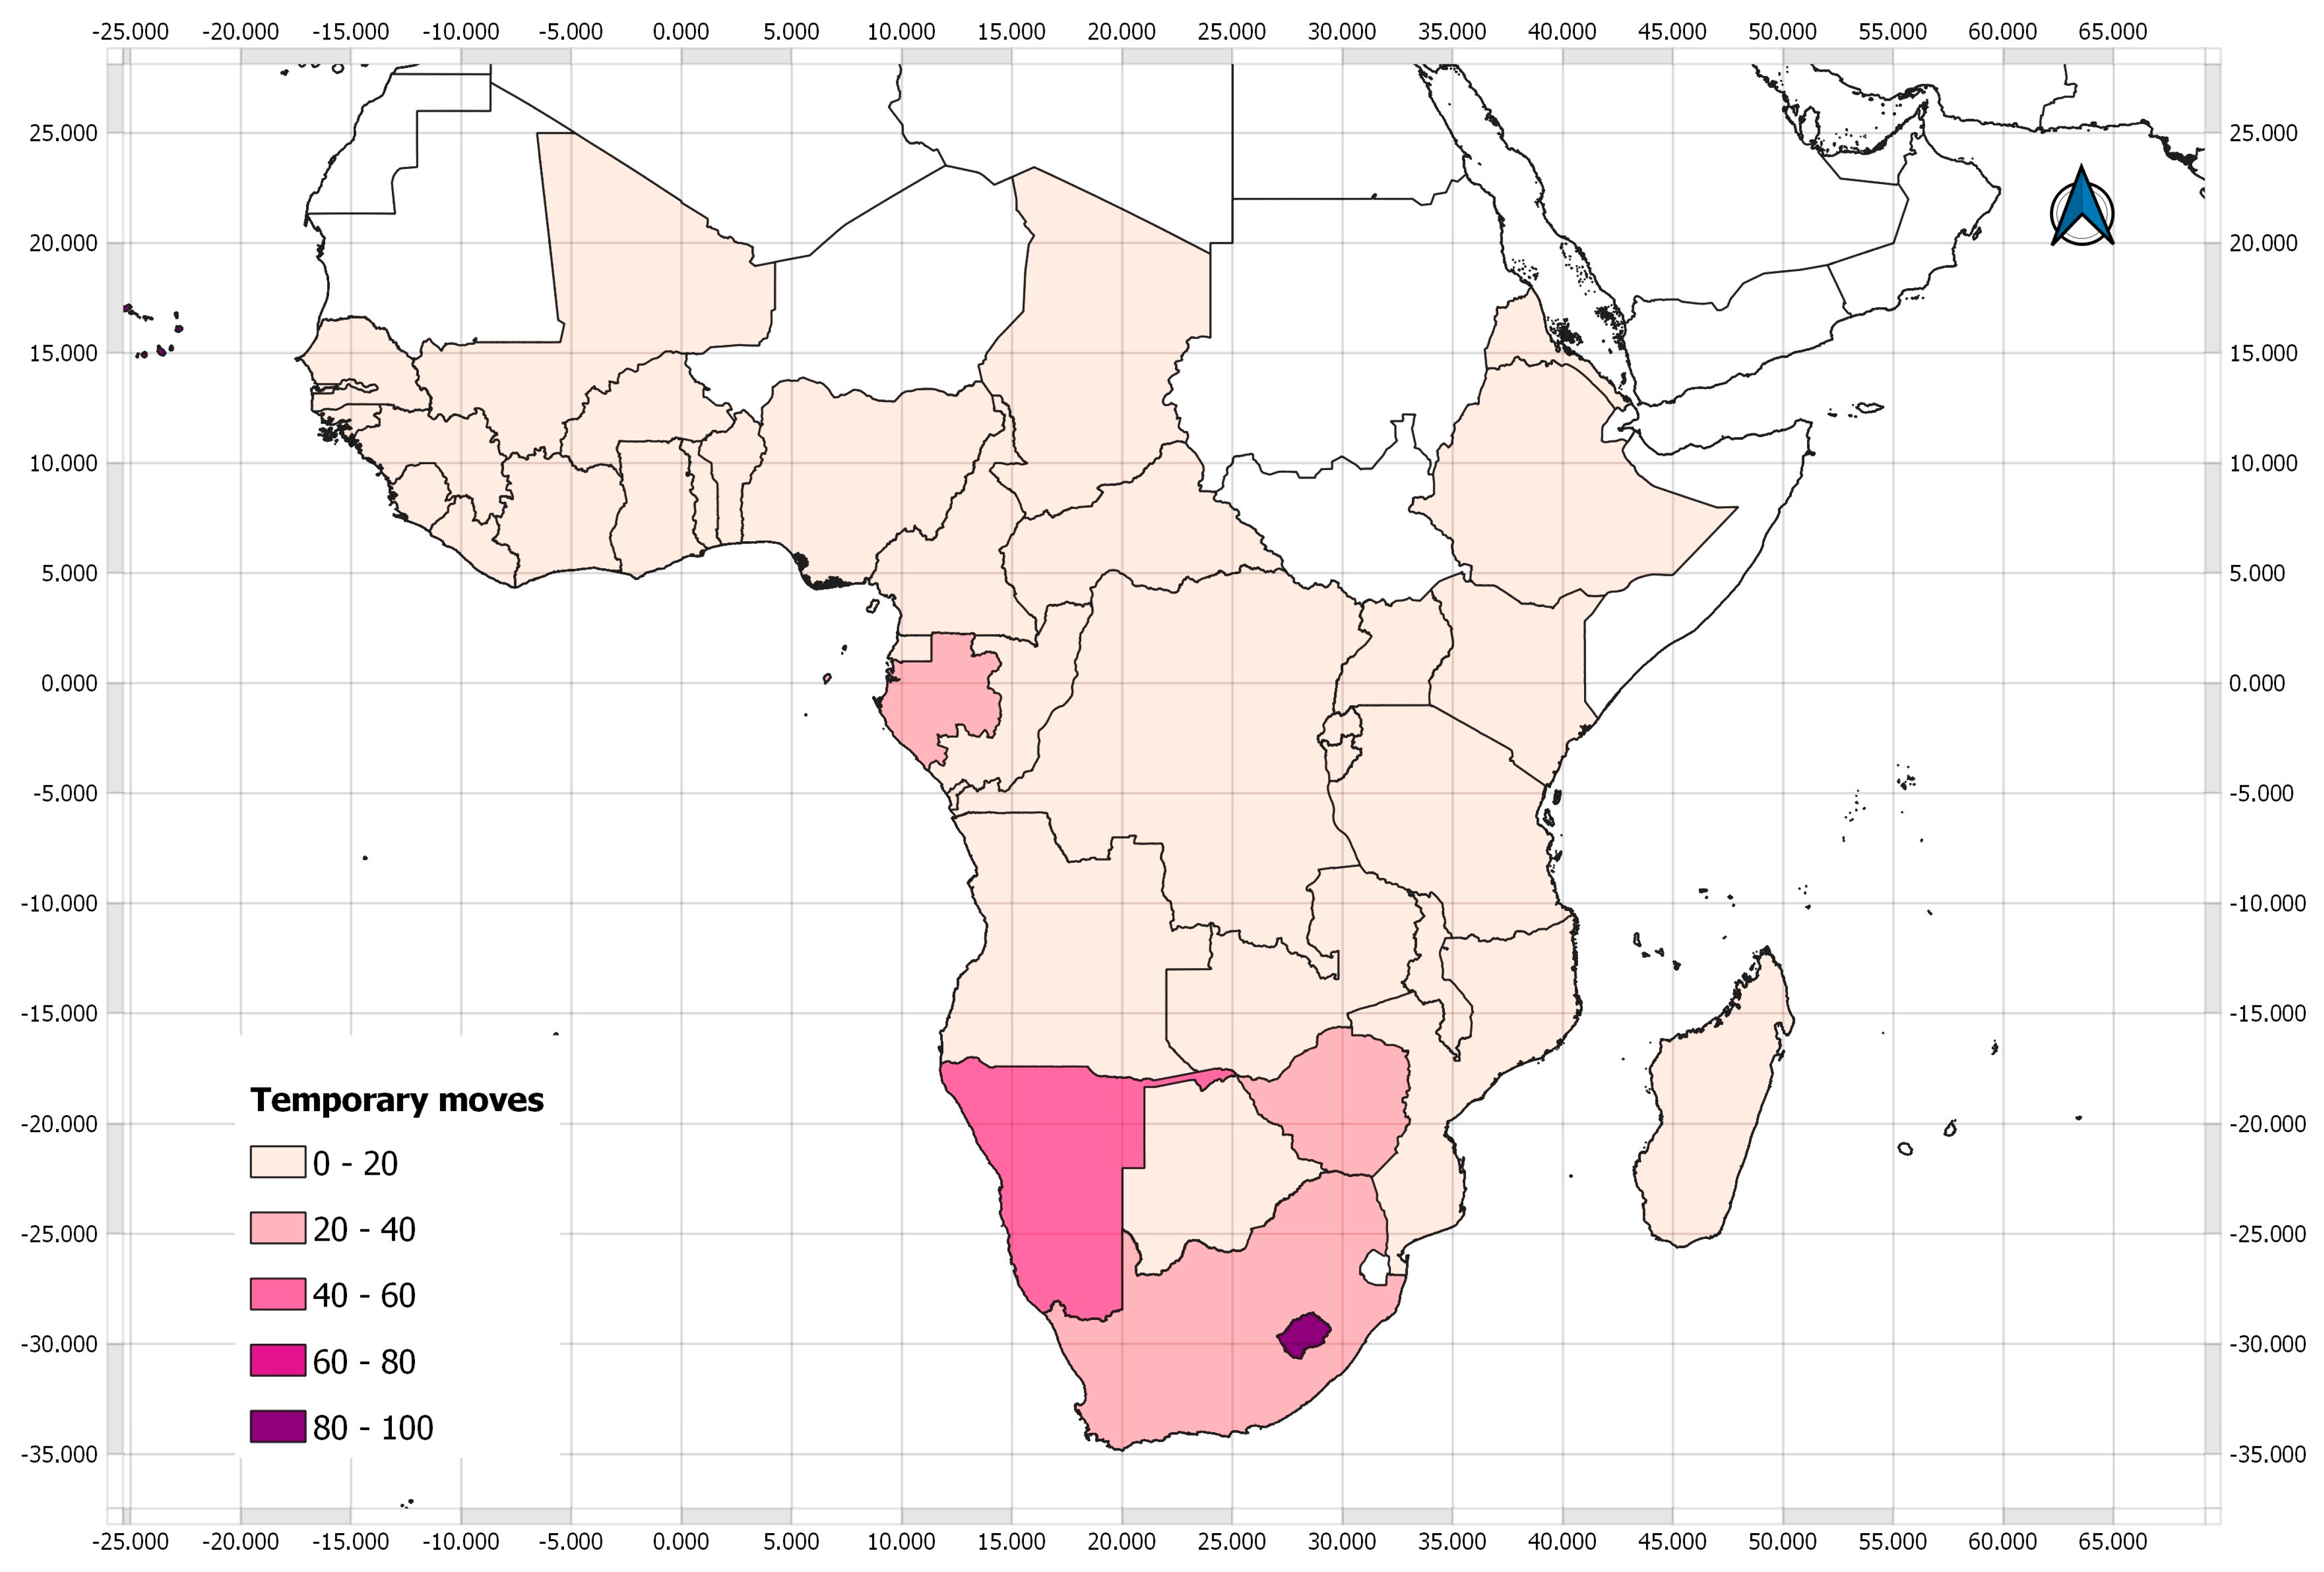
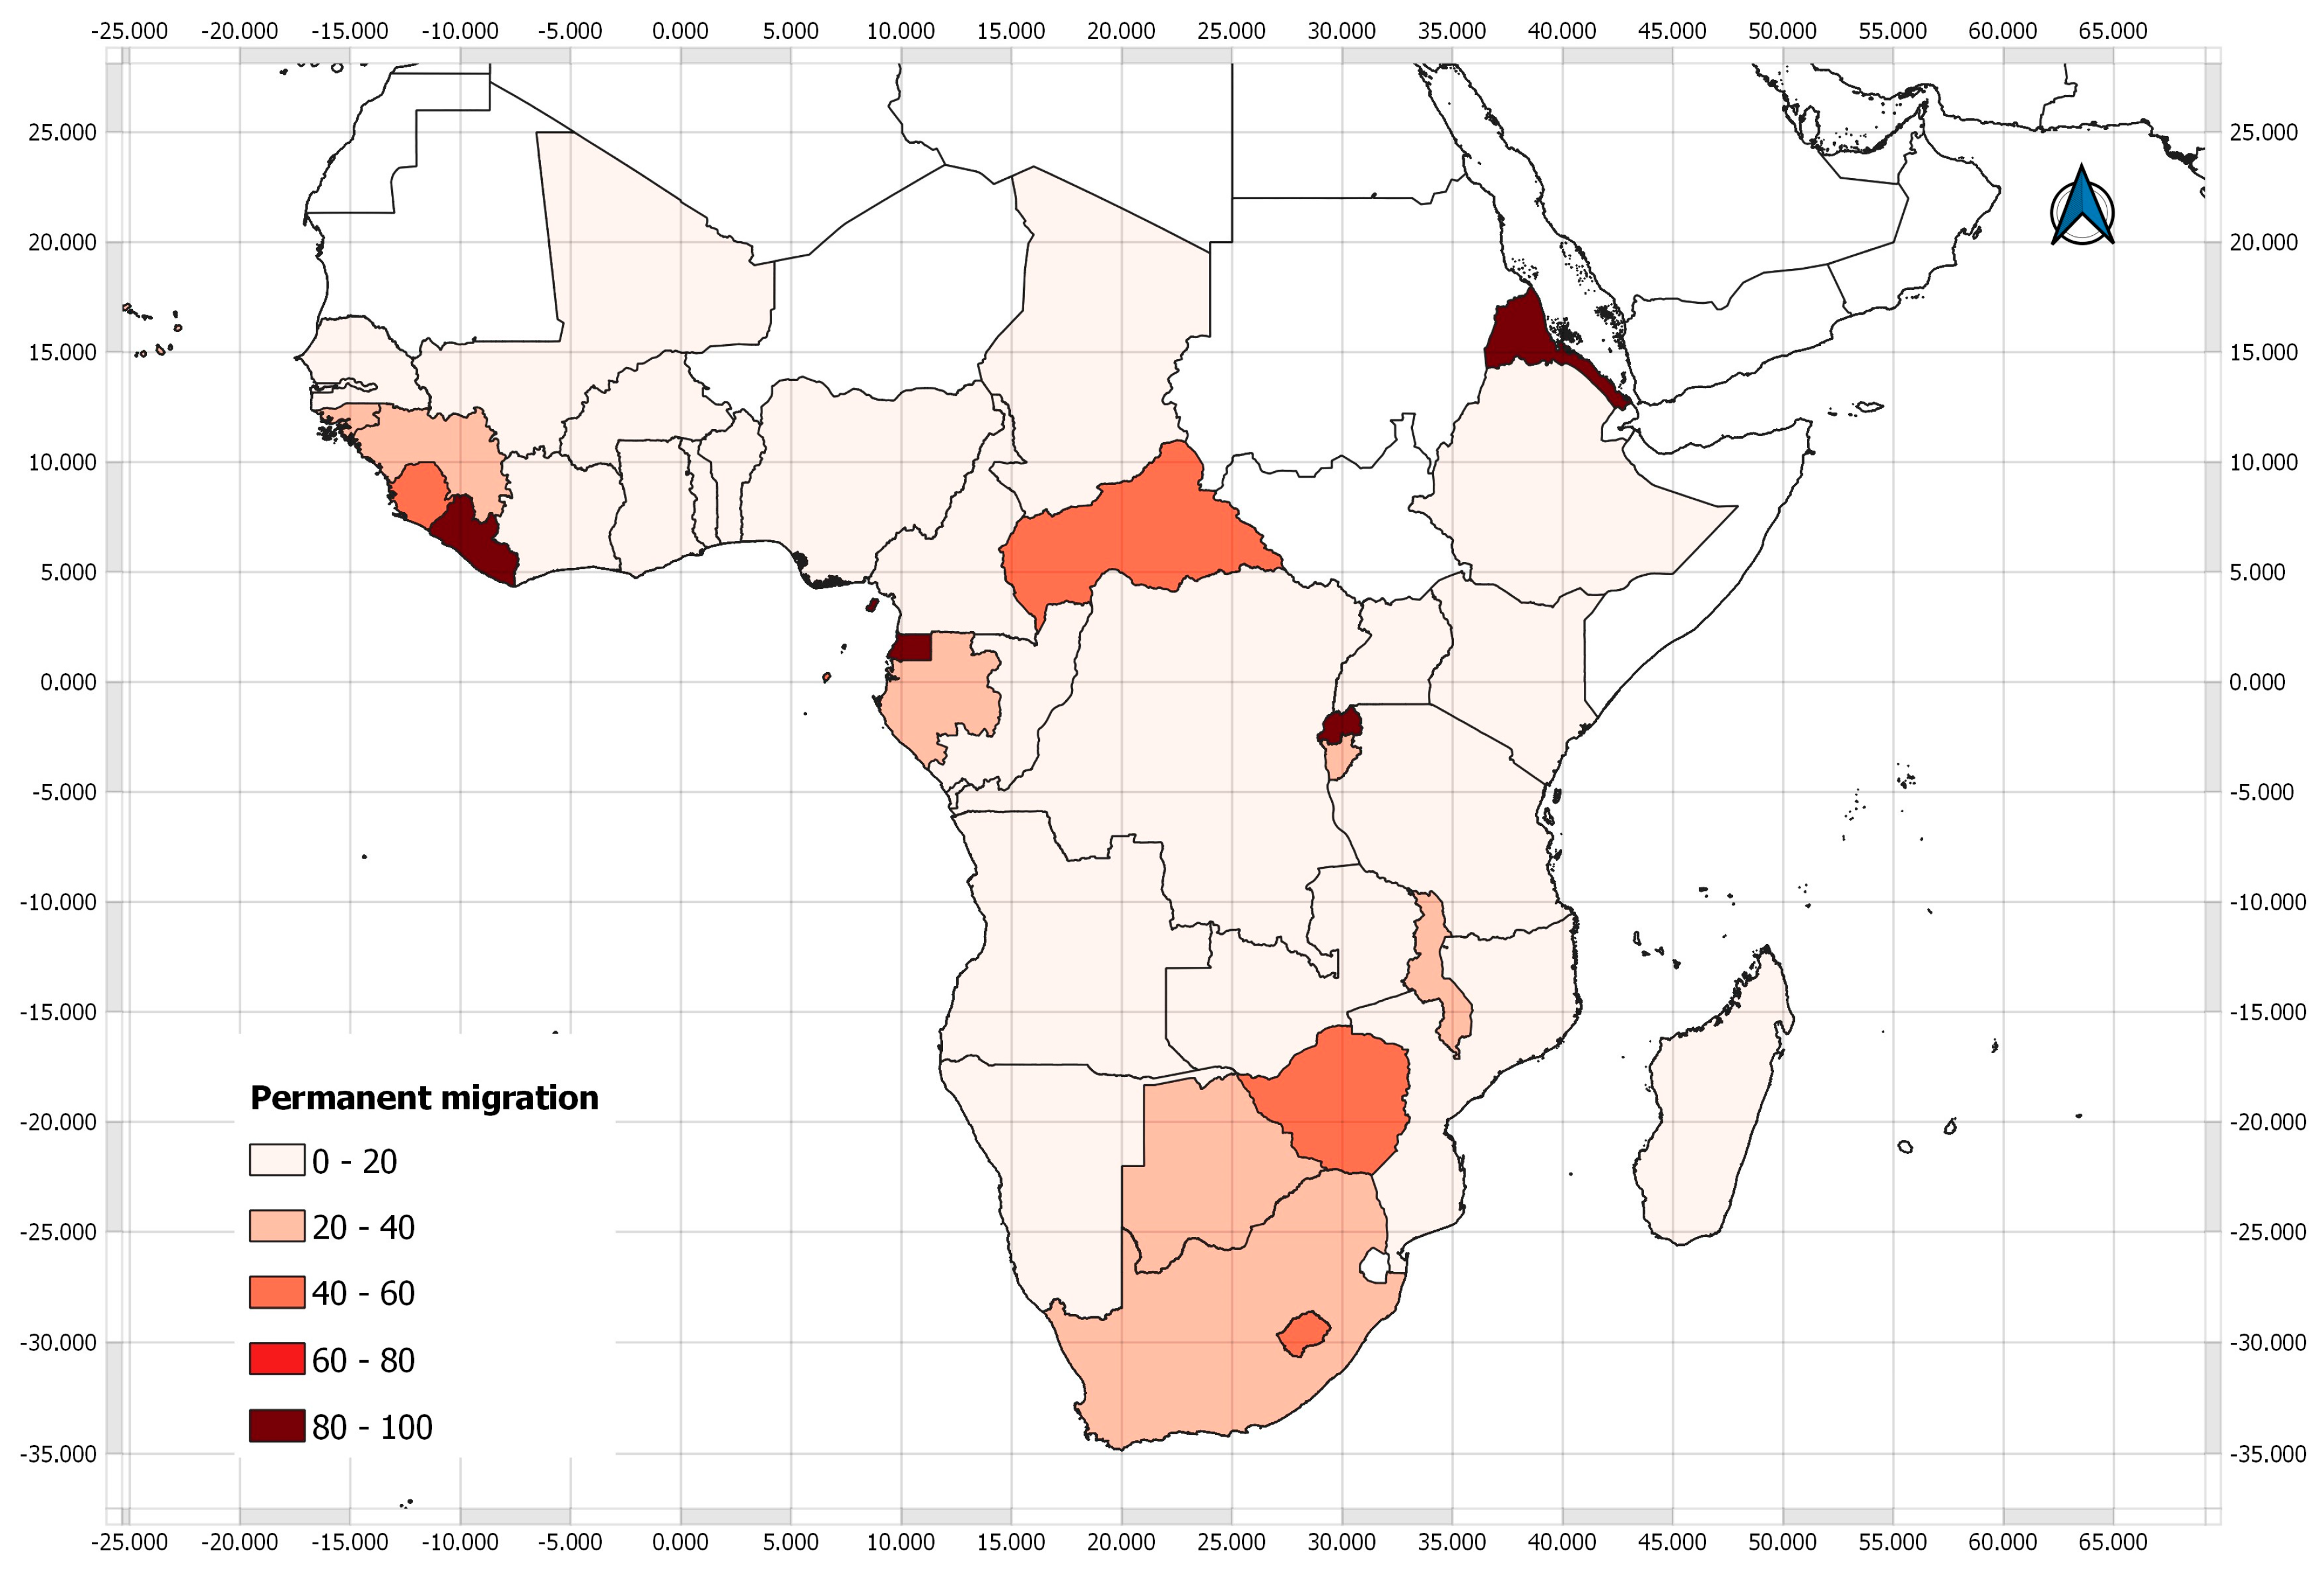
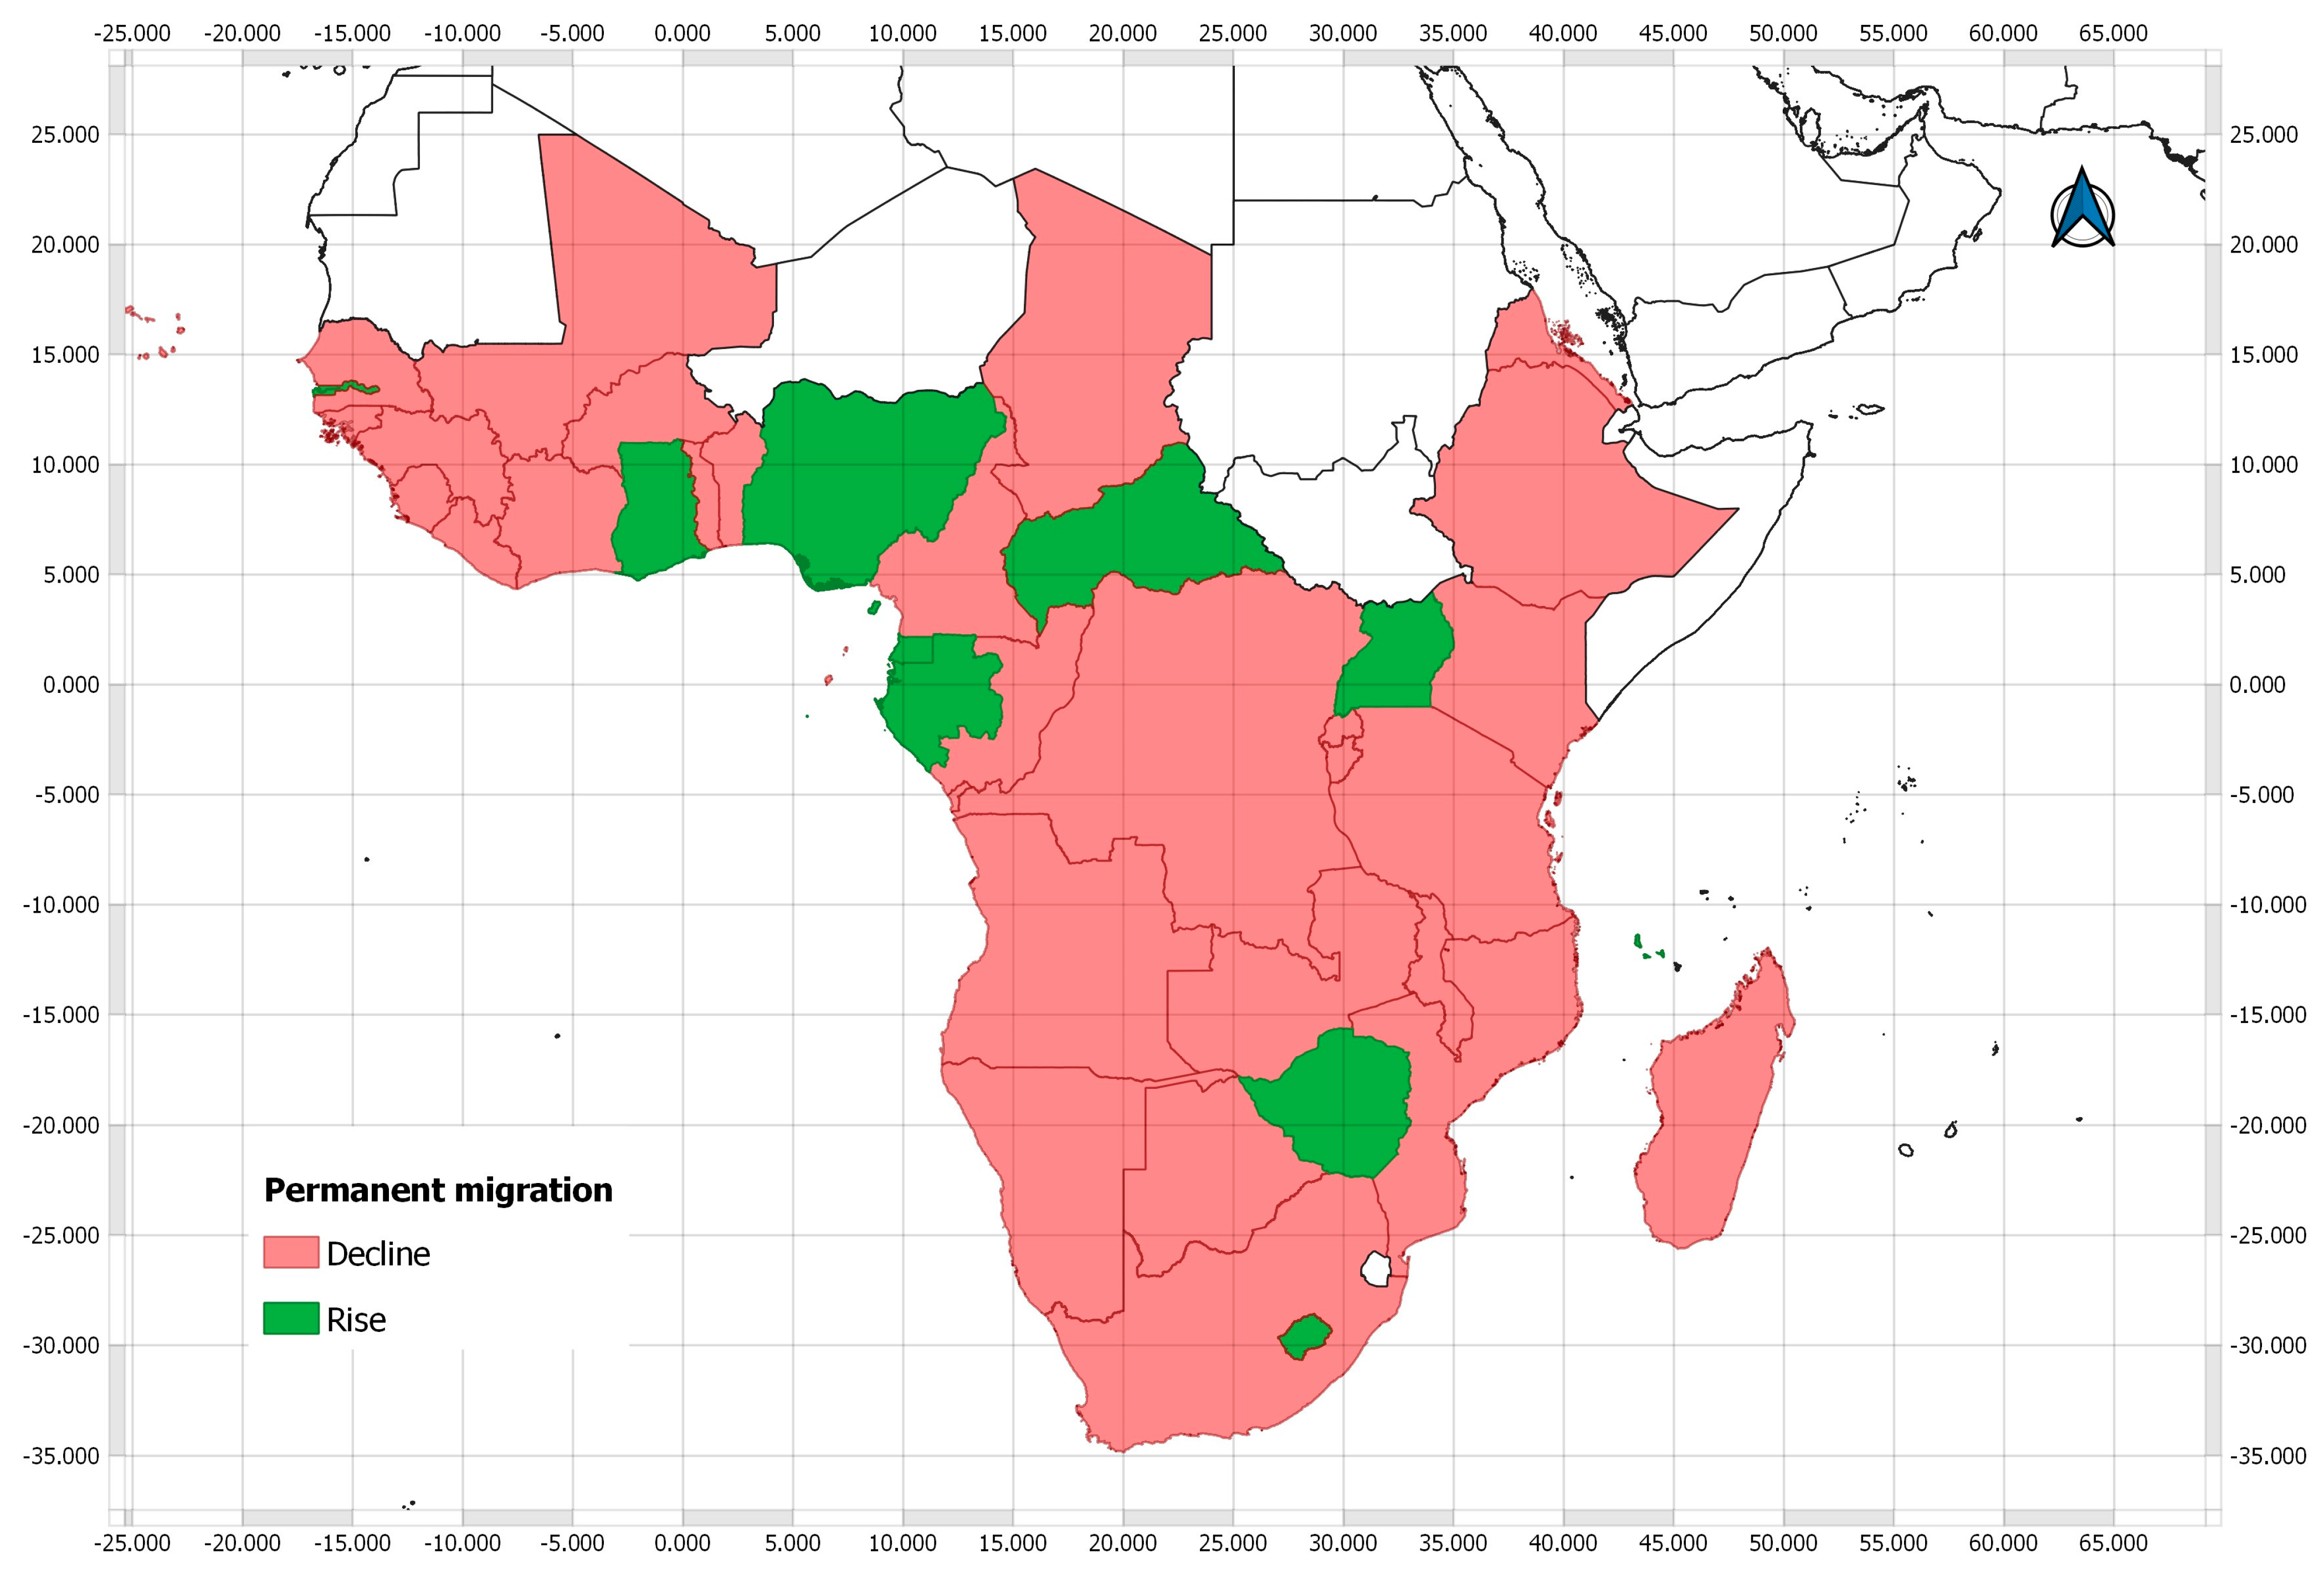
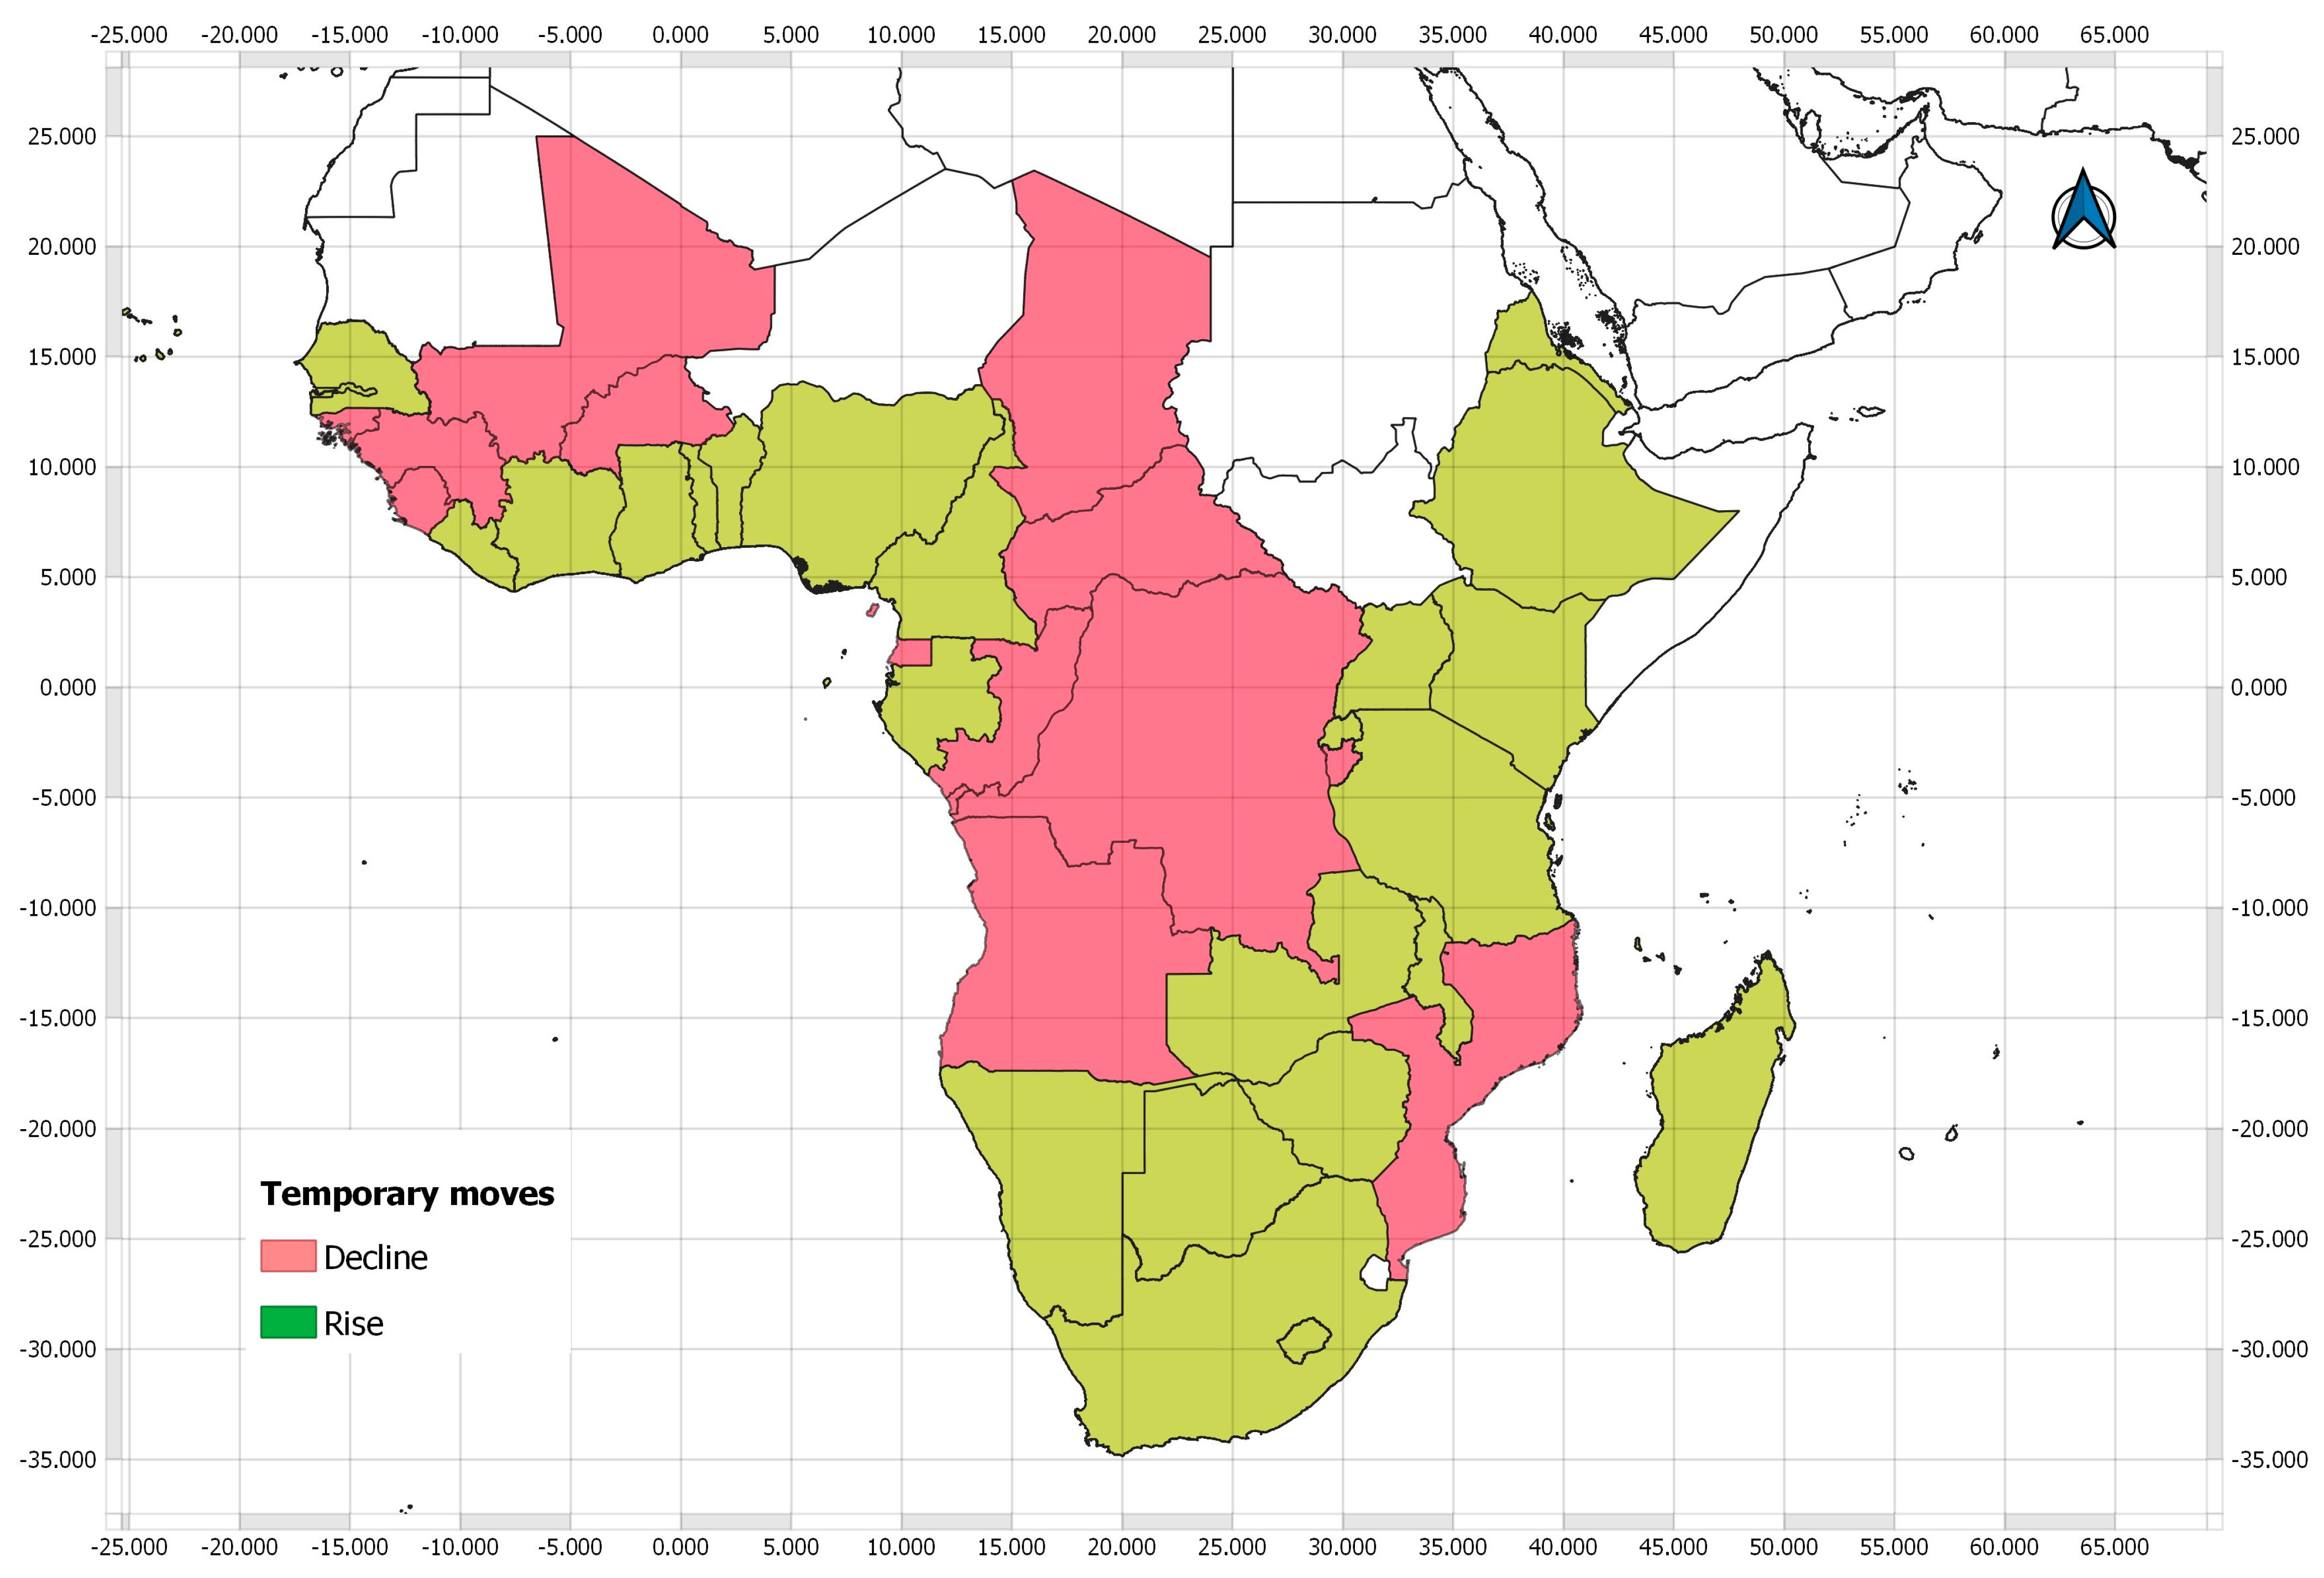
As shown in Figure 3 and Figure 4, Southern African countries neighbouring South Arica demonstrated higher mobility, especially in temporary moves. In contrast, the Horn of Africa and Central and West Africa had significant permanent migration (Figure 3). During the research period, most SSA countries experienced a decline in permanent migration (Figure 5). Countries like the Central African Republic, Comoros, Equatorial Guinea, Gabon, Gambia, Ghana, Lesotho, Nigeria, Zimbabwe, and Uganda had increased permanent migration in temperature extremes but it decreased in wet extremes (Table S1). It indicates the potential effects of temperature extremes and wet extremes on permanent migration. The temporary moves of West Africa, East Africa, and Southern Africa increased (Figure 6). In contrast, they decreased in Central African countries like Angola, the Central African Republic, Chad, Congo, the Democratic Republic of the Congo, and Equatorial Guinea, with an insignificant decline in dry extremes (Table S2). The results imply the divergent and complex effects of climatic extremes on temporary cross-border moves and permanent migration.
In addition, the results imply that climatic and socioeconomic conditions affect the human mobility of SSA countries. It seems that low economic wealth (i.e., GDP per capita) is the critical constraint on SSA’s human mobility. As shown in Table 2, the twenty-eight countries assigned to Cluster 2 ‘Low mobility’ had a mean value of GDP per capita lower than the average of all forty countries. A higher mean value of GDP per capita was associated with a higher level of mobility, either Cluster 1 ‘High temporary moves’ or Cluster 4 ‘High permanent migration’. Political stability and the absence of violence presented divergent effects on human mobility. High temporary moves accompanied a high level of political stability and the absence of violence, whereas high permanent migration had a low level of political stability and the absence of violence. In addition, countries with a higher food supply (i.e., average dietary energy supply adequacy) were less mobile. It indicates that food supply, political stability, and conflict may play a critical role in SSA’s human mobility [56,57,58]. Climatic extremes exerted variant effects on human mobility. Most SSA countries assigned to Cluster 2 ‘Low mobility’ experienced high climatic extremes. High temporary moves accompanied high temperature extremes but low wet extremes, while high permanent migration had low temperature extremes. It underlines the complexity of climate effects on human mobility [59,60] and implies that climatic disasters like a drought and flood may generally reduce SSA’s international mobility. Migrant networks may promote permanent migration but lead to low temporary moves.

3.2. Climatic and Socioeconomic Effects on Human Mobility

In SSA, climatic and socioeconomic conditions significantly affected human mobility but differed for temporary cross-border moves and permanent migration. Six of the eight variables that had significant effects (ρ value < 0.05) were identified by taking Equations (1) and (2) (Table 3). Regarding SSA’s permanent migration, the results show that dry extremes had positive effects, whereas wet extremes exerted adverse effects. It can be explained by the fact that a drought is a major disaster for SSA’s agricultural production, affecting population movements through food and water security [61,62]. Floods may trap people, especially those lacking capacity and capital to move [63,64]. For instance, the emergence of malaria epidemics triggered by floods may reduce human mobility and trap the most vulnerable groups like women and children [65]. GDP per capita and migrant networks stimulated permanent migration, but an SSA country’s political stability and food supply reduced the permanent migration. Migrant networks and economic wealth can enable people to move for better welfare and living environment by reducing migration costs, providing financial support, and facilitating information and access acquisition [66,67]. Starvation and food insecurity, government and political instability, civil and violent conflicts, and gender-based and inter-communal violence were still the biggest challenges for SSA countries [68,69]. They were the critical pushing factors for an SSA country’s permanent migration. In addition, the increase in temperature variations and the share of the young population had positive but insignificant effects on permanent migration compared to dry and wet extremes and socioeconomic determinants.
SSA’s temporary moves decreased with an increase in dry and wet extremes but increased along with an increase in temperature variations. Drought and floods may reduce an SSA country’s human mobility in cross-border trips and air transport. The positive relationship between temporary moves and temperature variations is probably due to global warming and increasing human mobility [70]. Unlike permanent migration, SSA’s temporary moves received insignificant effects from GDP per capita and political stability but decreased with an increase in a country’s 15- to 34-year-old population. The low level of SSA’s economic wealth and political stability can explain the insignificant effects of limited impacts on temporary cross-border trips and air transport. Although 38% of SSA’s youth are willing to move, high youth unemployment and working poverty are problems for young people to initiate cross-border trips, air transport, or even social mobility [71,72]. Like permanent migration, migrant networks stimulated SSA’s temporary moves, whereas food supply had an adverse effect. It confirms that food insecurity and migrant networks were critical factors for SSA’s human mobility. The results indicate that SSA’s permanent migration and temporary moves had different critical climatic and socioeconomic determinants and even obtained distinct effects from the same determinant. Therefore, it is necessary to refine the analysis of human mobility patterns in a future study by specifying and clarifying the type (e.g., international migration and urban-–rural movement), frequency (e.g., annual, monthly, and seasonal), direction (e.g., bilateral, triangle, and circular), and duration (e.g., permanent and temporary).
The estimates of SSA’s permanent migration and temporary moves shown in Table 3 were derived from NBM and OLS regression models. The NBM and OLS estimates are consistent, demonstrating the models’ robustness. An SSA country’s human mobility was affected by climate extremes. Dry and wet extremes demonstrated significant but different effects on permanent migration and temporary moves. In particular, wet extremes like floods impaired human mobility, while dry extremes like a drought promoted permanent migration but reduced temporary moves. Also, extreme temperature variations increased SSA’s human mobility, but such an effect was less significant. It is worth noting the complexity and variability of climate change’s effects on various patterns and forms of human mobility. It also implies the difficulty of simulating and predicting human mobility under climate change. Similarly, SSA’s permanent migration and temporary moves demonstrated different socioeconomic determinants with variant effects. The results indicate the heterogeneity of the latent socioeconomic matrix and population movements in SSA countries. Thus, the definition of human mobility, classification of mobility types and patterns, and description of mobility contexts, components, features, differences, and diversity shall be refined in future studies.

3.3. Implication for Sustainable Development in a Post-Pandemic Era

As shown in previous results, human mobility is embedded in the process of environmental change, economic growth, political conflicts, and social and cultural evolutions [9]. The nexus between human mobility and the environmental, social, economic, and political dimensions defines the resilience of individuals and communities [15] and contributes to sustainable development [11,13]. The effective management of human mobility can avoid disasters and reduce risk while improving people’s capacity to understand and cope with conflict and promote peace. Nevertheless, we found that fostering effective management requires rethinking the underlying concept of human mobility (Figure 1), especially during the COVID-19 pandemic.
COVID-19 has stopped mobility and has affected human migration globally since 2020. It may increase people’s exposure and vulnerability to hazards and conflict of all kinds and undermine the coping capacity and peace-promoting potential of communities and societies. Human migration and other forms of mobility can thus be investigated as a consequence or cause of changes or even disasters and as a positive force of sustainability management (e.g., disaster risk reduction) and resilience building (e.g., adaptation and transformation). In this paper, the findings call for specific attention to rethink human mobility through categories and patterns, needs and capacities, and management schemes.
In the context of disaster risk reduction and resilience building, human mobility shall be defined and measured by the level of disaster risk and vulnerability of people, unlike usual categories such as cross-border migration; temporary displacement and planned relocation [73]; forced, reluctant, and voluntary movements [74]; economic migrants and refugees [75]; and internal, international, circular, or return migration [76]. In this process, people’s needs and capacities to move or stay and cause changes shall be considered because people need access to socioeconomic and cultural resources and the option and specific capacity to move or stay [7,11,40]. People’s needs and capacities determine their mobility, i.e., whether, when, how, and where to move freely. It requires studying human mobility at national or global scales with particular concerns about ‘local’ needs and capacities [5]. In addition, management schemes shape human migration and mobility, affecting the status of resilience building and risk reduction while causing changes in people’s vulnerability and level of disaster risk. National governments shall thus look for effective management from future growth and governance scenarios [3] in collaboration with local partners like non-government organisations, universities, and migrant associations [77]. Effective management can include migration policies and supporting approaches, which increase human mobility and promote sustainable transitions by decreasing individuals’ vulnerability and risk of future disasters and promoting a community’s risk-reduction and resilience-building capacity [9,78].

4. Conclusions

We conclude that SSA human mobility varies across counties of different climatic–socioeconomic contexts. Most of these forty SSA countries had low human mobility, with distinct spatial distribution between temporary moves and permanent migration. Southern African countries neighbouring South Africa demonstrated higher mobility, especially in temporary moves. In contrast, the Horn of Africa and Central and West Africa had significant permanent migration. In the research period, SSA demonstrated a significant decline in permanent migration and an increase in temporary moves in West Africa, East Africa, and Southern Africa. Climatic and socioeconomic conditions significantly affected human mobility but differed for temporary moves and permanent migration. The permanent migration increased with a drought, economic wealth, and migrant networks but decreased with floods, political stability, and food supply. In contrast, the temporary moves reduced with floods, a drought, and food supply but increased with high temperature variations.
The findings suggest that food insecurity and migrant networks were critical factors for an SSA country’s human mobility. Also, SSA’s permanent migration and temporary moves demonstrated different climatic and socioeconomic determinants associated with distinct effects. The complexity and variability of climate change effects and the heterogeneity of SSA’s latent socioeconomic matrix and population movements imply the difficulty of simulating and predicting human mobility under climate change.
Complex thinking that embeds people in a nexus with environmental change, economic growth, political conflicts, and social and cultural evolutions can help frame human mobility through the lens of risk reduction and sustainability management. In future work, we should further define and measure human mobility by the level of people’s disaster risk and vulnerability, concerning people’s needs for socioeconomic and cultural resources and their capacities to more or stay, addressing migration management issues, and providing support tools and approaches. The data collection shall integrate transdisciplinary and multiple-scale surveys and measurements in specific spatial and temporal settings for particular research agendas and measurement issues.

Supplementary Materials

The following supporting information can be downloaded at: https://www.mdpi.com/article/10.3390/su151511661/s1, Table S1: Changes in permanent migration and climatic-socio-economic conditions between 1995 and 2020. Table S2: Changes in temporary moves and climatic-socio-economic conditions between 2011 and 2016. Table S3: Models only include the significant factors (ρ value < 0.05) to test the consistency of the results shown in Table 3. Table S4: Variance inflation factor (VIF) to test multicollinearity of the regression models shown in Table 3. Figure S1: Climate extremes in SSA countries from 1990 to 2018. Figure S2: Cluster dendrogram. Figure S3: Cluster plot of forty sub-Saharan African countries (referring to Table 2).

Author Contributions

Conceptualization, Q.L.; Formal analysis, Q.L.; Resources, C.S.; Data curation, Q.L.; Writing—original draft, Q.L.; Writing—review & editing, C.S. All authors have read and agreed to the published version of the manuscript.

Funding

This work was supported by the Deutsche Forschungsgemeinschaft (DFG, German Research Foundation) under Germany’s Excellence Strategy—EXC 2052/1—390713894, and funded by the Deutsche Forschungsgemeinschaft (DFG, German Research Foundation)—491183248 and the Open Access Publishing Fund of the University of Bayreuth.

Institutional Review Board Statement

This article does not contain any studies with human participants performed by any of the authors.

Informed Consent Statement

This article does not contain any studies with human participants performed by any of the authors.

Data Availability Statement

Correspondence and requests for materials should be addressed to the authors.

Conflicts of Interest

The authors declare no conflict of interest.

References

  1. United Nations Statistics Division. Global Indicator Framework for the Sustainable Development Goals and Targets of the 2030 Agenda for Sustainable Development Report No. A/RES/71/313; United Nations Statistics Division: New York, NY, USA, 2017. [Google Scholar]
  2. Hoffmann, R.; Šedová, B.; Vinke, K. Improving the Evidence Base: A Methodological Review of the Quantitative Climate Migration Literature. Glob. Environ. Chang. 2021, 71, 102367. [Google Scholar] [CrossRef]
  3. Black, R.; Adger, W.N.; Arnell, N.W.; Dercon, S.; Geddes, A.; Thomas, D. The Effect of Environmental Change on Human Migration. Glob. Environ. Chang. 2011, 21, S3–S11. [Google Scholar] [CrossRef]
  4. Boas, I.; Kloppenburg, S.; van Leeuwen, J.; Lamers, M. Environmental Mobilities: An Alternative Lens to Global Environmental Governance. Glob. Environ. Politics 2018, 18, 107–126. [Google Scholar] [CrossRef]
  5. Sheller, M.; Urry, J. The New Mobilities Paradigm. Environ. Plan. Econ. Space 2006, 38, 207–226. [Google Scholar] [CrossRef] [Green Version]
  6. Sheller, M. Automotive Emotions: Feeling the Car. Theory Cult. Soc. 2004, 21, 221–242. [Google Scholar] [CrossRef]
  7. de Haas, H. Paradoxes of Migration and Development. In Routledge Handbook of Migration and Development, 1st ed.; Bastia, T., Skeldon, R., Eds.; Routledge: New York, NY, USA, 2020; pp. 17–31. ISBN 978-1-315-27690-8. [Google Scholar]
  8. Salazar, N.B. Towards an Anthropology of Cultural Mobilities. Crossings J. Migr. Cult. 2010, 1, 53–68. [Google Scholar] [CrossRef] [Green Version]
  9. Guadagno, L. Human Mobility in a Socio-Environmental Context: Complex Effects on Environmental Risk. In Identifying Emerging Issues in Disaster Risk Reduction, Migration, Climate Change and Sustainable Development; Sudmeier-Rieux, K., Fernández, M., Penna, I.M., Jaboyedoff, M., Gaillard, J.C., Eds.; Springer International Publishing: Cham, Switzerland, 2017; pp. 13–31. ISBN 978-3-319-33878-1. [Google Scholar]
  10. Li, Q.; Samimi, C. Sub-Saharan Africa’s International Migration and Sustainable Development under Climate Change. In Proceedings of the EGU22, Vienna, Austria, 23–27 May 2022; Volume 11529. [Google Scholar]
  11. Li, Q.; Samimi, C. Sub-Saharan Africa’s International Migration Constrains Its Sustainable Development under Climate Change. Sustain. Sci. 2022, 17, 1873–1897. [Google Scholar] [CrossRef]
  12. IOM’s GMDAC Migration and Development, Sustainable Development Goals. Available online: https://migrationdataportal.org/themes/sustainable-development-goals-sdgs-0 (accessed on 20 September 2020).
  13. Deutsche Gesellschaft für Internationale Zusammenarbeit (GIZ). GmbH Human Mobility in the Context of Climate Change: Migration, Displacement and Planned Relocation in the Eastern Caribbean, the Pacific and the Philippines; Deutsche Gesellschaft für Internationale Zusammenarbeit (GIZ): Bonn, Germany, 2019. [Google Scholar]
  14. Franco Gavonel, M.; Adger, W.N.; Safra de Campos, R.; Boyd, E.; Carr, E.R.; Fábos, A.; Fransen, S.; Jolivet, D.; Zickgraf, C.; Codjoe, S.N.; et al. The Migration-Sustainability Paradox: Transformations in Mobile Worlds. Curr. Opin. Environ. Sustain. 2021, 49, 98–109. [Google Scholar] [CrossRef]
  15. International Organization for Migration. Human Mobility Shaping Vulnerability and Resilience to Disasters: Migration, Displacement and Disaster Risk Reduction; International Organization for Migration: Geneva, Switzerland, 2014. [Google Scholar]
  16. United Nations General Assembly. United Nations Transforming Our World: The 2030 Agenda for Sustainable Development; United Nations General Assembly: New York, NY, USA, 2015. [Google Scholar]
  17. Arnold, R.D.; Wade, J.P. A Definition of Systems Thinking: A Systems Approach. Procedia Comput. Sci. 2015, 44, 669–678. [Google Scholar] [CrossRef] [Green Version]
  18. Assaraf, O.B.-Z.; Orion, N. Development of System Thinking Skills in the Context of Earth System Education. J. Res. Sci. Teach. 2005, 42, 518–560. [Google Scholar] [CrossRef]
  19. Stalter, A.M.; Phillips, J.M.; Ruggiero, J.S.; Scardaville, D.L.; Merriam, D.; Dolansky, M.A.; Goldschmidt, K.A.; Wiggs, C.M.; Winegardner, S. A Concept Analysis of Systems Thinking. Nurs. Forum 2017, 52, 323–330. [Google Scholar] [CrossRef] [PubMed]
  20. Bell, M.; Ward, G. Comparing Temporary Mobility with Permanent Migration. Tour. Geogr. 2000, 2, 87–107. [Google Scholar] [CrossRef]
  21. Wiederkehr, C.; Schröter, M.; Adams, H.; Seppelt, R.; Hermans, K. How Does Nature Contribute to Human Mobility? A Conceptual Framework and Qualitative Analysis. Ecol. Soc. 2019, 24, art31. [Google Scholar] [CrossRef]
  22. Li, Q.; Ma, H.; Xu, Z.; Feng, H.; Bellingrath-Kimura, S. Balancing Socioeconomic Development with Ecological Conservation towards Rural Sustainability: A Cas. Int. J. Sustain. Dev. World Ecol. 2021, 29, 246–262. [Google Scholar] [CrossRef]
  23. De Haas, H. International Migration, Remittances and Development: Myths and Facts. Third World Q. 2005, 26, 1269–1284. [Google Scholar] [CrossRef]
  24. Guadagno, L. Human Mobility in the Sendai Framework for Disaster Risk Reduction. Int. J. Disaster Risk Sci. 2016, 7, 30–40. [Google Scholar] [CrossRef] [Green Version]
  25. Boas, I.; Farbotko, C.; Adams, H.; Sterly, H.; Bush, S.; van der Geest, K.; Wiegel, H.; Ashraf, H.; Baldwin, A.; Bettini, G.; et al. Climate Migration Myths. Nat. Clim. Chang. 2019, 9, 901–903. [Google Scholar] [CrossRef] [Green Version]
  26. Disney, G.; Wiśniowski, A.; Forster, J.J.; Smith, P.W.F.; Bijak, J. Evaluation of Existing Migration Forecasting Methods and Models. In Report for the Migration Advisory Committee: Commissioned Research; ESRC Centre for Population Change, University of Southampton: Southampton, UK, 2015; p. 66. [Google Scholar]
  27. Li, Z.; Huang, X.; Hu, T.; Ning, H.; Ye, X.; Huang, B.; Li, X. ODT FLOW: Extracting, Analyzing, and Sharing Multi-Source Multi-Scale Human Mobility. PLoS ONE 2021, 16, e0255259. [Google Scholar] [CrossRef]
  28. Ruktanonchai, N.W.; Ruktanonchai, C.W.; Floyd, J.R.; Tatem, A.J. Using Google Location History Data to Quantify Fine-Scale Human Mobility. Int. J. Health Geogr. 2018, 17, 28. [Google Scholar] [CrossRef] [Green Version]
  29. Willekens, F. Monitoring International Migration Flows in Europe: Towards a Statistical Data Base Combining Data from Different Sources. Eur. J. Popul. 1994, 10, 1–42. [Google Scholar] [CrossRef]
  30. Afifi, T.; Milan, A.; Etzold, B.; Schraven, B.; Rademacher-Schulz, C.; Sakdapolrak, P.; Reif, A.; van der Geest, K.; Warner, K. Human Mobility in Response to Rainfall Variability: Opportunities for Migration as a Successful Adaptation Strategy in Eight Case Studies. Migr. Dev. 2016, 5, 254–274. [Google Scholar] [CrossRef]
  31. Borderon, M.; Sakdapolrak, P.; Muttarak, R.; Kebede, E.; Pagogna, R.; Sporer, E. Migration Influenced by Environmental Change in Africa: A Systematic Review of Empirical Evidence. Demogr. Res. 2019, 41, 491–544. [Google Scholar] [CrossRef] [Green Version]
  32. Grau, H.R.; Aide, T.M. Are Rural–Urban Migration and Sustainable Development Compatible in Mountain Systems? Mt. Res. Dev. 2007, 27, 119–123. [Google Scholar] [CrossRef] [Green Version]
  33. Yang, X.; Zhao, Z.; Lu, S. Exploring Spatial-Temporal Patterns of Urban Human Mobility Hotspots. Sustainability 2016, 8, 674. [Google Scholar] [CrossRef] [Green Version]
  34. Barbosa, H.; Hazarie, S.; Dickinson, B.; Bassolas, A.; Frank, A.; Kautz, H.; Sadilek, A.; Ramasco, J.J.; Ghoshal, G. Uncovering the Socioeconomic Facets of Human Mobility. Sci. Rep. 2021, 11, 8616. [Google Scholar] [CrossRef]
  35. Deng, H.; Aldrich, D.P.; Danziger, M.M.; Gao, J.; Phillips, N.E.; Cornelius, S.P.; Wang, Q.R. High-Resolution Human Mobility Data Reveal Race and Wealth Disparities in Disaster Evacuation Patterns. Humanit. Soc. Sci. Commun. 2021, 8, 144. [Google Scholar] [CrossRef]
  36. Wang, Q.; Phillips, N.E.; Small, M.L.; Sampson, R.J. Urban Mobility and Neighborhood Isolation in America’s 50 Largest Cities. Proc. Natl. Acad. Sci. USA 2018, 115, 7735–7740. [Google Scholar] [CrossRef] [Green Version]
  37. Pappalardo, L.; Pedreschi, D.; Smoreda, Z.; Giannotti, F. Using Big Data to Study the Link between Human Mobility and Socio-Economic Development. In Proceedings of the 2015 IEEE International Conference on Big Data (Big Data), Santa Clara, CA, USA, 29 October–1 November 2015; IEEE: Santa Clara, CA, USA, 2015; pp. 871–878. [Google Scholar]
  38. Lu, M.; Schmitz, O.; de Hoogh, K.; Hoek, G.; Li, Q.; Karssenberg, D. Integrating Statistical and Agent-Based Modelling for Activity-Based Ambient Air Pollution Exposure Assessment. Environ. Model. Softw. 2022, 158, 105555. [Google Scholar] [CrossRef]
  39. McAuliffe, M.; Khadria, B.; Bauloz, C. World Migration Report 2020; IOM: Geneva, Switzerland, 2019; ISBN 978-92-9068-789-4. [Google Scholar]
  40. Adger, W.N.; Crépin, A.-S.; Folke, C.; Ospina, D.; Chapin, F.S.; Segerson, K.; Seto, K.C.; Anderies, J.M.; Barrett, S.; Bennett, E.M.; et al. Urbanization, Migration, and Adaptation to Climate Change. One Earth 2020, 3, 396–399. [Google Scholar] [CrossRef]
  41. Chort, I.; de la Rupelle, M. Determinants of Mexico-U.S. Outward and Return Migration Flows: A State-Level Panel Data Analysis. Demography 2016, 53, 1453–1476. [Google Scholar] [CrossRef]
  42. Abel, G.J.; Brottrager, M.; Crespo Cuaresma, J.; Muttarak, R. Climate, Conflict and Forced Migration. Glob. Environ. Chang. 2019, 54, 239–249. [Google Scholar] [CrossRef]
  43. Mayda, A.M. International Migration: A Panel Data Analysis of the Determinants of Bilateral Flows. J. Popul. Econ. 2010, 23, 1249–1274. [Google Scholar] [CrossRef]
  44. Shi, G.; Lu, X.; Deng, Y.; Urpelainen, J.; Liu, L.-C.; Zhang, Z.; Wei, W.; Wang, H. Air Pollutant Emissions Induced by Population Migration in China. Environ. Sci. Technol. 2020, 54, 6308–6318. [Google Scholar] [CrossRef] [PubMed]
  45. United Nations International Migrant Stock 2019, Online Edition. Available online: https://www.un.org/en/development/desa/population/migration/data/estimates2/estimates19.asp (accessed on 15 April 2020).
  46. Recchi, E.; Deutschmann, E.; Vespe, M. Estimating Transnational Human Mobility on a Global Scale. SSRN Electron. J. 2019. [Google Scholar] [CrossRef] [Green Version]
  47. Food and Agriculture Organization of the United Nations, Rome, Italy. FAOSTAT. Available online: http://www.fao.org/faostat/en/#data (accessed on 1 September 2020).
  48. Blunden, J.; Arndt, D.S. State of the Climate in 2019. Bull. Am. Meteorol. Soc. 2020, 101, S1–S429. [Google Scholar] [CrossRef]
  49. van der Schrier, G.; Barichivich, J.; Briffa, K.R.; Jones, P.D. A ScPDSI-Based Global Data Set of Dry and Wet Spells for 1901-2009: Variations in the Self-Calibrating PDSI. J. Geophys. Res. Atmos. 2013, 118, 4025–4048. [Google Scholar] [CrossRef]
  50. The World Bank. World Development Indicators. Available online: https://databank.worldbank.org/reports.aspx?source=2&series=NY.GDP.PCAP.CD&country= (accessed on 1 May 2020).
  51. United Nations. World Population Prospects 2019, Online Edition. Available online: https://population.un.org/wpp/Download/Standard/Population/ (accessed on 10 April 2020).
  52. Mastrorillo, M.; Licker, R.; Bohra-Mishra, P.; Fagiolo, G.; Estes, L.D.; Oppenheimer, M. The Influence of Climate Variability on Internal Migration Flows in South Africa. Glob. Environ. Chang. 2016, 39, 155–169. [Google Scholar] [CrossRef]
  53. Maystadt, J.-F.; Ecker, O. Extreme Weather and Civil War: Does Drought Fuel Conflict in Somalia through Livestock Price Shocks? Am. J. Agric. Econ. 2014, 96, 1157–1182. [Google Scholar] [CrossRef]
  54. Mueller, V.; Sheriff, G.; Dou, X.; Gray, C. Temporary Migration and Climate Variation in Eastern Africa. World Dev. 2020, 126, 104704. [Google Scholar] [CrossRef]
  55. Gray, C.; Mueller, V. Drought and Population Mobility in Rural Ethiopia. World Dev. 2012, 40, 134–145. [Google Scholar] [CrossRef] [Green Version]
  56. Ginsburg, S. Securing Human Mobility in the Age of Risk: New Challenges for Travel, Migration, and Borders; Migration Policy Institute: Washington, DC, USA, 2010; ISBN 978-0-9742819-6-4. [Google Scholar]
  57. James Deaton, B.; Lipka, B. Political Instability and Food Security. J. Food Secur. 2015, 3, 29–33. [Google Scholar] [CrossRef]
  58. Kodack, M. The Complexity of the Climate Change, Migration and Conflict Nexus. Available online: https://climateandsecurity.org/2020/12/the-complexity-of-the-climate-change-migration-and-conflict-nexus/ (accessed on 20 September 2020).
  59. EU Science Hub Climate Migration: JRC Study Highlights Importance of Focusing on Local Adaptation Solutions. Available online: https://ec.europa.eu/jrc/en/news/climate-migration-jrc-study-highlights-importance-focusing-local-adaptation-solutions (accessed on 20 September 2020).
  60. Flavell, A.; Melde, S.; Milan, A. Migration, Environment and Climate Change: Impacts; Umweltbundesamt: Dessau-Roßlau, Germany, 2020; p. 48. [Google Scholar]
  61. FAO. The Impact of Disasters and Crises on Agriculture and Food Security: 2021; FAO: Rome, Italy, 2018; ISBN 978-92-5-134071-4. [Google Scholar]
  62. Shiferaw, B.; Tesfaye, K.; Kassie, M.; Abate, T.; Prasanna, B.M.; Menkir, A. Managing Vulnerability to Drought and Enhancing Livelihood Resilience in Sub-Saharan Africa: Technological, Institutional and Policy Options. Weather Clim. Extrem. 2014, 3, 67–79. [Google Scholar] [CrossRef] [Green Version]
  63. International Organization for Migration. Climate Change and Migration in Vulnerable Countries; International Organization for Migration: Geneva, Switzerland, 2019. [Google Scholar]
  64. Schraven, B.; Adaawen, S.; Rademacher-Schulz, C.; Segadlo, N. Climate Change Impacts on Human (Im-) Mobility in Sub-Saharan Africa; Deutsche Gesellschaft für Internationale Zusammenarbeit (GIZ) GmbH: Bonn, Germany, 2020. [Google Scholar]
  65. Elsanousi, Y.E.A.; Elmahi, A.S.; Pereira, I.; Debacker, M. Impact of the 2013 Floods on the Incidence of Malaria in Almanagil Locality, Gezira State, Sudan. PLoS Curr. 2018, 10. [Google Scholar] [CrossRef] [PubMed]
  66. Massey, D.S. The Social and Economic Origins of Immigration. Am. Acad. Polit. Soc. Sci. 1990, 510, 60–72. [Google Scholar] [CrossRef] [Green Version]
  67. van Meeteren, M.; Pereira, S. Beyond the ‘Migrant Network’? Exploring Assistance Received in the Migration of Brazilians to Portugal and the Netherlands. J. Int. Migr. Integr. 2018, 19, 925–944. [Google Scholar] [CrossRef] [Green Version]
  68. Africa Center for Strategic Studies. Food Insecurity Crisis Mounting in Africa. Available online: https://africacenter.org/spotlight/food-insecurity-crisis-mounting-africa/ (accessed on 20 September 2020).
  69. Allison, S. Conflict Is Still Africa’s Biggest Challenge in 2020. Available online: https://reliefweb.int/report/world/conflict-still-africa-s-biggest-challenge-2020 (accessed on 20 September 2020).
  70. Schwerdtle, P.N.; Bowen, K.; McMichael, C.; Sauerborn, R. Human Mobility and Health in a Warming World. J. Travel Med. 2019, 26, tay160. [Google Scholar] [CrossRef] [PubMed]
  71. International Labour Organization. Youth Unemployment Challenge Worsening in Africa. Available online: https://www.ilo.org/africa/media-centre/pr/WCMS_514566/lang--en/index.htm (accessed on 20 September 2020).
  72. Porter, G.; Hampshire, K.; Abane, A.; Tanle, A.; Munthali, A.; Robson, E.; Mashiri, M.; Maponya, G. Young People’s Transport and Mobility in Sub-Saharan Africa: The Gendered Journey to School. Doc. D’analisi Geogr. 2011, 57, 61–79. [Google Scholar] [CrossRef]
  73. International Organization for Migration. Mapping Human Mobility (Migration, Displacement and Planned Relocation) and Climate Change in International Processes, Policies and Legal Frameworks; International Organization for Migration: Geneva, Switzerland, 2018. [Google Scholar]
  74. Zhou, P. Forced, Reluctant, and Voluntary Migration. Available online: https://www.thoughtco.com/voluntary-migration-definition-1435455 (accessed on 20 September 2020).
  75. European Commission. Migration and Home Affairs. Available online: https://ec.europa.eu/home-affairs/pages/glossary/economic-migrant_en (accessed on 20 September 2020).
  76. United Nations Economic Commission for Europe. Defining and Measuring Circular Migration; United Nations Economic Commission for Europe: Luxembourg, 2016. [Google Scholar]
  77. Cheng, Y.; Liu, H.; Wang, S.; Cui, X.; Li, Q. Global Action on SDGs: Policy Review and Outlook in a Post-Pandemic Era. Sustainability 2021, 13, 6461. [Google Scholar] [CrossRef]
  78. Li, Q. Resilience Thinking as a System Approach to Promote China’s Sustainability Transitions. Sustainability 2020, 12, 5008. [Google Scholar] [CrossRef]
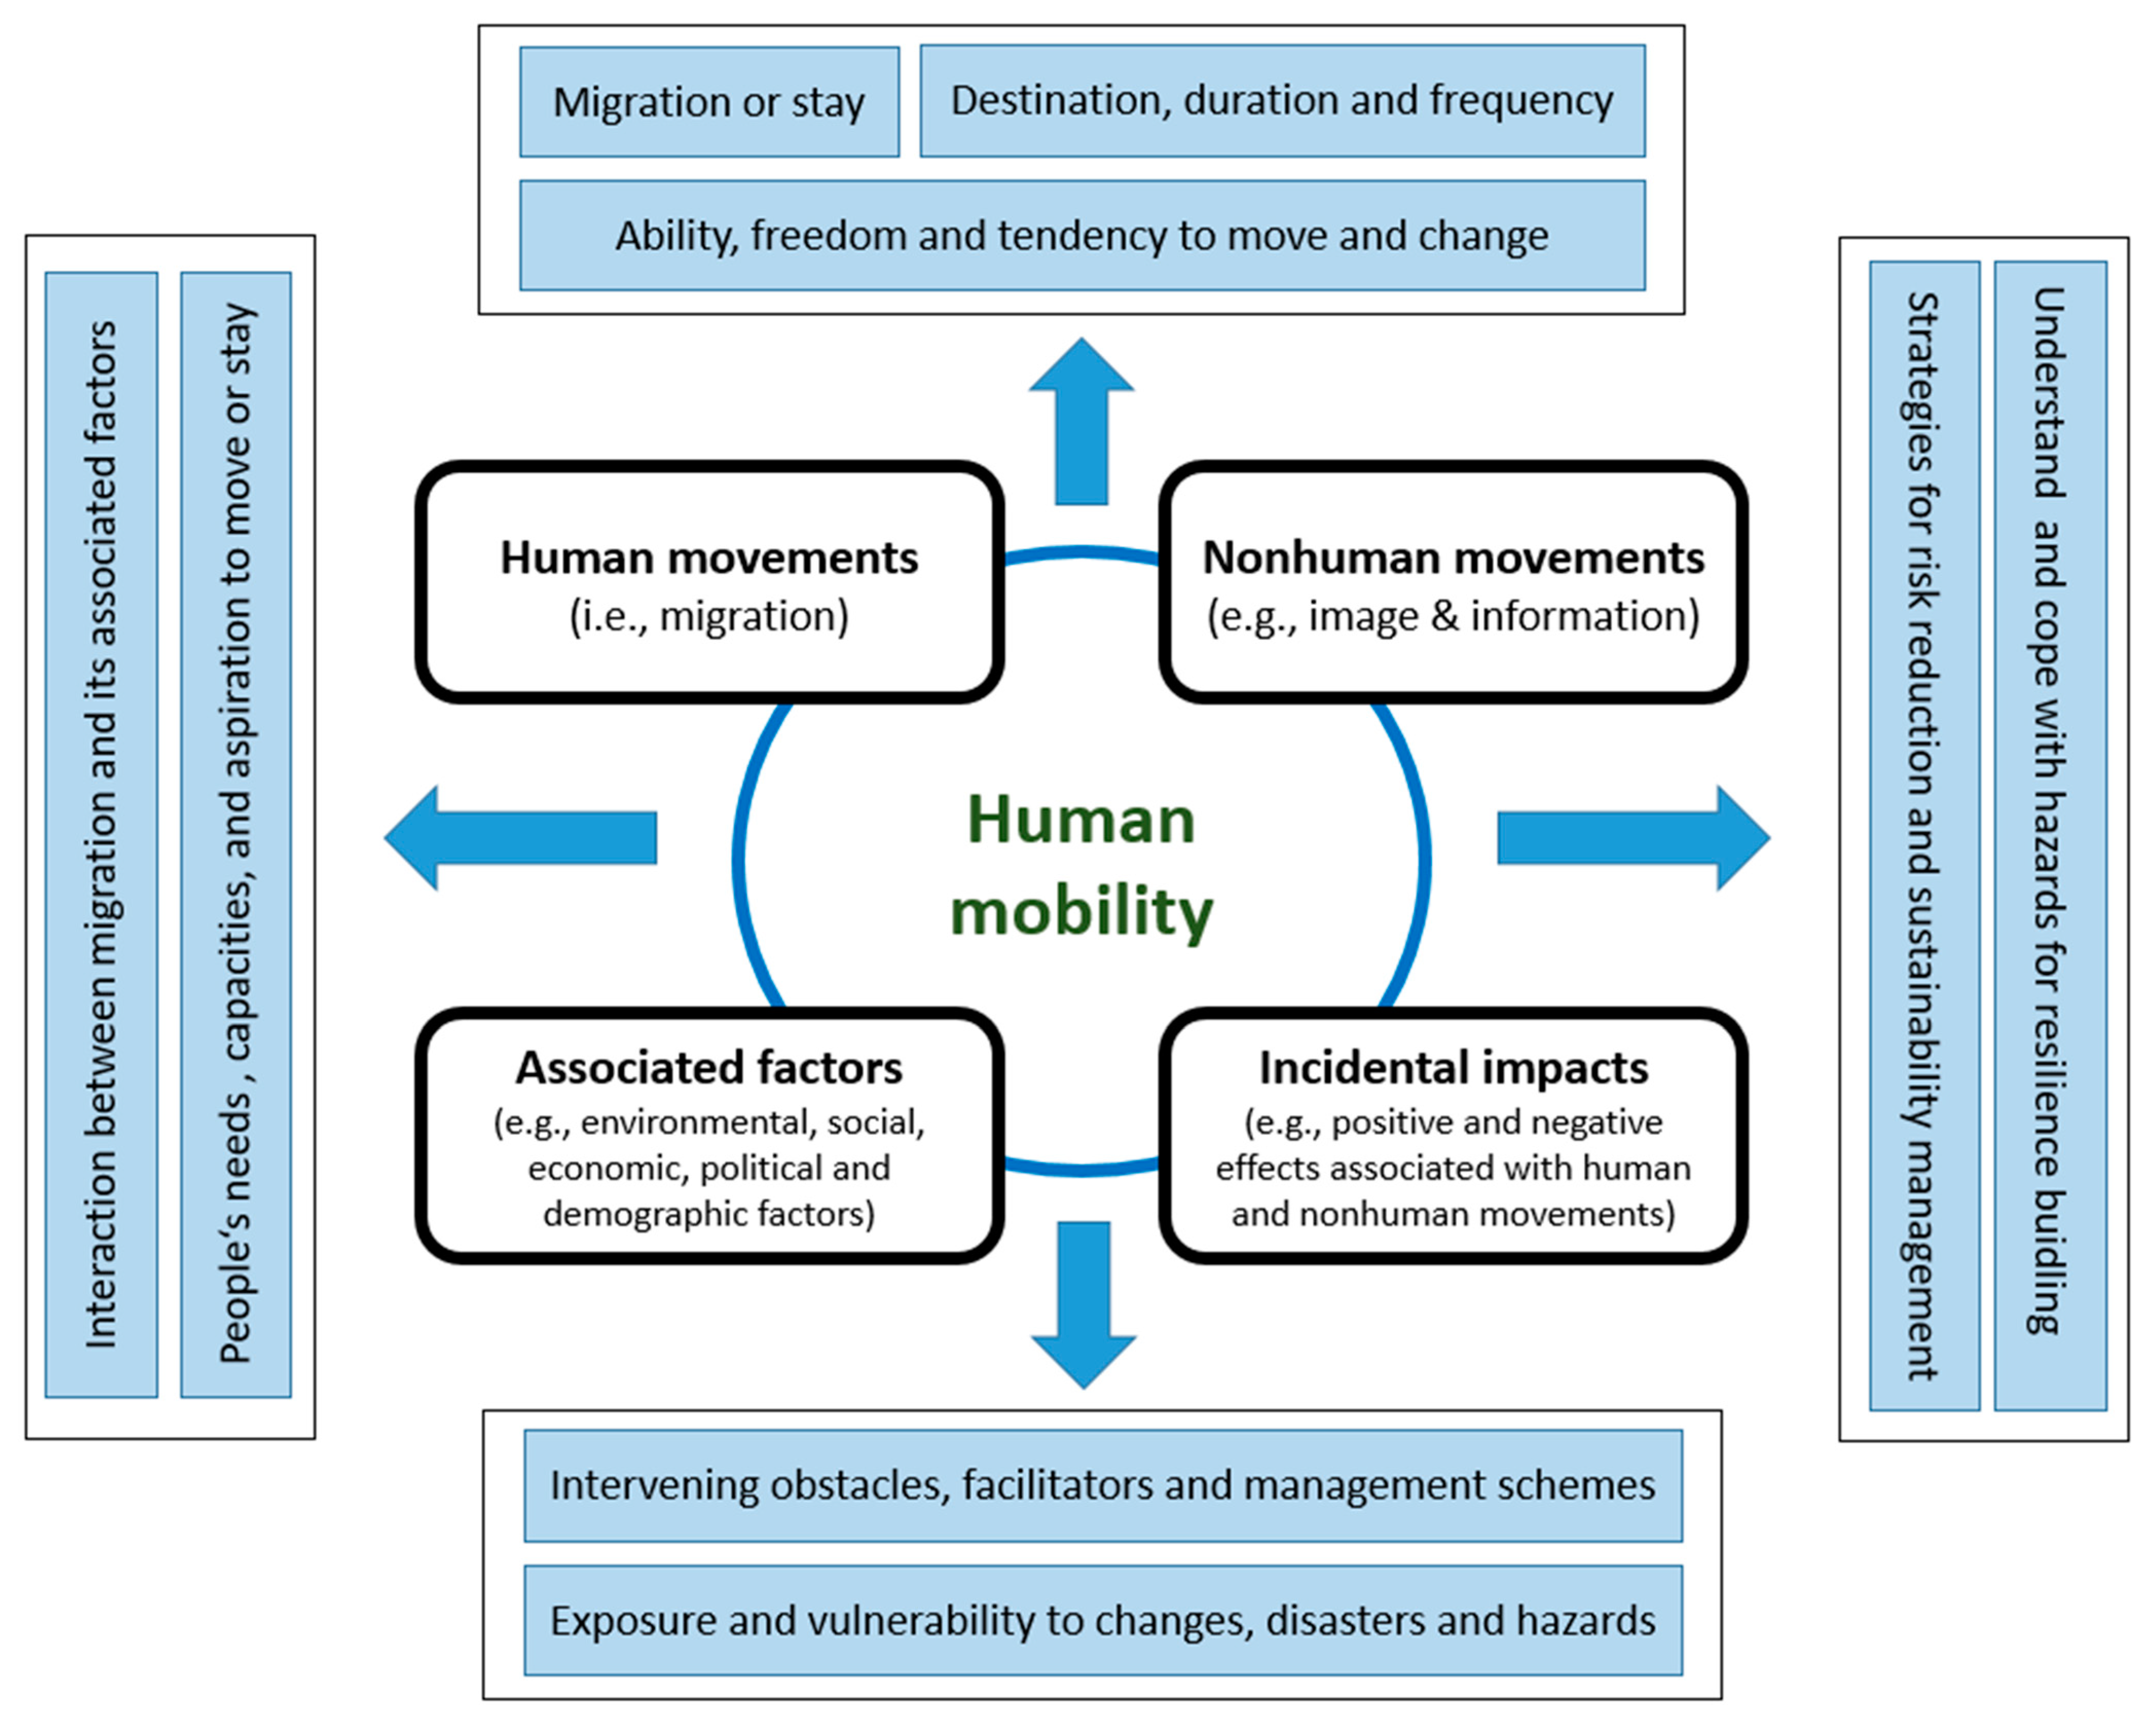
Figure 1. A conceptual framework for systems thinking of human mobility.
Sustainability 15 11661 g001
Figure 2. Mobility cluster of Sub-Saharan African countries.
Sustainability 15 11661 g002
Figure 3. Temporary moves of Sub-Saharan African countries from 2011 to 2016. The score is the share of international trips in the total population size of the origin country, ranging from 0 to 100.
Sustainability 15 11661 g003
Figure 4. Permanent migration of Sub-Saharan African countries from 1995 to 2020. The score is the share of permanent migration in the total population size of the origin country, ranging from 0 to 100.
Sustainability 15 11661 g004
Figure 5. Mobility variation of the permanent migration of Sub-Saharan African countries between 1995 and 2020.
Sustainability 15 11661 g005
Figure 6. Mobility variation of the temporary moves of Sub-Saharan African countries between 2011 and 2016.
Sustainability 15 11661 g006
Table 1. Descriptive statistics of the variables used for the mobility cluster and determinant analysis of Sub-Saharan African countries.
VariablesDescriptionMeanStandard
Deviation
Permanent migration
NMThe absolute value of net migration (i.e., the difference between the number of immigrants and the number of emigrants) of the SSA country from 1995 to 2020, in thousands [45].166.64247.59
NM_popThe absolute values of net migration are divided by the population size of the SSA country from 1995 to 2020, ranging from 0 to 1.0.020.03
Temporary moves
TripEstimates of the cross-border trips from the SSA country based on global tourism and air passenger traffic statistics from 2011 to 2016 [46].1,303,0502,458,749
Trip_popThe estimates of the cross-border trips are divided by the population size of the SSA country from 2011 to 2016.0.160.25
Climatic–socioeconomic variables
Dry extremesCount of dry extremes (i.e., self-calibrating Palmer Drought Severity Index < −4) within one country of every 5-year interval [48,49].618.451881.10
Wet extremesCount of wet extremes (self-calibrating Palmer Drought Severity Index > 4) within one country of every five-year interval [48,49].916.354131.46
Temperature extremesExtreme temperature variation is represented by the maximum value of the FAO temperature change of one country of every five-year interval, corresponding to the period 1951–1980 [48,49], in °C.1.110.41
GDP per capitaPer capita gross domestic product, in current USD [48,49].1379.322266.34
Political stability and absence of violencePerceptions of the likelihood that the government will be destabilised or overthrown by unconstitutional or violent means, including politically motivated violence and terrorism [48,49].−0.540.88
Average dietary energy supply adequacyDietary Energy Supply (DES) as a percentage of the Average Dietary Energy Requirement (ADER). Each country’s or region’s average supply of calories for food consumption is normalised by the average dietary energy requirement estimated for its population to provide an index of adequacy of the food supply in terms of calories [48,49].103.3915.83
Young populationThe ratio of the population aged 15 to 34 years to the total population of the SSA country [48,49].0.340.02
Migrant networksNumber of migrants of the SSA country residing in another country [48,49].392,292.90 371,841.20
Note: Variables are associated with 240 observations, except 80 observations for ‘Trip’ and ‘Trip_pop’ and 40 observations for ‘NM_increase’ and ‘Trip_increase’.
Table 2. Difference comparison across mobility clusters.
VariablesCluster 1
‘High Temporary Moves’ (N = 3)
Cluster 2
‘Low Mobility’ (N = 28)
Cluster 3
‘Moderate Mobility’ (N = 5)
Cluster 4
‘High Permanent Migration’ (N = 4)
All Countries
(N = 40)
Permanent migration
NM30.67 ± 39.74169.07 ± 242.46184.40 ± 230.10229.42 ± 350.93166.64 ± 247.59 ***
NM_pop0.02 ± 0.020.01 ± 0.010.04 ± 0.030.07 ± 0.060.02 ± 0.03 ***
Temporary moves
Trip1,390,703 ± 937,0321,470,510 ± 2,805,8251,065,223 ± 1,824,744362,374.6 ± 373,359.91,303,050 ± 2,458,749 *
Trip_pop0.90 ± 0.320.06 ± 0.060.18 ± 0.140.09 ± 0.060.14 ± 0.24 ***
Climatic–socioeconomic variables
Dry extremes257.33 ± 460.39748.64 ± 2183.16199.60 ± 585.55501.50 ± 1051.39618.45 ± 1881.10
Wet extremes38.00 ± 64.981255 ± 4899.55197.2 ± 419.66103.50 ± 191.28916.35 ± 4131.46
Temperature extremes1.36 ± 0.491.12 ± 0.381.05 ± 0.370.96 ± 0.551.11 ± 0.41 .
GDP per capita2216.48 ± 1570.351056.40 ± 1347.141850.64 ± 2595.802422.80 ± 5209.721379.32 ± 2266.34 ***
Political stability and absence of violence0.56 ± 0.42−0.62 ± 0.84−0.51 ± 0.92−0.82 ± 0.76−0.54 ± 0.88 ***
Average dietary energy supply adequacy102.52 ± 14.06103.81 ± 16.90102.86 ± 13.17101.79 ± 12.58103.39 ± 15.83
Young population0.36 ± 0.020.34 ± 0.020.34 ± 0.020.34 ± 0.030.34 ± 0.02 ***
Migrant networks131,585.9 ± 72,482.1459,081.2 ± 382,694.3196,220 ± 239,366.3365,396.7 ± 400,714392,292.90 ± 371,841.20 ***
Note: ., *, *** = 0.1, 0.05, and 0.001 levels of significance, respectively; variables are associated with 240 observations, except 80 observations for ‘Trip’ and ‘Trip_pop’; N depicts the number of observed SSA countries.
Table 3. Determinants of temporary moves and permanent migration.
VariablesPermanent MigrationTemporary Moves
NM (NBM)NM_Pop (OLS)Trip (NBM)Trip_Pop (OLS)
Dry extremes1.0001 (0.00004) **0.0001 (0.00005) **0.99994 (0.00001) ***−0.0001 (0.00001) ***
Wet extremes0.99996 (0.00001) ***−0.00005 (0.00001) **0.999995 (2.0976 × 10⁻⁶) **−3.3850 × 10⁻⁶ (2.2314 × 10⁻⁶) .
Temperature extremes1.2822 (0.1924)0.1790 (0.2536)1.1507 (0.0720) .0.1953 (0.0793) *
GDP per capita1.0001 (0.00003) ***0.0004 (0.00004) ***0.9999 (0.00002)−0.00003 (0.00002)
Political stability and absence of violence0.5829 (0.1039) ***−0.5728 (0.1197) ***1.0617 (0.0560)0.0701 (0.0571)
Average dietary energy supply adequacy0.9704 (0.0079) ***−0.0280 (0.0111) *0.9889 (0.0033) ***−0.0132 (0.0031) ***
Young population8.1192 (3.6746)3.7861 (4.8267)0.0006 (3.3821) *−8.5789 (3.6824) *
Migrant networks1.000001 (2.1464 × 10⁻⁷) ***9.8294 × 10⁻⁷ (2.8988 × 10⁻⁷) **1.000001 (2.3190 × 10⁻⁷) **6.9777 × 10⁻⁷ (2.2228 × 10⁻⁷) **
Year fixed effectYesYesYesYes
Country fixed effectYesYesYesYes
Pseudo R2 (Nagelkerke)/R20.97170.74450.99560.9941
Constant333.7674 (1.3151) ***−4.8653 (1.6999) **2.3670 × 10⁷ (1.1796) ***0.5407 (1.2660)
Number of observations2402408080
., *, **, *** = 0.1, 0.05, 0.01, and 0.001 levels of significance, respectively; figures outside of parentheses are incident rate ratios for NBM models and robust coefficients for OLS models, and figures in parentheses indicate robust standard errors.
Disclaimer/Publisher’s Note: The statements, opinions and data contained in all publications are solely those of the individual author(s) and contributor(s) and not of MDPI and/or the editor(s). MDPI and/or the editor(s) disclaim responsibility for any injury to people or property resulting from any ideas, methods, instructions or products referred to in the content.