1. Introduction
Human development is inseparable from energy consumption, and coal is the world’s second largest energy source [
1,
2]. China has always been a country with coal as its main energy source and is currently the world’s largest coal producer [
3]. In the process of coal mining, mine water inrush accidents occur frequently, causing great economic losses and casualties [
4]. Therefore, in order to ensure the safe mining of coal mines, the need for prevention and control of mine water inrush cannot be ignored [
3]. The rapid and accurate identification of mine water inrush sources is an important prerequisite for the follow-up mine water inrush prevention and control work [
5].
Traditional water source identification methods mainly include chemical composition analysis [
6,
7,
8], isotope determination [
9], the water-level dynamic observation method [
10], similar simulation test [
11], etc. In recent years, with the development of big data and artificial intelligence, machine learning has been applied to more and more industries [
12,
13]. Many experts and scholars at home and abroad have applied machine learning models such as the neural network method [
14,
15], support vector machine [
16] and particle swarm optimization [
17] to the field of water source identification. The machine learning model has obvious advantages when dealing with a large amount of data, but insufficient advantages in its recognition accuracy and the processing speed of a small amount of data, so the traditional water source identification method cannot be completely replaced. During the formation of coal mine water, it is subjected to various physical and chemical effects [
2]. Therefore, the chemical composition analysis method is the most common and easiest to use water inrush source identification method.
The commonly used water chemical composition analysis methods include Piper three-line diagram [
18], cluster analysis method [
19], grey correlation method [
20], fuzzy comprehensive evaluation [
21], and water temperature and water quality identification [
22]. Among them, the grey correlation method has low requirements for data sample size, and the results are simple and reliable. It has great advantages in the field of mine water inrush source identification with relatively few data samples and high recognition speed requirements. The traditional grey correlation method does not consider the index weight, and the effect is not good, so some scholars [
23,
24] have improved the gray correlation method in terms of weight.
In previous studies on the identification of mine water inrush sources, conventional chemical components or isotopes were used as discriminant indexes. Conventional chemical components are more suitable for identifying water inrush sources in aquifers with different lithologies [
25], and their discrimination effect for aquifers with the same lithologies is poor [
26]. For different lithologic aquifers, isotopes can more accurately identify water inrush sources [
27,
28], but for the same lithologic aquifers, the isotopes they contain are also roughly the same, resulting in unsatisfactory discrimination. In addition to conventional chemical components and isotopes, trace components are widely used and easily obtained for water chemical analysis.
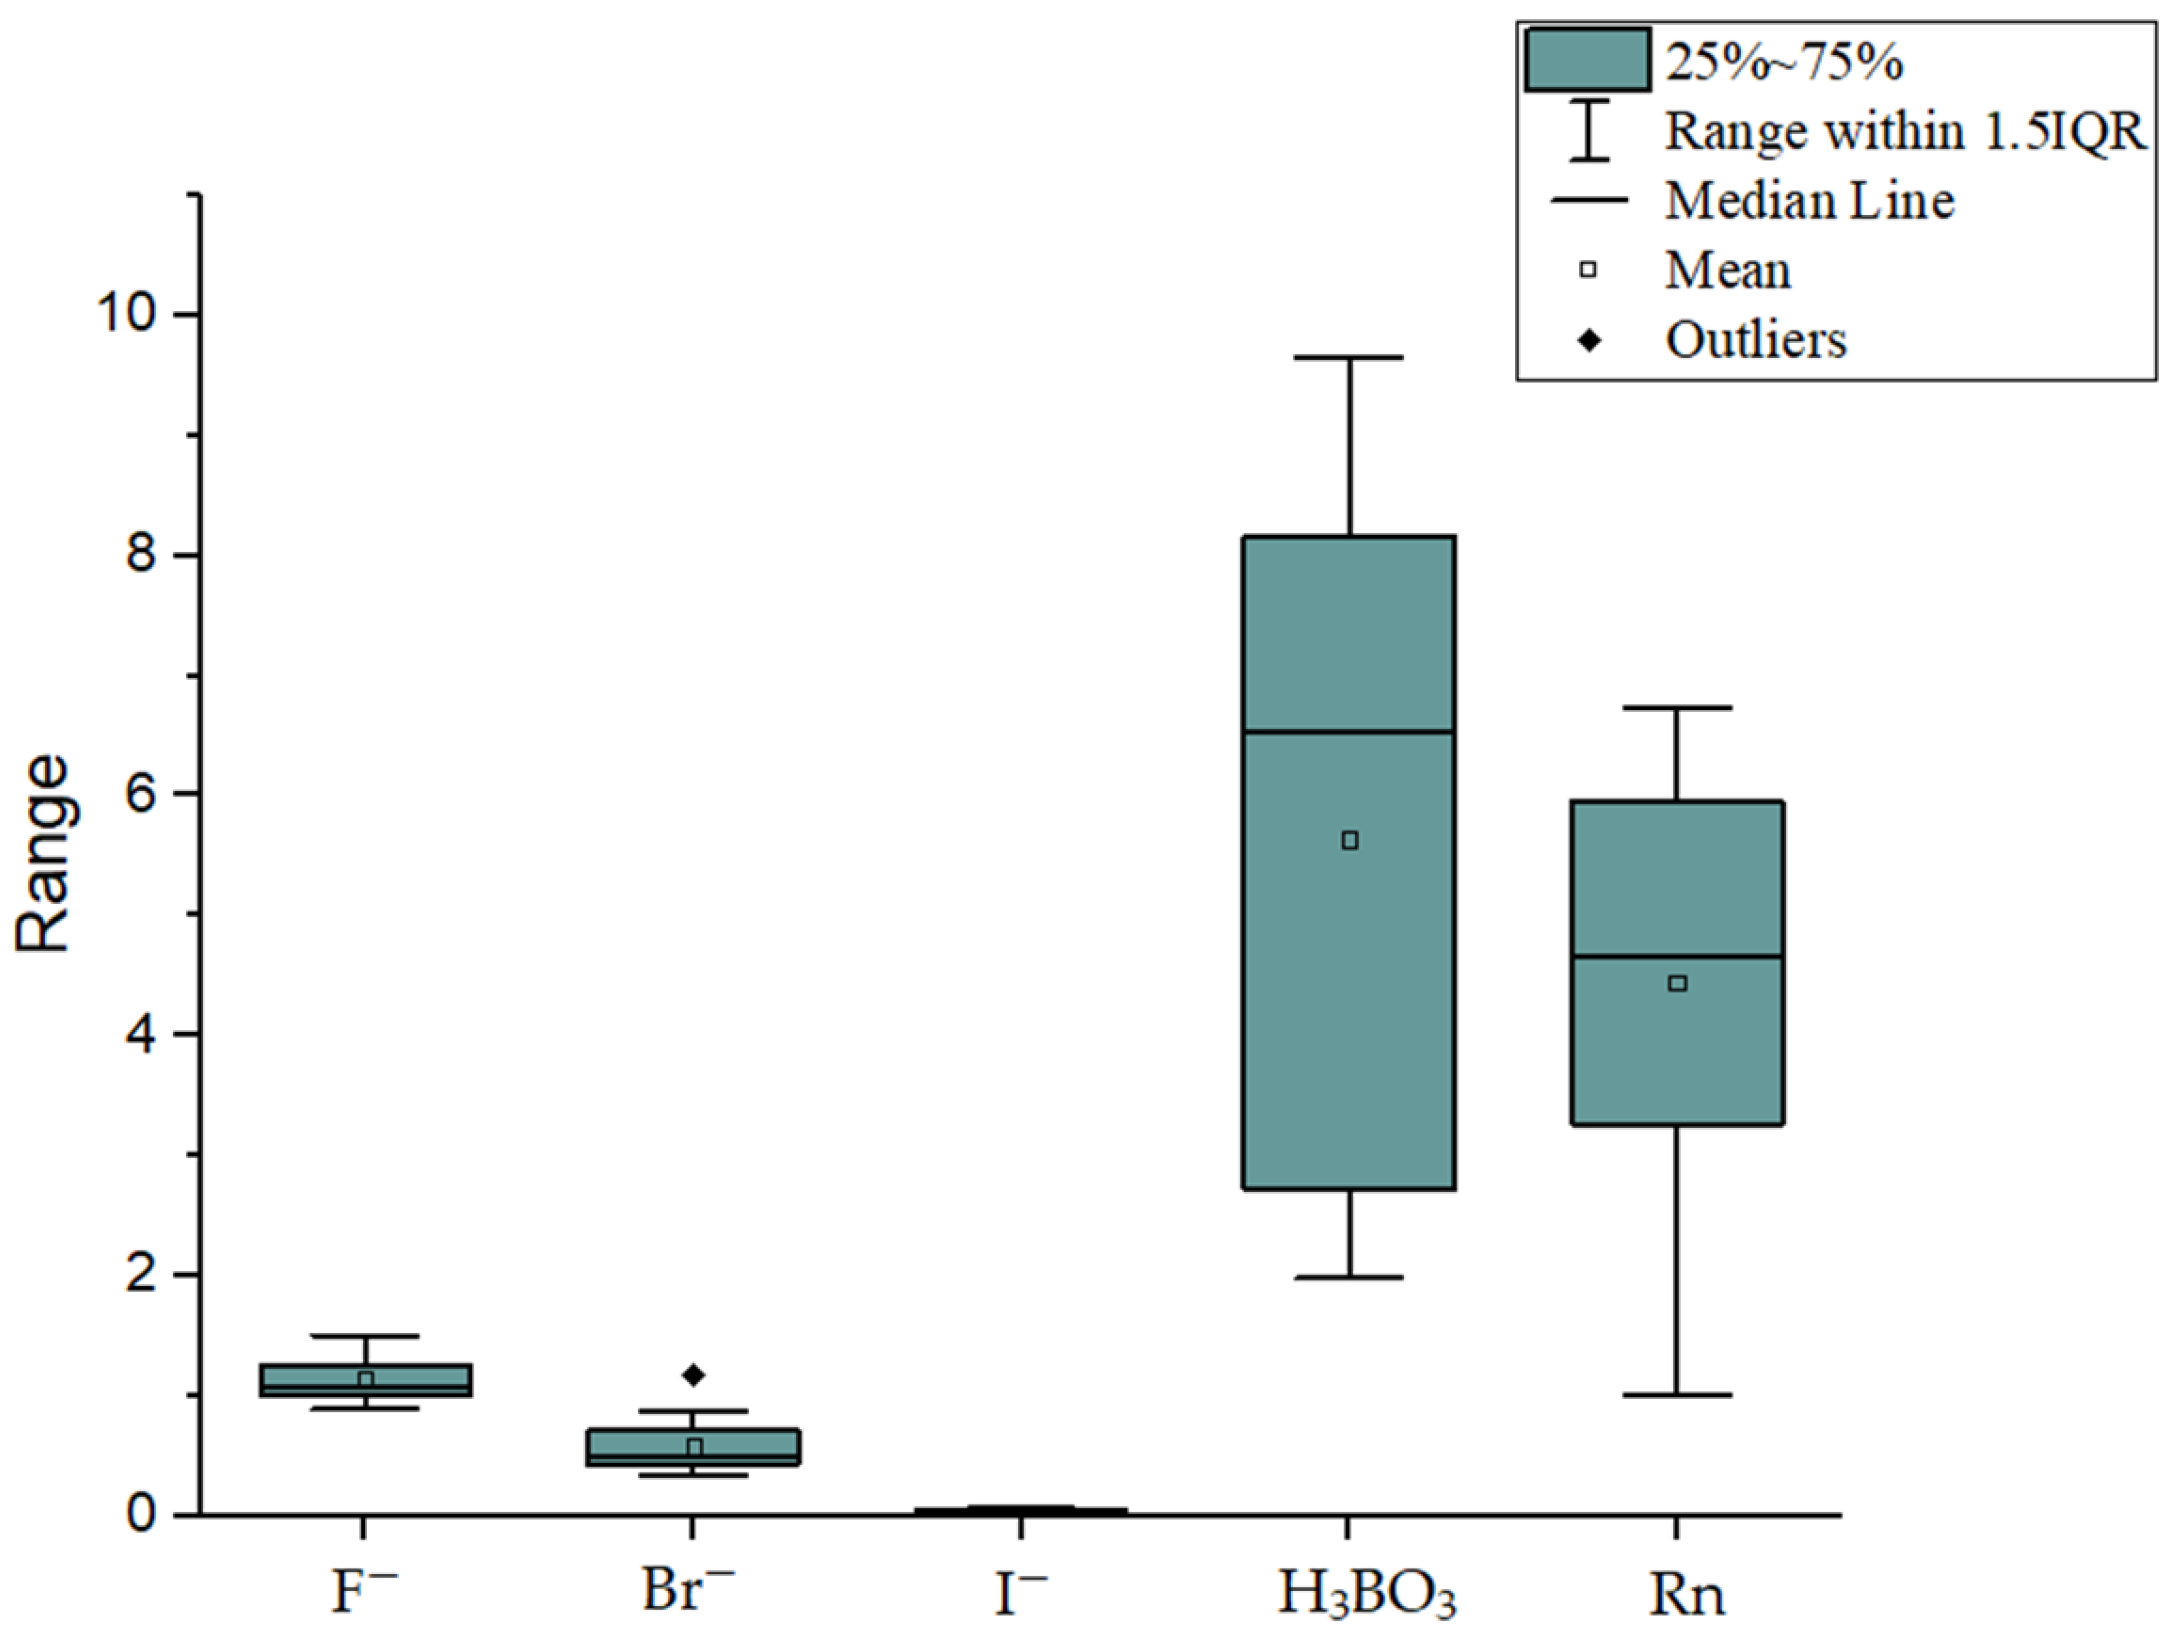
At present, the grey correlation model established using conventional components as discriminant indexes in the field of mine water inrush has the disadvantages of a slow recognition speed and low accuracy. By improving the grey correlation and selecting trace components, the recognition accuracy and speed when discriminating mine water inrush sources can be improved, offering high sustainable application value in subsequent mine water prevention and control work. Therefore, this paper takes the water inrush case of Baizhuang Coal Mine in Feicheng Coalfield, central and eastern China, as the research background. Five trace components (F
−; Br
−; I
−; H
3BO
3; Rn) with obvious changes in different limestone aquifers were selected as discriminant indexes. With the help of the minimum deviation method [
29], the weights obtained by the entropy weight method [
30], the principal component analysis method [
31] and the analytic hierarchy process [
32] were combined and weighted. An improved grey correlation model was established to distinguish the mine water inrush situation when the water inrush source is limestone aquifer in different geological ages.
2. Study Area
Feicheng Coalfield is located in Feicheng City, Shandong Province, in the east of China. The fault structure of Feicheng Coalfield is very developed, and Baizhuang Coal Mine is located in the middle of Feicheng Coalfield (
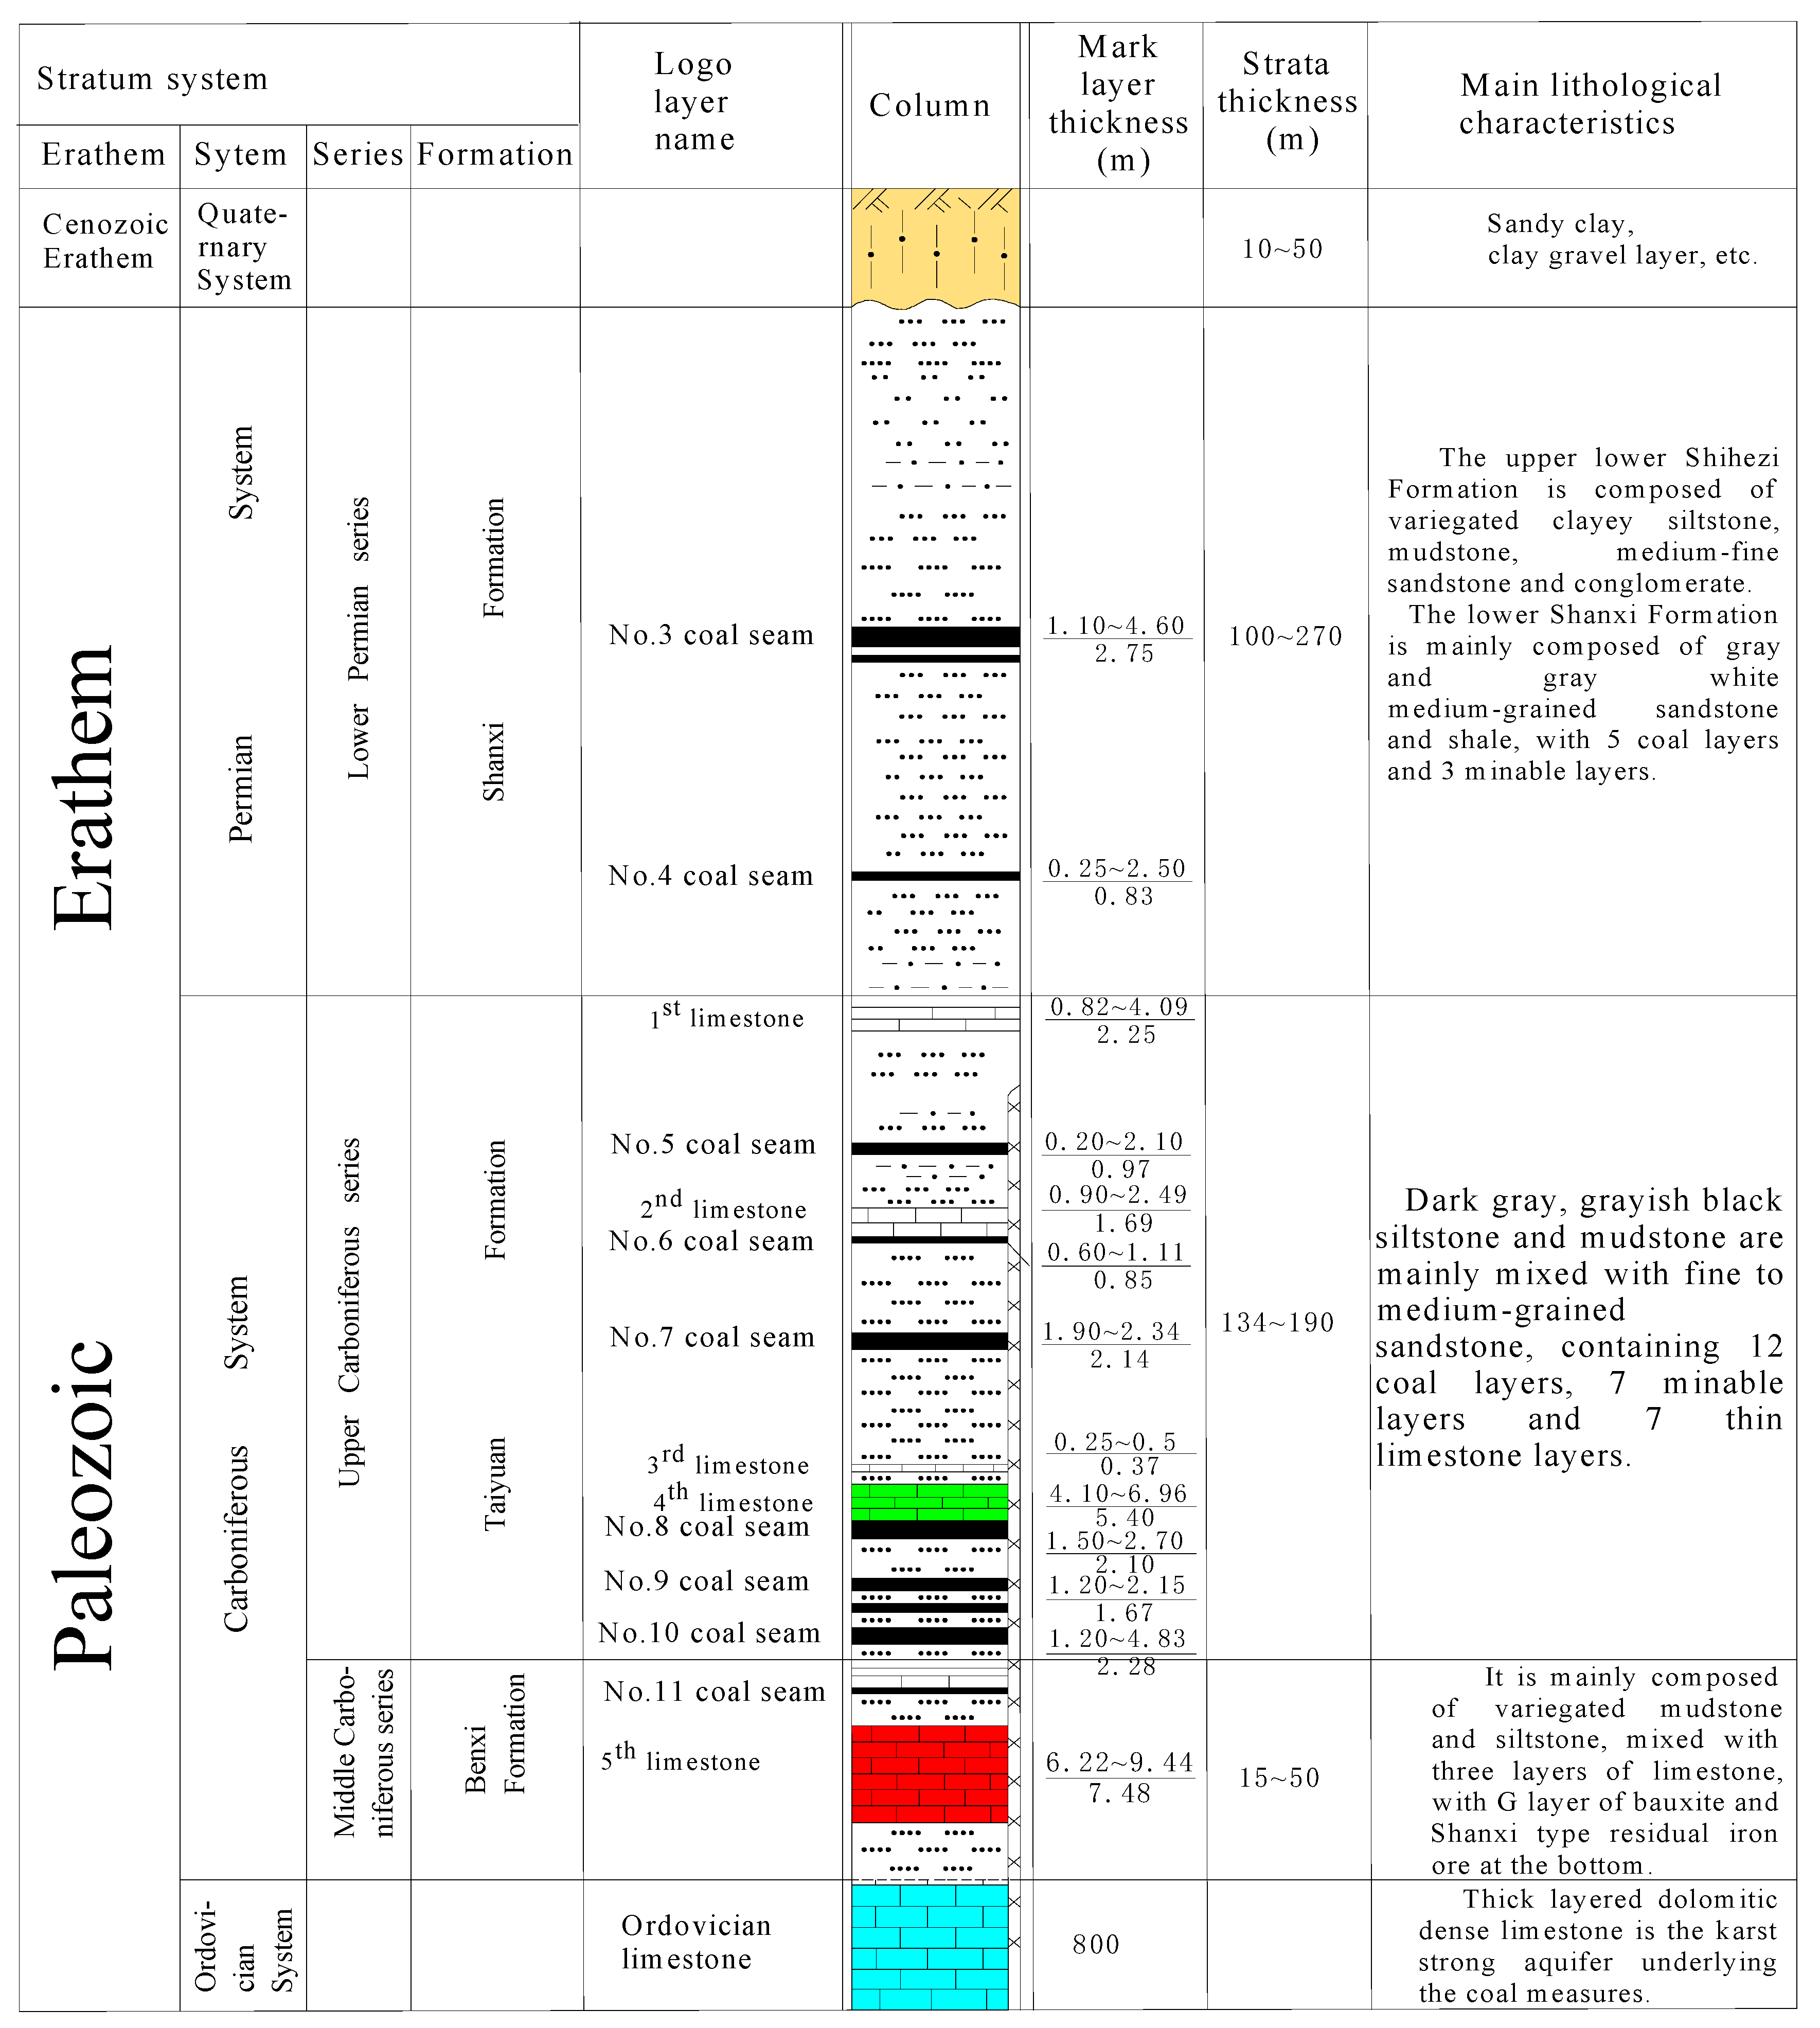
Figure 1). The stratigraphic structure of Baizhuang minefield is shown in
Figure 2. The coal-bearing strata are Carboniferous-Permian. Among them, No.3 and No.4 coal seams of the Permian Shanxi Formation and the No.5, No.6, No.7 and No.8 coal seams of the Carboniferous Taiyuan Formation have been mined out. At present, the No.9 coal seam of the Taiyuan Formation is mainly mined. The mining of the No.9 coal seam is threatened by water inrush from the fifth limestone aquifer of the Carboniferous Benxi Formation and the Ordovician limestone aquifer. On 26 July 2021, water inrush from the floor occurred during the mining of the No.9 coal seam in Baizhuang Coal Mine, and the maximum water inrush was 545 m
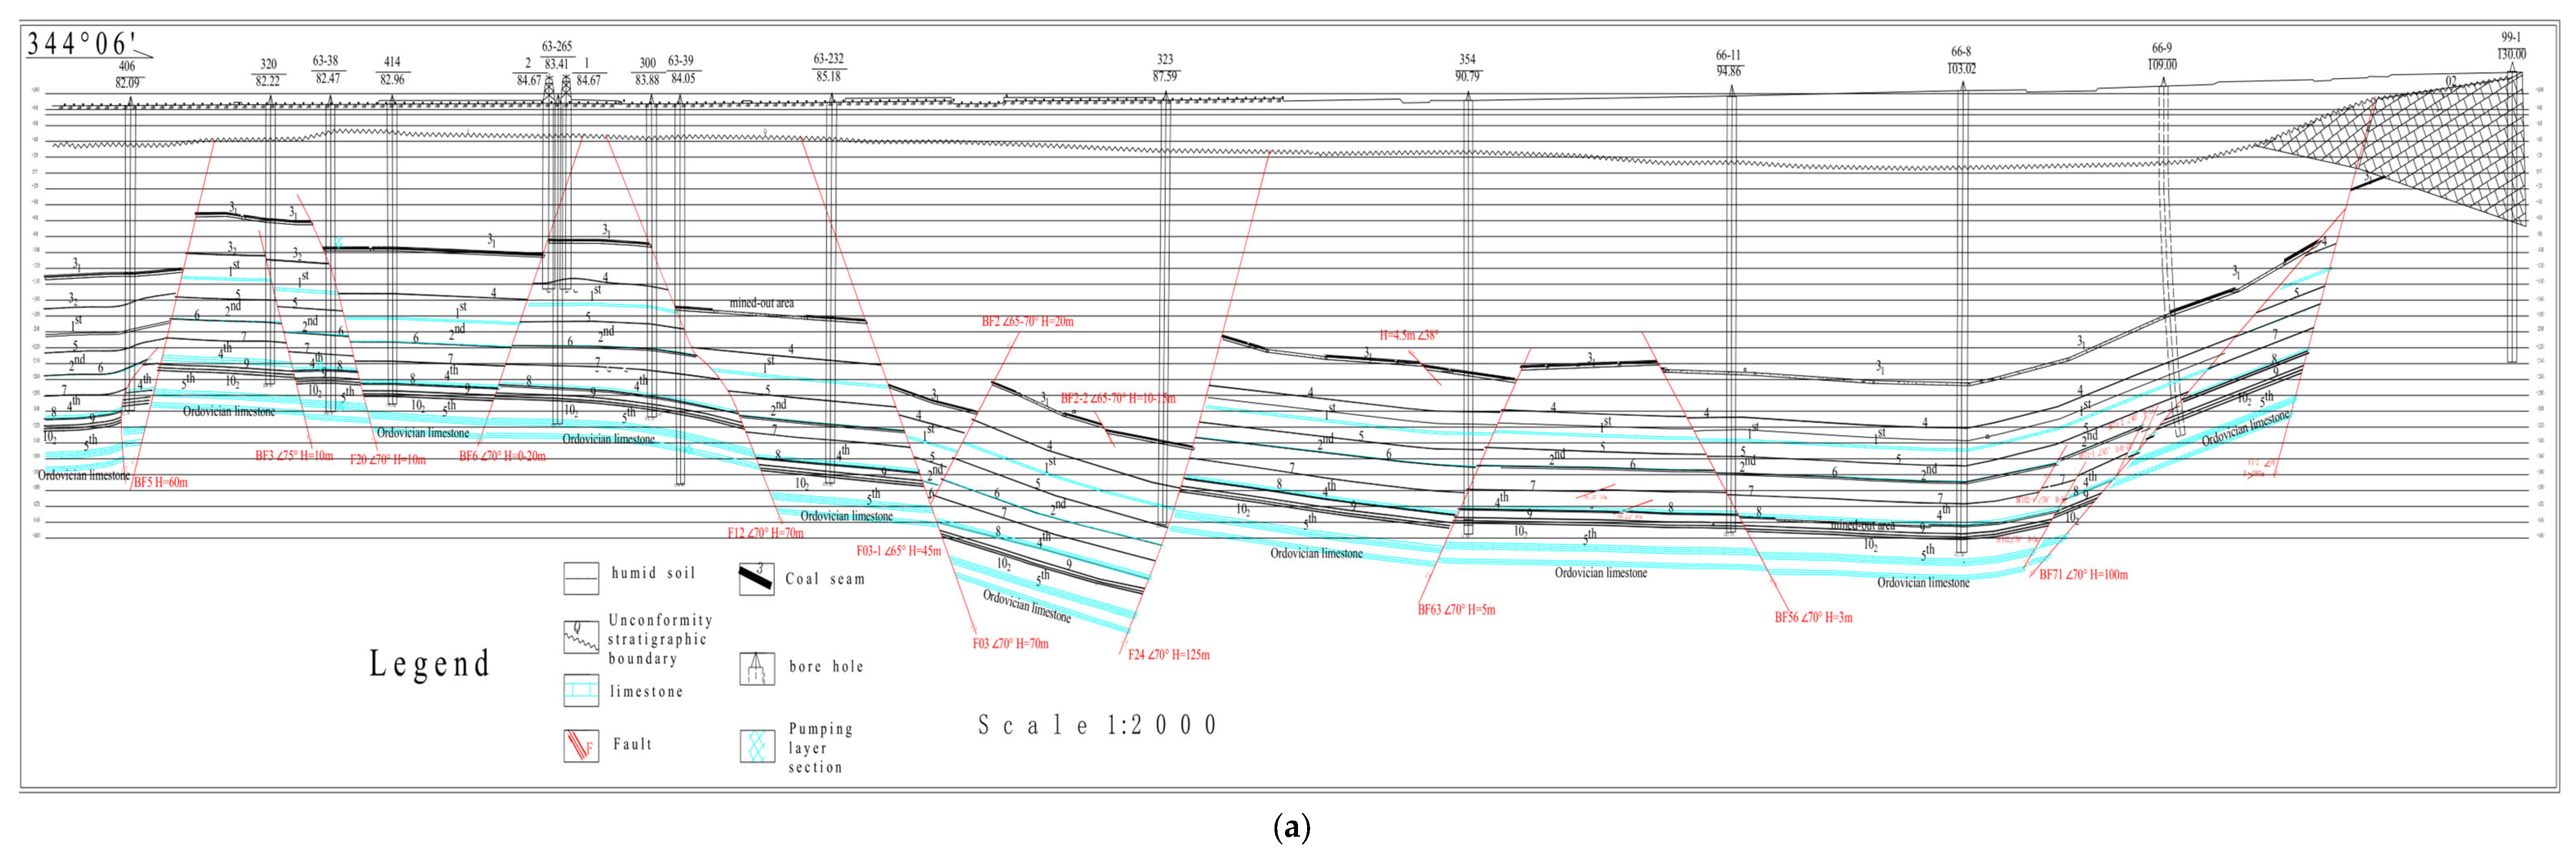
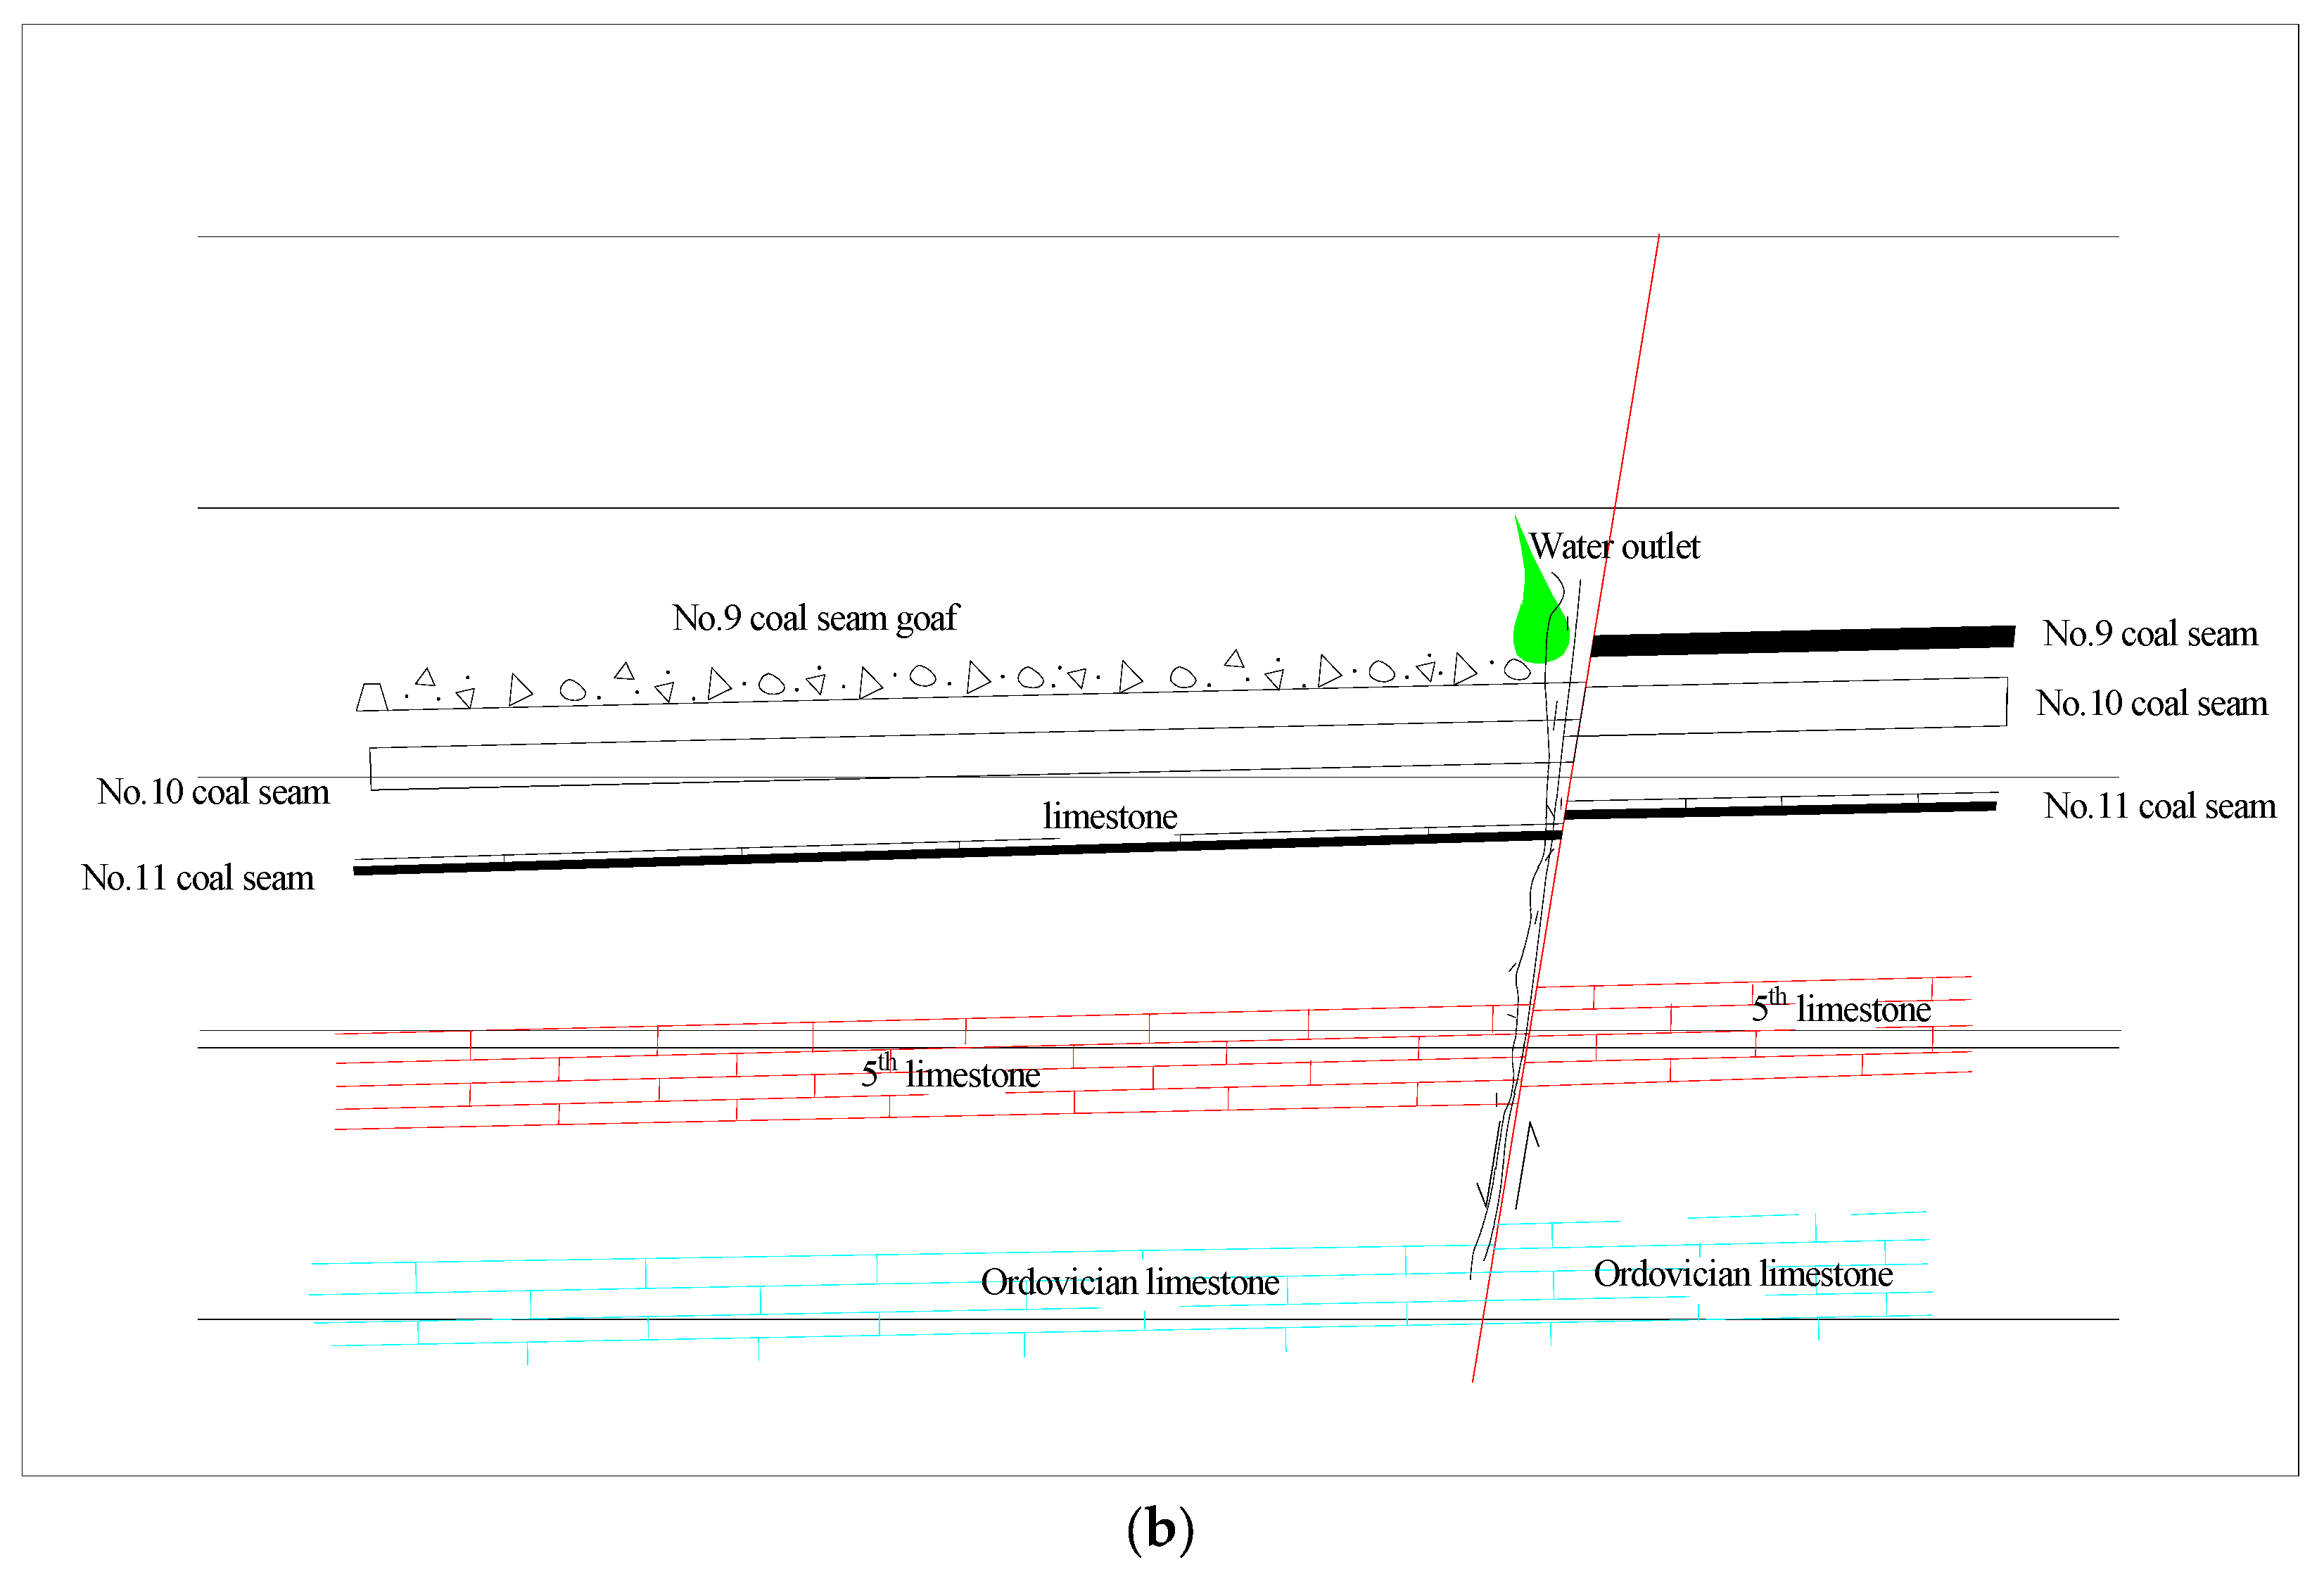
3/h. According to the hydrogeological profile (
Figure 3a), schematic diagram (
Figure 3b) and long-term practical field experience in Baizhuang Coal Mine, the technical personnel judged that the water inrush source is either the fifth limestone aquifer or the Ordovician limestone aquifer. Knowing how to accurately identify the source of water inrush is very important to guide the on-site technicians in taking effective water prevention measures.
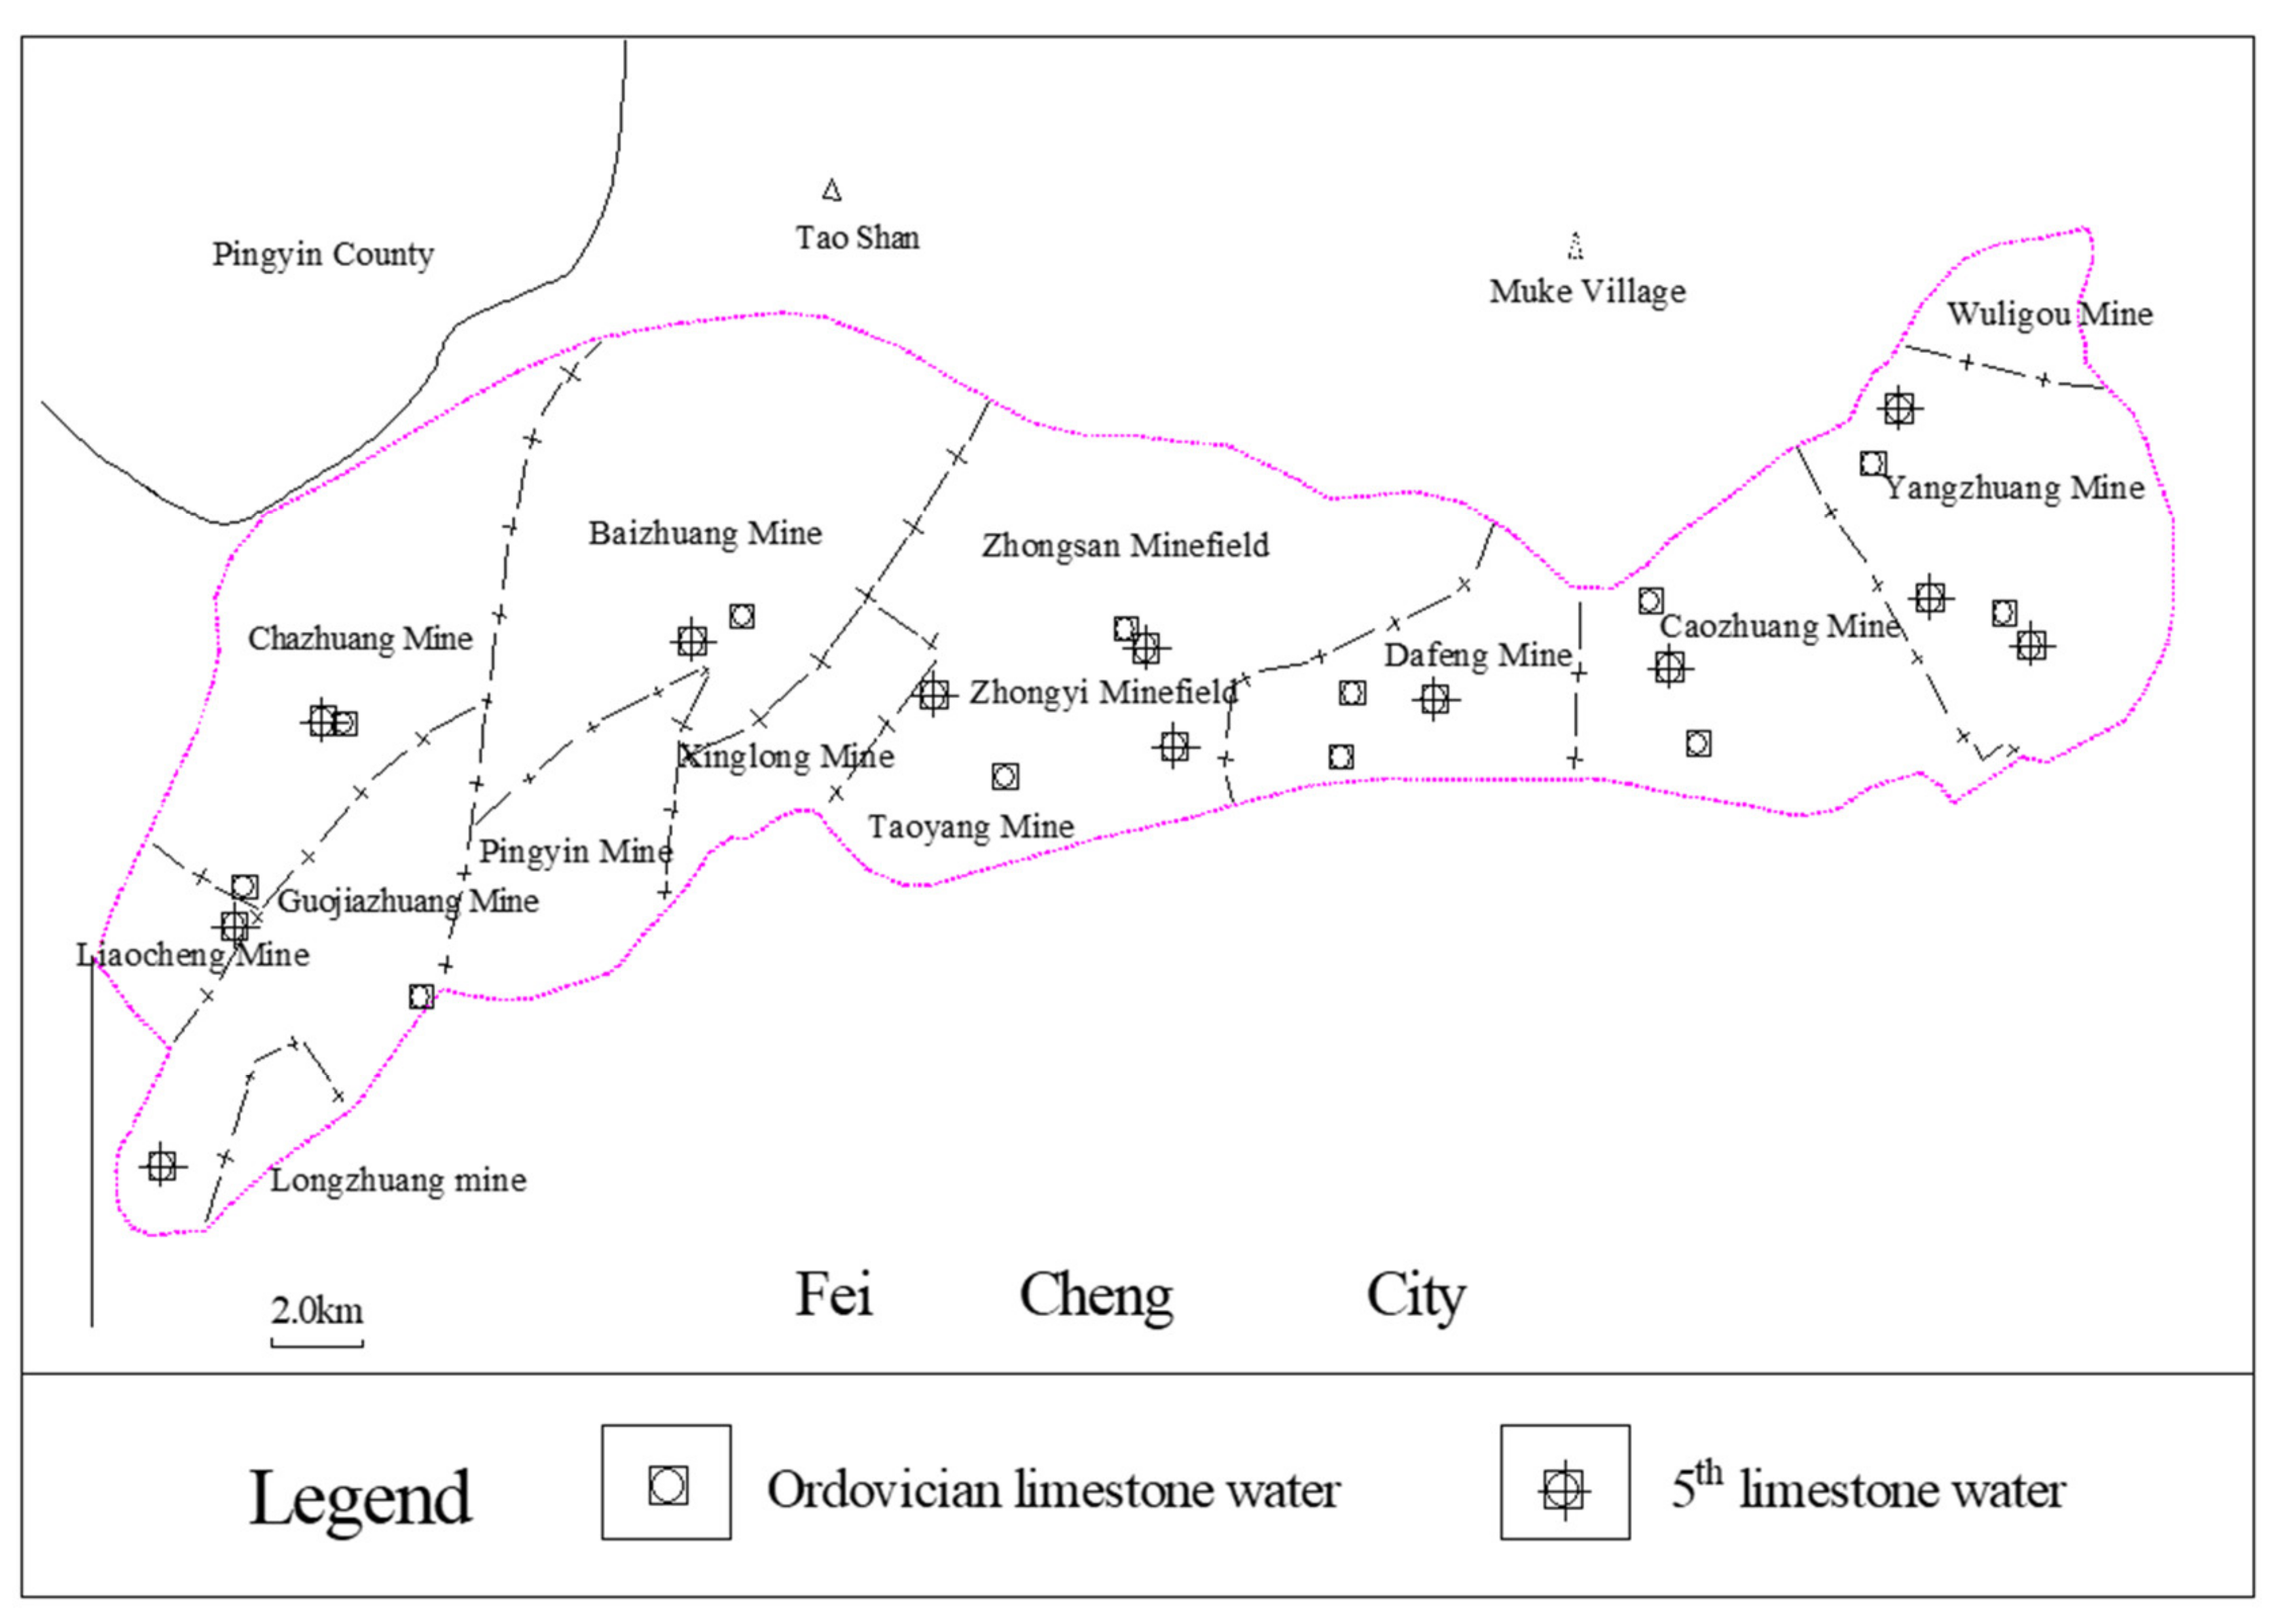
In Feicheng coalfield, the fifth limestone water and Ordovician limestone water samples were collected and sent for inspection by the Feicheng Mining Group. The specific sampling points are shown in
Figure 4. After the occurrence of water inrush, the relevant person in charge of Baizhuang Coal Mine collected and inspected the water samples of water inrush points.
3. Methods
3.1. Piper Three-Line Diagram
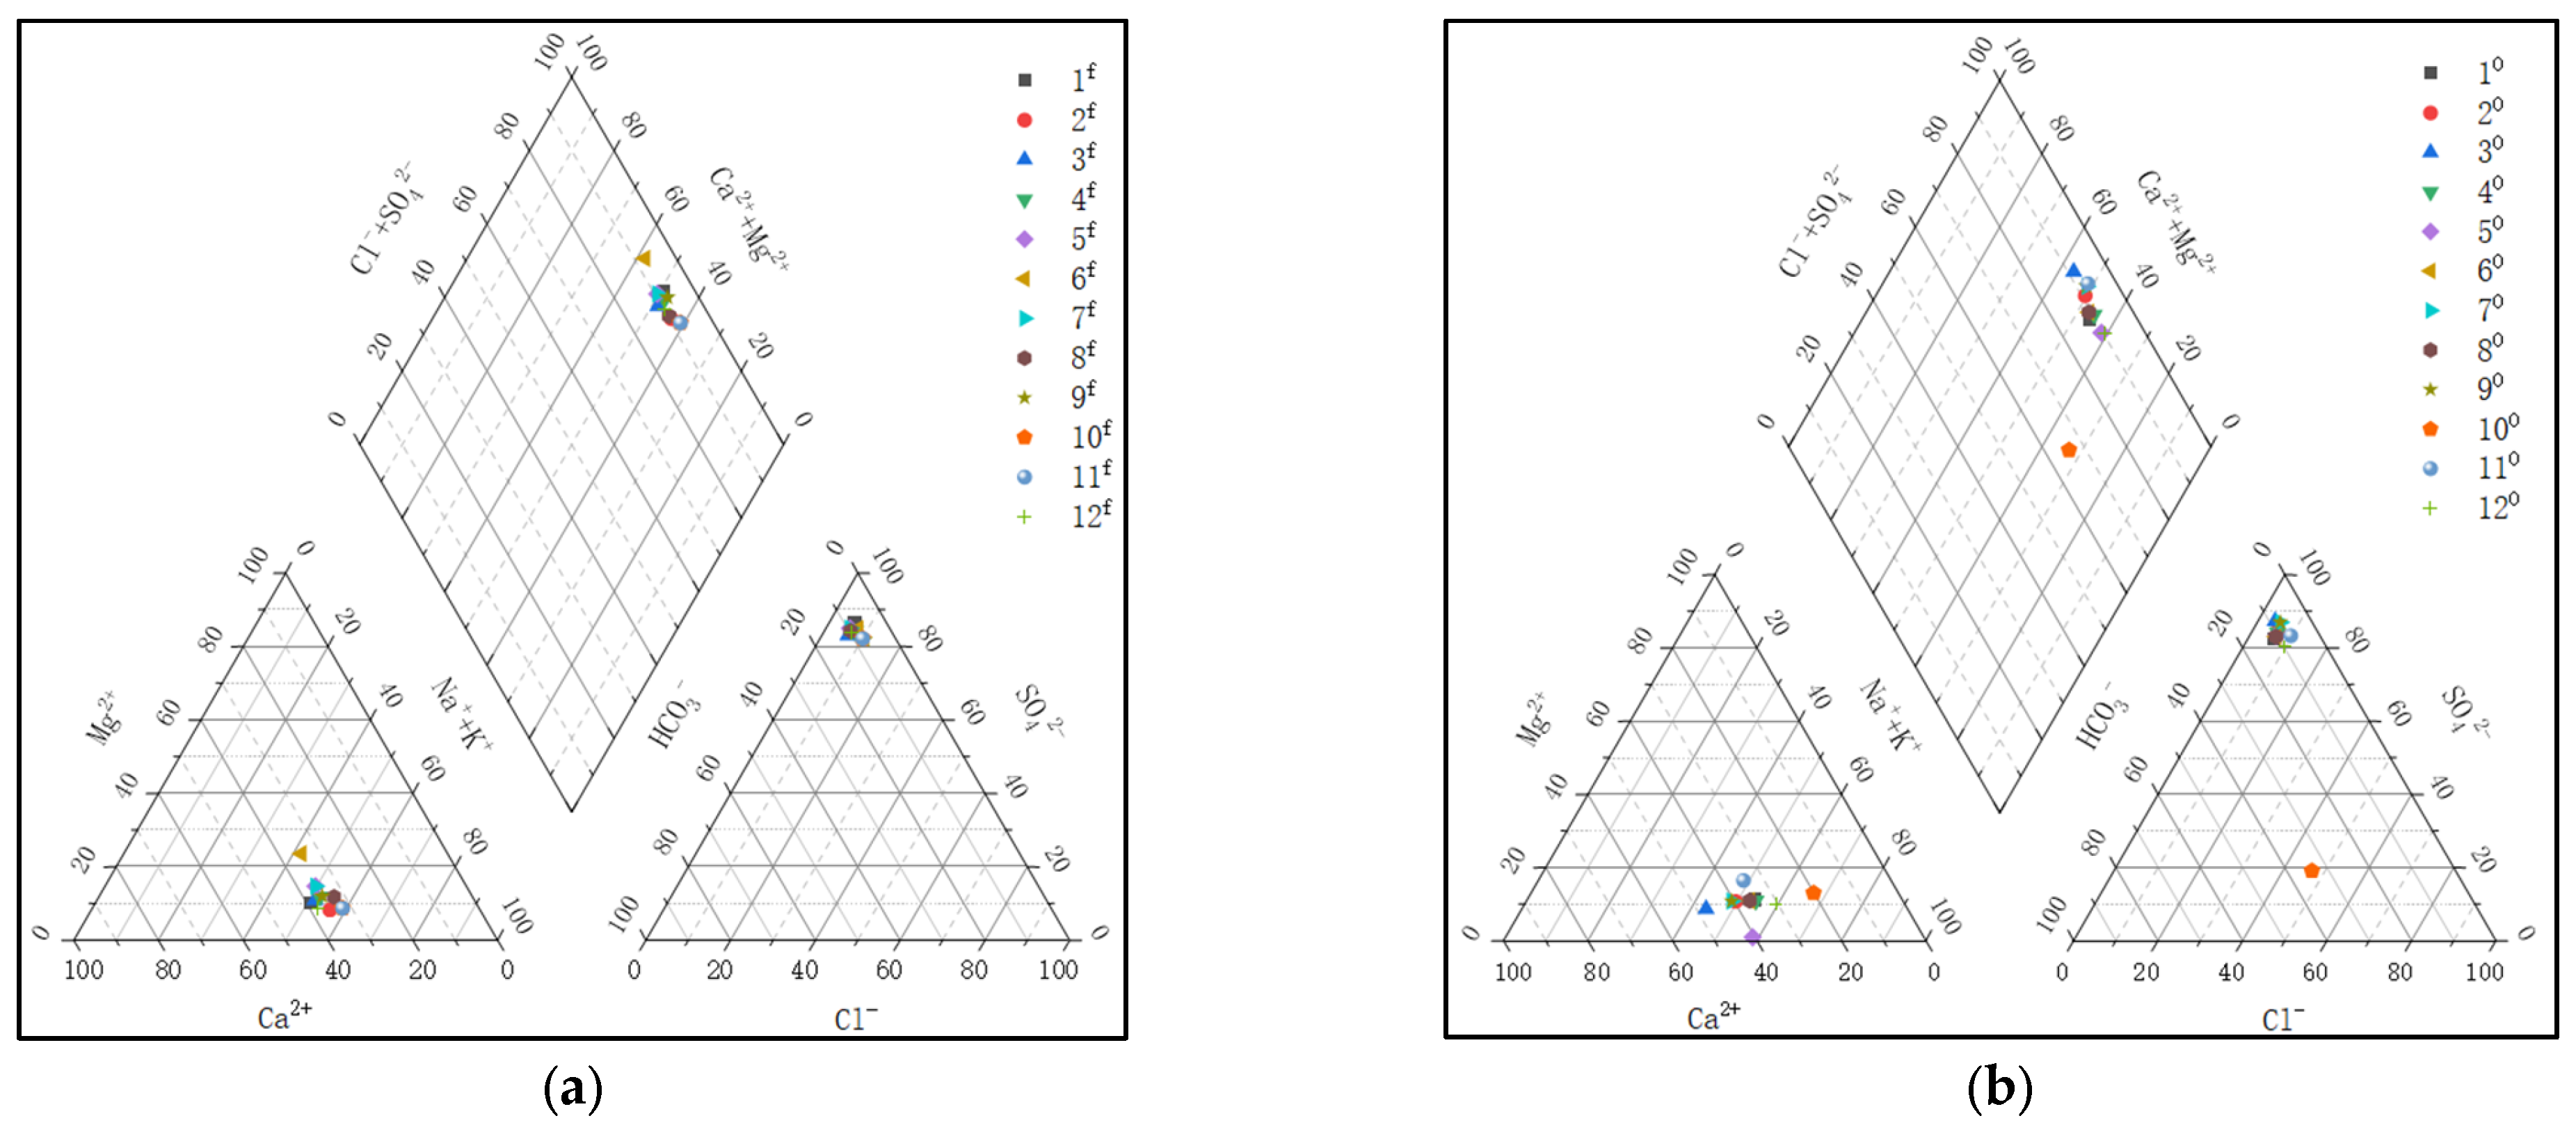
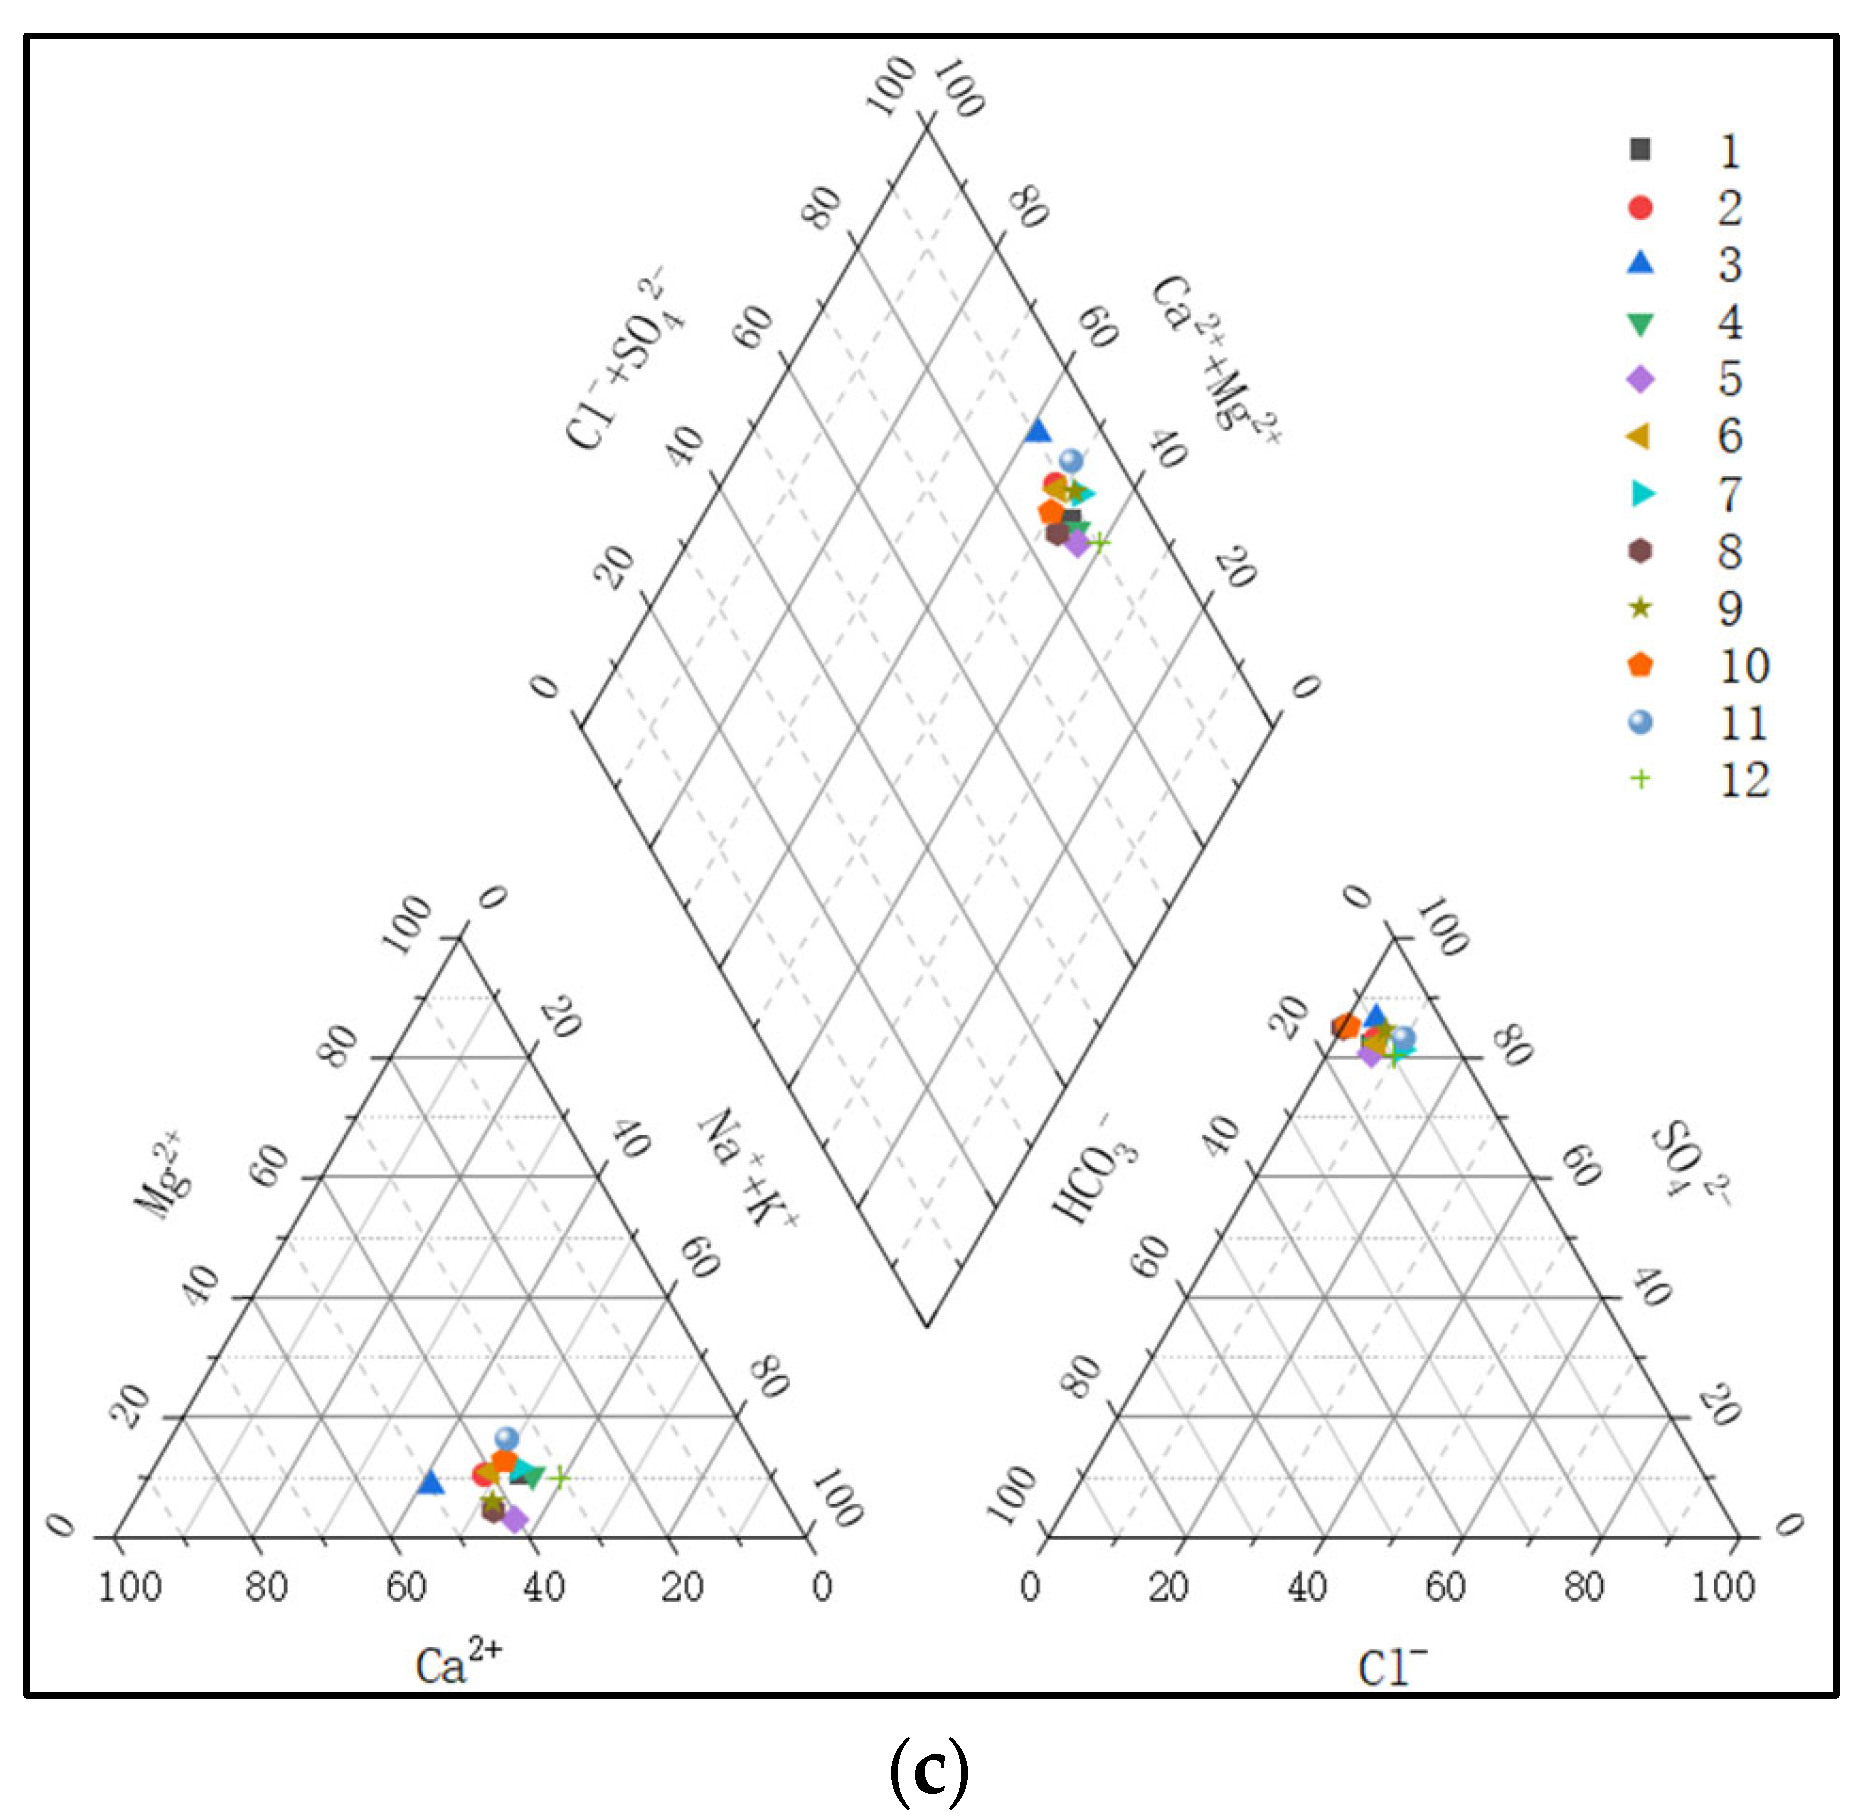
The Piper three-line diagram is a common analytical graph in the field of water chemistry analysis. It can directly reflect the type of water chemistry [
33], and is generally drawn by Origin software.
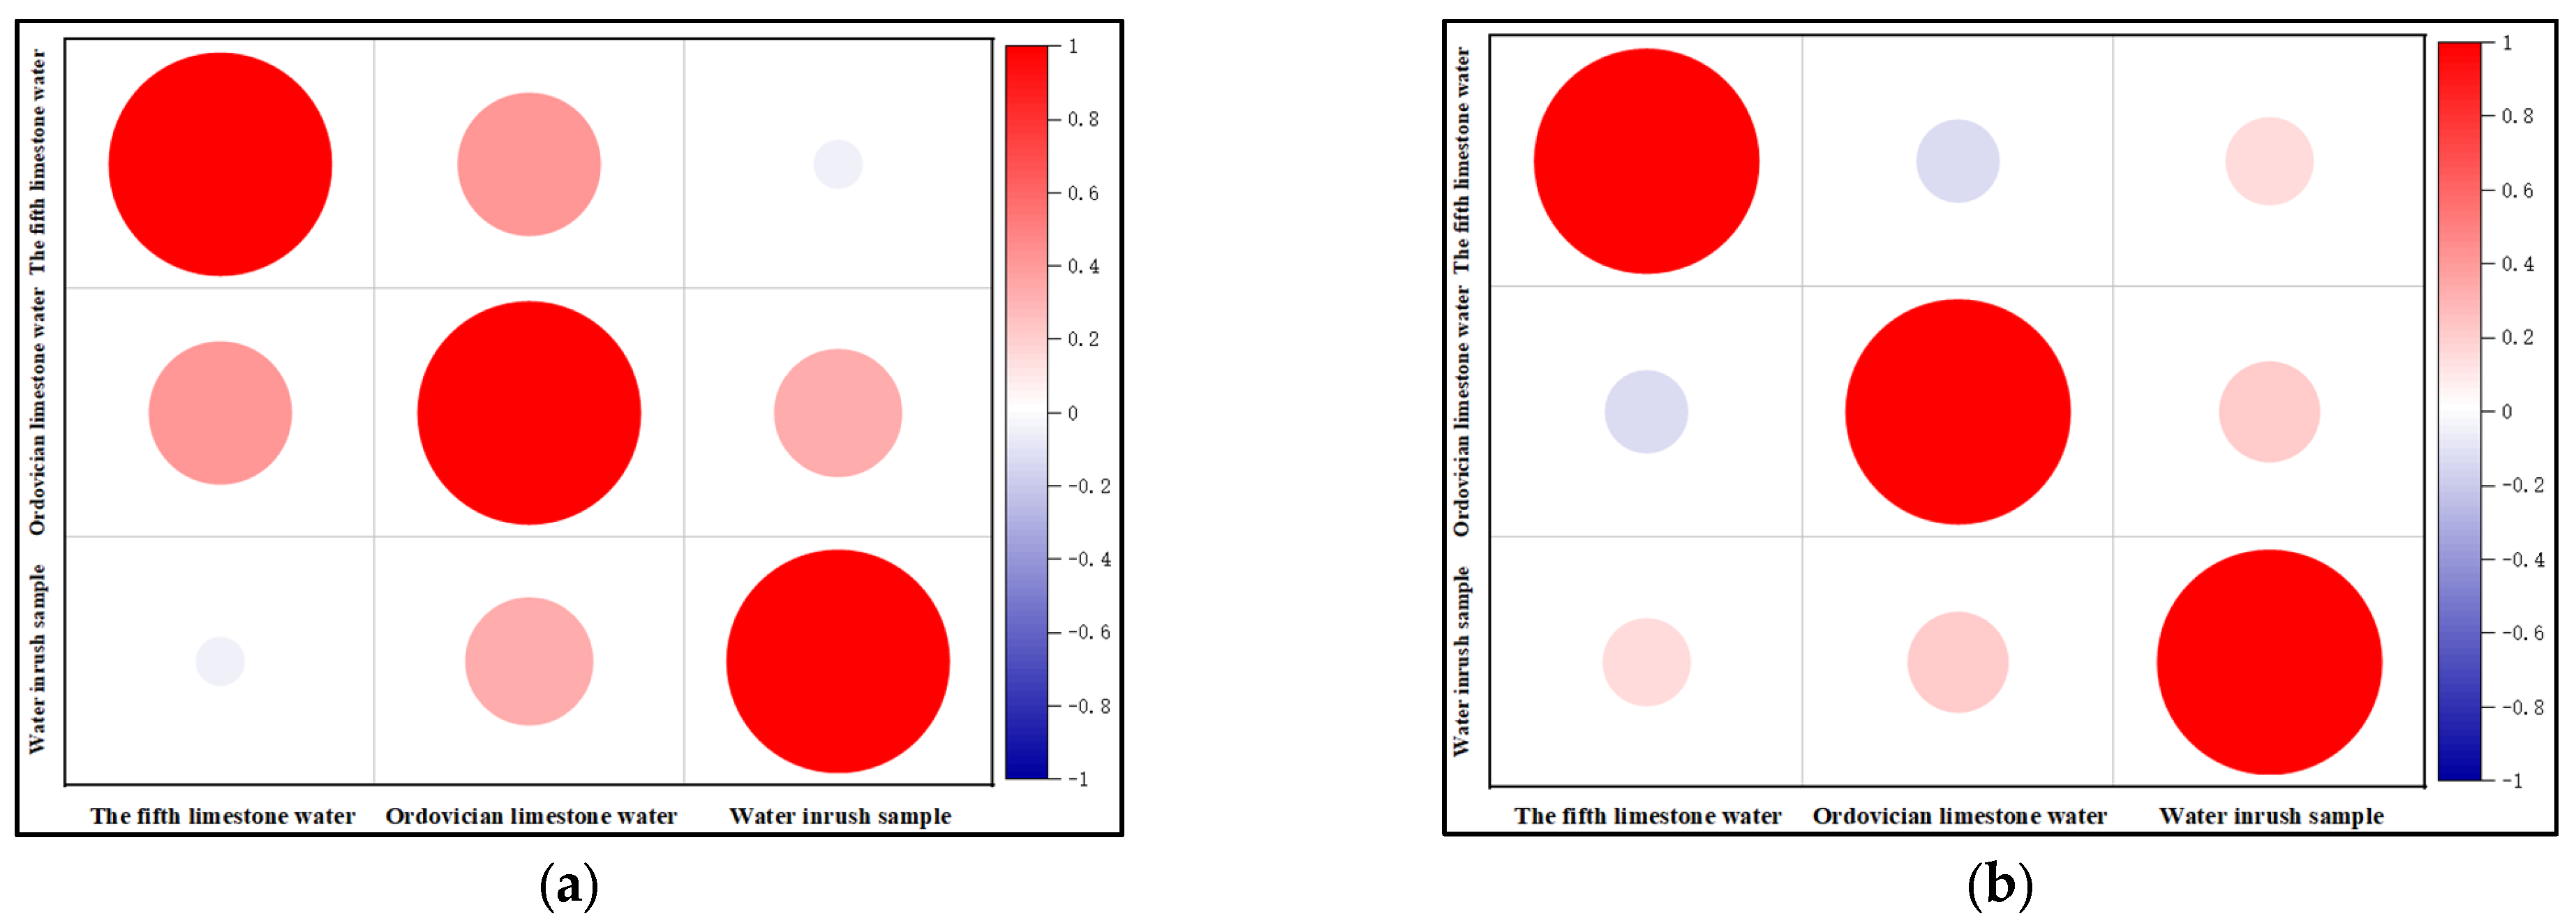
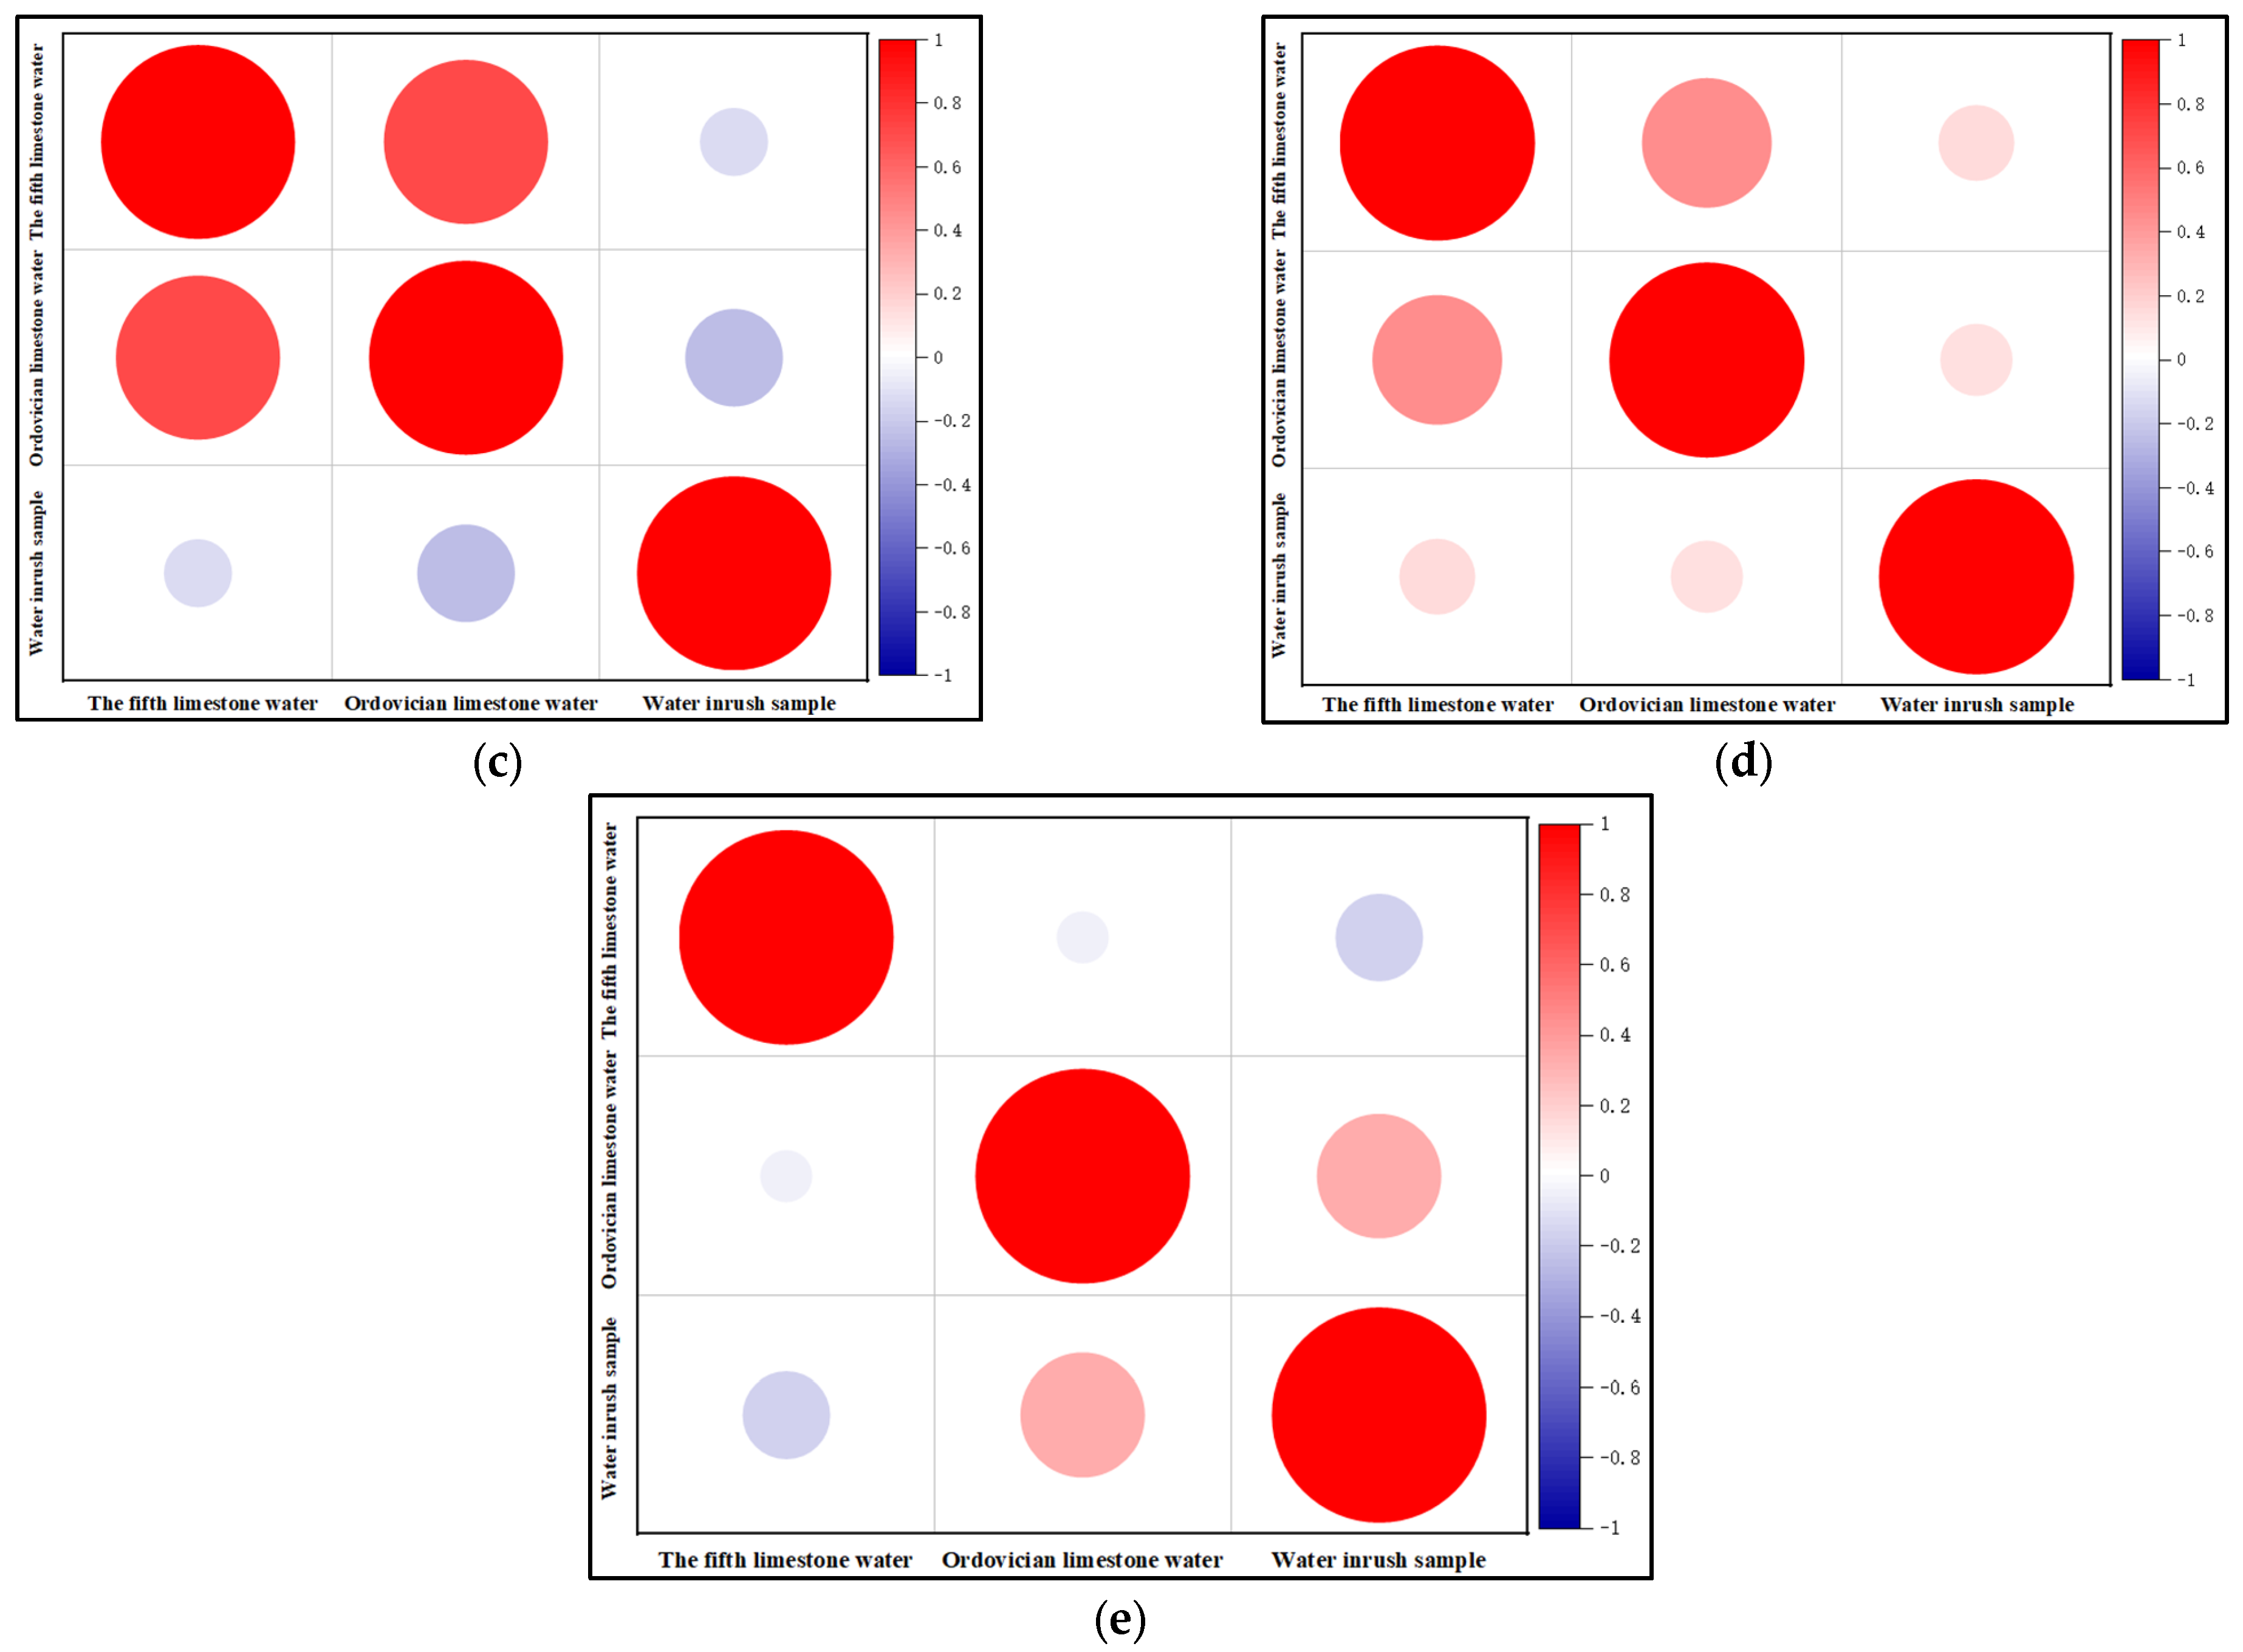
3.2. Correlation Heat Map
Correlation heat map is a common graph in the field of chemical analysis, which can directly reflect the correlation between factors. It can be drawn by Origin (v2023) software.
3.3. Grey Correlation Analysis
Grey correlation analysis is a multi-factor statistical analysis method [
20]. Simply speaking, we want to know the relationship between an indicator and other factors. By sorting the correlation between factors and obtaining an analysis result, we can learn which factors are more relevant to the indicator with which we are concerned. When using water chemical composition analysis for water source identification, each water sample has multiple indicators, which can be used to form an orderly sequence and then construct a related model, before the water inrush sample to be judged and compared with the known results to obtain the discriminant effect.
Because the content of each component in the aquifer is quite different, the direct analysis effect is not good; therefore, the normalization theory of grey correlation analysis is used to ensure the content data of each component are dimensionless before analysis. The specific formula is shown in Equation (1) below.
In the equation, is the normalized sequence, is the original data sequence, and is the parent sequence.
The equation for calculating the correlation coefficient is shown in Equation (2):
In the equation, is the minimum absolute difference between absolute difference, is the two-stage maximum absolute difference, and is the resolution coefficient.
In the research process, to avoid the error caused by the different values of the resolution coefficient
, the resolution coefficient is improved by the variance method [
34], which can reduce the influence of the two-stage maximum absolute difference. The improved correlation coefficient formula is shown in Equation (3):
Among them, , , the normalized standard deviation of each column of water chemistry index is , is the maximum standard deviation obtained by comparison, is the minimum value.
3.4. Entropy Weight Method
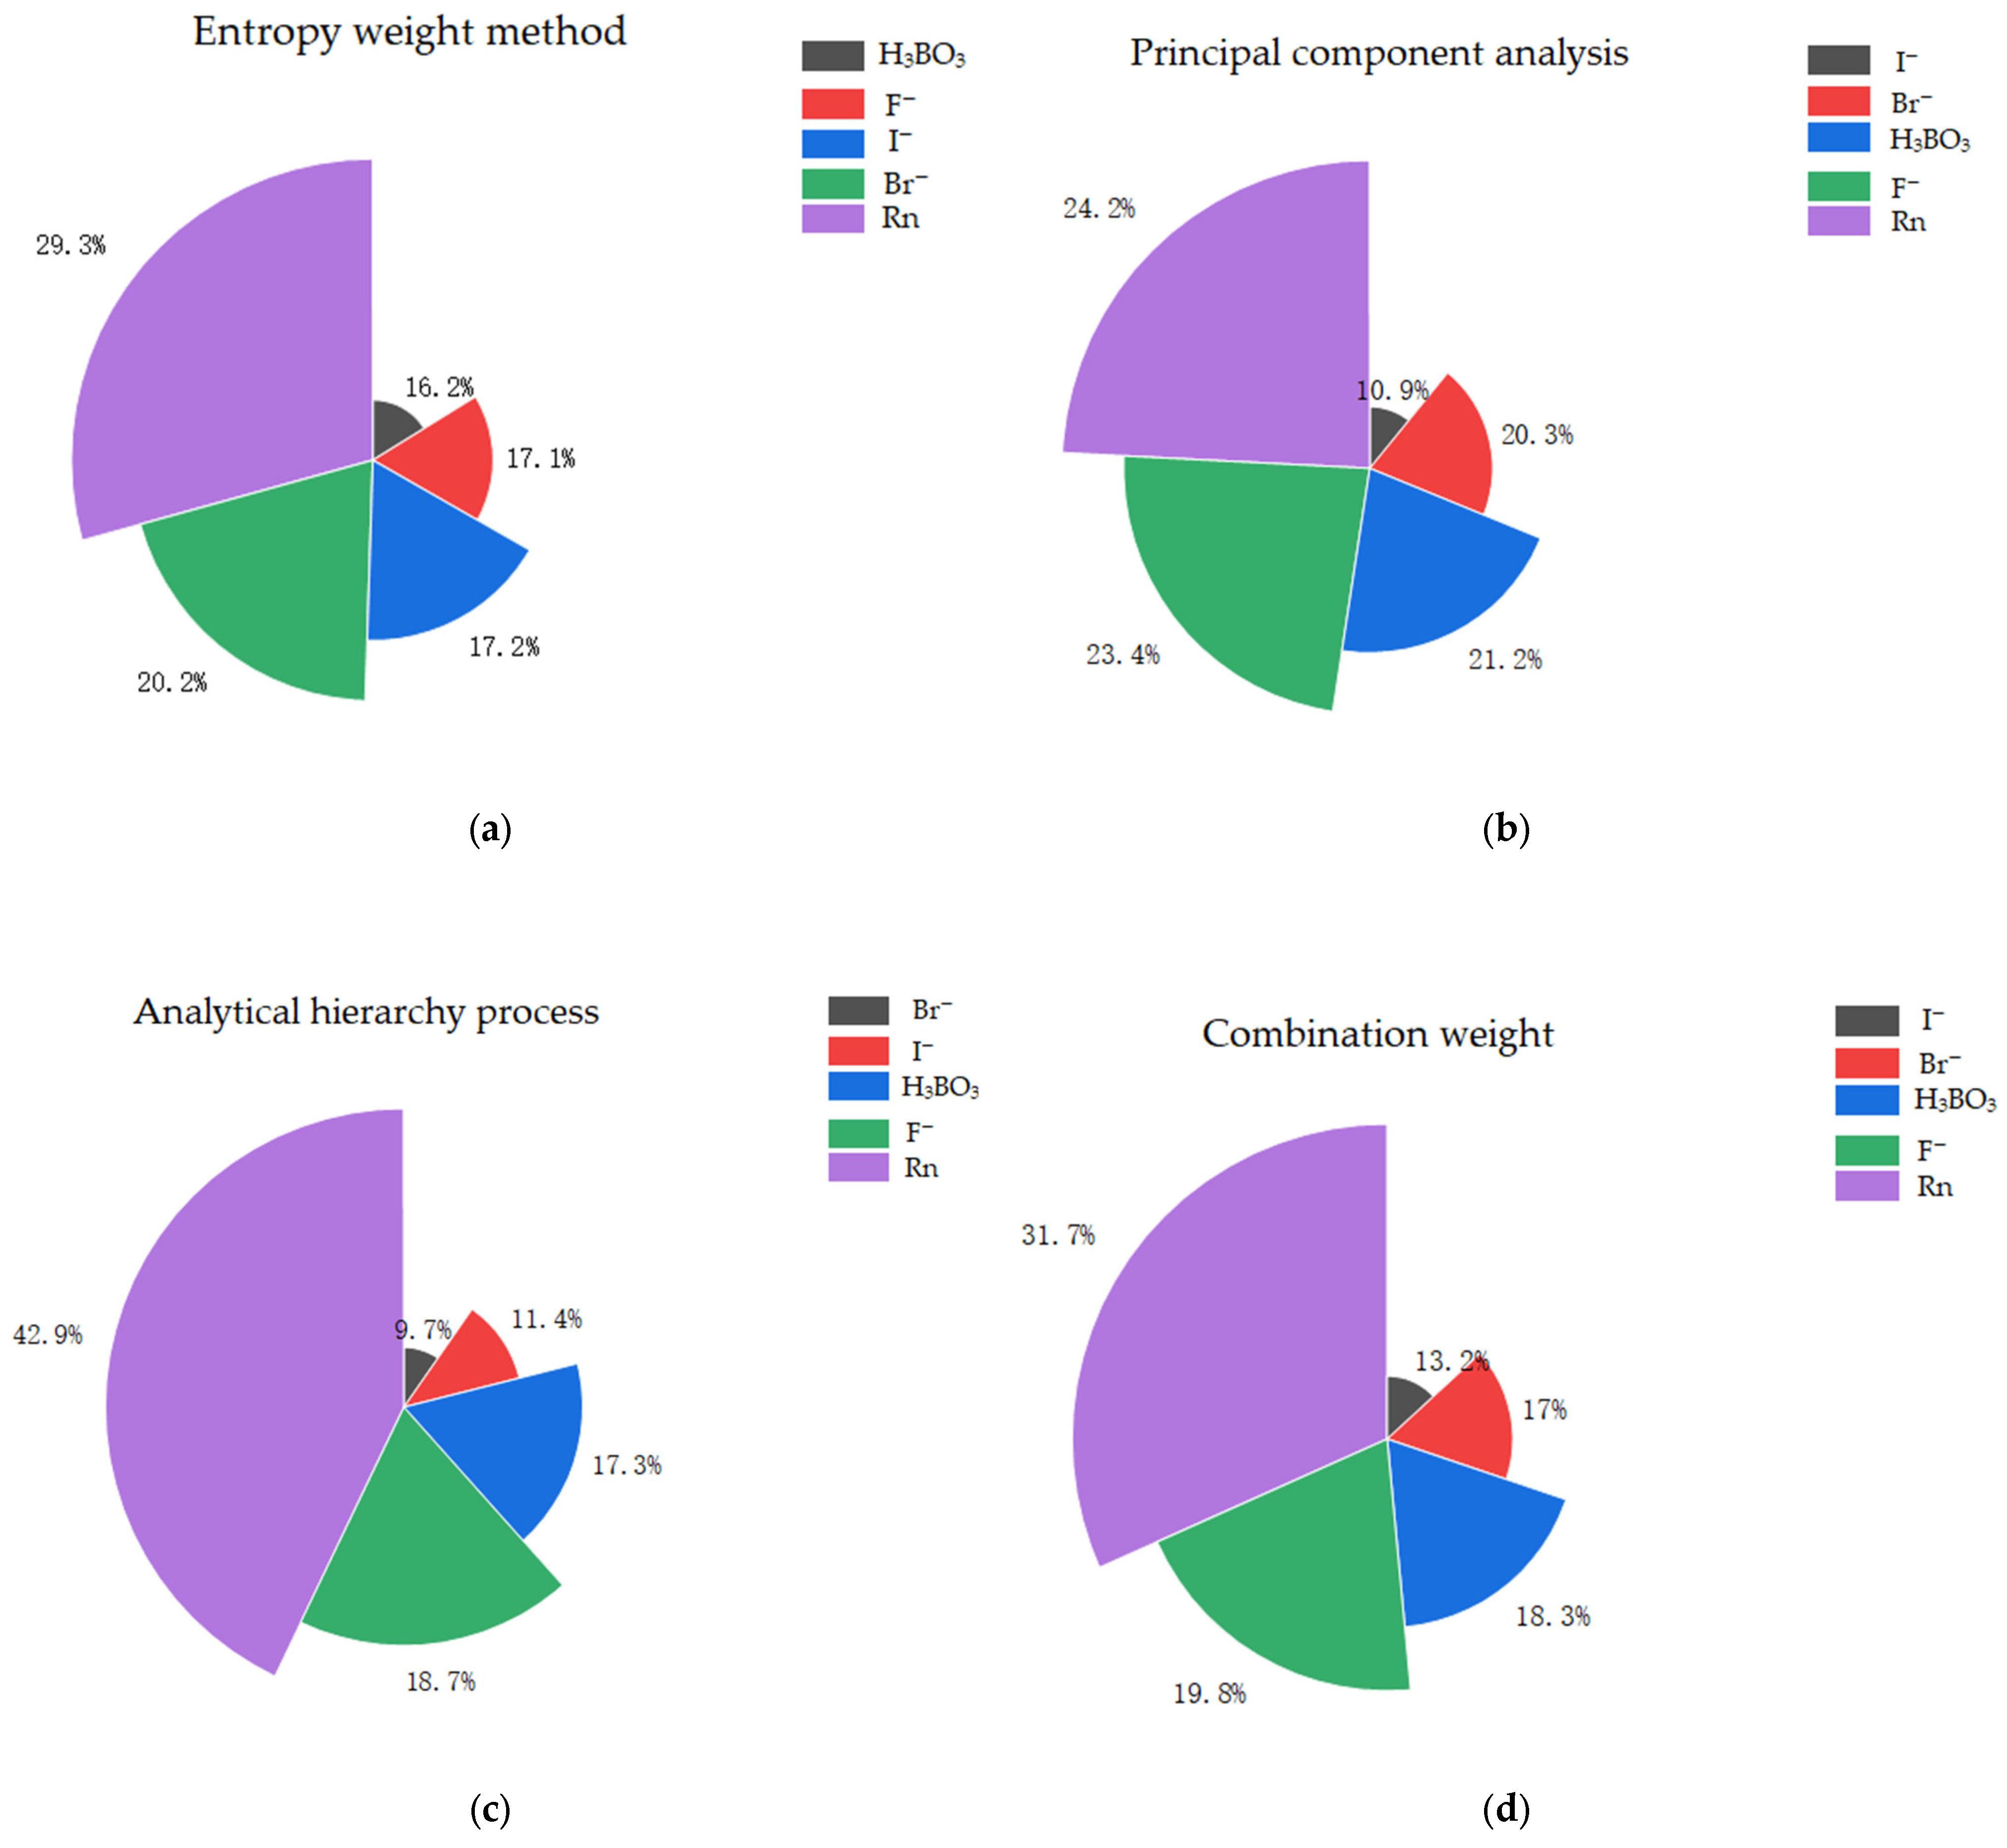
The weight matrix
of each water quality index was calculated by the entropy weight method [
30]. The entropy weight method is used in the absence of expert weight, in order to reduce the influence of subjective factors: according to the degree of variation of each index, the entropy weight of each index is calculated using information entropy, and the weight of the evaluation index is determined by the judgment matrix composed of the evaluation value.
3.5. Principal Component Analysis
Principal component analysis [
31] is a statistical method of dimension reduction. With the help of an orthogonal transformation, it transforms the original random vector related to its component into a new random vector unrelated to its component, and then reduces the dimension of the multi-dimensional variable system to convert it into a low-dimensional variable system. By constructing an appropriate value function, the low-dimensional system is further transformed into a one-dimensional system.
3.6. Analytic Hierarchy Process
The analytic hierarchy process is a subjective weighting method [
32]. The specific calculation steps are as follows. Firstly, a judgment matrix
is constructed for each level, and the maximum eigenvalue and corresponding eigenvector of the judgment matrix are solved. Then, the maximum eigenvector of the judgment matrix is normalized to obtain the weight coefficient of each index. Finally, the consistency index
is calculated to determine whether the matrix has satisfactory consistency. If
, the consistency requirement is satisfied; otherwise, it is not satisfied, and the judgment matrix line must be adjusted.
3.7. Combination Weight of Minimum Deviation Method
In the previously improved grey correlation model, the weights obtained by the entropy weight method and analytic hierarchy process are selected, and combination weighting is carried out by linear weighting. The entropy weight method regards different indicators as having an independent existence and does not consider the correlation between indicators. The objective weight obtained by principal component analysis is added to the combination weighting as a supplement to the objective weight, and the weighting result is better. For multi-objective decision-making problems, the linear programming method has obvious limitations, and the minimum deviation method [
29] obtains better results. Therefore, this paper uses the minimum deviation method to combine the index weights obtained by the entropy weight method, principal component analysis and analytic hierarchy process. The specific principle and formula of the minimum deviation method for combined weighting are shown in Equations (4)–(8).
For a multi-attribute decision making problem, there are a total of
indicators, using
weighting methods. The attribute weight vector is used as shown in Equation (4):
Of which
. Let the combination weight of the
th index be
, and the weight value corresponding to the combination weight is
. Then:
The index weighting method based on minimum deviation aims to make the deviation of weighted weight obtained by this weighting method as small as possible, so the optimization model is constructed:
This is followed by the reintroduction of the Lagrange function:
The following equations are obtained by deriving
respectively:
This can be introduced to Equation (9) to find the grey weighted correlation degree:
where
is the combination weight and
is the grey correlation degree.
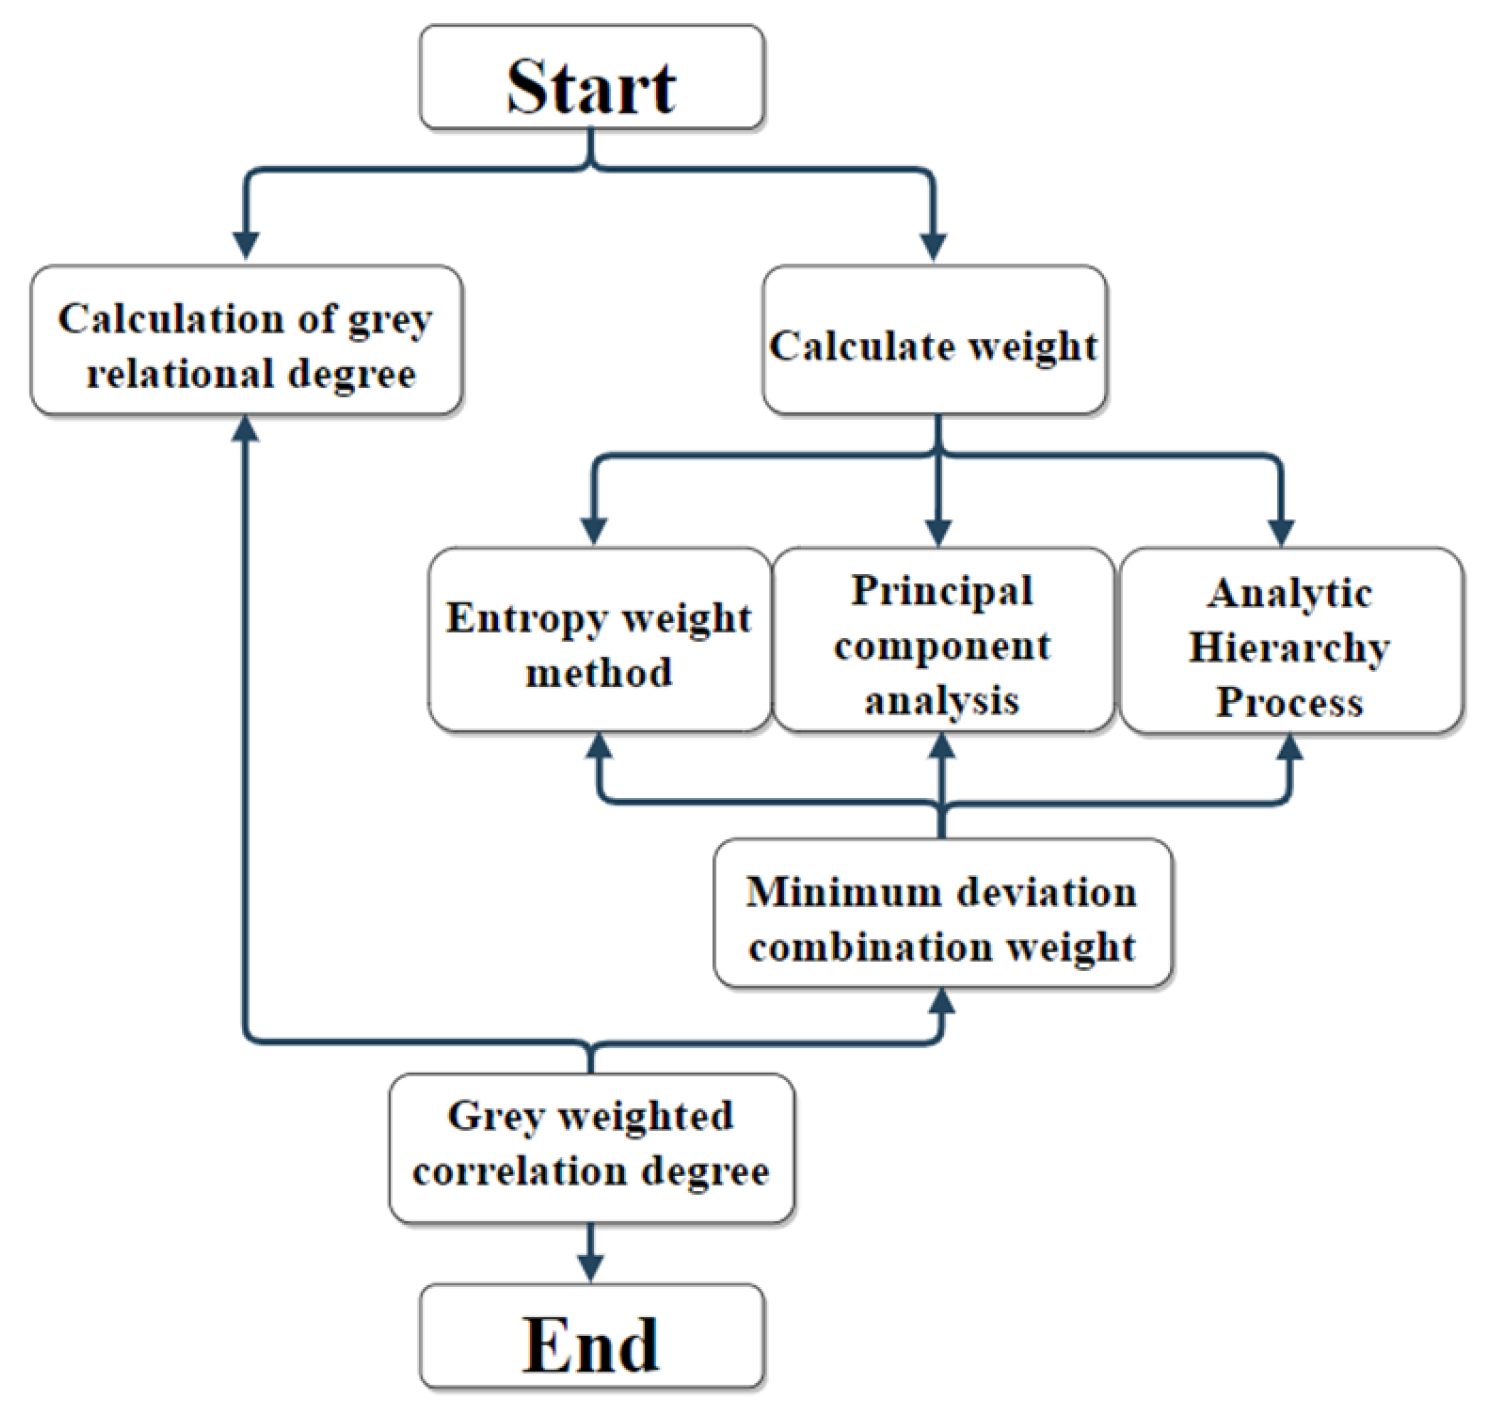
The process of creating an improved grey correlation mine water inrush source identification model based on minimum deviation combination weight is shown in
Figure 5.

