Article

Urban Flood Loss Assessment and Index Insurance Compensation Estimation by Integrating Remote Sensing and Rainfall Multi-Source Data: A Case Study of the 2021 Henan Rainstorm

1
College of Hydraulic & Environmental Engineering, China Three Gorges University, Yichang 443002, China
2
College of Management, Sichuan University of Science & Engineering, Zigong 643000, China
3
Municipal Construction Engineering Center of Cuiping District, Yibin 644000, China
*
Author to whom correspondence should be addressed.
Sustainability 2023, 15(15), 11639; https://doi.org/10.3390/su151511639
Submission received: 11 July 2023 / Revised: 25 July 2023 / Accepted: 26 July 2023 / Published: 27 July 2023

Abstract

:
To address the problems of traditional insurance compensation methods for flood losses, such as difficulty in determining losses, poor timeliness, a complicated compensation process and moral hazard, an urban flood index insurance tiered compensation model integrating remote sensing and rainfall multi-source data was proposed. This paper first extracted the area of water bodies using the Normalized Difference Water Index and estimates the urban flood area loss based on the flood loss model of remote sensing pixels. Second, the tiered compensation mechanism triggered by rainfall was determined, and the urban flood index insurance tiered compensation model was constructed using remote sensing and rainfall multi-source data. Finally, the economic losses and flood insurance compensation in urban flood were estimated. The results show that: (1) the geo-spatial distribution of flood-affected areas by remote sensing inversion is consistent with the actual rainfall characteristics of Henan Province, China; (2) based on the flood losses model of remote sensing pixels, the estimated flood losses for Henan Province are CNY 110.20 billion, which is consistent with the official data (accuracy ≥ 90%); and (3) the proposed model has good accuracy (R2 = 0.98, F = 1379.42, p < 0.05). The flood index insurance compensation in Henan Province is classified as a three-tier payout, with a total compensation of CNY 24,137 million. This paper can provide a new approach to estimate large-scale urban flood losses and the scientific design of flood index insurance products. It can also provide theoretical and technical support to many countries around the world, particularly those with underdeveloped flood insurance systems.

1. Introduction

Floods are one of the most severe natural disasters worldwide [1], often causing huge economic losses and serious human casualties [2,3]. In the context of climate warming, extreme rainstorms are becoming more frequent [4] and more prone to causing widespread flooding [5], severely constraining sustainable socio-economic development, for example, floods in Thailand in 2011 [6], flooding along the Elbe River in Germany in 2013 [7], heavy rainfall across central Europe in 2021 [2], an extraordinary rainstorm in Henan in 2021 [8,9,10] and floods in Pakistan in 2022 [11]. Currently, in response to natural disasters, government departments use post-disaster relief to provide assistance [12], with a huge financial burden [13]. Through non-engineering measures such as flood insurance, flood risks and financial expenditures can be effectively reduced. However, as one of the main tools for risk sharing, flood insurance lacks reliable and informative catastrophe risk data for scientific pricing and product design [14], which affects the clarity of insurance compensation [12]. This makes flood insurance still account for a low share of disaster relief [15], and even in areas with high flood risk, flood insurance market penetration is a concern [16,17]. Therefore, there is an urgent need to optimize the design of flood insurance products to address the existing dilemma [18]. In addition, scholars consider that based on predetermined flood loss levels, it helps in reducing the ambiguity of flood insurance compensation [19] and the degree of insurance demand crowding out [20]. On this basis, innovating and optimizing models for determining urban flood losses and insurance compensation have important theoretical and practical significance for increasing the demand for flood insurance, reducing the financial burden on governments and strengthening flood risk management [21].
As a special form of non-engineering measures, flood insurance has the advantages of transferring risk in time and space, facilitating post-disaster recovery and reducing the financial burden on the government. The advantages of urban flood control and drainage management are gradually becoming apparent [22]. However, there is policy-based flood insurance in China, mainly focused on the agricultural sector. Fewer flood insurance policies are targeted toward urban areas [23]. In addition, traditional flood insurance faces prominent problems such as adverse selection [24] and moral hazard [25]. Disaster damage assessment indicators are highly variable, are less fair and lack scientific and theoretical validity [26]. After a flood disaster, traditional insurance has low compensation efficiency and high operating costs. The development and promotion of policy-based flood insurance is severely hampered [27]. In contrast, index flood insurance is based on objective parameters, which can effectively circumvent the above problems. Index insurance uses objective conditions as a trigger indicator [25,27,28] and can provide an inherent ability to pay quickly and have cost efficiency [29]. Operational efficiency is also effectively improved, and equity mechanisms are strengthened. To a certain extent, it can effectively promote sustainable regional development [30].
Compared to the urgent market demand, research on urban flood index insurance is still relatively scarce. Specifically, existing flood insurance-related research has focused on the demand for flood index insurance by potential insured persons [19,31]. Alternatively, index insurance is designed using actual flood loss data [32,33]. However, traditional insurance compensation based on actual losses has high survey costs, prominent moral hazard [25] and vague compensation terms [19]. Second, due to the close relationship between flood index insurance compensation and flood losses, most existing studies on the measurement of flood losses are based on traditional mathematical models. For example, Yaseen (2020) [34] estimated flood losses using a dynamic inoperability input-output model (DIIM); Li (2019) [35] selected depth damage curves and an input–output model to assess losses in the manufacturing sector during floods and to evaluate their fluctuating losses. These studies have contributed to the in-depth study of flood damage assessment models, focusing on solving losses using complex models and mostly based on the input–output model framework [36]. These models have been optimized and improved to be more accurate in determining flood losses, but they are highly dependent on ‘input-output tables’ (typically produced every five years), and the problems of small scale, poor timeliness and difficulty in obtaining data remain unresolved, reducing the credibility of these studies [37]. Therefore, some scholars have proposed that remote sensing data be used for urban flood hazard analysis [38,39]. Remote sensing satellite data can solve the problems of difficult access to ground data and low data timeliness [40]. In addition, remote sensing data combined with GIS can accurately describe the evolutionary patterns of floods and rainfall and quantify flood losses [41]. A number of remote sensing-based flood index insurance studies can be found in the existing research. For example, satellite remote sensing can detect extreme rainfall events and has the possibility of designing flood index insurance [29]. Moderate-resolution imaging spectroradiometer (MODIS) remote sensing data can further identify potential areas for a flood index insurance scheme based on the flood risk assessment [42]. However, these studies have focused on proposing the potential use of remote sensing for the design of flood index insurance products and have neglected further applications of remote sensing in flood insurance, e.g., insurance compensation [9,19]. Therefore, the use of remote sensing in the design of flood insurance coverage is a more important research question.
The establishment of a trigger mechanism is a prerequisite for designing insurance compensation [25,43]. The core of the index insurance trigger is the accurate identification of flood events based on objective criteria and the estimation of flood losses using a simplified loss model [29]. This estimated loss is used as a pre-agreed input value to the payout function in the flood insurance policy contract and is an important factor in determining the amount of flood insurance compensation. Currently, most index products related to flood insurance rely on rainfall or storm speed, sea surface temperature, etc., exceeding a certain threshold [44]. In addition, the principles of trigger parameter selection are fully considered when determining the trigger mechanism for index flood insurance [25,29,45]. That is, the data are collected during the policy period, recorded over a long time series, independently verifiable, and closely related to losses. Therefore, in this paper, the trigger parameter was chosen to be rainfall [23,46,47], which is the core flood-causing factor. However, rainfall data have high spatial variability [48,49], and using them alone to determine insurance compensation is prone to high basis difference risk [44]. Therefore, this paper incorporated large-scale continuous and spatially homogeneous rainfall data (rainfall probability distribution for 1970–2021) into the design of flood index insurance payouts. The aim is to achieve timely and accurate insurance compensation after a flood disaster.
Therefore, this paper focused on urban flood loss estimation and index insurance compensation design: a case study of the 2021 extraordinary rainstorm in Henan Province. The urban flood index insurance tiered compensation (UFIITC) model, which integrates remote sensing and rainfall multi-source data, was proposed. This model is applicable to large-scale urban flood loss determination [9] and can also enrich flood insurance compensation and related product design. The aim of this paper is to apply estimated losses (flood losses based on remote sensing inversion) to flood insurance compensation design. More specifically, this paper first inverted the flood losses of cities in Henan Province based on multidimensional remote sensing data. Second, the rainfall probability distribution was determined by daily rainfall data from 116 meteorological stations in Henan Province during 1970–2021. Then, a UFIITC model was developed for flood index insurance compensation estimation using remote sensing and rainfall multi-source data. Finally, the accuracy of the urban flood economic losses assessment results and the applicability of the UFIITC model were further discussed. This paper effectively solves the problems of the low timeliness and small scale of traditional flood loss assessment models. At the same time, this paper provides theoretical and technical support for the accurate and effective estimation of flood index insurance compensation amounts.

2. Materials and Methods
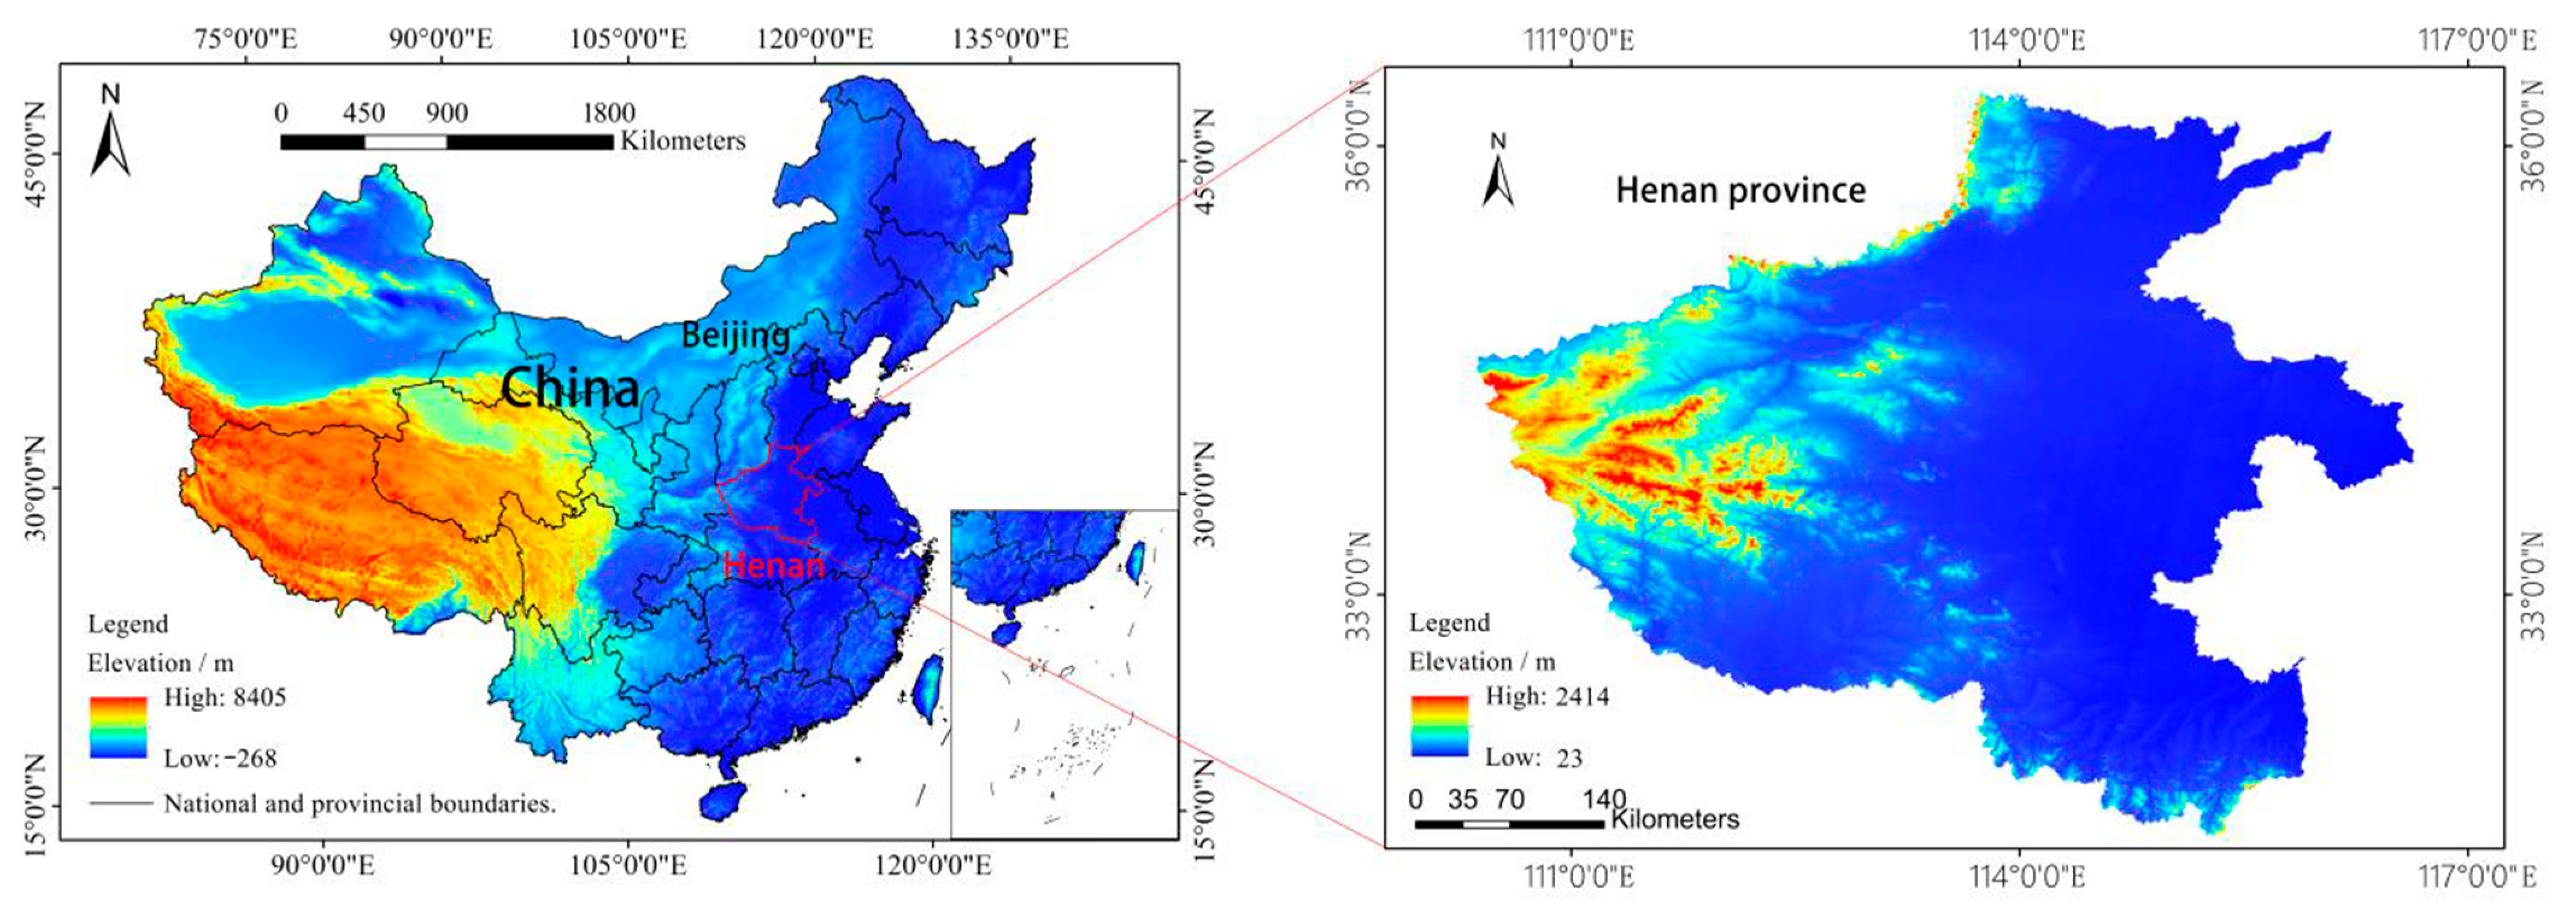
2.1. Study Area

Henan Province (Figure 1) (110°21′–116°39′ E, 31°23′–36°22′ N) is located in east-central China and the middle and lower reaches of the Yellow River. The topography is complex, characterized by a high west and low east, surrounded by mountains in the north, west and south and plains in the east [8]. The total area under its jurisdiction is 167,000 km2 [50]. Henan has the three largest populations in China and the top five GDPs in the country [9,51], with the provincial capital city of Zhengzhou having the highest concentration of economic development, resource leadership and population distribution. The main natural hazards are droughts, floods, hailstorms and earthquakes. Among these, flooding is one of the most damaging disasters, occurring mainly from June to August (Table 1, data from the National Meteorological Information Center, http://data.cma.cn, accessed on 7 January 2022), with an annual average precipitation of about 500–900 mm [52]. Due to increasingly harsh climate and environmental changes, as well as high population density, the vulnerability and exposure to floods have increased in several cities in Henan Province, making them highly susceptible to flooding [53].

2.2. Data Collection

This paper collected relevant data from different cities in Henan Province. Rainfall data (1970–2021) for 116 standard meteorological stations were obtained from the National Meteorological Information Center (http://data.cma.cn, accessed on 7 January 2022). MODIS (the MOD09A1 series data) remote sensing data were obtained from the National Aeronautics and Space Administration (NASA) Goddard Space Center data website (LAADS DAAC) (https://ladsweb.nascom.nasa.gov/search, accessed on 7 December 2021). GDP data were obtained from the 2021–2022 Statistical Yearbook of Henan Province. The Digital Elevation Model (DEM) (30 m resolution) was downloaded from the Geospatial Data Cloud Platform (http://www.gscloud.cn, accessed on 7 December 2021). Night light-based remote sensing data (DMSP/OLS) were obtained from the National Oceanic and Atmospheric Administration (NOAA) satellite data (https://ngdc.noaa.gov/eog/dmsp.html, accessed on 14 December 2021). The consumer price index (CPI) was obtained from the 2022 Statistical Yearbook of Henan Province.

2.3. Methods

2.3.1. Flood Economic Losses Assessment Model

(1)
The Normalized Difference Water Index (NDWI) model
Based on MODIS remote sensing data, combined with the DEM digital elevation model, this paper used the NDWI to decode the area of water bodies before and after the extraordinary rainstorm in Henan in 2021 [54,55].
N D W I = G R E E N N I R G R E E N + N I R
In Equation (1), GREEN is the green band, and NIR is the near infrared band.
(2)
Flood loss model of remote sensing pixels
Based on the remote sensing inversion of large-scale disaster areas in cities, the total economic loss was determined from the flood damage per unit area, calculated as follows:
C l o s s = ( 1 + K ) β A + C p
A = i = 1 n f i
β = α ( 1 + α ) γ β h i s t o r y
C l o s s is the integrated flood economic losses. K is the indirect losses coefficient. Scholars have not yet agreed on the value of indirect loss coefficients for floods [56,57]. The recommended indirect loss coefficients used in China are 15–28% for agriculture and 16–35% for industry [47]; in America, the recommended coefficients are 15% for residential areas, 37% for commercial, 10% for agriculture, 25% for roads and 23% for railways [58]. Generally, scholars choose the middle value of the indirect loss coefficient as the final coefficient [47]. Therefore, based on the adopted middle value, this paper further considers the results of existing studies on the determination of flood losses in Henan Province [9,59] and chooses an indirect coefficient of 20%. β is the direct losses per unit area, calculated from remote sensing spectra and GDP. A is the inundated (flooded) area, calculated from remote sensing pixels in Equation (1). C p is the flood rescue and relief cost, and the real-time relief cost is published on the official government website. f i is the ith pixels of the remote sensing. n is the number of pixels, and the size of each pixel can be calculated based on the resolution of the remote sensing data. β h i s t o r y is the unit area losses of the historical flood level. α is the conversion factor, estimated from the fitting of remote sensing brightness values, and is generally assumed to be 0.04 [10]. γ is the power index, determined from historical years.

2.3.2. The UFIITC Model Integrating Remote Sensing and Rainfall Multi-Source Data

(1)
Design of compensation structure for flood index insurance
Inspired by current forms of insurance payouts [46,60], flood index insurance compensation was designed as a tiered trigger. The compensation design for flood index insurance is shown in Equation (5), and the compensation structure is shown in Figure 2. The basic principle of the compensation structure is as follows: when a certain rainfall band is triggered, the starting lower limit is used as the trigger value (condition) to initiate the compensation, respectively, and the compensation amount for the corresponding tier is determined according to the damage under different rainfall levels. It is important to note that with this tiered compensation, the payout amount for the same rainfall level may vary due to differences in damage in each flood-affected area. Another concern is multiple disaster events, such as the widespread and sustained flooding in Thailand caused by five typhoons in a short period of time in 2010 [44]. In this scenario, it is unclear how the trigger would be triggered. Would the payout need to be triggered for each catastrophic event? For this reason, the trigger for flood index insurance in this paper has been set on the basis of a single catastrophic event. That is, if several heavy rainfall events occur during a flood event, the compensation will be based on the highest rainfall event.
In addition, from a practical perspective, in order to reduce the premium burden, flood index insurance contracts often set maximum compensation limits, such as the Caribbean Disaster Risk Insurance Fund [44]. As the limits, specific parameters need to be determined by taking into account the actual supply and demand of the flood insurance market, premiums and sum insured of policyholders [19,61], even for a large number of insurance actuarial data. Therefore, this paper does not discuss payout limits and only discusses pure compensation amounts for flood index insurance.
I i = { 0 , p < p t r i f ( p ) , p p t r i }
Ii denotes the flood index insurance compensation index for city i; p denotes the 24 h continuous rainfall in city i; and ptri denotes the corresponding flood index insurance compensation trigger threshold for city i (ptri = 24 h continuous rainfall of tri mm or more). Flood index insurance has a deductible [62], where Ii = 0 when p < ptri during the insurance period; i.e., no floods meeting the claim threshold occur in city i, and the insurance company does not pay compensation. When ptrip, Ii = f(p) and the flood with a larger inundation area occurs in city i, then at that point the insurance company is required to pay compensation per level.
(2)
The UFIITC model
Traditional flood insurance compensation requires timely visits to the disaster site for surveys, and moral hazard is prominent [25]. In addition, most index insurance compensation is complex in design, making it difficult for policyholders to understand the structure of the insurance product [46]. However, the UFIITC model, which combines remote sensing and rainfall data from multiple sources, is able to overcome these shortcomings by combining probabilistic rainfall distributions, real historical rainfall data sets and remote sensing inversions of flood losses. Its compensation structure is clear and transparent, with fewer adverse selection problems. Therefore, the construction of the UFIITC model, which integrates remote sensing and rainfall multi-source data to carry out urban flood index insurance compensation, can improve the timeliness and accuracy of insurance compensation, which is conducive to enhancing the confidence of policyholders and creating a good market environment for flood insurance.
The basic steps of the UFIITC model are as follows:
First, by using the flood loss model of remote sensing pixels, we obtained the estimated losses. The estimated losses are the basis for flood index insurance compensation and serve as the input value for the payout function in the insurance contract.
Second, the historical rainfall probability distribution Pi,j of flood-affected cities was determined based on daily rainfall data in Henan Province from 1970 to 2021. Then, the tiered compensation was determined based on the ratio of the maximum rainfall pmax to the total rainfall ptotal during the flood period.
Finally, the UFIITC model was used to estimate the insurance compensation, and regression analysis was chosen to quantitatively evaluate and validate the accuracy of the compensation results.
Based on the flood index insurance payout structure (Figure 2), the compensation estimate can be expressed in Equation (6):
U F I I T C i , j = p max 2 p t o t a l C l o s s ( i , j ) ( 1 j = 1 n P i , j + P i , 5 j )
UFIITCi,j is the compensation amount for the jth flood in city i; Pi,j is the probability distribution value of the rainfall level corresponding to the jth flood in city i, calculated according to the probability density of daily rainfall data in Henan Province from 1970 to 2021; Pi,5-j is the probability of rainfall below the 5-jth flood level in the ith city; Closs(i,j) is the economic loss from flooding corresponding to the jth rainfall level in city i. Closs(i,j) can be obtained from Equation (2); pmax is the maximum daily rainfall during the flooding period and ptotal is the total rainfall.

2.4. Research Framework

First, urban flood loss assessment is completed by using multidimensional remote sensing data, combining related data and the flood losses model of remote sensing pixels. Then, a UFIITC model that integrates remote sensing and rainfall multi-source data is proposed. The estimated losses (losses based on remote sensing inversion) are used as the input value of the pre-agreed payout function in the insurance policy contract, and the flood insurance compensation amount is estimated. Finally, the results of water body extraction, flood loss estimation and insurance compensation are verified. The research framework for this paper is shown in Figure 3.

3. Results

3.1. Assessment Results from the Flood Loss Model of Remote Sensing Pixels

3.1.1. Flood Economic Losses Assessment

Based on the MODIS and DEM data, remote sensing data processing platforms such as ArcGIS (Arc Geographic Information System) and ENVI (The Environment for Visualizing Images) were used to extract the pixel range of flood water bodies and construct flooded water inundation maps (Figure 4). Using the high-precision SHP (Shape is a data format used in ArcGIS 10.2 software) vector boundary in Henan, the area of flooded remote sensing images of each city was extracted and calculated by pixels. Then, we conducted on-site investigations to investigate the flood affected areas in different regions [10]. And through NDWI interpretation of the pre-disaster and post-disaster water bodies, information on the scope of flood disasters was excavated and verified. From Figure 4, the affected pixels are mainly distributed in areas with heavy rainfall, such as Zhengzhou, Luoyang, Kaifeng and other cities. In particular, flooding and inundation were more severe in Zhengzhou. Compared to the pre-disaster information on water bodies, the flooding caused by rainstorm significantly increased the extent of water bodies. Due to the geographical characteristics of Zhengzhou, which is low in the northeast and high in the southwest, the water accumulation after the heavy rainfall is concentrated in the central city, resulting in a severely flooded area in Zhengzhou City.
Using ArcGIS 10.2 software, based on the extraction of the inundated area, the flood loss model of remote sensing pixels was used to calculate the economic losses, and the results are shown in Table 2. Overall, the rainstorm caused different levels of flood damage in various cities. Among them, Zhengzhou City suffered the most severe flood damage, with direct economic losses amounting to CNY 43.179 billion and total losses of CNY 51.815 billion.
From Table 2, the urban inundation area of the cities is mainly concentrated in the range of 200–400 km2. There is a positive correlation between economic losses and urban inundation areas. In other words, the larger the urban inundation area, the greater losses. In terms of direct economic losses per unit area, Zhengzhou (50 million CNY/km2) also far exceeded the other cities. In addition to the impact of widespread heavy rainfall, this reflects problems such as the region’s lagging drainage systems. Zhengzhou is located at the crossroads of north–south and east–west traffic in China and has a high degree of urbanization. While urbanization plays a role in intensifying rainfall [63], areas that tend to be densely populated and GDP-intensive are more prone to flood damage than other areas [64]. Table 2 also shows that the more urbanized and economically developed the area is, the more susceptible it is to flood damage. Due to the presence of the urban heat island effect, the regional rainfall characteristics of cities are more pronounced. In addition, the hardening of urban areas and the increase in impervious surfaces over the years severely hampers rainfall infiltration. The vegetation cover in the city is much lower than that in the suburbs and the countryside. The losses of vegetation’s role in retaining and absorbing rainwater shortens the rainfall catchment time and makes the peak of the floods larger and earlier. For the same rainfall intensity, duration and total rainfall, the affected area and the degree of damage are more severe than before. Therefore, the future urbanization of Henan Province should not only focus on high-quality GDP growth but also consider the development of flood prevention and drainage infrastructure in each city.

3.1.2. Accuracy Verification of Loss Assessment Results

(1)
Reliability validation of the area of flooded water bodies
For the NDWI flooded water body area extraction results, due to the lack of officially flooded data for each prefecture-level city, this paper analyzed the accuracy of the results by comparing the trend of total rainfall and flood inundation area. We regressed the number of affected pixels against the maximum hourly rainfall, which regressed well (Figure 5a); the flooded area generally matched the actual rainfall characteristics (Figure 5b), indicating that the extraction results were reliable to some extent. In addition, for the area of flooded water bodies, Zheng et al. (2023) [9] extracted the flooded area of 5982.9 km2 in Henan Province, which is consistent with our results (5782.82 km2), and Zhang et al. (2021) [65] extracted an area of 941.7 km2 in Zhengzhou City, which is generally consistent with the results of this paper (829.82 km2 in Zhengzhou City). The average accuracy with the results of existing studies is over 90% [9,65].
(2)
Reliability Validation of Flood Losses Assessment Results
According to historical experience, the distribution of economic losses from floods has a strong peak and fat tail feature [66]. To verify the assessment results in this paper, the fat tail test is required. Through descriptive statistics, the results are shown in Table 3. The kurtosis value is much higher than 3, which indicates that the assessment results have sharp peak and fat tail characteristics. This is consistent with the characteristics of the distribution of flood economic losses and can provide a good basis for further analysis.
We also verified the accuracy of the flood losses assessment model. By comparing the official data disclosed by the Henan Provincial Government, an error analysis of the flood economic losses assessment data with the statistical data was conducted, as shown in Table 4. Due to the lack of statistical values for flood economic data for some cities, it is not possible to conduct an error analysis of the assessed values for each city. However, in terms of economic losses in Henan Province and Zhengzhou City, the error between the assessed and statistical values is within 10%. The simulation results are basically consistent with the real flood losses data. It can be seen that the flood economic losses assessment model constructed in this paper has strong accuracy. This model can provide a new way to efficiently measure the economic losses of large-scale urban flood disaster and can also provide a good data foundation for the design of flood index insurance compensation.

3.2. Analysis of Compensation Results from the UFIITC Model

Daily rainfall data in Henan Province from 1970 to 2021 was counted. According to the rainfall levels of the China Meteorological Administration [10], the 50-year rainfall data were, respectively, classified into six types: light rain, moderate rain, heavy rain, rainstorm, heavy rainstorm and extraordinary rainstorm. By analyzing the long time series data, the frequency of rainfall in Henan Province was calculated as shown in Table 5. By fitting the rainfall probability distributions, the fitted curves for each rainfall type were exponentially distributed with R2 ≥ 0.94. The probability of occurrence of each type in Henan Province is shown in Figure 6. The highest percentage of heavy rainfall and below-level is over 96.43%.
From the statistical analysis of historical data by many scholars, it is clear that the economic losses show a good positive correlation with rainfall [1,23]. That is, the higher the rainfall level, the greater the flood disaster level, and the larger the economic losses. Therefore, this paper considers the direct impact of rainfall on floods and further defines floods into four levels. These are general (Level IV), major (Level III), significant (Level II) and especially significant (Level I), as shown in Table 6. Before designing the flood index insurance payout, it is necessary to define the trigger value. The rainfall ptri = 50 mm/24 h is used as the trigger value for flood index insurance compensation. The rationale for choosing a trigger value of ptri = 50 mm/24 h is as follows: if the rainfall is less than 50 mm, even if the flood occurs, the impact on the city’s economic losses is small. Urban infrastructure, transport, economic activities and the movement of people are not affected, and the actual amount of regional damage is negligible. If the rainfall exceeds 50 mm, different economic losses will be caused. The tiered insurance compensation was determined according to the UFIITC model, as shown in Table 6. If the rainfall level is rainstorm, the compensation amount is CNY 1–56 million for each city. When the rainfall level is heavy rainstorm, the compensation amount is CNY 2–359 million. When the rainfall level is extraordinary rainstorm, the payout is CNY 0.109–17.007 billion. The city with the largest compensation amount at all levels is Zhengzhou, and the city with the smallest compensation amount is Jiyuan. Based on the principle of one disaster and the highest rainfall level, the total compensation is shown in Table 6, which is CNY 24.137 billion.

3.3. Accuracy Verification of the UFIITC Model

The difference in compensation values between different levels of flood index insurance is large, and the direct use of this data for the final compensation has relatively little scientific basis. To verify the accuracy of the UFIITC model in estimating insurance compensation results, the model results were compared with international data on insurance industry compensation to cover 30% of disaster losses [67,68], and a regression model was established to verify the accuracy (Figure 7). The two showed a good positive correlation (R2 = 0.98, F = 1379.42, p < 0.05), indicating that the UFIITC model was effective in estimation.

4. Discussion

First, this paper took the extraordinary rainstorm in Henan Province as an example and extracted the area of water bodies post-disaster and pre-disaster by NDWI. Second, the flood losses model of remote sensing pixels was constructed to obtain the flood damage in Henan. Based on the tiered compensation structure (Figure 2), a UFIITC model incorporating remote sensing and rainfall multi-source data was constructed, and insurance compensation was estimated.
(1)
The role of flood index insurance in urban flood risk management
Flood insurance, as one of the important components of non-engineering measures for flood prevention, has the advantages of spreading flood risk, improving the resilience of disaster prevention and reducing the financial burden on the state and has received attention from scholars worldwide [22]. Compared with traditional flood insurance, index insurance can effectively address adverse selection and moral hazard, improve fairness, science and theory and reduce management costs and insurance claim settlement time [25,27]. Properly designed index insurance can be successful in providing substantial welfare improvements for exposed populations [27]. However, index insurance based on meteorological parameters has been widely used by scholars worldwide for agriculture [69,70], and less research has been conducted on index flood insurance for urban flood risks. Moreover, global climate conditions are variable, with different countries having different meteorological conditions, topography and urbanized economic development. Flood management and the design of urban flood index insurance need to be adapted to local conditions, and relying on historical insurance data alone is often unreliable [24]. Therefore, by designing more convenient and low-cost flood index insurance compensation methods [70], it can help improve the plight of low flood insurance coverage rates globally, especially in developing countries [16,17,71].
Compared to drought index insurance and agricultural index insurance [72,73], urban flood index insurance is more complex and requires a greater transformation from observed data (e.g., remote sensing data and rainfall in this paper) to index data [74]. And due to the rapid flow of floods and the destructive nature of disasters [42], financial sustainability (for insurance companies) and the delivery of promised compensation for flood resilience (for policyholders) are particularly critical for urban flood index insurance products [74]. This paper has found that integrating remote sensing data with multi-source rainfall data can be better used for large-scale index insurance compensation design, which enriches existing research findings [42,74]. Moreover, the compensation results based on the UFIITC model have been validated with international insurance industry compensation data sources, which account for 30% of disaster losses [67,68], showing good consistency (Figure 7). This enriches the credibility of remote sensing applications for flood insurance.
(2)
The role of remote sensing in the UFIITC model
The spatial information and extent of urban water bodies are prone to change due to rainfall, evaporation and human activities, especially when heavy rainfall and flooding occur [10]. With the rapid development of satellite remote sensing technology, remote sensing-based water extraction provides an efficient and reliable technical means for monitoring urban water environments [55]. Remote sensing can solve the problems of difficult access to ground data and low data timeliness and has the advantages of high accuracy in fixing losses and efficient data in damage assessment and disaster relief work [40]. Therefore, multidimensional remote sensing was used to decode the flood inundation extent of the extraordinary rainstorm in Henan Province (Figure 4), and the disaster losses of each remote sensing pixel were calculated. As shown in Figure 4, the affected pixels were mainly distributed in areas of heavy rainfall, such as Zhengzhou, Luoyang, Kaifeng and other cities, which is consistent with the findings of existing studies [8,53]. Among them, Zhengzhou City was more severely affected by flooding and inundation, and the heavy rainfall and flooding made the extent of water bodies after the disaster significantly larger than the water body information before the disaster. According to the assessment results based on the flood losses model of remote sensing pixels (Table 2), Zhengzhou City has a direct loss of RMB 0.52 billion/km2 per unit area, which is much higher than other cities. Due to the leading urbanization development in the region, the population density and net asset value per unit are high [75]. In this context, the vulnerability and exposure of urban flood disasters have increased [53], resulting in higher demands for urban flood resistance. Moreover, floods are fast-moving and devastating [42], making it difficult to apply traditional hydrological and hydrodynamic flood assessment models [9]. However, remote sensing data are time-sensitive and are important for determining the damage of urban flooding on a large scale. The flood losses model proposed in this paper can quickly and accurately determine the severity of flooding events, providing technical and data support for the government to carry out flood prevention and emergency rescue.
The results of flood losses in Henan Province (Table 2) are generally consistent with the actual rainfall characteristics and inundation area (Figure 5). This result reinforces the conclusions of existing studies [10]. In addition, for the accuracy of the assessment results, the modeling results of flood economic losses had an error of less than 10% with the official loss data published by the Henan Provincial Government, and the flood losses assessment results were highly accurate (Table 4). The flood losses model of remote sensing pixels can help improve the accuracy of UFIITC model compensation estimation.
(3)
The role of rainfall multi-source data in the UFIITC model
Rainfall is mostly chosen as a trigger parameter in existing index insurance studies [44,46], especially in weather index insurance applications. However, during disasters, short-term rainfall data are variable and have little regularity, and single rainfall data are not characterized by large-scale continuous and uniform rainfall data. Moreover, rainfall at one site is not fully representative of the flooded or insured area, leading to higher basis risk [44,48,49]. Using rainfall alone for compensation design has low reliability. To this end, we explored the supplementation of long-term rainfall multi-source data with single rainfall data. The rainfall probability distribution can reflect the historical rainfall and the frequency of possible floods in an area and is an important indicator of regional disaster [76]. However, few existing studies have combined rainfall probability distributions with flood insurance compensation design. For this reason, this paper innovatively incorporated rainfall probability distributions into the design of insurance compensation, with the aim of improving the scientific and accurate results of compensation. Therefore, this study used rainfall data such as maximum rainfall and rainfall probability distributions to integrate remote sensing inversions of flood economic losses and estimated compensation using the UFIITC model.
In the UFIITC model, unlike previous studies that concluded that probability estimates have inherent uncertainty [77], the rainfall probability distribution derived in this paper (Figure 6) and the fitted curves for each rainfall type are exponentially distributed (R2 ≥ 0.94). The calculation results of the rainfall probability distribution have enriched previous research [78]. Multi-source rainfall data complement and validate each other, enriching the representation of flood-causing information [9]. Therefore, it is necessary to supplement single rainfall data based on multi-source rainfall data [44], which can provide good data support for the scientific compensation of flood insurance [9].
(4)
Future studies
However, this paper has some limitations. Only the NDWI index was used for water body extraction. The applicability of a variety of commonly used water body extraction methods can be further compared in future studies, aiming to improve the accuracy of water extraction and loss estimation. Due to data limitations, we did not fully consider the psychological and behavioral characteristics of the insured group in the design of flood insurance compensation, aiming to avoid the basis risk of index insurance. In the future, based on the methodology of this study, the market supply and demand for flood index insurance and policyholders’ premium expectations and other factors should be considered. This will allow the design of insurance compensation limits to be tailored and improve the science of flood index insurance product design. Additionally, we need to further optimize the structure of the UFIITC model and the rationality of parameters and compare it with other flood insurance compensation methods to improve the accuracy of the compensation results, which will be conducive to creating a good market environment for flood insurance.

5. Conclusions

The main contribution of this paper is to provide a new framework for flood loss quantification and risk management. We have enriched the traditional approach to flood loss assessment by using remote sensing data with sufficient temporal coverage. In addition, we have used rainfall multi-source data to design compensation for flood prevention measures (flood index insurance). Specifically, this paper proposed a UFIITC model that integrates remote sensing and rainfall multi-source data, using the extraordinary rainstorm in Henan Province in 2021 as an example. The UFIITC model can accurately determine the flood economic losses of large-scale cities and estimate the amount of flood insurance compensation. It also addresses the limitations of traditional mathematical models in urban flood losses assessment, such as low timeliness, complex flood insurance determination and compensation processes. The main research findings are as follows:
  • This paper used the flood loss model of remote sensing pixels to invert the flood losses in Henan Province. The flood losses in Henan were CNY 110.20 billion, with an accuracy rate of over 90% when compared with official disaster losses data.
  • Based on the meteorological parameter triggering mechanism, a UFIITC model integrating remote sensing and rainfall multi-source data was constructed to realize the tiered compensation estimation. The flood index insurance compensation in Henan was divided into three tiers, and the total amount of compensation payable was CNY 24.137 billion. The accuracy validation effect by analyzing the results showed that the regression of the UFIITC model was better (R2 = 0.98, F = 1379.42, p < 0.05).
  • The research results achieved the accurate and efficient estimation of economic losses from large-scale urban flooding and flood insurance compensation. This provides guidance for the accurate implementation of urban flood relief in China and can also provide theoretical and technical support for the high-quality development of urban flood index insurance around the world, particularly in countries with incomplete flood insurance compensation systems.

Author Contributions

Conceptualization, Z.W., C.D., X.Z. and S.H.; methodology, Z.W.; software, C.D. and S.H.; validation, X.Z., W.H. and Y.C.; data curation, Z.W. and C.D.; writing—original draft preparation, Z.W. and S.H.; writing—review and editing, Z.W.; visualization, Z.W. and S.H.; supervision, X.Z., S.H. and Y.C.; funding acquisition, X.Z. and Z.W. All authors have read and agreed to the published version of the manuscript.

Funding

This research was funded by National Natural Science Foundation of China (Grant No. 51878385), Sichuan South Development Institute of the Chengdu-Chongqing economic circle (Grant No. CYQCNY20223) and Research Center for Sichuan Liquor Industry Development (Grant No. CJY23-12).

Institutional Review Board Statement

Not applicable.

Informed Consent Statement

Not applicable.

Data Availability Statement

The data analyzed during this study are available on request from the corresponding author.

Conflicts of Interest

The authors declare no conflict of interest.

References

  1. Su, X.; Shao, W.; Liu, J.; Jiang, Y.; Wang, K. Dynamic assessment of the impact of flood disaster on economy and population under extreme rainstorm events. Remote Sens. 2021, 13, 3924. [Google Scholar] [CrossRef]
  2. Yu, Q.; Wang, Y.; Li, N. Extreme flood disasters: Comprehensive impact and assessment. Water 2022, 14, 1211. [Google Scholar] [CrossRef]
  3. Gaagai, A.; Aouissi, H.A.; Krauklis, A.E.; Burlakovs, J.; Athamena, A.; Zekker, I.; Boudoukha, A.; Benaabidate, L.; Chenchouni, H. Modeling and risk analysis of dam-break flooding in a semi-arid montane watershed: A case study of the Yabous dam, Northeastern Algeria. Water 2022, 14, 767. [Google Scholar] [CrossRef]
  4. Schiermeier, Q. Increased flood risk linked to global warming. Nature 2011, 470, 315–316. [Google Scholar] [CrossRef] [Green Version]
  5. Gaagai, A.; Boumezbeur, A.; Benaabidate, L. Failure simulation of Babar dam-Algeria and its impact on the valley downstream section. J. Water Land Dev. 2018, 44, 75–89. [Google Scholar] [CrossRef]
  6. Haraguchi, M.; Lall, U. Flood risks and impacts: A case study of Thailand’s floods in 2011 and research questions for supply chain decision making. Int. J. Disaster Risk Reduct. 2014, 14, 256–272. [Google Scholar] [CrossRef]
  7. Schroter, K.; Kunz, M.; Elmer, F.; Muhr, B.; Merz, B. What made the June 2013 flood in Germany an exceptional event? A hydro-meteorologica evaluation. Hydrol. Earth Syst. Sci. 2015, 19, 309327. [Google Scholar] [CrossRef] [Green Version]
  8. Chen, D.; Pan, C.Y.; Qiao, S.B.; Zhi, R.; Tang, S.K.; Yang, J.; Feng, G.L.; Dong, W.J. Evolution and prediction of the extreme rainstorm event in July 2021 in Henan province, China. Atmos. Sci. Lett. 2023, 24, e1156. [Google Scholar] [CrossRef]
  9. Zheng, X.Z.; Duan, C.F.; Chen, Y.; Li, R.; Wu, Z.X. Disaster loss calculation method of urban flood bimodal data fusion based on remote sensing and text. J. Hydrol. Reg. Stud. 2023, 47, 101410. [Google Scholar] [CrossRef]
  10. Duan, C.F.; Zheng, X.Z.; Jin, L.H.; Chen, Y.; Li, R.; Yang, Y.L. Study on the remote sensing spectral method for disaster loss inversion in urban flood areas. Water 2022, 14, 2165. [Google Scholar] [CrossRef]
  11. Nanditha, J.S.; Kushwaha, A.; Singh, R. The pakistan flood of August 2022: Causes and implications. Earths Future 2023, 11, e2022EF003230. [Google Scholar] [CrossRef]
  12. Landry, C.E.; Turner, D.; Petrolia, D. Flood insurance market penetration and expectations of disaster assistance. Environ. Resour. Econ. 2021, 79, 357–386. [Google Scholar] [CrossRef]
  13. Porrini, D.; Schwarze, R. Insurance models and European climate change policies: An assessment. Eur. J. Law Econ. 2014, 38, 7–28. [Google Scholar] [CrossRef]
  14. Tariq, M.A.U.R.; Hoes, O.A.C.; Giesen, N.C.V.D. Development of a risk-based framework to integrate flood insurance. J. Flood Risk Manag. 2014, 7, 291–307. [Google Scholar] [CrossRef]
  15. Breckner, M.; Englmaier, F.; Stowasser, T.; Sunde, U. Resilience to natural disasters—Insurance penetration, institutions, and disaster types. Econ. Lett. 2016, 148, 106–110. [Google Scholar] [CrossRef]
  16. Landry, C.E.; Mohammad, R.; Parvar, J. Flood insurance coverage in the coastal zone. J. Risk Insur. 2011, 78, 361–388. [Google Scholar] [CrossRef] [Green Version]
  17. Kousky, C.; Michel-Kerjan, E.O.; Raschky, P.A. Does federal disaster assistance crowd out flood insurance? J. Environ. Econ. Manag. 2018, 87, 150–164. [Google Scholar] [CrossRef]
  18. Paresh, S.; Shalika, V.; Pramod, A.; Rao, K.N. Designing weather index insurance of crops for the increased satisfaction of farmers, industry and the government. Clim. Risk Manag. 2019, 25, 100189. [Google Scholar] [CrossRef]
  19. Robinson, P.; Botzen, W.J.W.; Duijndam, S.; Rao, K.N. Risk communication nudges and flood insurance demand. Clim. Risk Manag. 2021, 34, 100366. [Google Scholar] [CrossRef]
  20. Kousky, C.; Michel-Kerjan, E. Examining flood insurance claims in the united states: Six key findings. J. Risk Insur. 2017, 84, 819–850. [Google Scholar] [CrossRef]
  21. Collins, E.L.; Sanchez, G.M.; Terando, A.; Stillwell, C.C.; Mitasova, H.; Sebastian, A.; Meentemeyer, R.K. Predicting flood damage probability across the conterminous United States. Environ. Res. Lett. 2022, 17, 034006. [Google Scholar] [CrossRef]
  22. Crichton, D. Role of insurance in reducing flood risk. Geneva. Pap. Risk Insur. Issues Pract. 2008, 33, 117–132. [Google Scholar] [CrossRef] [Green Version]
  23. Dong, J.S.; Shen, W.; Zhang, Y.; Wu, X.S. Development of weather claiming index for rice rainstorm and flood disasters insurance in Suqian city. Sci. Meteor Sin. 2017, 37, 416–424. [Google Scholar] [CrossRef]
  24. Boudreault, M.; Ojeda, A. Ratemaking territories and adverse selection for flood insurance. Insur. Math. Econ. 2022, 107, 349–360. [Google Scholar] [CrossRef]
  25. Teh, T.L.; Woolnough, C. A better trigger: Indices for insurance. J. Risk Insur. 2019, 86, 861–885. [Google Scholar] [CrossRef] [Green Version]
  26. Mulagha, A.M.; Chiwaula, L.S.; Kambewa, P. Parametric and non-parametric estimates of willingness to pay for weather index insurance in Malawi. Int. J. Disaster Risk Reduct. 2021, 62, 102406. [Google Scholar] [CrossRef]
  27. Barnett, J.B.; Mahul, O. Weather index insurance for agriculture and rural areas in lower-income countries. Amer. J. Agric. Econ. 2007, 89, 1241–1247. [Google Scholar] [CrossRef]
  28. Linnerooth-Bayer, J.; Mechler, R.; Pflug, G. Refocusing diaster aid. Science 2005, 309, 1044–1046. [Google Scholar] [CrossRef] [PubMed] [Green Version]
  29. Vecere, A.; Martina, M.; Monteiro, R.; Galasso, C. Satellite precipitation–based extreme event detection for flood index insurance. Int. J. Disaster Risk Reduct. 2021, 55, 102108. [Google Scholar] [CrossRef]
  30. Zhang, X.D. Remote sensing technology and insurance application: Applicability and challenges. Financ. Theory Pract. 2020, 487, 104–109. [Google Scholar] [CrossRef]
  31. Achtnicht, M.; Osberghaus, D. The demand for index-based flood insurance in a high-income country. Ger. Econ. Rev. 2019, 20, 217–242. [Google Scholar] [CrossRef] [Green Version]
  32. Cole, S.; Stein, D.; Tobacman, J. Dynamics of demand for index insurance: Evidence from a long-run field experiment. Am. Econ. Rev. 2014, 104, 284–290. [Google Scholar] [CrossRef] [Green Version]
  33. Akter, S.; Krupnik, T.J.; Rossi, F.; Khanam, F. The influence of gender and product design on farmers’ preferences for weather-indexed crop insurance. Global Environ. Chang. 2016, 38, 217–229. [Google Scholar] [CrossRef] [PubMed] [Green Version]
  34. Yaseen, Q.M.; Akhtar, R.; Khalil, M.K.U.; Jan, O.M.U. Dynamic inoperability input-output modeling for economic losses estimation in industries during flooding. Socio-Econ. Plan. Sci. 2020, 72, 100876. [Google Scholar] [CrossRef]
  35. Li, W.; Wen, J.; Xu, B.; Li, X.; Du, S. Integrated assessment of economic losses in manufacturing industry in shanghai metropolitan area under an extreme storm flood scenario. Sustainability 2019, 11, 126. [Google Scholar] [CrossRef] [Green Version]
  36. Jin, X.; Sumaila, U.R.; Yin, K. Direct and indirect loss evaluation of storm surge disaster based on static and dynamic input-output models. Sustainability 2020, 12, 7347. [Google Scholar] [CrossRef]
  37. Okuyama, Y.; Santos, J.R. Disaster impact and input-out-put analysis. Econ. Syst. Res. 2014, 26, 1–12. [Google Scholar] [CrossRef]
  38. Huang, C.; Zhang, S.Q.; Dong, L.Y.; Wang, Z.C.; Li, L.Y.; Cui, L.M. Spatial and temporal variabilities of rainstorms over China under climate change. J. Geogr. Sci. 2021, 31, 479–496. [Google Scholar] [CrossRef]
  39. Song, S.; Cao, Z.; Wu, Z.; Chuai, X. Spatial and temporal dynamics of surface water in china from the 1980s to 2015 based on remote sensing monitoring. Chin. Geogr. Sci. 2022, 32, 174–188. [Google Scholar] [CrossRef]
  40. Panteras, G.; Cervone, G. Enhancing the temporal resolution of satellite-based flood extent generation using crowd sourced data for disaster monitoring. Int. J. Remote Sens. 2018, 39, 1459–1474. [Google Scholar] [CrossRef]
  41. Madzimur, F. Applied geographic information system (gis) and remote sensing: Flood hazard risk assessment in the city of Bulawayo. Int. J. Res. Soc. Sci. 2019, 7, 29–47. [Google Scholar] [CrossRef]
  42. Matheswaran, K.; Alahacoon, N.; Pandey, R.; Amarnath, G. Flood risk assessment in South Asia to prioritize flood index insurance applications in Bihar, India. Geomat. Nat. Hazards Risk 2019, 10, 26–48. [Google Scholar] [CrossRef] [Green Version]
  43. Giné, X.; Townsend, R.; Vickery, J. Patterns of rainfall insurance participation in rural India. World Bank Econ. Rev. 2008, 22, 539–566. [Google Scholar] [CrossRef] [Green Version]
  44. Tellman, B.; Lall, U.; Islam, A.K.M.S.; Bhuyan, M.A. Regional index insurance using satellite-based fractional flooded area. Earth’s Future 2022, 10, e2021EF002418. [Google Scholar] [CrossRef]
  45. Figueiredo, R.; Martina, M.L.V.; Stephenson, D.B.; Youngman, B.D. A probabilistic paradigm for the parametric insurance of natural hazards. Risk Anal. 2018, 38, 2400–2414. [Google Scholar] [CrossRef] [PubMed]
  46. Xiao, Y.G.; Yao, J. Double trigger agricultural insurance products with weather index and yield index. China Agric. Econ. Rev. 2019, 11, 299–316. [Google Scholar] [CrossRef]
  47. Liu, H.; Liu, F.; Zheng, L.; Chen, X.L. Research on flood disaster in northern cities combining risk analysis and loss assessment: Taking the heavy rainstorm and flood disaster in Zhengzhou City in July 2021 as an example. J. Cent. China Norm. Univ. (Nat. Sci.) 2023, 57, 59–68. [Google Scholar] [CrossRef]
  48. Arnaud, P.; Bouvier, C.; Cisneros, L.; Dominguez, R. Influence of rainfall spatial variability on flood prediction. J. Hydrol. 2002, 260, 216–230. [Google Scholar] [CrossRef]
  49. Smith, M.B.; Koren, V.I.; Zhang, Z.Y.; Reed, S.M.; Pan, J.J.; Moreda, F. Runoff response to spatial variability in precipitation: An analysis of observed data. J. Hydrol. 2004, 298, 267–286. [Google Scholar] [CrossRef]
  50. Jiang, C.B.; Zhou, Q.; Shen, Y.X.; Liu, G.F.; Zhang, D. Review on hydrological and hydrodynamic coupling models for flood forecasting in mountains watershed. J. Hydraul. Eng. 2021, 52, 1137–1150. [Google Scholar] [CrossRef]
  51. Zhang, M.; Wang, J. Global flood disaster research graph analysis based on literature mining. Appl. Sci. 2022, 12, 3066. [Google Scholar] [CrossRef]
  52. Zhang, N.; Su, A. Influence of topography on a severe rainfall process in western Henan province. J. Meteorol. Environ. 2014, 30, 16–24. [Google Scholar] [CrossRef]
  53. Deng, G.Q.; Chen, H.; Wang, S.Q. Risk assessment and prediction of rainstorm and flood disaster based on Henan province, China. Math. Probl. Eng. 2022, 2022, 5310920. [Google Scholar] [CrossRef]
  54. Mcfeeters, S.K. The use of the Normalized Difference Water Index (NDWI) in the delineation of open water features. Inter. Remote Sens. 1996, 17, 1425–1432. [Google Scholar] [CrossRef]
  55. Lep, A.; Envelope, E.; Acpf, C. Analysis of the Taquari Megafan through radiometric indices. J. South Amer. Earth Sci. 2022, 119, 104034. [Google Scholar] [CrossRef]
  56. Jonkman, S.N.; Bockarjova, M.; Kok, M.; Bernardini, P. Integrated hydrodynamic and economic modelling of flood damage in the Netherlands. Ecol. Econ. 2008, 66, 77–90. [Google Scholar] [CrossRef]
  57. Sieg, T.; Schinko, T.; Vogel, K.; Mechler, R.; Merz, B.; Kreibich, H. Integrated assessment of short-term direct and indirect economic flood impacts including uncertainty quantification. PLoS ONE 2019, 14, e0212932. [Google Scholar] [CrossRef] [Green Version]
  58. Shi, R.Q.; Liu, N.; Li, L.; Ye, L.M.; Guo, G.F. Application of rainstorm and flood inundation model in flood disaster. Tor. Rain Disasters 2013, 32, 379–384. [Google Scholar] [CrossRef]
  59. She, Y.L.; Zhou, Q.; Qu, S. Dynamic loss assessment of flood disaster industrial chain in China. J. Beijing Ins. Tech. (Soc. Sci. Ed.) 2023, 25, 27–42. [Google Scholar] [CrossRef]
  60. Vedenov, D.V.; Barnett, B.J. Efficiency of weather derivatives as primary crop insurance instruments. Wes. J. Agric. Econ. 2004, 29, 387–403. [Google Scholar] [CrossRef]
  61. Tesselaar, M.; Botzen, W.J.W.; Robinson, P.J.; Aerts, J.C.; Zhou, F.J. Charity hazard and the flood insurance protection gap: An EU scale assessment under climate change. Ecol. Econ. 2022, 193, 107289. [Google Scholar] [CrossRef]
  62. Nguyen, N.Q.; Phung, T.P.; Truong, D.T. Willingness to pay for agricultural flood insurance in the Mekong River Delta. Environ. Hazards 2019, 18, 212–227. [Google Scholar] [CrossRef]
  63. Teja, R.K.; Mrudula, G.; Singh, V.; Srivastava, A.K.; Singh, A.K. Unravelling the causes of 2015 winter monsoon extreme rainfall and floods over Chennai: Influence of atmospheric variability and urbanization on the hydrological cycle. Urban Clim. 2023, 47, 101395. [Google Scholar] [CrossRef]
  64. Yang, W.Y.; Zhang, J.; Krebs, P. Investigating flood exposure induced socioeconomic risk and mitigation strategy under climate change and urbanization at a city scale. J. Clean. Pro. 2023, 387, 135929. [Google Scholar] [CrossRef]
  65. Zhang, W.J.; Liao, Q.T.; Yang, S.; Zhang, X.Y.; Zhang, C.L.; Xiang, M.T.; Lei, Z.M. Urban flood risk management based on the Zhengzhou ‘2021.7.20’ flood model deduction. China Flood Dro. Manag. 2021, 31, 1–4. [Google Scholar] [CrossRef]
  66. Merz, B.; Basso, S.; Fischer, S.; Lun, D.; Blöschl, G.; Merz, R.; Guse, B.; Viglione, A.; Vorogushyn, S.; Macdonald, E.; et al. Understanding heavy tails of flood peak distributions. Water Resour. Res. 2022, 58, e2021WR030506. [Google Scholar] [CrossRef]
  67. Sun, W.J.; Sun, H. Analyzing the factors effecting catastrophe insurance market equilibrium:Based on evolutionary game model. China Econ. 2016, 295, 99–111. [Google Scholar] [CrossRef]
  68. Xia, L.; Qin, T. Development dilemma and optimization of operating mechanism of public welfare forest insurance in China. Financ. Theory Pract. 2022, 513, 109–118. [Google Scholar] [CrossRef]
  69. Masiza, W.; Chirima, J.G.; Hamandawana, H.; Kalumba, A.M.; Magagula, H.B. Linking agricultural index insurance with factors that influence maize yield in rain-fed smallholder farming systems. Sustainability 2021, 13, 5176. [Google Scholar] [CrossRef]
  70. Furuya, J.; Mar, S.S.; Hirano, A.; Sakurai, T. Optimum insurance contract of flood damage index insurance for rice farmers in Myanmar. Paddy Water Environ. 2021, 19, 319–330. [Google Scholar] [CrossRef]
  71. Suykens, C.; Priest, J.S.; Doorn-Hoekveld, V.J.W.; Thuillier, T.; Rijswick, M.V. Dealing with flood damages: Will prevention, mitigation, and ex post compensation provide for a resilient triangle? Ecol. Soc. 2016, 21, 401. [Google Scholar] [CrossRef] [Green Version]
  72. Black, E.; Tarnavsky, E.; Maidment, R.; Greatrex, H.; Mookerjee, A.; Quaife, T.; Brown, M. The use of remotely sensed rainfall for managing drought risk: A case study of weather index insurance in Zambia. Remote Sens. 2016, 8, 342. [Google Scholar] [CrossRef] [Green Version]
  73. Osgood, D.; Powell, B.; Diro, R.; Farah, C.; Enenkel, M.; Brown, M.E.; Husak, G.; Blakeley, S.L.; Hoffman, L.; McCarty, J.L. Farmer perception, recollection, and remote sensing in weather index insurance: An ethiopia case study. Remote Sens. 2018, 10, 1887. [Google Scholar] [CrossRef] [Green Version]
  74. Thomas, M.; Tellman, E.; Osgood, D.E. A framework to assess remote sensing algorithms for satellite-based flood index insurance. IEEE J. Sel. Top. Appl. Earth Observ. Remote Sens. 2023, 14, 2589–2604. [Google Scholar] [CrossRef]
  75. Xu, Z.; Cheng, T.; Hong, S.; Wang, L. Review on applications of remote sensing in urban flood modeling. Chin. Sci. Bull. 2018, 63, 2156–2166. [Google Scholar] [CrossRef]
  76. Rizwan, M.; Anjum, L.; Mehmood, Q.; Chauhdary, J.N.; Yamin, M.; Awais, M.; Muneer, M.A.; Irfan, M. Daily maximum rainfall estimation by best-fit probability distribution in the source region of Indus River. Theor. Appl. Climatol. 2022, 151, 1171–1183. [Google Scholar] [CrossRef]
  77. Miller, A.J.; Arias, M.E.; Alvarez, S. Built environment and agricultural value at risk from Hurricane Irma flooding in Florida (USA). Nat. Hazards 2021, 109, 1327–1348. [Google Scholar] [CrossRef]
  78. Xu, D.; Liu, Y. Research on the effect of rainfall flood regulation and control of wetland park based on SWMM model—A case study of wetland park in Yuanjia village, Qishan county, Shaanxi province. IOP Conf. Ser. Earth Environ. Sci. 2018, 121, 052014. [Google Scholar] [CrossRef]
Figure 1. Remote sensing images of the study area in Henan Province, China.
Sustainability 15 11639 g001
Figure 2. The compensation structure of flood index insurance.
Sustainability 15 11639 g002
Figure 3. Research framework.
Sustainability 15 11639 g003
Figure 4. Extent of water inundation during extraordinary rainstorm in Henan Province, China.
Sustainability 15 11639 g004
Figure 5. Comparison of rainfall and the area of flooded water bodies in Henan: (a) regression model of the number of affected pixels and maximum hourly rainfall; (b) comparison of total rainfall and the area of flooded water bodies.
Sustainability 15 11639 g005
Figure 6. Rainfall probability distribution in Henan Province.
Sustainability 15 11639 g006
Figure 7. Regression analysis of UFIITC model results against international insurance compensation data.
Sustainability 15 11639 g007
Table 1. Some historical rainfall information in Henan, China.
TimeAreas with Heavy Rainfall (City)Maximum Rainfall (mm/24 h)
1975/8/5–8/8Zhumadian1060.3
1982/7/28–8/5Luoyang544
1996/7/28–8/6Xinyang249
2010/7/18–7/20Nanyang432
2016/7/18–7/20Anyang607
2021/7/17–7/23Zhengzhou624.1
Table 2. Assessed value of flood economic losses in Henan Province.
AreaDMSP/OL
DN Value
Number of Remote Sensing Pixels
Affected
Direct Economic Losses
(100 Million CNY)
Indirect Economic Losses
(100 Million CNY)
Direct Economic Losses per Unit Area
(100 Million CNY/km2)
Inundated Area
(km2)
Zhengzhou21,4203871431.7986.360.52829.82
Luoyang53552142111.3722.270.24459.18
Nanyang4335125181.3116.260.19437.96
Xuchang2805178270.5714.110.16432.60
Zhoukou255059259.0211.800.15382.01
Xinxiang4080156247.749.550.14334.84
Shangqiu4335141643.248.650.14312.55
Zhumadian3570145841.778.350.14308.91
Xinyang2040112740.288.060.13303.55
Pingdingshan4590122431.156.230.12268.18
Kaifeng2550201829.845.970.11266.03
Anyang2805119928.555.710.11262.39
Jiaozuo2805144125.815.160.10257.03
Puyang229567918.853.770.08241.59
Luohe1530204317.233.450.07231.52
Sanmenxia1785108012.502.500.07182.21
Hebi102012416.751.350.05145.56
Jiyuan7658504.230.850.05126.91
Table 3. Descriptive statistics of flood economic losses.
Economic LossesMeanCountStd.deviationMedianMin.Max.SkewnessKurtosis
Direct economic losses61.2218.0096.4635.724.23431.793.7014.69
Direct economic losses per unit of area0.1418.000.110.130.050.522.8910.08
Table 4. Error analysis of the flood losses assessment model.
AreaAssessed Results of Direct Economic Losses (100 Million CNY)Real Results of Direct Economic Losses (100 Million CNY)Error (%)
Henan Province1102.001200.68.21
Zhengzhou431.794095.57
Table 5. Rainfall distribution in Henan Province, 1970–2021 (unit: times).
AreaLight Rain
p < 10
Moderate Rain
10 ≤ p < 25
Heavy Rain
25 ≤ p < 50
Rainstorm
50 ≤ p < 100
Heavy Rainstorm
100 ≤ p < 200
Extraordinary Rainstorm
p ≥ 200
Zhengzhou299655926881131
Luoyang31545822477571
Nanyang314057423199211
Xuchang328659527199221
Zhoukou329665529199202
Xinxiang283549019372162
Shangqiu2958594271104192
Zhumadian3615808351147273
Xinyang4238911390163402
Pingdingshan3516672283123274
Kaifeng286252722591153
Anyang271950419682115
Jiaozuo293753421365151
Puyang263750822771221
Luohe3352671295113205
Sanmenxia32226122213541
Hebi209136517063202
Jiyuan299960823568101
Table 6. The tiered compensation of flood index insurance (100 million CNY).
AreaLight Rain, Moderate Rain, Heavy Rain (Level IV)Rainstorm
(Level III)
Heavy Rainstorm (Level II)Extraordinary Rainstorm
(Level I)
Compensation Payable for Rainstorm in Henan in 2021
No CompensationTier OneTier TwoTier ThreeTier Four
Zhengzhou00.563.59170.07170.07
Luoyang00.060.5931.1331.13
Nanyang00.120.5421.410
Xuchang00.110.4619.190.46
Zhoukou00.100.4920.680.10
Xinxiang00.070.3014.3414.34
Shangqiu00.080.4014.680
Zhumadian00.050.258.180.05
Xinyang00.120.4715.770.12
Pingdingshan00.040.186.530.04
Kaifeng00.070.3211.3711.37
Anyang00.040.2711.1111.11
Jiaozuo00.020.094.990.09
Puyang00.050.167.620
Luohe00.020.114.220.11
Sanmenxia00.010.044.570
Hebi00.020.062.362.36
Jiyuan00.010.021.090.02
Disclaimer/Publisher’s Note: The statements, opinions and data contained in all publications are solely those of the individual author(s) and contributor(s) and not of MDPI and/or the editor(s). MDPI and/or the editor(s) disclaim responsibility for any injury to people or property resulting from any ideas, methods, instructions or products referred to in the content.

