Article

Research on Learning Concentration Recognition with Multi-Modal Features in Virtual Reality Environments

Key Laboratory of Intelligent Education Technology and Application of Zhejiang Province, Zhejiang Normal University, Jinhua 321004, China
*
Author to whom correspondence should be addressed.
Sustainability 2023, 15(15), 11606; https://doi.org/10.3390/su151511606
Submission received: 4 July 2023 / Revised: 20 July 2023 / Accepted: 25 July 2023 / Published: 27 July 2023

Abstract

:
Learning concentration, as a crucial factor influencing learning outcomes, provides the basis for learners’ self-regulation and teachers’ instructional adjustments and intervention decisions. However, the current research on learning concentration recognition lacks the integration of cognitive, emotional, and behavioral features, and the integration of interaction and vision data for recognition requires further exploration. The way data are collected in a head-mounted display differs from that in a traditional classroom or online learning. Therefore, it is vital to explore a recognition method for learning concentration based on multi-modal features in VR environments. This study proposes a multi-modal feature integration-based learning concentration recognition method in VR environments. It combines interaction and vision data, including measurements of interactive tests, text, clickstream, pupil facial expressions, and eye gaze data, to measure learners’ concentration in VR environments in terms of cognitive, emotional, and behavioral representation. The experimental results demonstrate that the proposed method, which integrates interaction and vision data to comprehensively represent the cognitive, emotional, and behavioral dimensions of learning concentration, outperforms single-dimensional and single-type recognition results in terms of accuracy. Additionally, it was found that learners with higher concentration levels achieve better learning outcomes, and learners’ perceived sense of immersion is an important factor influencing their concentration.

1. Introduction

In education, learning concentration is closely related to learning quality, as it reflects the learner’s level of focus during learning [1] and is a prerequisite for effective learning [2]. Previous studies have indicated that higher concentration levels facilitate information processing and that highly focused learners can recall previous learned content more quickly and accurately, leading to better learning outcomes [3,4]. Therefore, accurate recognition and timely feedback on learners’ concentration levels are crucial. Recognition results can serve as a basis for learners to self-regulate their learning and help them achieve better learning outcomes.
Currently, there are several approaches for assessing learning concentration. The first approach is based on traditional assessment methods, such as teacher observation or student self-reporting [5,6]. Teachers observe learners’ external behavioral performance or students provide self-reports of their concentration states to assess their concentration. However, these methods rely on subjective perceptions from teachers and students, which can be highly subjective and may not capture real-time and dynamic concentration levels. The second approach involves analyzing physiological data, such as electrocardiogram (ECG) and electroencephalogram (EEG) data, using specialized equipment to assess learners’ concentration levels [7,8]. This method can provide more objective measures of concentration, but the measurement equipment tends to be expensive and cumbersome, making it difficult to apply widely in educational settings. The third approach refers to using machine learning techniques to evaluate concentration. Existing research often utilizes feature data from the three dimensions of cognition, emotion, and behavior. For example, the pupil [9], eye gaze [10], and other features are analyzed to evaluate concentration from a cognitive perspective. Concentration is identified from the emotional dimension by extracting features such as facial expressions [11], text [12], and posture [13]. Behavioral aspects of concentration are evaluated through data collected from learners’ clickstream [14], eye gaze [15], and other behaviors. The above approaches generally fall into two categories: computer interaction data and computer vision data. Currently, concentration recognition methods primarily rely on vision data as the main analytical indicator, with limited utilization of interaction data [16]. Moreover, it fails to consider effectively integrating the three dimensions of cognition, emotion, and behavior. Therefore, there is an urgent need to explore multi-dimensional integration methods for concentration recognition [17].
Because of its “immersive, interactive, and imaginative” features, virtual reality (VR) has been widely applied in K-12 education [18], higher education, and various fields such as language education, engineering education, and medical education [19,20,21]. Among them, researchers usually improve the applicability and experience of head-mounted displays (HMDs) from the perspective of materials and technology [22,23]. But how should concentration recognition based on HMDs be carried out? It is well known that there is a difference between the way data are collected in HMDs versus data collected in traditional classrooms or online learning. For example, due to facial occlusion, facial data cannot be easily captured through cameras. Additionally, the commonly used mouse data in online learning environments are not applicable in VR environments [17]. Although Lin et al. [17] explored an evaluation method for learning concentration in a VR environment by integrating the three dimensions of cognition, emotion, and behavior, the data extracted under each dimension was single type. Hence, it is urgent to explore the recognition of learning concentration in VR environments by integrating multi-dimensional and multi-type feature data.
Therefore, this study aims to propose a method for concentration recognition in VR environments that integrates three dimensions and two types of data. The goal is to explore methods with high accuracy for recognizing learning concentration in VR environments. To explore the research objectives mentioned above, the research questions are the following:
  • Does the accuracy of concentration recognition improve in VR environments when integrating interaction and vision data compared to using a single type of data?
  • Does the accuracy of concentration recognition improve in VR environments when combining cognitive, emotional, and behavioral dimensions compared to using only a single dimension?
  • Do learners with a high perceived sense of immersion in VR environments exhibit better learning concentration? Do learners with higher learning concentrations achieve better learning outcomes?

2. Literature Review

2.1. Concentration Recognition Based on Interaction and Vision Data

In concentration recognition methods, computer vision data features such as learners’ eye gaze, head pose, and facial expressions are typically used for analysis, using either image-based or video-based methods. Image-based methods involve evaluating concentration by analyzing single frames or individual images extracted from videos. However, this method only utilizes spatial information from a single frame and has certain recognition limitations. In contrast, video-based detection methods are better able to capture learners’ real-time concentration. In existing research, video-based methods extract learners’ eye gaze and head pose data as indicators of attention. Veliyath et al. [15] and Daniel et al. [24] used eye gaze data to recognize concentration; they extracted gaze position, task location, gaze duration, gaze rate, gaze count, and other variables as effective evaluation indicators of concentration during the learning process. In video-based methods, head pose can also serve as an indicator of learners’ concentration. Useche et al. [25], Xu et al. [26], and others achieved high accuracy in concentration recognition by analyzing learners’ head pose. They extracted the pitch and yaw values of learners’ head pose to determine their concentration. Their experimental results showed that the head deviation in learners’ head pose could effectively reflect their concentration. Additionally, learners’ facial expressions can also be used to represent concentration. Sharma et al. [27] and Gerard et al. [28] computed a learning concentration score by capturing learners’ facial expression features, classifying expressions, and assigning different weights to them.
In addition to vision data, interaction data can also be used to detect learners’ concentration. However, it has been found that there is limited research on concentration recognition based on interaction data. The primary types include clickstream, text (e.g., discussion text [12] and reflection text [29]), and interactive tests. Some studies have used quizzes to calculate learners’ concentration in e-learning environments [30]. Arwa et al. [31] and Altuwairqi et al. [32] commonly used clickstream data recorded from devices like mice and keyboards in online learning environments to calculate concentration levels.
Integrating multiple feature data from interaction and visual sources can lead to higher accuracy in recognizing learners’ concentration during VR experiences [16]. The strong interactivity within VR environments makes the interaction between learners and the virtual environment essential. The integration of eye-tracking devices with VR devices allows for the capture of eye-gaze-related vision data. Therefore, exploring how to combine the unique interaction data with vision data present in VR environments to identify learners’ concentration in VR settings is worth investigating.

2.2. Concentration Recognition Based on Emotion, Behavior, and Cognition

Cognition, emotion, and behavior are three dimensions that effectively reflect learners’ concentration during learning [33]. Emotion, as a psychological state associated with the brain, reflects learners’ feelings and thoughts during the learning process and can serve as an indicator of their concentration [34]. Data are mainly used to characterize the learner’s learning concentration in terms of emotion through multiple modalities, including facial expressions, posture, and text data [27]. For example, Krithika et al. [35] utilized learners’ head pose data as a primary tool for assessing concentration and understanding learners’ emotional states during the learning process. Khawlah et al. [36] established a connection between learners’ emotions and concentration, proposing an emotion model for detecting learners’ concentration and validating its effectiveness through a series of experiments.
Learners’ learning behaviors reflect their time and effort investment in the learning process, demonstrating their active engagement and dedication to tasks, which serve as a concrete manifestation of learning engagement and concentration levels [37]. Researchers often use indicators such as clickstream data and eye gaze in online environments to evaluate learners’ concentration states. Studies carried out by Keith Rayner [38] showed that when attention is high and learners are concentrated, concentration objects (overt attention) and the direction of eye gaze (overt attention) overlap. Furthermore, during periods of high concentration, people’s eye gaze tends to be stationary, whereas it fluctuates when concentration decreases [16,39]. Additionally, clickstream data, generated by learners’ interactions with web pages with temporal characteristics, reveal the direction, concentration, and shifts of learners’ attention during the learning process. Therefore, these data provide important insights into learners’ concentration and attention [40]. In the context of online learning environments, researchers have explored the characteristics of learners’ concentration based on clickstream data [41].
Existing studies on the cognitive dimension of concentration recognition have focused on children’s attention and have utilized pupil and eye gaze data as indicators for evaluating concentration. Pupil data include the measurement of pupil size and response time (RT), which captures temporal changes in pupil size. Pupil size can serve as an indicator of concentration shifts in the absence of luminance manipulations and can reflect differences in the effort exerted by learners in task completion [42]. Hershman et al. highlighted response time as a widely utilized indicator for detecting cognitive processes. They proposed that increased pupil dilation is associated with greater cognitive resource utilization during task completion in the learning process [43].
With the continuous development of concentration detection techniques and data integration techniques, researchers have started to integrate data from multiple dimensions. For example, Lin et al. fused three dimensions by incorporating facial expressions, visual focus rate, and task mastery as evaluation indicators. The proposed model improved learning concentration and assessment scores by 18% and 15.39%, respectively [17]. However, in this study, each dimension was represented using only one type of data. Hence, it remains a current research question to investigate and validate whether the integration of multiple data features across different dimensions can enhance the accuracy of concentration detection.

3. A Learning Concentration Recognition Approach by Three Dimensions and Two Types

To identify learning concentration in VR environments, it is necessary to select appropriate data. Given the constraints of VR devices and the variability of data dimensions and types in previous studies, we integrated and represented cognitive, emotional, and behavioral dimensions of learning concentration in VR environments using vision data (e.g., pupil, facial expressions, and eye gaze), as well as interaction data (e.g., interactive tests, reflective text, and clickstream). By utilizing these six kinds of data, we constructed an approach for recognizing concentration in three dimensions and with two types of data (Figure 1) and extracted features to explore high-accuracy methods for identifying learning concentration in VR environments. This approach aims to address the issues of missing dimensions and single-modal data in existing research. Additionally, we collected more objective and accurate EEG data reflecting participants’ concentration as the ground truth for calibration. The reliability and accuracy of the equipment have been validated in relevant studies [44].
To facilitate the acquisition of various kinds of data mentioned above, we developed a data acquisition system as depicted in the architecture diagram (Figure 2). A VR head-mounted device and controllers, the HTC Vive head-mounted VR system, was used as the core learning equipment. Data acquisition was derived from the development of three modules: (1) Eye-tracking and facial expressions recognition module. This module is equipped with eye-tracking devices, such as the built-in eye-tracking feature of the HTC Vive Pro Eye, and facial tracking devices like the HTC Vive Facial Tracker. These devices are connected to a computer and are capable of capturing pupil diameters, eye gaze, and facial expression data simultaneously. (2) Interactive tests, reflective text, and clickstream recording module. This module involved the development of C# scripts using Visual Studio 2019. It enables the synchronous recording of interactive tests, reflective text, and clickstream data generated during the learners’ learning process. (3) EEG headset module. This module incorporates an EEG head-mounted device equipped with an integrated TGAM (ThinkGear ASIC Module) chip. It collects brain signals such as Alpha waves, Beta waves, and Theta waves and calculates the learning concentration derived from the EEG system.

4. Experiments Design

4.1. Participants

The participants in this study met the following criteria: (1) non-native English speakers; (2) normal vision or corrected vision; (3) geography majors. Ultimately, the experiment recruited 41 students from a university in Zhejiang, China. The participants included 18 males and 23 females, with ages ranging from 18 to 22 years old. Among the participants, 9 had prior experience with VR, while 32 had no previous experience with VR. These demographic details provide valuable information for conducting statistical analyses and interpreting the results of our research. All participants voluntarily participated in the experiment and signed informed consent forms; they were offered compensation after the experiment. Additionally, participants had the right to discontinue the experiment if they experienced any physical discomfort or adverse effects during the process.

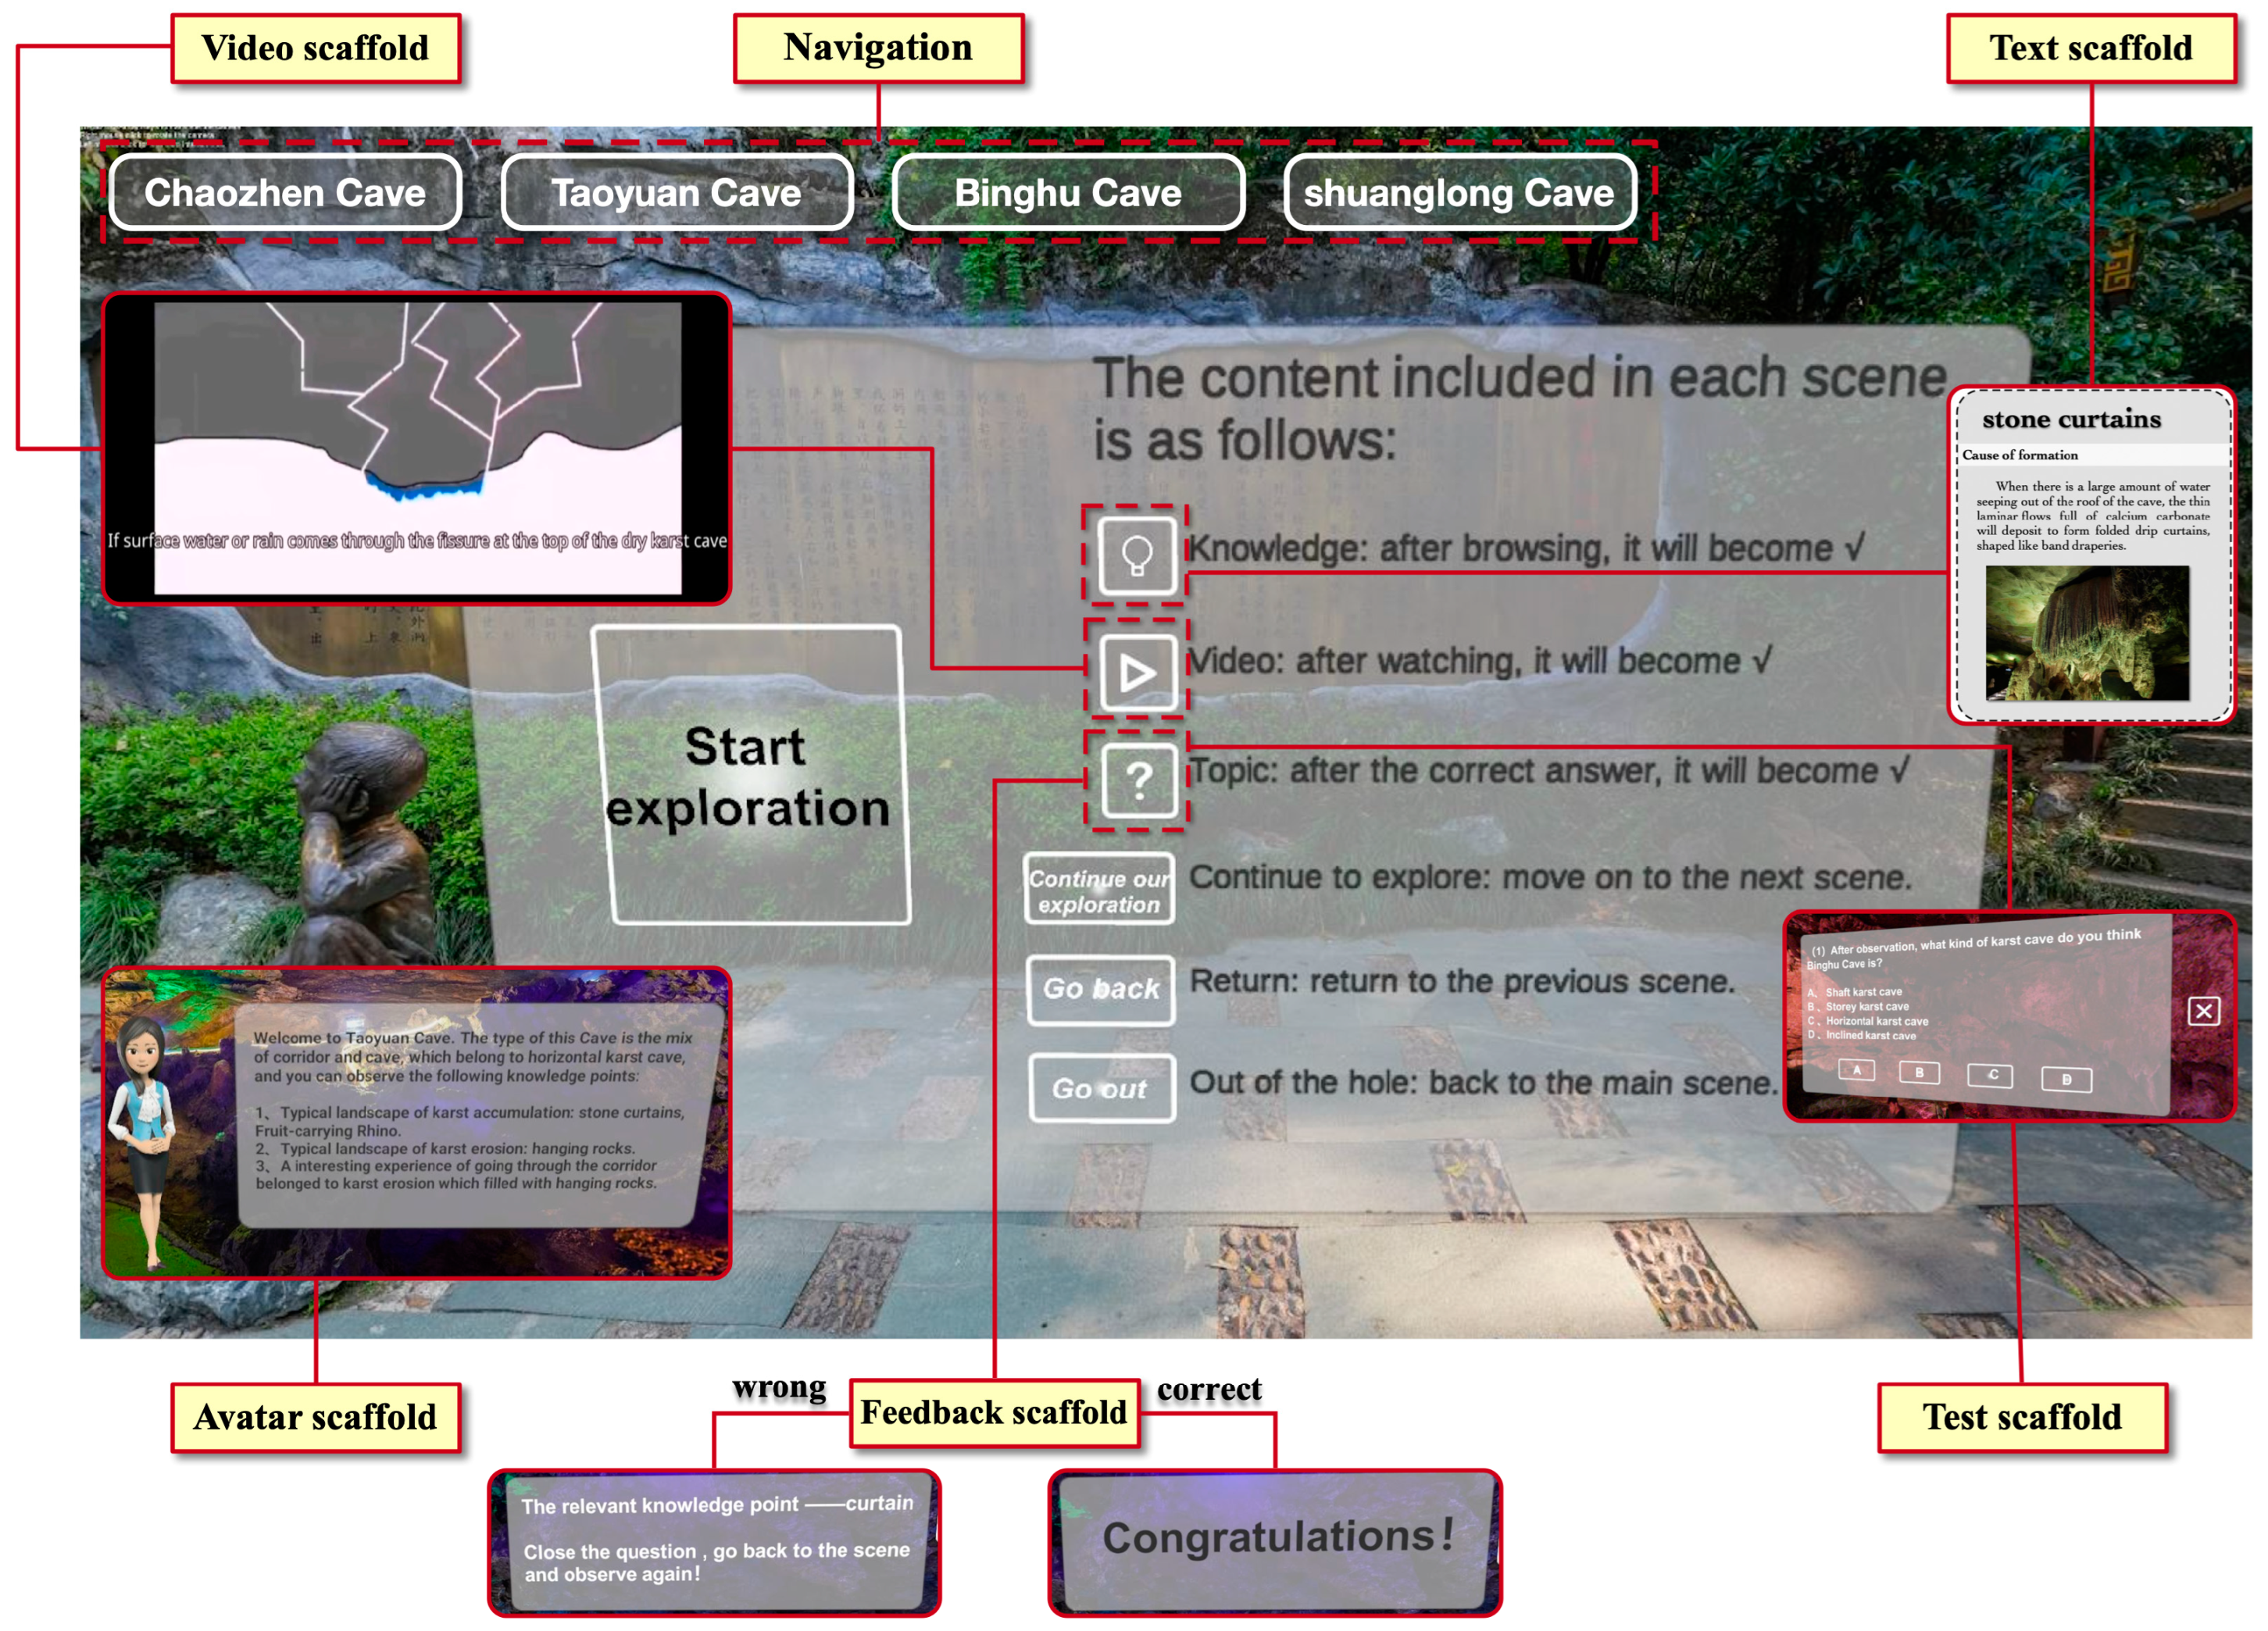
4.2. Experimental Materials and Environment

Language education is one of the important application scenarios for VR, and previous research has shown that VR can have a positive impact on second language teaching [45]. VR applications offer virtual panoramic views, dynamic demonstrations of geographical principles, simulations of spatial–temporal scenes, and interactive contexts for geographical experiments. Therefore, in this study, we selected the topic of “Karst Landforms” within the context of English courses for geography majors. Following the VR design elements proposed by Radianti et al. [46], we developed a VR immersive learning system using Unity 3D (Figure 3).
The system was designed based on the real context of the Shuanglong Cave Scenic Area in Jinhua, Zhejiang Province (a typical karst landform site). Four learning scenarios were created, each featuring realistic landform scenes. These scenarios allow learners to freely explore the environment, interact with learning materials (text, images, videos), engage with avatars, test their understanding, receive feedback, and make meaningful choices for scene transitions. The learning process in each scenario took 10 to 20 min, with a 5 min break during scene transitions. Therefore, the total learning duration was approximately 60 min. Before and after the VR experience, a vocabulary knowledge test was conducted. The test items, consisting of a total of 16 vocabulary terms, were extracted by a geography English teacher with over ten years of teaching experience of the study topic. Participants rated their understanding of each vocabulary term on a scale from 1 to 4, where 1 represented “I have seen this word before, but I don’t know what it means” and 4 represented “I know this word and can accurately write its meaning”.
The experiment was conducted in a laboratory setting, equipped with a desktop computer, an HTC Vive Pro Eye system, an HTC Vive Face Tracker, and a brainwave headband device with an embedded ThinkGear AM chip. The laboratory space was designed to meet the requirements for participants’ VR experiences. Participants used the aforementioned devices in the laboratory to engage in VR learning. C# scripts were embedded in the VR system to capture the participants’ interaction data during the learning process.

4.3. Experimental Procedure

Upon arrival at the experimental site, the experimenter first introduced the experimental procedure (Figure 4) and provided instructions to the participants. After ensuring that the participants had no further questions, they were required to complete a pre-test to assess their vocabulary knowledge. Subsequently, the participants were assisted in wearing the VR devices with eye-tracking capabilities (HTC Vive Pro Eye), facial expression recognition devices (HTC Vive Face Tracker), and brainwave headband devices (ThinkGear ASIC Module). After verifying the proper functioning of the devices, the participants underwent a 5 min baseline test which served as a familiarization process with the experimental environment. Following the baseline test, the participants proceeded with the VR-based learning activities. At the end of the experiment, the experimenter saved the collected data from the devices and assisted the participants in removing the equipment. The participants then completed a post-test to assess their vocabulary knowledge and filled out a questionnaire on the sense of their immersion experience. The immersion questionnaire was adapted from the sense of presence and immersion dimensions of the game engagement questionnaire developed by Brockmyer et al. [47]. All items (N = 3) were prefaced with a specific environment identifier. For example, “I lose track of time” would be revised as “In the VR environment, I lose track of time”. Participants rated their agreement on a 5-point Likert scale, ranging from strongly disagree to strongly agree. The questionnaire demonstrated high internal consistency and reliability, as indicated by a Cronbach’s alpha value of 0.655.

5. Data Processing and Results

The collected data were screened after the experiment was completed to eliminate samples with missing or incorrect data. The data were collected for each scene experienced by each experimenter, resulting in a total of 147 experimental data samples. Each sample consisted of data collected from three components: HTC Vive Pro Eye, HTC Vive Facial Tracker, and C# scripts, along with the wearable EEG device. The vision data collected from the HTC Vive Pro Eye and the HTC Vive Facial Tracker included eye movements, pupil diameters, and facial expressions. The interaction data collected from the C# scripts included all of the learners’ click actions and non-vision data. Based on the interaction data, we extracted data such as interactive tests, clickstream, and reflective text on the learning process. The collected EEG concentration values in the experiment were recorded at frame intervals, ranging from 0 to 100. To create suitable labels for machine learning classification, we calculated the average EEG concentration value for each sample. Subsequently, based on the criteria of Low (0–40), Medium (40–60), and High (60–100) [48], we assigned appropriate labels to each sample. The validity of the data has been confirmed through relevant research studies [44].

5.1. Features Extracted

Feature extraction was performed on the six kinds of collected data. Text and facial expressions can yield numerous features. For instance, using the open-source tool “TextMind” Chinese Psychological Analysis System (ccpl.psych.ac.cn/textmind/, accessed on 20 June 2023) can generate over a hundred features. Regarding facial expressions, the HTC Vive Facial Tracker captured 38 features. To minimize interference from irrelevant features in machine learning, we selected 14 emotion-related features from both text and facial expressions.
Each learning scenario consisted of several parts, including avatar guidance, knowledge testing, meaning selection (scenario transitions), and content learning (based on visual and textual information, videos, and audio). Based on these components, eye gaze and clickstream features were extracted. According to validated effective features from relevant studies and commonly used feature selection methods, 2, 43, 8 and 16 features were extracted from four kinds of data: interactive test, clickstream, pupil diameters, and eye movements, respectively [15,24,49,50,51,52,53]. In the end, a total of 83 features were extracted from the six kinds of data (Table 1).

5.2. Machine Learning Approach

To initially assess the differences in classification performance, four commonly used machine learning methods (Simple Logistic, Decision Tree, Random Forest, and Support Vector Machine) were selected to perform classification tasks with concentration as the target label. We implemented these four machine learning models using Python and its machine learning library, scikit-learn.

5.2.1. Data Preprocessing

We first conducted data preprocessing, including handling missing values, stand-ardization, and normalization. We utilized the data preprocessing module in scikit-learn to perform these steps. Additionally, we computed the mean values of EEG concentration data for each sample and assigned concentration labels to them based on the criteria mentioned earlier. Among the 147 available samples, the distribution of labels was as follows: High (34%), Medium (44%), and Low (22%).

5.2.2. Data Partitioning

We adopted five-fold cross-validation to enhance the robustness of the models. This involved splitting the data into five equally sized subsets; in each of the five experiments, one subset was used as testing data while the remaining four subsets were used as training data. The final experimental results were obtained by averaging the results of the five experiments.

5.2.3. Model Setting

To compare model performance in non-specific cases, the parameters of the four models were set to commonly used and general values in machine learning classification. The maximum depth, minimum samples for leaf nodes, and minimum samples required for splitting in the Decision Tree and the Random Forest models; the regularization parameters in the SVM and the Simple Logistic models; as well as other parameters were not subjected to specific settings to ensure the universality of the models’ results.

5.2.4. Performance Parameters

To evaluate the performance of the models in multi-class classification, the classification report function was used to obtain performance parameters (precision, recall, and F1 score) for each of the three concentration labels. The classification report function automatically separately considered each concentration label as the “positive” ones and provided the performance parameters, then calculated weighted averages based on the sample proportions to obtain the final precision, recall, and F1 scores. These performance parameters provide a comprehensive assessment of the model’s classification and prediction capability [54].

5.3. Results

To evaluate the differences in concentration recognition performance under different feature input conditions, the classification performance of machine learning models was assessed for various inputs, including single-dimensional data, single-type data, and complete data.

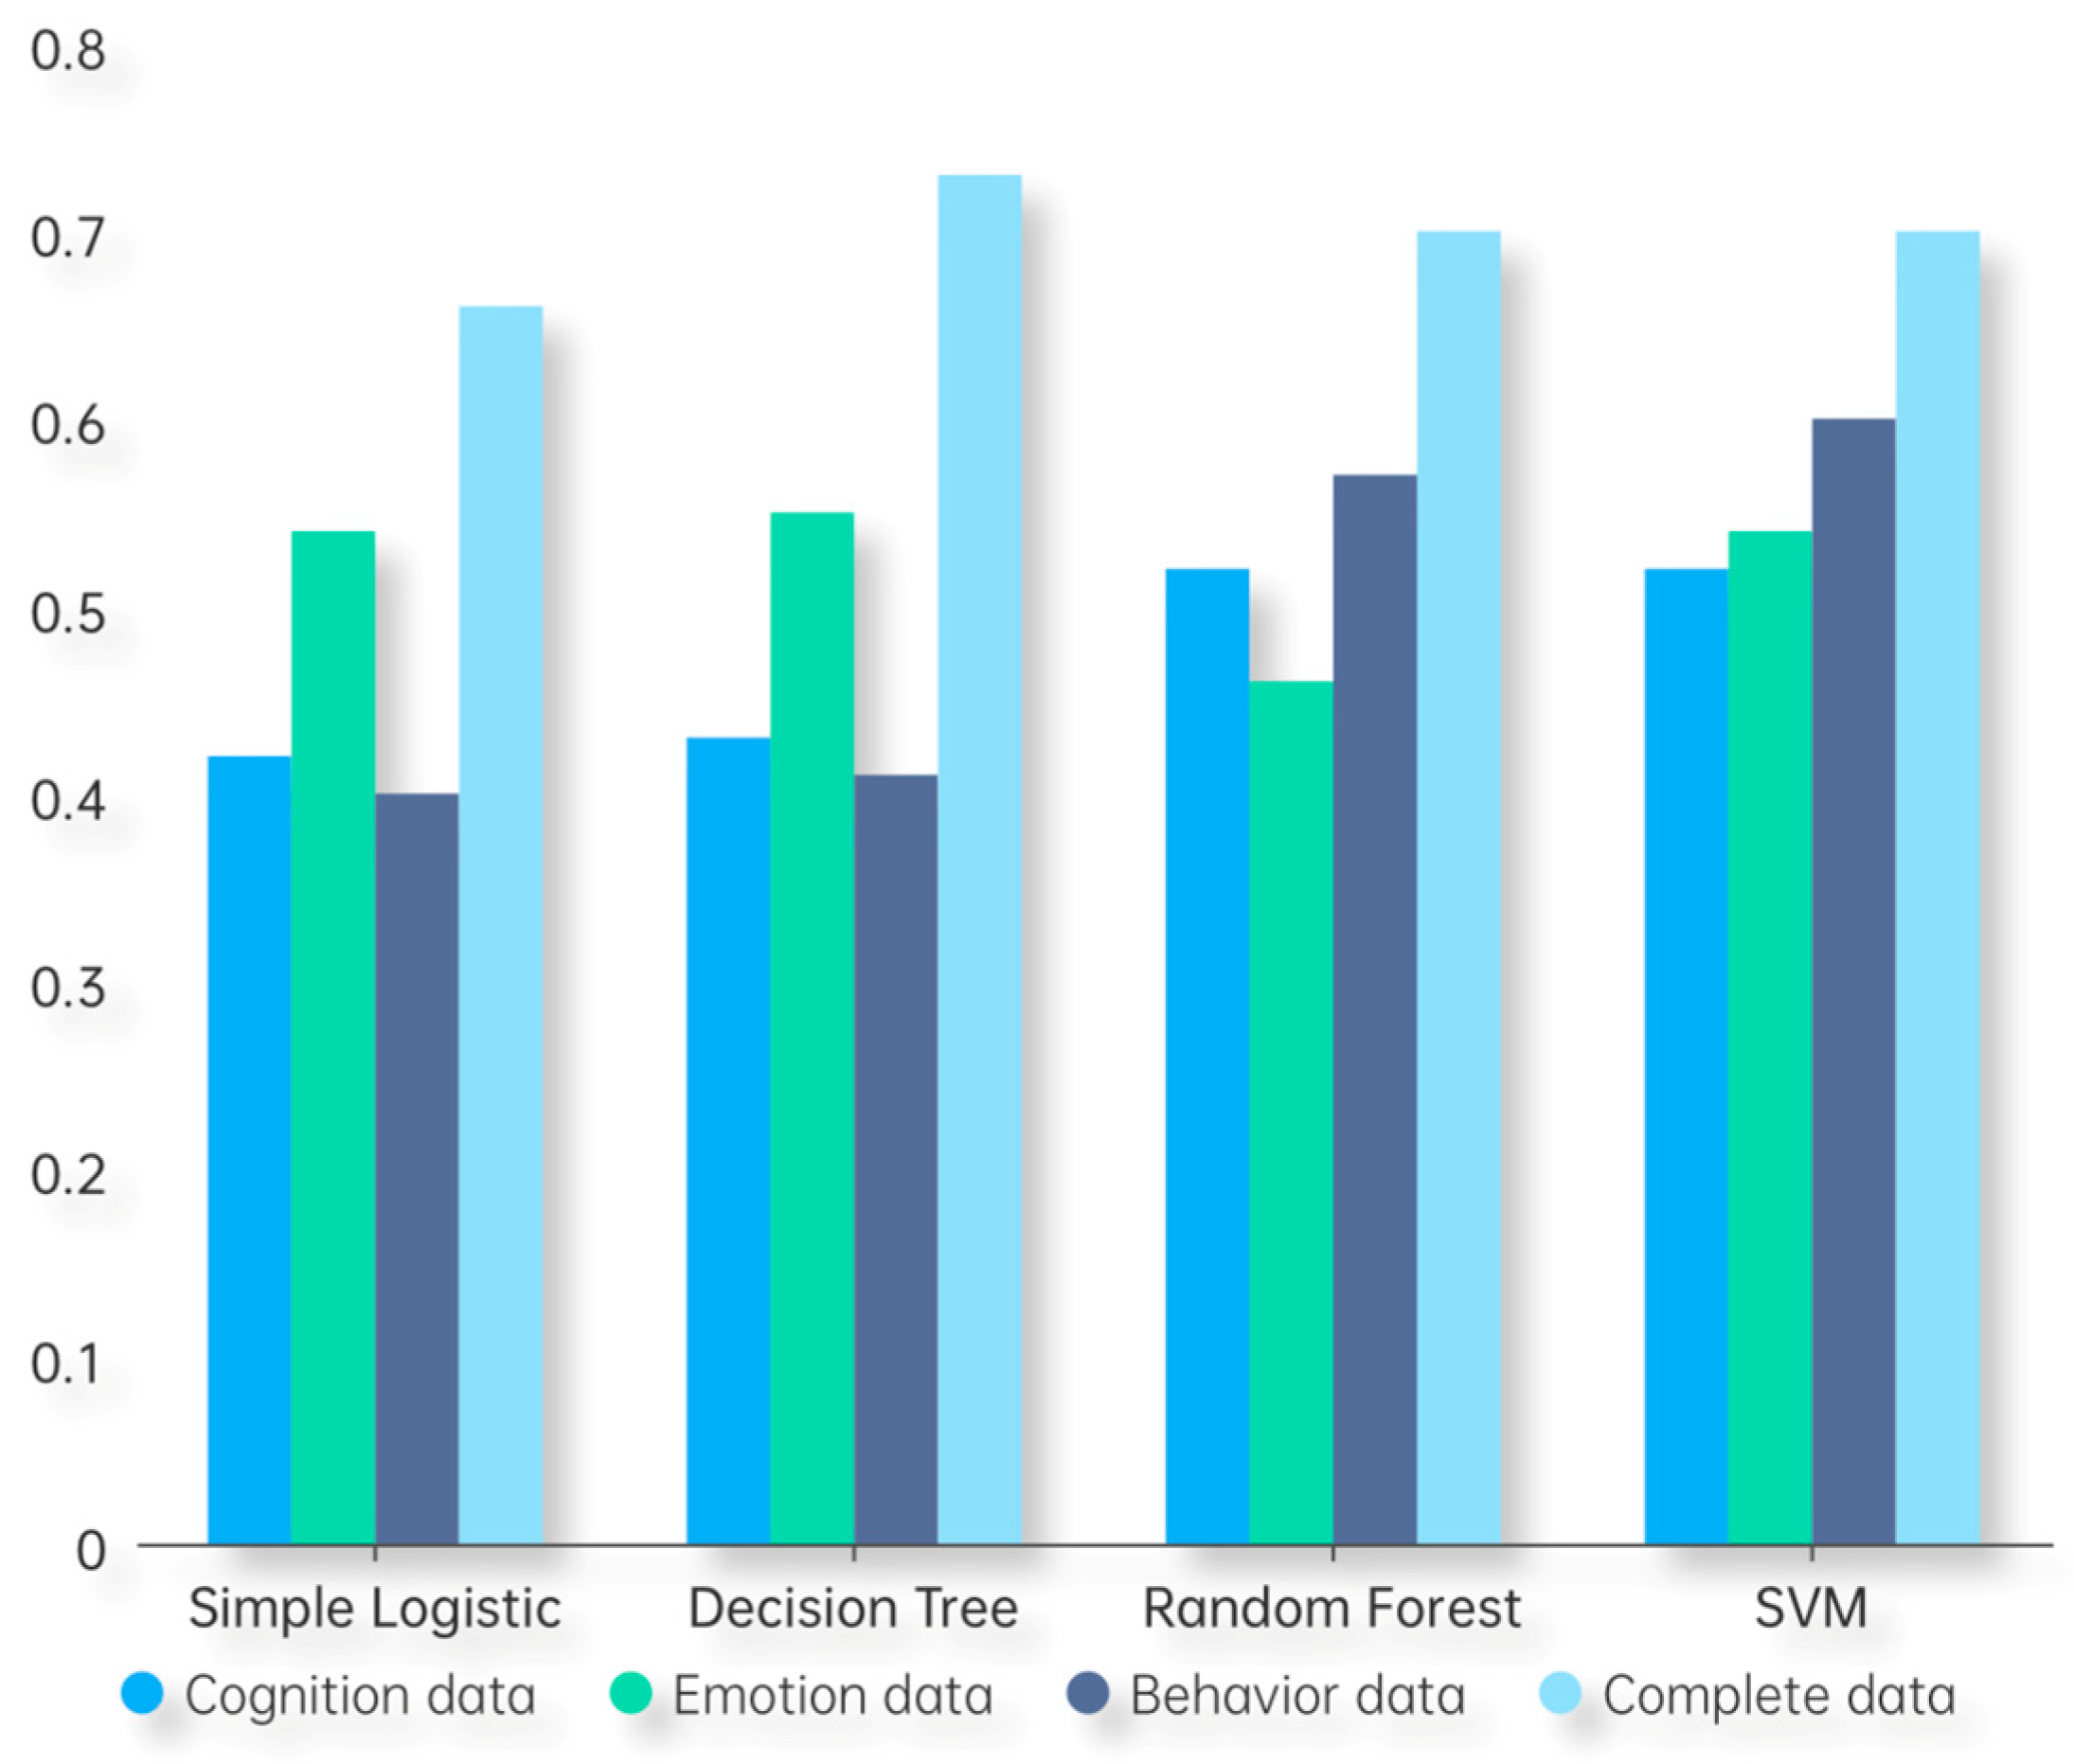
5.3.1. Recognition with Single-Dimensional Data

The classification results for the cognitive dimension only, behavioral dimension only, and emotional dimension only were unsatisfactory, with F1 scores ranging from 0.40 to 0.60 (Table 2). When using Simple Logistic and Decision Tree as machine learning methods, the emotional-only dimension of data outperformed the other two dimensions, with approximately 10% higher performance parameters. However, the opposite trend was observed when using Random Forest and SVM. Overall, it is evident that no individual dimension of data exhibits superior recognition performance compared to the other two.

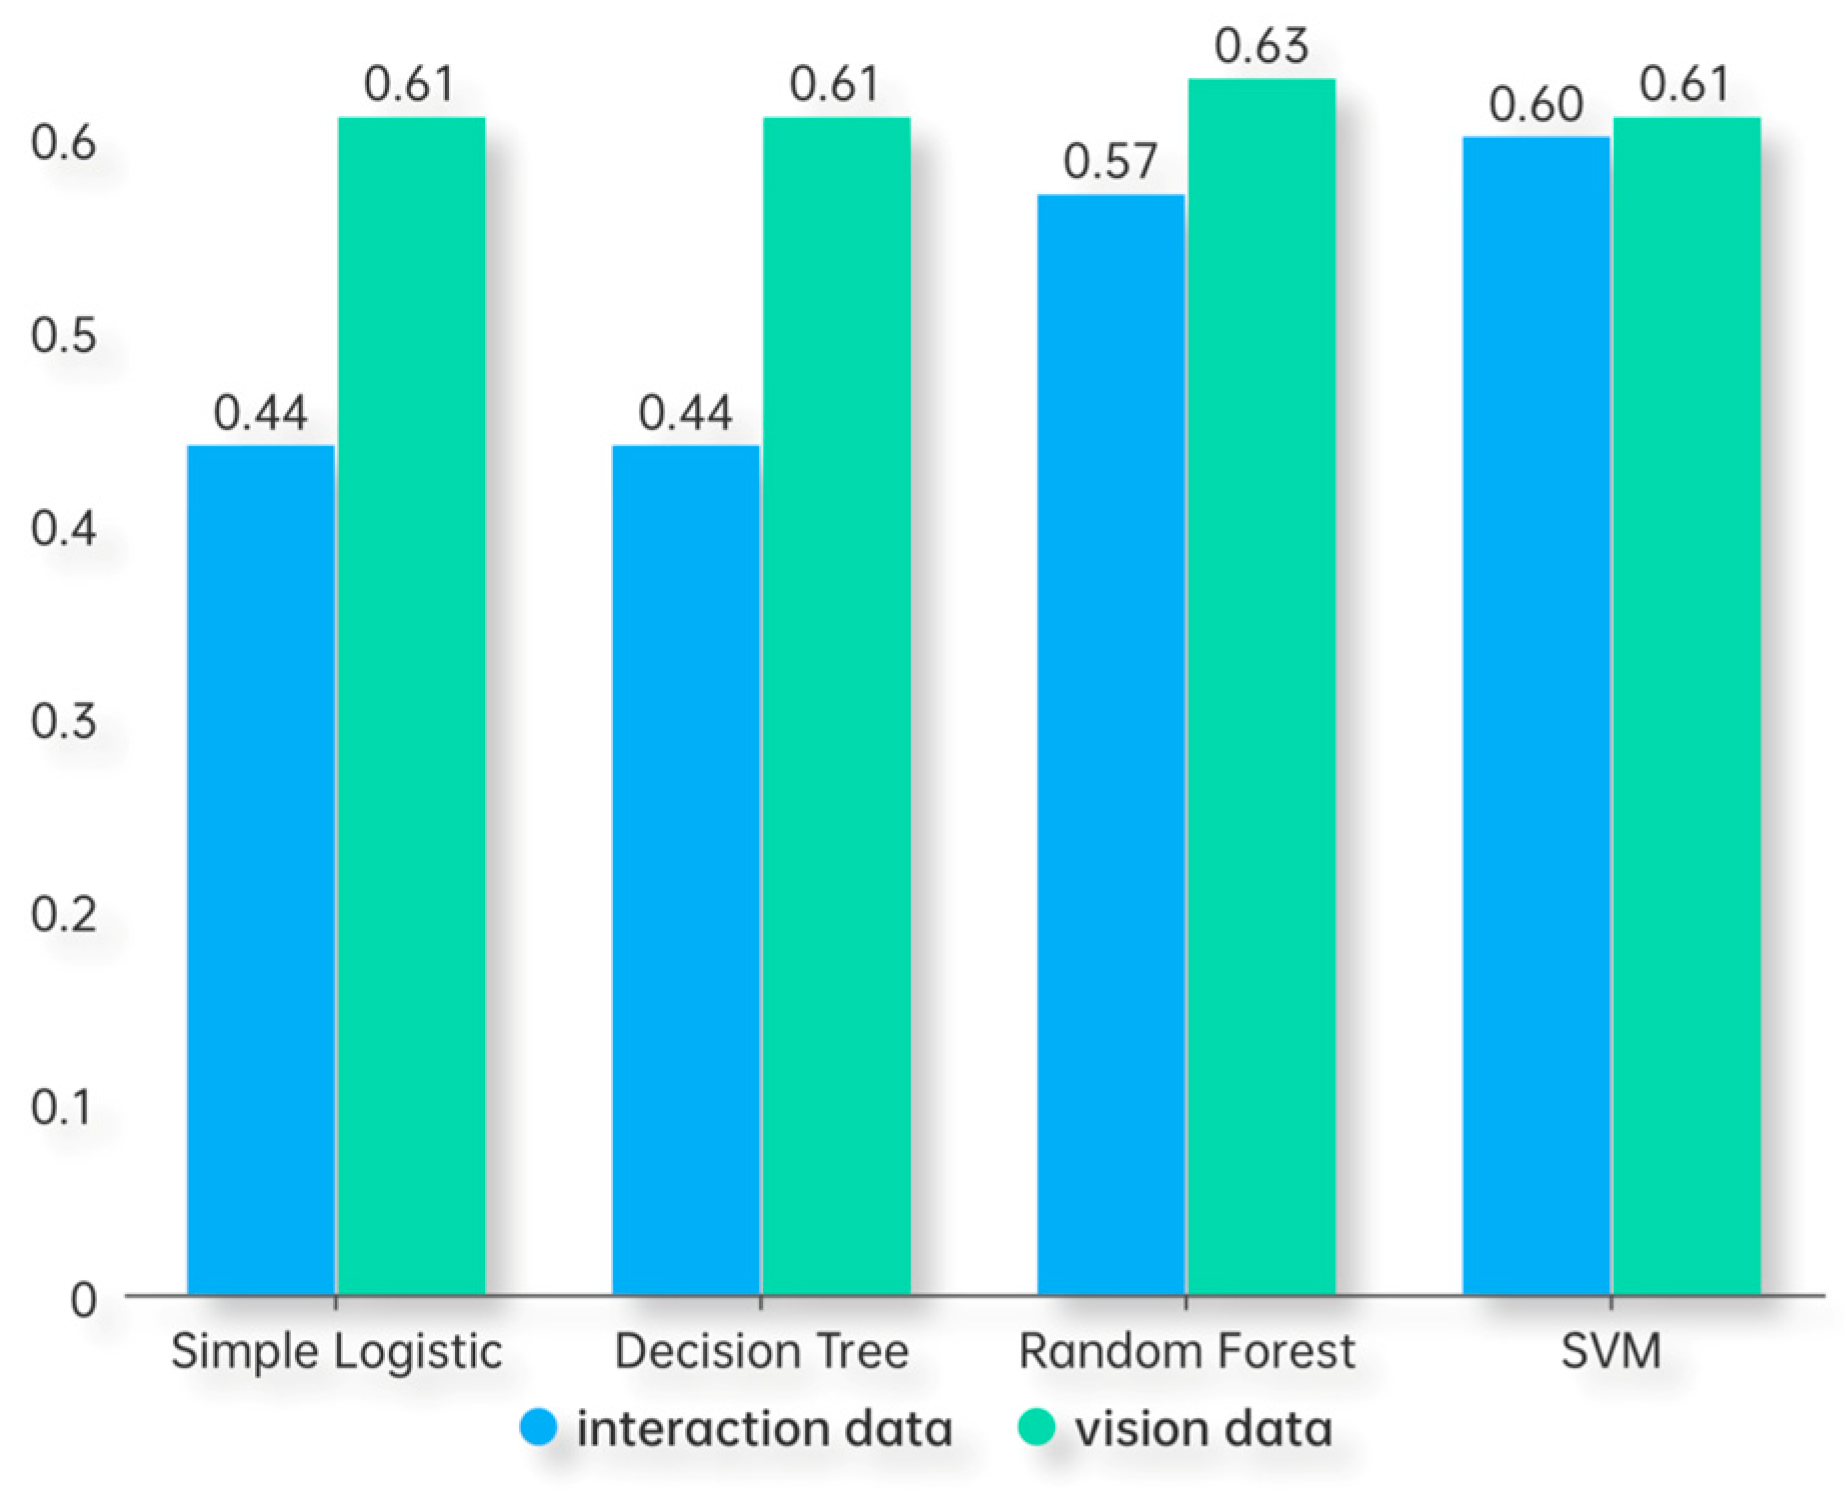
5.3.2. Recognition with Single-Type Data

In terms of data type, the classification recognition results for the models only using vision data were better, with F1 scores above 0.60 (Table 3). While the classification results for the models only using interaction data showed differences when using different machine learning methods, with F1 scores ranging from 0.44 to 0.60, they were generally not as good as the models using vision-only data.

5.3.3. Recognition with Complete Data

When using complete data as the input, all four machine learning methods achieved F1 scores of 0.66 or higher, with the highest value reaching 0.73 (Table 4). The performance parameters of the model improved by 5% to 12% compared to the model only using vision data, indicating that interaction data can serve as a valuable supplement to vision data in recognizing concentration in VR learning environments. It added different information and further enhanced recognition performance. Compared to using single-dimensional data, the improvement ranged from 10% to 30%, suggesting that comprehensive recognition of concentration in learning that considers cognitive, emotional, and behavioral dimensions is more reasonable than using a single-dimensional approach.

5.3.4. Model Validity

To further validate the effectiveness of the complete data, we employed ten-fold cross-validation, obtaining ten F1 scores in each single data input scenario. Subsequently, we performed paired-sample t-tests to compare these F1 scores with the F1 scores of the complete data input (Table 5). The results indicated that the complete data model greatly outperformed the single-dimensional and single-type models, with at least three methods showing significant differences in recognition performance (p < 0.05). This demonstrated that the complete data model has higher validity.

5.3.5. Learning Effect

Correlation tests between learners’ average concentration, perceived sense of immersion, and vocabulary acquisition scores during the experimental process were conducted. The results showed a positive correlation between learners’ concentration and the perceived sense of immersion, with a medium correlation coefficient of 0.496 (p < 0.01). There was also a positive correlation between concentration and learning outcomes, with a medium correlation coefficient of 0.520 (p < 0.01). It is clear that the level of immersion in the VR environment can impact learners’ concentration. Furthermore, learners with a high concentration had better persistence and transferability after learning; that is, they were better able to retain and apply the knowledge that they have acquired.

6. Discussions and Conclusions

In this study, we developed a method for recognizing concentration in VR environments by incorporating cognitive, behavioral, and emotional dimensions, as well as vision and interaction data types. We extracted various features from six kinds of data and employed machine learning methods to evaluate the recognition performance. The results demonstrated that vision data yielded better recognition performance in VR environments, while interaction data served as a supplementary source to further enhance recognition capabilities. Moreover, concentration recognition requires the comprehensive consideration of cognitive, behavioral, and emotional dimensions.

6.1. Better Recognition Capability of Vision Data in VR Environments

As shown in Figure 5, vision data had better a F1 score compared to interaction data. This finding aligns with previous research conducted in online learning environments [55,56], STEM environments [57], and traditional classroom environments [58], where vision data captured through cameras have shown high effectiveness in recognizing concentration. Facial expressions, eye gaze, and other related data serve as important sources for recognizing concentration levels [55,56,57,58]. These results emphasized the continued significance of vision data as a valuable source for recognizing concentration in VR environments. In future educational assessments, non-intrusive data collected through cameras will play a crucial role. Research on learning concentration should place a primary focus on vision data and expand upon this foundation for further exploration.

6.2. Interaction Data as an Effective Supplement for Recognizing Learning Concentration

In this study, it can be observed that the model’s performance was unsatisfactory when using only interaction data (Table 3). However, when combining interaction data with vision data, the recognition capability for learning concentration improved compared to using only vision data, with a performance enhancement of 5–12% (Figure 6). This finding is consistent with research conducted in online learning environments, where relying solely on interaction data for recognizing learning concentration is inefficient, but combining both modalities improve the model’s performance [59]. Interaction data can serve as an effective supplement for recognizing learning concentration and further enhance the effectiveness of concentration recognition. This may be attributed to the fact that single-type data often only provide a partial reflection of the learning process. Interaction data include records of the interactions between learners and computer systems, focusing on learners’ information output behaviors, which can reflect their behavioral patterns and concentration shifts during the learning process, which are not available in vision data [60]. Moreover, collecting interaction data is cost-effective and convenient compared to vision data, and it holds vast prospects for applications [61]. Hence, in highly interactive environments where interaction data are easily obtainable, it should be considered as one of the sources for learning concentration recognition and assessment. This is of crucial importance for future research in learning concentration recognition, particularly in VR environments and online learning environments.

6.3. Integration of Cognitive, Emotional, and Behavioral Dimensions Is Essential for Recognizing Learning Concentration Levels

It is evident that no individual dimension of data exhibited superior recognition performance compared to the other two (Table 2). However, a significant improvement in model performance was observed when the three dimensions of data were combined through data fusion (Figure 7). This indicates that a comprehensive recognition of learning concentration, which considers the cognitive, behavioral, and emotional dimensions, is more appropriate than relying solely on a single dimension for recognition. The learning process is inherently complex, and the occurrence of learning is manifested through a series of changes in learners’ psychological and behavioral characteristics. Therefore, when conducting the recognition of learning concentration, it is imperative to consider these factors comprehensively. Future research on learning concentration necessitates the comprehensive consideration of data from all three dimensions. At present, few studies have integrated data from the cognitive, behavioral, and emotional dimensions, but there is a growing trend towards it [17].

6.4. Limitations and Future Directions

While this study has achieved the expected results, there are still some limitations. Firstly, the limited number of participants led us to divide each participant’s data based on learning scenarios, and the sample size constrained the application of Convolutional Neural Networks (CNNs) and other methods as well as the training effectiveness of the model. When the number of participants exceeds 200, experiments utilizing CNN and other methods can be conducted. Secondly, this study focused on the context of learning English for geography majors, and learning concentration recognition in other contexts requires further exploration. Therefore, future research can expand the sample size, establish datasets in a broader range of research contexts, and extract data that reflect learners’ real levels to construct more accurate models for recognizing learning concentration. Furthermore, in future research, it would be beneficial to explore methods that can procedurally demonstrate the trajectory of concentration changes in learners across dimensions such as cognition, emotion, and behavior. This targeted approach can help enhance learners’ concentration levels in a focused manner. In summary, learning concentration had an impact on learners’ learning outcomes, and the perceived sense of immersion also influenced the results of learners’ learning concentration. The immersion experience and learning concentration in VR environments can serve as important factors for optimizing immersive learning. This provides direction for future research and applications in VR environments.

Author Contributions

Conceptualization, R.H., Z.H. and J.G.; methodology, R.H., Y.L. and J.G.; software, R.H.; validation, R.H. and Z.H.; formal analysis, R.H., Z.H. and J.G.; investigation, R.H., Z.H., Y.L. and J.G.; resources, R.H.; data curation, R.H. and Y.L.; writing—original draft preparation, R.H. and Y.L.; writing—review and editing, J.G.; visualization, R.H. and Z.H.; supervision, J.G.; project administration, R.H. and J.G.; funding acquisition, J.G. All authors have read and agreed to the published version of the manuscript.

Funding

This research was funded by the Zhejiang Office of Education Sciences Planning [grant number GZ2023106].

Institutional Review Board Statement

Not applicable.

Informed Consent Statement

Not applicable.

Data Availability Statement

The data presented in this study are available on request from the corresponding author.

Conflicts of Interest

The authors declare no conflict of interest.

References

  1. Castelló, A.; Chavez, D.; Cladellas, R. Association between slides-format and major’s contents: Effects on perceived attention and significant learning. Multimed. Tools Appl. 2020, 79, 24969–24992. [Google Scholar] [CrossRef]
  2. Arana-Llanes, J.Y.; González-Serna, G.; Pineda-Tapia, R.; Olivares-Peregrino, V.; Ricarte-Trives, J.J.; Latorre-Postigo, J.M. EEG lecture on recommended activities for the induction of attention and concentration mental states on e-learning students. J. Intell. Fuzzy Syst. 2018, 34, 3359–3371. [Google Scholar] [CrossRef]
  3. Smallwood, J.; McSpadden, M.; Schooler, J.W. When attention matters: The curious incident of the wandering mind. Mem. Cogn. 2008, 36, 1144–1150. [Google Scholar] [CrossRef] [PubMed]
  4. Smithson, E.F.; Phillips, R.; Harvey, D.W.; Morrall, M.C.H.J. The use of stimulant medication to improve neurocognitive and learning outcomes in children diagnosed with brain tumours: A systematic review. Eur. J. Cancer 2013, 49, 3029–3040. [Google Scholar] [CrossRef] [PubMed]
  5. Skinner, E.A.; Belmont, M.J. Motivation in the classroom: Reciprocal effects of teacher behavior and student engagement. J. Educ. Psychol. 1993, 85, 571. [Google Scholar] [CrossRef]
  6. Chapman, E.; Assessing Student Engagement Rates. ERIC Digest. 2003. Available online: https://search.ebscohost.com/login.aspx?direct=true&db=eric&AN=ED482269&lang=zh-cn&site=ehost-live (accessed on 3 July 2023).
  7. Belle, A.; Hargraves, R.H.; Najarian, K. An Automated optimal engagement and attention detection system using electrocardiogram. Comput. Math. Methods Med. 2012, 2012, 528781. [Google Scholar] [CrossRef] [PubMed]
  8. Lee, H.; Kim, Y.; Park, C. Classification of Human Attention to Multimedia Lecture. In Proceedings of the 2018 International Conference on Information Networking (ICOIN), Chiang Mai, Thailand, 10–12 January 2018. [Google Scholar]
  9. Benitez, V.L.; Robison, M.K. Pupillometry as a window into young children’s sustained attention. J. Intell. 2022, 10, 107. [Google Scholar] [CrossRef]
  10. Gołębiowska, I.; Opach, T.; Çöltekin, A.; Korycka-Skorupa, J.; Ketil, J.R. Legends of the dashboard: An empirical evaluation of split and joint layout designs for geovisual analytics interfaces. Int. J. Digit. Earth 2023, 16, 1395–1417. [Google Scholar] [CrossRef]
  11. Bouazizi, M.; Ohtsuki, T. Multi-class sentiment analysis on twitter: Classification performance and challenges. Big Data Min. Anal. 2019, 2, 181–194. [Google Scholar] [CrossRef]
  12. Liu, S.; Liu, S.; Liu, Z.; Peng, X.; Yang, Z. Automated detection of emotional and cognitive engagement in MOOC discussions to predict learning achievement. Comput. Educ. 2022, 181, 104461. [Google Scholar] [CrossRef]
  13. Zaletelj, J.; Košir, A. Predicting students’ attention in the classroom from Kinect facial and body features. EURASIP J. Image Video Process. 2017, 2017, 80. [Google Scholar] [CrossRef] [Green Version]
  14. Yue, J.; Tian, F.; Chao, K.M.; Shah, N.; Li, L.Z.; Chen, Y.; Zheng, Q. Recognizing multidimensional engagement of e-learners based on multi-channel data in e-learning environment. IEEE Access 2019, 7, 149554–149567. [Google Scholar] [CrossRef]
  15. Veliyath, N.; De, P.; Allen, A.A.; Hodges, C.B.; Mitra, A. Modeling Students’ Attention in the Classroom Using Eyetrackers. In Proceedings of the 2019 ACM Southeast Conference (ACMSE 2019), New York, NY, USA, 18–20 April 2019. [Google Scholar]
  16. Dewan, M.A.A.; Murshed, M.; Lin, F. Engagement detection in online learning: A review. Smart Learn. Environ. 2019, 6, 1. [Google Scholar] [CrossRef]
  17. Lin, Y.; Lan, Y.; Wang, S. A method for evaluating the learning concentration in head-mounted virtual reality interaction. Virtual Real. 2023, 27, 863–885. [Google Scholar] [CrossRef]
  18. Parmar, D.; Lin, L.; Dsouza, N.; Sophie, J.; Alison, E.L.; Daily, S.B.; Babu, S. How immersion and self-avatars in VR affect learning programming and computational thinking in middle school education. IEEE Trans. Vis. Comput. Graph. 2023, 29, 3698–3713. [Google Scholar] [CrossRef] [PubMed]
  19. Chen, X.X.; Ju, K.S. An analysis of VR language learning applications: Focusing on the apps of speaking and vocabulary learning. J. Dong-Ak Lang. Lit. 2019, 78, 119–150. [Google Scholar] [CrossRef]
  20. Li, F.; Jiang, J.F.; Qin, Q.G.; Wang, X.B.; Zeng, G.Q.; Gu, Y.; Guo, W.T. Application of sustainable development of teaching in engineering education: A case study of undergraduate course design of raman spectroscopy based on virtual reality (VR) technology. Sustainability 2023, 15, 1782. [Google Scholar] [CrossRef]
  21. Gupta, S.; Wilcocks, K.; Matava, C.; Wiegelmann, J.; Kaustov, L.; Alam, F. Creating a successful virtual reality-based medical simulation environment: Tutorial. JMIR Med. Educ. 2023, 9, e41090. [Google Scholar] [CrossRef]
  22. Cheng, D.; Duan, J.; Chen, H.; Wang, H. Freeform OST-HMD system with large exit pupil diameter and vision correction capability. Photonics Res. 2022, 10, 21–32. [Google Scholar] [CrossRef]
  23. Ma, Y.C.; Gao, Y.H.; Wu, J.C.; Cao, L.C. Toward a see-through camera via AR lightguide. Opt. Lett. 2023, 48, 2809–2812. [Google Scholar] [CrossRef]
  24. Daniel, K.N.; Kamioka, E. Detection of learner’s concentration in distance learning system with multiple biological information. J. Comput. Commun. 2017, 5, 1–15. [Google Scholar] [CrossRef] [Green Version]
  25. Useche, O.; El-Sheikh, E. An Intelligent Web-Based System for Measuring Students’attention Levels. In Proceedings of the 2016 International Conference on Artificial Intelligence, Bangkok, Thailand, 24–25 January 2016. [Google Scholar]
  26. Xu, X.; Teng, X. Classroom Attention Analysis Based on Multiple Euler Angles Constraint and Head Pose Estimation. In Proceedings of the 26th International Conference on MultiMedia Modeling, Daejeon, Republic of Korea, 5–8 January 2020. [Google Scholar]
  27. Sharma, P.; Esengönül, M.; Khanal, S.R.; Khanal, T.T.; Filipe, V.; Manuel, J.C.S.R. Student Concentration Evaluation Index in an E-Learning Context Using Facial Emotion Analysis. In Proceedings of the International Conference on Technology and Innovation in Learning, Teaching and Education, Thessaloniki, Greece, 20–22 June 2018. [Google Scholar]
  28. Gerard, N.; Yousuf, T.; Johar, A.H.; Asgher, U.; Malik, I.; Hasan, A.U.; Shafait, F. Detection of Subject Attention in an Active Environment through Facial Expressions Using Deep Learning Techniques and Computer Vision. In Advances in Neuroergonomics and Cognitive Engineering, Proceedings of the AHFE 2020 Virtual Conferences on Neuroergonomics and Cognitive Engineering, and Industrial Cognitive Ergonomics and Engineering Psychology, July 16–20 2020, USA; Springer: Berlin/Heidelberg, Germany, 2021. [Google Scholar]
  29. Zenouzagh, Z.M.; Admiraal, W.; Saab, N. Learner autonomy, learner engagement and learner satisfaction in text-based and multimodal computer mediated writing environments. Educ. Inf. Technol. 2023, 1–41. [Google Scholar] [CrossRef]
  30. Cocea, M.; Weibelzahl, S. Cross-system validation of engagement prediction from log files. N. Learn. Exp. A Glob. Scale 2007, 4753, 14–25. [Google Scholar] [CrossRef]
  31. Arwa, A.; Khawlah, A.; Salma, K.J.; Nihal, A.; Samar, A. CNN-Based Face Emotion Detection and Mouse Movement Analysis to Detect Student’s Engagement Level. In Proceedings of the International Conference on Advanced Intelligent Systems for Sustainable Development, Rabat, Morocco, 22–27 May 2022. [Google Scholar]
  32. Altuwairqi, K.; Jarraya, S.K.; Allinjawi, A.; Hammami, M. Student behavior analysis to measure engagement levels in online learning environments. Signal Image Video Process. 2021, 15, 1387–1395. [Google Scholar] [CrossRef] [PubMed]
  33. Fredricks, J.A.; Mccolskey, W. The measurement of student engagement: A comparative analysis of various methods and student self-report instruments. In Handbook of Research on Student Engagement; Christenson, S., Reschly, A., Wylie, C., Eds.; Springer: Boston, MA, USA, 2012; pp. 763–782. [Google Scholar] [CrossRef]
  34. Ekman, P. Basic Emotions. In Encyclopedia of Personality and Individual Differences; Springer: Cham, Switzerland, 1999; pp. 1–6. [Google Scholar] [CrossRef]
  35. Krithika, L.B.; Lakshmi, P.G.G. Student emotion recognition system (SERS) for e-learning improvement based on learner concentration Metric. Procedia Comput. Sci. 2016, 85, 767–776. [Google Scholar] [CrossRef] [Green Version]
  36. Khawlah, A.; Salma, K.J.; Arwa, A.; Mohamed, H. A New Emotion–Based Affective Model to Detect Student’s Engagement. J. King Saud Univ. Comput. Inf. Sci. 2018, 33, 99–109. [Google Scholar] [CrossRef]
  37. Alemdag, E.; Cagiltay, K. A systematic review of eye tracking research on multimedia learning. Comput. Educ. 2018, 125, 413–428. [Google Scholar] [CrossRef]
  38. Rayner, K. Eye movements and attention in reading, scene perception, and visual search. Q. J. Exp. Psychol. 2009, 62, 1457–1506. [Google Scholar] [CrossRef]
  39. Doherty, K.; Doherty, G. Engagement in HCI: Conception, theory and measurement. ACM Comput. Surv. 2019, 51, 1–39. [Google Scholar] [CrossRef] [Green Version]
  40. Montgomery, A.L.; Li, S.; Srinivasan, K. Modeling online browsing and path analysis using clickstream datal. Mark. Sci. 2004, 23, 579–595. [Google Scholar] [CrossRef]
  41. Guo, P.J.; Kim, J.; Rubin, R. How Video Production Affects Student Engagement: An Empirical Study of MOOC Video. In Proceedings of the First ACM Conference on Learning @ Scale Conference, Atlanta, GA, USA, 4–5 March 2014. [Google Scholar]
  42. Hershman, R.; Milshtein, D.; Henik, A. The contribution of temporal analysis of pupillometry measurements to cognitive research. Psychol. Res. 2023, 87, 28–42. [Google Scholar] [CrossRef] [PubMed]
  43. McLaughlin, D.J.; Zink, M.; Gaunt, L.; Reilly, J.; Sommers, M.S.; Engen, K.V.; Peelle, J.E. Give me a break! Unavoidable fatigue effects in cognitive pupillometry. Psychophysiology 2022, 60, e14256. [Google Scholar] [CrossRef] [PubMed]
  44. Rebolledo-Mendez, G.; Dunwell, I.; Martínez-Mirón, E.; Vargas-Cerdán, M.D.; Freitas, S.; Liarokapis, F.; García-Gaona, A. Assessing neuroSky’s Usasessment Exercise. In Proceedings of the International Conference on Human-Computer Interaction, San Diego, CA, USA, 19–24 July 2009. [Google Scholar]
  45. Alfadil, M. Effectiveness of virtual reality game in foreign language vocabulary acquisition. Comput. Educ. 2020, 153, 103893. [Google Scholar] [CrossRef]
  46. Radianti, J.; Majchrzak, T.A.; Fromm, J.; Wohlgenannt, I. A systematic review of immersive virtual reality applications for higher education: Design elements, lessons learned, and a research agenda. Comput. Educ. 2020, 147, 103778. [Google Scholar] [CrossRef]
  47. Brockmyer, J.H.; Fox, C.M.; Curtiss, K.A.; McBroom, E.; Burkhart, K.M.; Pidruzny, J.N. The development of the Game Engagement Questionnaire: A measure of engagement in video game-playing. J. Exp. Soc. Psychol. 2009, 45, 624–634. [Google Scholar] [CrossRef]
  48. MindSet Communications Protocol. Available online: http://wearcam.org/ece516/mindset_communications_protocol (accessed on 26 May 2023).
  49. Krejtz, K.; Duchowski, A.; Niedzielska, A.; Biele, C.; Krejtz, I. Eye tracking cognitive load using pupil diameter and microsaccades with fixed gaze. PLoS ONE 2018, 13, e0203629. [Google Scholar] [CrossRef]
  50. Kiefer, P.; Giannopoulos, I.; Duchowski, A.; Martin, R. Measuring cognitive load for map tasks through pupil diameter. Geogr. Inf. Sci. 2016, 9927, 323–337. [Google Scholar] [CrossRef]
  51. Karumbaiah, S.; Ocumpaugh, J.; Baker, R. Predicting math identity through language and clickstream patterns in a blended learning mathematics program for elementary students. J. Learn. Anal. 2020, 7, 19–37. [Google Scholar] [CrossRef] [Green Version]
  52. Crossley, S.A.; Karumbaiah, S.; Ocumpaugh, J.L.; Labrum, M.J.; Baker, R. Predicting Math Success in an Online Tutoring System Using Language Data and Clickstream Variables: A Longitudinal Analysis. In Proceedings of the International Conference on Language, Data, and Knowledge, Leipzig, Germany, 20–23 May 2019. [Google Scholar]
  53. Bota, P.J.; Wang, C.; Fred, A.L.N.; Placido, D.S.H. A Review, current challenges, and future possibilities on emotion recognition using machine learning and physiological signals. IEEE Access 2019, 7, 140990–141020. [Google Scholar] [CrossRef]
  54. Olson, D.L.; Delen, D. Advanced Data Mining Techniques; Springer: Berlin/Heidelberg, Germany, 2008; pp. 39–147. [Google Scholar]
  55. Gupta, S.; Kumar, P.; Tekchandani, R. A multimodal facial cues based engagement detection system in e-learning context using deep learning approach. Multimed. Tools Appl. 2023, 82, 1–27. [Google Scholar] [CrossRef]
  56. Whitehill, J.; Serpell, Z.; Lin, Y.; Fotser, A.; Movellan, J.R. The faces of engagement: Automatic recognition of student engagementfrom facial expressions. IEEE Trans. Affect. Comput. 2014, 5, 86–98. [Google Scholar] [CrossRef]
  57. Alkabbany, I.; Ali, A.M.; Foreman, C.; Tretter, T.; Hindy, N.; Farag, A. An Experimental Platform for Real-Time Students Engagement Measurements from Video in STEM Classrooms. Sensors 2023, 23, 1614. [Google Scholar] [CrossRef] [PubMed]
  58. Sukumaran, A.; Manoharan, A. A survey on automatic engagement recognition methods: Online and traditional classroom. Indones. J. Electr. Eng. Comput. Sci. 2023, 30, 1178–1191. [Google Scholar] [CrossRef]
  59. Li, J.; Ngai, G.; Leong, H.V.; Stephen, C.F. Multimodal human attention detection for reading from facial expression, eye gaze, and mouse dynamics. ACM SIGAPP Appl. Comput. Rev. 2016, 16, 37–49. [Google Scholar] [CrossRef]
  60. Oviatt, S.L. Multimodal Interfaces. In Human-Computer Interaction Handbook: Fundamentals, Evolving Technologies, and Emerging Applications; L. Erlbaum Associates Inc.: Hillsdale, MI, USA, 2007; pp. 286–304. [Google Scholar]
  61. Yamauchi, T. Mouse Trajectories and State Anxiety: Feature Selection with Random Forest. In Proceedings of the 2013 Humaine Association Conference on Affective Computing and Intelligent Interaction, Geneva, Switzerland, 2–5 September 2013. [Google Scholar]
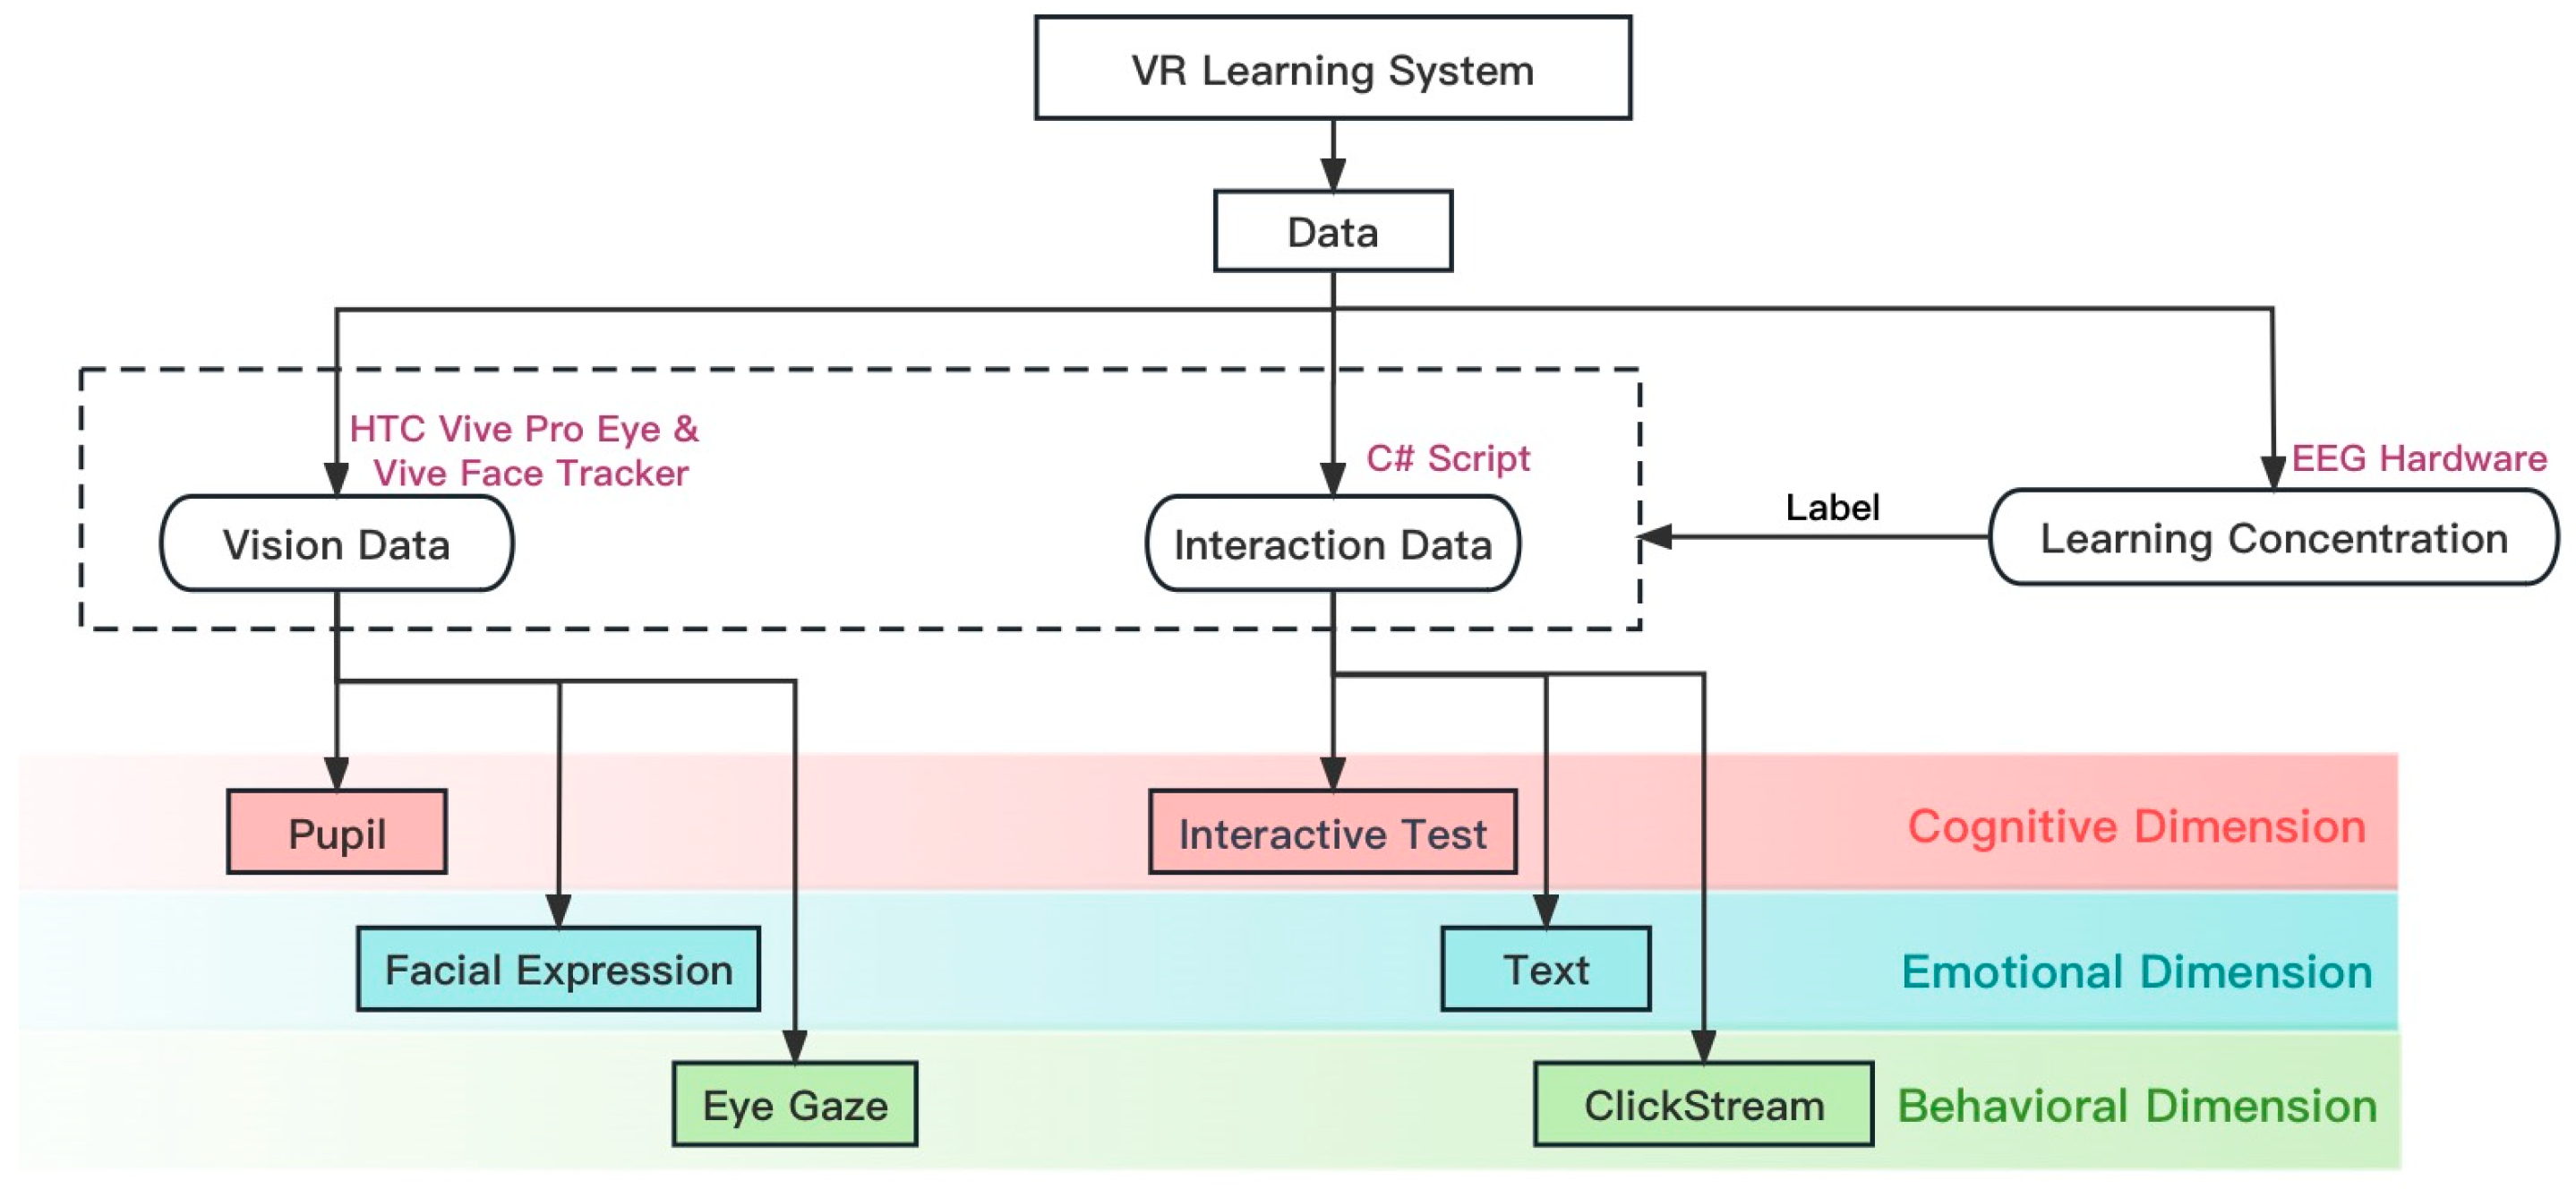
Figure 1. Learning concentration recognition approach.
Sustainability 15 11606 g001
Figure 2. Data acquisition system.
Sustainability 15 11606 g002
Figure 3. VR immersive learning system.
Sustainability 15 11606 g003
Figure 4. Experimental procedure.
Sustainability 15 11606 g004
Figure 5. F1 score comparison of interaction data with vision data.
Sustainability 15 11606 g005
Figure 6. F1 score comparison of complete data with vision data.
Sustainability 15 11606 g006
Figure 7. F1 score comparison of complete data with single-dimensional data.
Sustainability 15 11606 g007
Table 1. Extracted specific features.
ModulesDataDimensionFeatures
C# ScriptInteractive testCognitionThe number of attempts and correct rate
TextEmotionEmotion process words, positive emotion words, negative emotion words, anxious words, angry words, and sad words
ClickstreamBehaviorThe number of clickstreams, the proportion of click behaviors of each part, and the proportion of click behavior conversion of each part
HTC Vive Pro eye & HTC Vive Face TrackerPupilCognitionThe mean value of the pupil diameters, the standard deviation of the pupil diameters, the maximum value of the pupil diameters, and the minimum value of the pupil diameters
Facial expressionEmotionThe mean frequency of emotion, the mean intensity of emotion, the standard deviation of emotion, and the maximum value of emotion
Eye gazeBehaviorThe number of eye gaze point number in each part, the average time of eye gaze in each part, the proportion of eye gaze in each part, and the proportion of saccades in each part
Table 2. Classification and prediction capability of single-dimensional data.
MethodsDimensionPrecisionRecallF1 Score
Simple LogisticCognition0.430.430.42
Emotion0.550.550.54
Behavior0.410.400.40
Decision TreeCognition0.440.450.43
Emotion0.560.550.55
Behavior0.430.410.41
Random ForestCognition0.600.580.52
Emotion0.500.500.46
Behavior0.580.580.57
SVMCognition0.570.550.52
Emotion0.560.550.54
Behavior0.600.600.60
Table 3. Classification and prediction capability of single-type data.
MethodsDimensionPrecisionRecallF1 Score
Simple LogisticVision data0.610.620.61
Interaction data0.440.430.44
Decision TreeVision data0.620.610.61
Interaction data0.450.430.44
Random ForestVision data0.670.670.63
Interaction data0.580.580.57
SVMVision data0.610.610.60
Interaction data0.600.600.60
Table 4. Classification and prediction capability of complete data.
MethodsPrecisionRecallF1 Score
Simple Logistic0.680.700.66
Decision Tree0.730.730.73
Random Forest0.740.740.70
SVM0.700.700.70
Table 5. t-tests between complete data and others.
Simple LogisticDecision TreeRandom ForestSVM
Cognition3.418 **9.631 ***6.408 **7.389 **
Emotion0.5535.465 **4.472 **6.680 **
Behavior2.597 *−1.550−2.236 *8.093 ***
Vision data−1.1832.311 *2.713 *5.659 **
Interaction data2.538 *3.597 **6.465 **4.041 **
* p < 0.05, ** p < 0.01, *** p < 0.001.
Disclaimer/Publisher’s Note: The statements, opinions and data contained in all publications are solely those of the individual author(s) and contributor(s) and not of MDPI and/or the editor(s). MDPI and/or the editor(s) disclaim responsibility for any injury to people or property resulting from any ideas, methods, instructions or products referred to in the content.

