
Demographic Considerations in Incenting Reuse of Corrugated Cardboard Boxes


Abstract
:1. Introduction
2. Materials and Methods
Survey
- Six questions to note the demographics of the participants participating in this survey.
- Questions to evaluate the collection process by assigning CCBs to reuse bins.
- Multiple-choice questions (12 questions)
- Questions to evaluate the collection process by returning CCBs to a specific location.
- Multiple-choice questions (12 questions)
- Questions to assess persuasion preferences.
- Likert-type questions (20 questions)
- Questions to evaluate entropy change by rephrasing.
- Likert-type questions (5 questions)
3. Results
3.1. Results and Analysis for Assigning Method
3.1.1. Results for Multiple-Choice Questions
3.1.2. Analysis of Multiple-Choice Questions
3.2. Results and Analysis for Returning Method
3.2.1. Results for Multiple-Choice Questions
3.2.2. Analysis for Multiple-Choice Questions
3.3. Results and Analysis for Likert Scale Questions
3.3.1. Results for Likert Scale Questions
3.3.2. Analysis of Likert Scale Questions
3.4. Results and Analysis of Data Based on Demographics
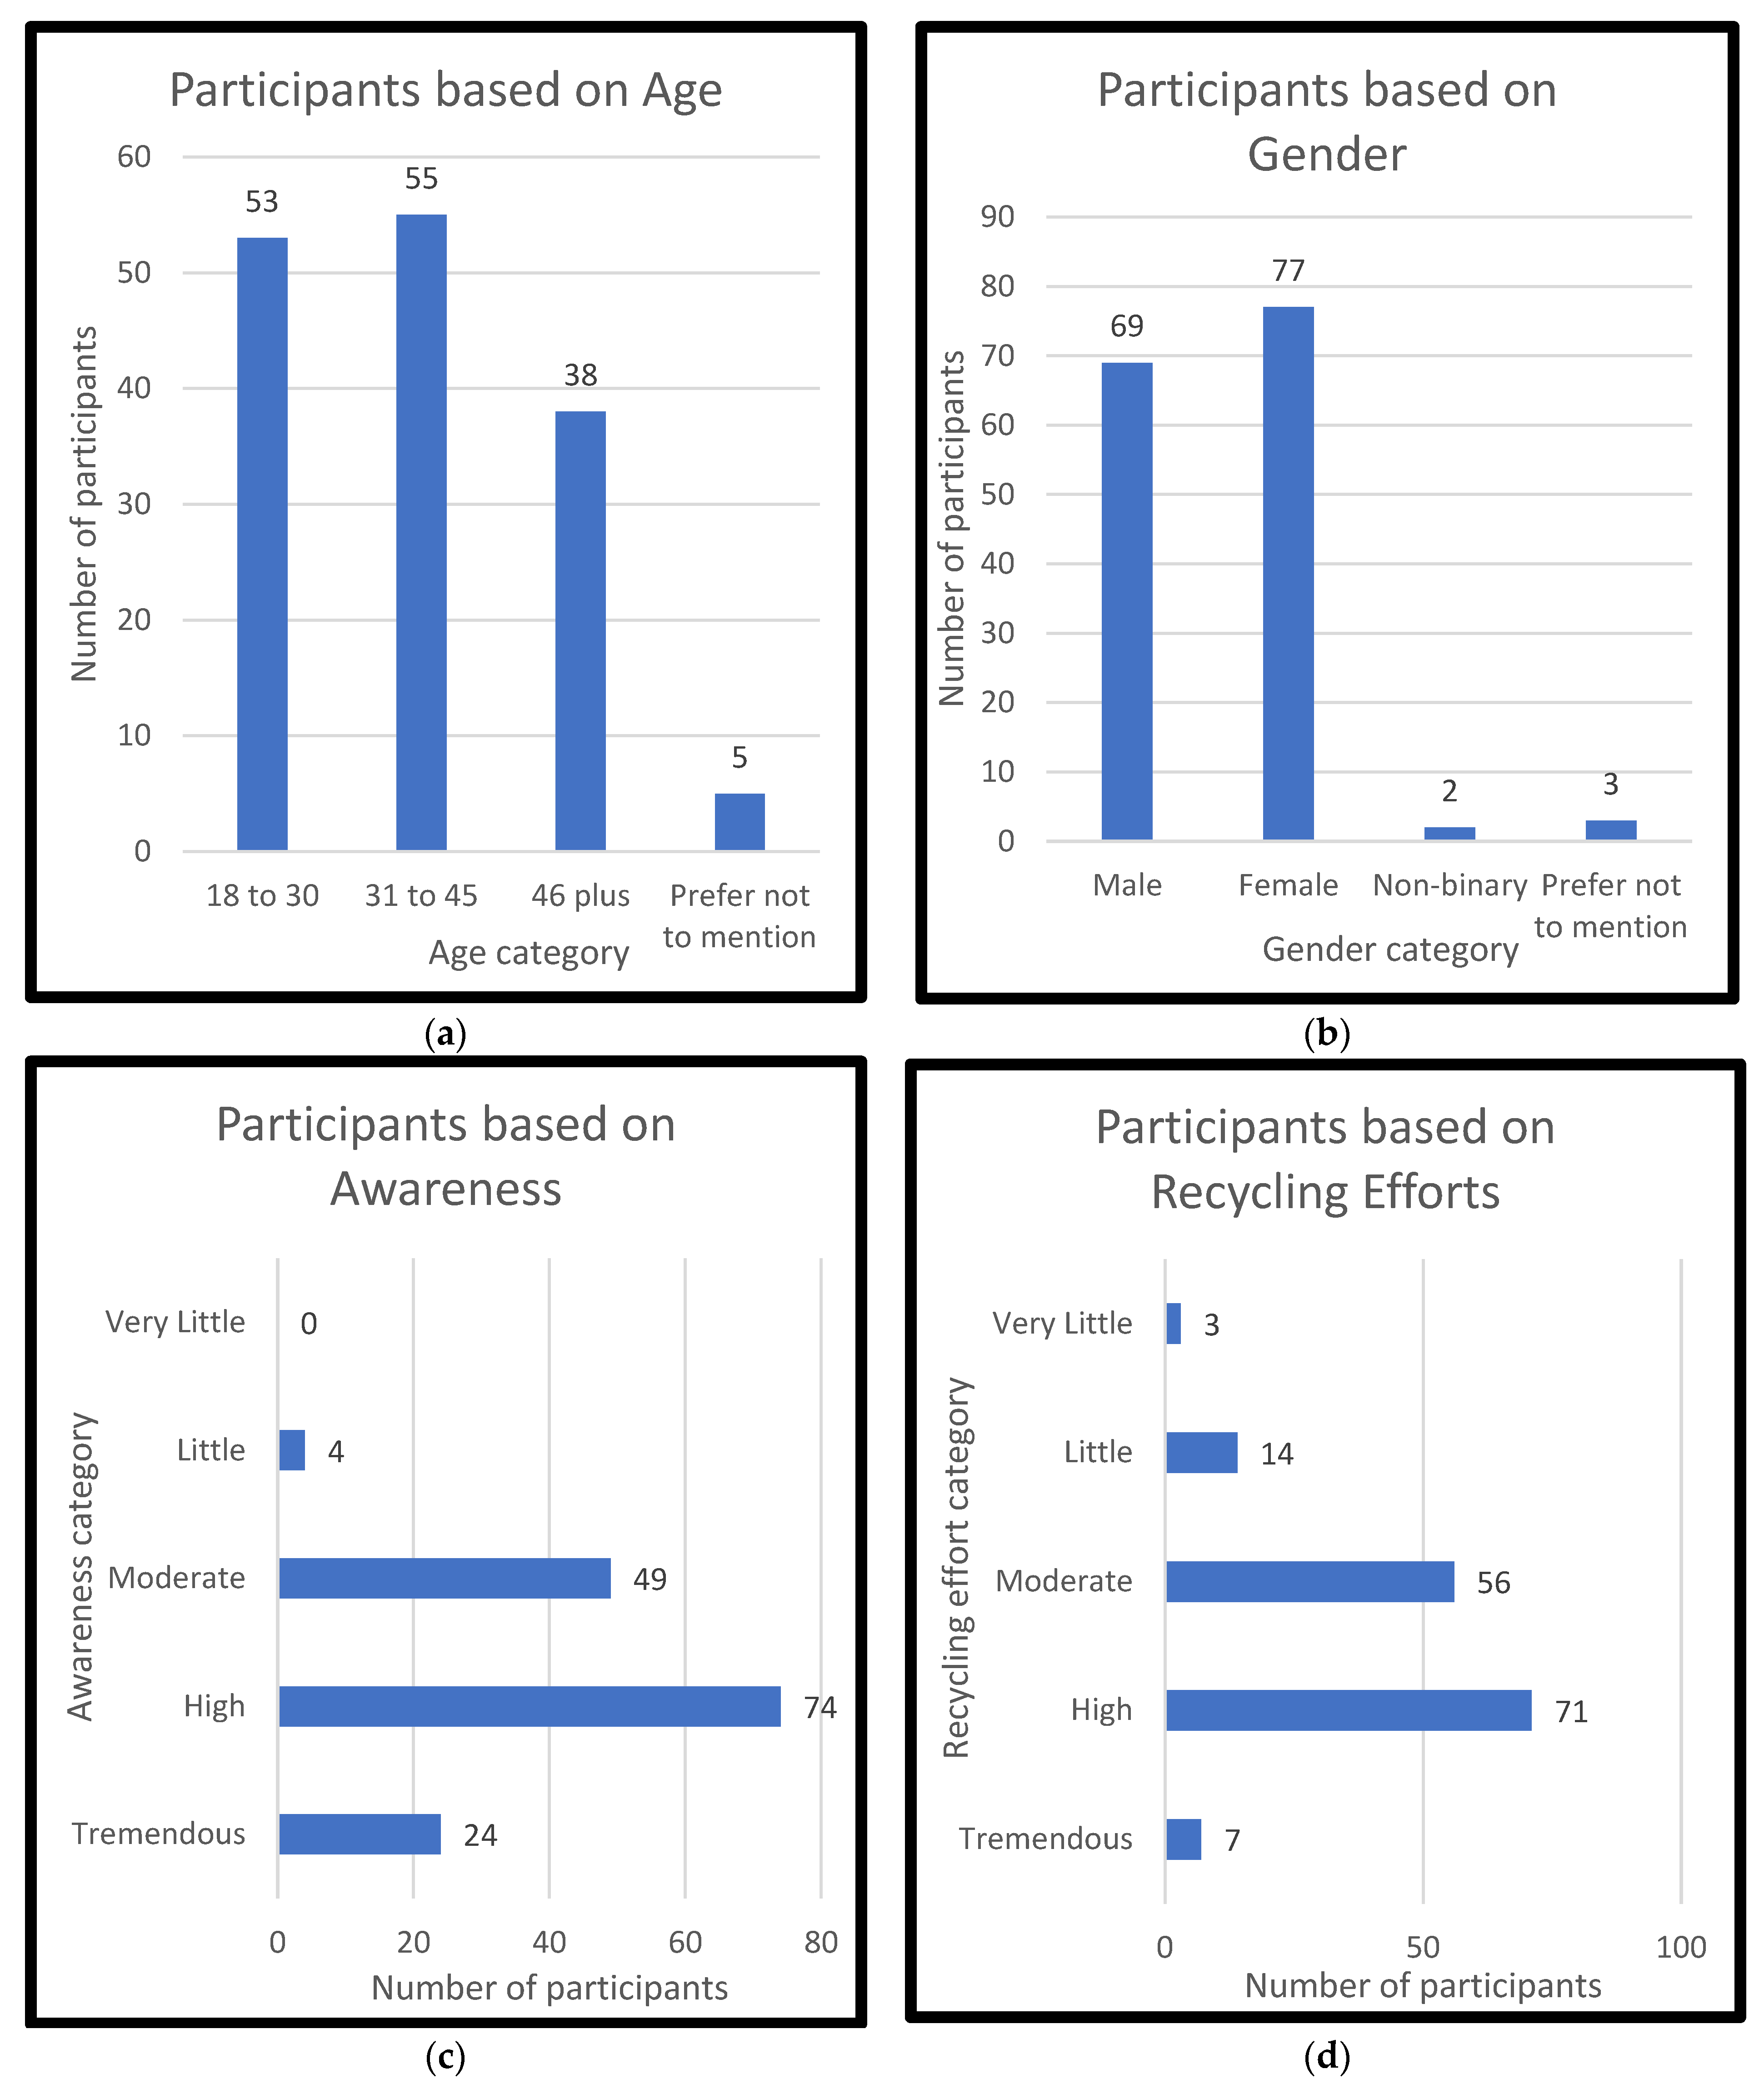
3.4.1. Results Based on Demographics
3.4.2. Analysis of Data Based on Demographics
Summary of Analyzed Data from Multiple-Choice Questions
Summary of Analyzed Data from Likert Scale Questions
3.5. Results and Analysis for Entropy Calculations
3.5.1. Results for Entropy Calculation Questions
3.5.2. Analysis for Entropy Calculations
4. Discussion
5. Conclusions
Author Contributions
Funding
Institutional Review Board Statement
Informed Consent Statement
Data Availability Statement
Acknowledgments
Conflicts of Interest
Appendix A

| 18–30 | 31–45 | 46+ | Prefer Not to Mention | ||||||||||
|---|---|---|---|---|---|---|---|---|---|---|---|---|---|
| Score | Chi^2 Value | p-Value | Score | Chi^2 Value | p-Value | Score | Chi^2 Value | p-Value | Score | Chi^2 Value | p-Value | ||
| Q7 | Ethos | 46 | 28.69 | <0.001 | 46 | 24.89 | <0.001 | 33 | 20.63 | <0.001 | 5 | 5.00 | 0.025 |
| Pathos | 7 | 9 | 5 | 0 | |||||||||
| Q8 | Ethos | 28 | 0.17 | 0.68 | 36 | 5.26 | 0.021 | 26 | 5.16 | 0.023 | 3 | 0.20 | 0.654 |
| Logos | 25 | 19 | 12 | 2 | |||||||||
| Q9 | Ethos | 20 | 3.19 | 0.074 | 24 | 0.89 | 0.345 | 20 | 0.11 | 0.745 | 2 | 0.20 | 0.654 |
| Aesthetics | 33 | 31 | 18 | 3 | |||||||||
| Q10 | Pathos | 17 | 6.81 | 0.009 | 33 | 2.20 | 0.138 | 23 | 1.68 | 0.194 | 3 | 0.20 | 0.654 |
| Logos | 36 | 22 | 15 | 2 | |||||||||
| Q11 | Pathos | 8 | 25.83 | <0.001 | 12 | 17.47 | 0.001 | 9 | 10.53 | 0.001 | 1 | 1.80 | 0.179 |
| Aesthetics | 45 | 43 | 29 | 4 | |||||||||
| Q12 | Logos | 22 | 1.53 | 0.216 | 14 | 13.26 | 0.001 | 6 | 17.79 | 0.001 | 1 | 1.80 | 0.179 |
| Aesthetics | 31 | 41 | 32 | 4 | |||||||||
| Q13 | Ethos | 46 | 28.69 | <0.001 | 45 | 22.27 | <0.001 | 33 | 20.63 | <0.001 | 5 | 5.00 | 0.025 |
| Pathos | 7 | 10 | 5 | 0 | |||||||||
| Q14 | Ethos | 22 | 1.53 | 0.216 | 33 | 2.20 | 0.138 | 23 | 1.68 | 0.194 | 3 | 0.20 | 0.654 |
| Logos | 31 | 22 | 15 | 2 | |||||||||
| Q15 | Ethos | 20 | 3.19 | 0.007 | 28 | 0.02 | 0.892 | 19 | 0.00 | 1 | 2 | 0.20 | 0.654 |
| Aesthetics | 33 | 27 | 19 | 3 | |||||||||
| Q16 | Pathos | 17 | 6.81 | 0.009 | 25 | 0.46 | 0.500 | 20 | 0.11 | 0.745 | 3 | 0.20 | 0.654 |
| Logos | 36 | 30 | 18 | 2 | |||||||||
| Q17 | Pathos | 8 | 25.83 | <0.001 | 9 | 24.89 | <0.001 | 10 | 8.53 | 0.003 | 1 | 1.80 | 0.179 |
| Aesthetics | 45 | 46 | 28 | 4 | |||||||||
| Q18 | Logos | 29 | 0.47 | 0.492 | 23 | 1.47 | 0.224 | 8 | 12.74 | 0.001 | 1 | 1.80 | 0.179 |
| Aesthetics | 24 | 32 | 30 | 4 | |||||||||
| Q19 | Positive Reinforcement | 23 | 0.93 | 0.336 | 30 | 0.46 | 0.500 | 28 | 8.53 | 0.003 | 4 | 1.80 | 0.179 |
| Positive Punishment | 30 | 25 | 10 | 1 | |||||||||
| Q20 | Positive Reinforcement | 30 | 0.93 | 0.336 | 36 | 5.26 | 0.021 | 23 | 1.68 | 0.194 | 3 | 0.20 | 0.654 |
| Negative Punishment | 23 | 19 | 15 | 2 | |||||||||
| Q21 | Positive Reinforcement | 24 | 0.47 | 0.492 | 22 | 2.20 | 0.138 | 18 | 0.11 | 0.745 | 2 | 0.20 | 0.654 |
| Negative Reinforcement | 29 | 33 | 20 | 3 | |||||||||
| Q22 | Positive Punishment | 40 | 13.76 | 0.001 | 36 | 5.26 | 0.021 | 10 | 8.53 | 0.003 | 1 | 1.80 | 0.179 |
| Negative Punishment | 13 | 19 | 28 | 4 | |||||||||
| Q23 | Positive Punishment | 30 | 0.93 | 0.336 | 25 | 0.46 | 0.500 | 9 | 10.53 | 0.001 | 0 | 5.00 | 0.025 |
| Negative Reinforcement | 23 | 30 | 29 | 5 | |||||||||
| Q24 | Negative Punishment | 19 | 4.25 | 0.039 | 17 | 8.02 | 0.004 | 5 | 20.63 | <0.001 | 1 | 1.80 | 0.179 |
| Negative Reinforcement | 34 | 38 | 33 | 4 | |||||||||
| Q25 | Positive Reinforcement | 31 | 1.53 | 0.216 | 29 | 0.16 | 0.685 | 29 | 10.53 | 0.001 | 4 | 1.80 | 0.179 |
| Positive Punishment | 22 | 26 | 9 | 1 | |||||||||
| Q26 | Positive Reinforcement | 41 | 15.87 | 0.001 | 36 | 5.26 | 0.021 | 24 | 2.63 | 0.104 | 4 | 1.80 | 0.179 |
| Negative Punishment | 12 | 19 | 14 | 1 | |||||||||
| Q27 | Positive Reinforcement | 32 | 2.28 | 0.130 | 28 | 0.02 | 0.892 | 17 | 0.42 | 0.516 | 2 | 0.20 | 0.654 |
| Negative Reinforcement | 21 | 27 | 21 | 3 | |||||||||
| Q28 | Positive Punishment | 39 | 11.79 | 0.001 | 32 | 1.47 | 0.224 | 14 | 2.63 | 0.104 | 1 | 1.80 | 0.179 |
| Negative Punishment | 14 | 23 | 24 | 4 | |||||||||
| Q29 | Positive Punishment | 36 | 6.81 | 0.009 | 26 | 0.16 | 0.685 | 7 | 15.16 | 0.001 | 0 | 5.00 | 0.025 |
| Negative Reinforcement | 17 | 29 | 31 | 5 | |||||||||
| Q30 | Negative Punishment | 21 | 2.28 | 0.130 | 16 | 9.62 | 0.001 | 9 | 10.53 | 0.001 | 0 | 5.00 | 0.025 |
| Negative Reinforcement | 32 | 39 | 29 | 5 | |||||||||
| Male | Female | Prefer Not to Mention | Non-Binary | ||||||||||
|---|---|---|---|---|---|---|---|---|---|---|---|---|---|
| Score | Chi^2 Value | p-Value | Score | Chi^2 Value | p-Value | Score | Chi^2 Value | p-Value | Score | Chi^2 Value | p-Value | ||
| Q7 | Ethos | 60 | 37.70 | <0.001 | 65 | 369.48 | <0.001 | 3 | 3.00 | 0.083 | 2 | 2.00 | 0.157 |
| Pathos | 9 | 12 | 0 | 0 | |||||||||
| Q8 | Ethos | 42 | 3.26 | 0.070 | 47 | 3.75 | 0.052 | 2 | 0.33 | 0.563 | 2 | 2.00 | 0.157 |
| Logos | 27 | 30 | 1 | 0 | |||||||||
| Q9 | Ethos | 32 | 0.36 | 0.547 | 32 | 2.20 | 0.138 | 1 | 0.33 | 0.563 | 1 | 0.00 | 1 |
| Aesthetics | 37 | 45 | 2 | 1 | |||||||||
| Q10 | Pathos | 39 | 1.17 | 0.278 | 34 | 1.05 | 0.305 | 2 | 0.33 | 0.563 | 1 | 0.00 | 1 |
| Logos | 30 | 43 | 1 | 1 | |||||||||
| Q11 | Pathos | 12 | 29.35 | <0.001 | 18 | 21.83 | <0.001 | 0 | 3.00 | 0.083 | 0 | 2.00 | 0.157 |
| Aesthetics | 57 | 59 | 3 | 2 | |||||||||
| Q12 | Logos | 16 | 19.84 | <0.001 | 26 | 8.12 | 0.004 | 1 | 0.33 | 0.563 | 0 | 2.00 | 0.157 |
| Aesthetics | 53 | 51 | 2 | 2 | |||||||||
| Q13 | Ethos | 59 | 34.80 | <0.001 | 65 | 369.48 | <0.001 | 3 | 3.00 | 0.083 | 2 | 2.00 | 0.157 |
| Pathos | 10 | 12 | 0 | 0 | |||||||||
| Q14 | Ethos | 41 | 2.45 | 0.117 | 37 | 0.12 | 0.732 | 2 | 0.33 | 0.563 | 1 | 0.00 | 1 |
| Logos | 28 | 40 | 1 | 1 | |||||||||
| Q15 | Ethos | 34 | 0.01 | 0.904 | 33 | 1.57 | 0.21 | 1 | 0.33 | 0.563 | 1 | 0.00 | 1 |
| Aesthetics | 35 | 44 | 2 | 1 | |||||||||
| Q16 | Pathos | 36 | 0.13 | 0.717 | 26 | 8.12 | 0.004 | 2 | 0.33 | 0.563 | 1 | 0.00 | 1 |
| Logos | 33 | 51 | 1 | 1 | |||||||||
| Q17 | Pathos | 13 | 26.80 | <0.001 | 15 | 28.69 | <0.001 | 0 | 3.00 | 0.083 | 0 | 2.00 | 0.157 |
| Aesthetics | 56 | 62 | 3 | 2 | |||||||||
| Q18 | Logos | 25 | 5.23 | 0.022 | 34 | 1.05 | 0.305 | 1 | 0.33 | 0.563 | 1 | 0.00 | 1 |
| Aesthetics | 44 | 43 | 2 | 1 | |||||||||
| Q19 | Positive Reinforcement | 41 | 2.45 | 0.117 | 41 | 0.33 | 0.568 | 3 | 3.00 | 0.083 | 0 | 2.00 | 0.157 |
| Positive Punishment | 28 | 36 | 0 | 2 | |||||||||
| Q20 | Positive Reinforcement | 39 | 1.17 | 0.278 | 51 | 8.12 | 0.004 | 2 | 0.33 | 0.563 | 0 | 2.00 | 0.157 |
| Negative Punishment | 30 | 26 | 1 | 2 | |||||||||
| Q21 | Positive Reinforcement | 30 | 1.17 | 0.278 | 32 | 2.20 | 0.138 | 2 | 0.33 | 0.563 | 2 | 2.00 | 0.157 |
| Negative Reinforcement | 39 | 45 | 1 | 0 | |||||||||
| Q22 | Positive Punishment | 33 | 0.13 | 0.717 | 53 | 10.92 | 0.001 | 0 | 3.00 | 0.083 | 1 | 0.00 | 1 |
| Negative Punishment | 36 | 24 | 3 | 1 | |||||||||
| Q23 | Positive Punishment | 27 | 3.26 | 0.070 | 36 | 0.33 | 0.568 | 0 | 3.00 | 0.083 | 1 | 0.00 | 1 |
| Negative Reinforcement | 42 | 41 | 3 | 1 | |||||||||
| Q24 | Negative Punishment | 18 | 15.78 | 0.001 | 22 | 14.14 | 0.001 | 1 | 0.33 | 0.563 | 1 | 0.00 | 1 |
| Negative Reinforcement | 51 | 55 | 2 | 1 | |||||||||
| Q25 | Positive Reinforcement | 45 | 6.39 | 0.011 | 45 | 2.20 | 0.138 | 3 | 3.00 | 0.083 | 0 | 2.00 | 0.157 |
| Positive Punishment | 24 | 32 | 0 | 2 | |||||||||
| Q26 | Positive Reinforcement | 42 | 3.26 | 0.070 | 59 | 21.83 | <0.001 | 3 | 3.00 | 0.083 | 1 | 0.00 | 1 |
| Negative Punishment | 27 | 18 | 0 | 1 | |||||||||
| Q27 | Positive Reinforcement | 35 | 0.01 | 0.904 | 41 | 0.33 | 0.568 | 2 | 0.33 | 0.563 | 1 | 0.00 | 1 |
| Negative Reinforcement | 34 | 36 | 1 | 1 | |||||||||
| Q28 | Positive Punishment | 34 | 0.01 | 0.904 | 50 | 6.87 | 0.008 | 0 | 3.00 | 0.083 | 2 | 2.00 | 0.157 |
| Negative Punishment | 35 | 27 | 3 | 0 | |||||||||
| Q29 | Positive Punishment | 26 | 4.19 | 0.040 | 41 | 0.33 | 0.568 | 0 | 3.00 | 0.083 | 2 | 2.00 | 0.157 |
| Negative Reinforcement | 43 | 36 | 3 | 0 | |||||||||
| Q30 | Negative Punishment | 22 | 9.06 | 0.002 | 23 | 12.48 | 0.001 | 0 | 3.00 | 0.083 | 1 | 0.00 | 1 |
| Negative Reinforcement | 47 | 54 | 3 | 1 | |||||||||
| Tremendous | High | Moderate | Little | Very Little | ||||||||||||
|---|---|---|---|---|---|---|---|---|---|---|---|---|---|---|---|---|
| Score | Chi^2 Value | p-Value | Score | Chi^2 Value | p-Value | Score | Chi^2 Value | p-Value | Score | Chi^2 Value | p-Value | Score | Chi^2 Value | p-Value | ||
| Q7 | Ethos | 20 | 10.67 | 0.001 | 66 | 45.46 | <0.001 | 41 | 22.22 | <0.001 | 3 | 1.00 | 0.317 | 0 | - | - |
| Pathos | 4 | 8 | 8 | 1 | 0 | |||||||||||
| Q8 | Ethos | 12 | 0.00 | 1 | 49 | 7.78 | 0.005 | 29 | 1.65 | 0.198 | 3 | 1.00 | 0.317 | 0 | - | - |
| Logos | 12 | 25 | 20 | 1 | 0 | |||||||||||
| Q9 | Ethos | 12 | 0.00 | 1 | 31 | 1.95 | 0.163 | 20 | 1.65 | 0.198 | 3 | 1.00 | 0.317 | 0 | - | - |
| Aesthetics | 12 | 43 | 29 | 1 | 0 | |||||||||||
| Q10 | Pathos | 9 | 1.50 | 0.220 | 40 | 0.49 | 0.485 | 25 | 0.02 | 0.886 | 2 | 0.00 | 1 | 0 | - | - |
| Logos | 15 | 34 | 24 | 2 | 0 | |||||||||||
| Q11 | Pathos | 5 | 8.17 | 0.004 | 13 | 31.14 | <0.001 | 10 | 17.16 | 0.001 | 2 | 0.00 | 1 | 0 | - | - |
| Aesthetics | 19 | 61 | 39 | 2 | 0 | |||||||||||
| Q12 | Logos | 7 | 4.17 | 0.041 | 20 | 15.62 | 0.001 | 15 | 7.37 | 0.006 | 1 | 1.00 | 0.317 | 0 | - | - |
| Aesthetics | 17 | 54 | 34 | 3 | 0 | |||||||||||
| Q13 | Ethos | 20 | 10.67 | 0.001 | 66 | 45.46 | <0.001 | 41 | 22.22 | <0.001 | 2 | 0.00 | 1 | 0 | - | - |
| Pathos | 4 | 8 | 8 | 2 | 0 | |||||||||||
| Q14 | Ethos | 12 | 0.00 | 1 | 43 | 1.95 | 0.163 | 23 | 0.18 | 0.668 | 3 | 1.00 | 0.317 | 0 | - | - |
| Logos | 12 | 31 | 26 | 1 | 0 | |||||||||||
| Q15 | Ethos | 12 | 0.00 | 1 | 37 | 0.00 | 1 | 18 | 3.45 | 0.063 | 2 | 0.00 | 1 | 0 | - | - |
| Aesthetics | 12 | 37 | 31 | 2 | 0 | |||||||||||
| Q16 | Pathos | 9 | 1.50 | 0.220 | 33 | 0.87 | 0.352 | 20 | 1.65 | 0.198 | 3 | 1.00 | 0.317 | 0 | - | - |
| Logos | 15 | 41 | 29 | 1 | 0 | |||||||||||
| Q17 | Pathos | 5 | 8.17 | 0.004 | 14 | 28.60 | <0.001 | 7 | 25.00 | <0.001 | 2 | 0.00 | 1 | 0 | - | - |
| Aesthetics | 19 | 60 | 42 | 2 | 0 | |||||||||||
| Q18 | Logos | 8 | 2.67 | 0.102 | 31 | 1.95 | 0.163 | 20 | 1.65 | 0.198 | 2 | 0.00 | 1 | 0 | - | - |
| Aesthetics | 16 | 43 | 29 | 2 | 0 | |||||||||||
| Q19 | Positive Reinforcement | 12 | 0.00 | 1 | 44 | 2.65 | 0.103 | 28 | 1.00 | 0.317 | 1 | 1.00 | 0.317 | 0 | - | - |
| Positive Punishment | 12 | 30 | 21 | 3 | 0 | |||||||||||
| Q20 | Positive Reinforcement | 15 | 1.50 | 0.220 | 43 | 1.95 | 0.163 | 33 | 5.90 | 0.015 | 1 | 1.00 | 0.317 | 0 | - | - |
| Negative Punishment | 9 | 31 | 16 | 3 | 0 | |||||||||||
| Q21 | Positive Reinforcement | 6 | 6.00 | 0.014 | 37 | 0.00 | 1 | 22 | 0.51 | 0.475 | 1 | 1.00 | 0.317 | 0 | - | - |
| Negative Reinforcement | 18 | 37 | 27 | 3 | 0 | |||||||||||
| Q22 | Positive Punishment | 12 | 0.00 | 1 | 40 | 0.49 | 0.485 | 33 | 5.90 | 0.015 | 2 | 0.00 | 1 | 0 | - | - |
| Negative Punishment | 12 | 34 | 16 | 2 | 0 | |||||||||||
| Q23 | Positive Punishment | 8 | 2.67 | 0.102 | 33 | 0.87 | 0.352 | 21 | 1.00 | 0.317 | 2 | 0.00 | 1 | 0 | - | - |
| Negative Reinforcement | 16 | 41 | 28 | 2 | 0 | |||||||||||
| Q24 | Negative Punishment | 3 | 13.50 | 0.001 | 23 | 10.60 | 0.001 | 15 | 7.37 | 0.006 | 1 | 1.00 | 0.317 | 0 | - | - |
| Negative Reinforcement | 21 | 51 | 34 | 3 | 0 | |||||||||||
| Q25 | Positive Reinforcement | 15 | 1.50 | 0.220 | 49 | 7.78 | 0.005 | 27 | 0.51 | 0.475 | 2 | 0.00 | 1 | 0 | - | - |
| Positive Punishment | 9 | 25 | 22 | 2 | 0 | |||||||||||
| Q26 | Positive Reinforcement | 15 | 1.50 | 0.220 | 51 | 10.60 | 0.001 | 36 | 10.80 | 0.001 | 3 | 1.00 | 0.317 | 0 | - | - |
| Negative Punishment | 9 | 23 | 13 | 1 | 0 | |||||||||||
| Q27 | Positive Reinforcement | 10 | 0.67 | 0.414 | 40 | 0.49 | 0.485 | 28 | 1.00 | 0.317 | 1 | 1.00 | 0.317 | 0 | - | - |
| Negative Reinforcement | 14 | 34 | 21 | 3 | 0 | |||||||||||
| Q28 | Positive Punishment | 13 | 0.17 | 0.683 | 39 | 0.22 | 0.641 | 31 | 3.45 | 0.063 | 3 | 1.00 | 0.317 | 0 | - | - |
| Negative Punishment | 11 | 35 | 18 | 1 | 0 | |||||||||||
| Q29 | Positive Punishment | 9 | 1.50 | 0.220 | 33 | 0.87 | 0.352 | 25 | 0.02 | 0.886 | 2 | 0.00 | 1 | 0 | - | - |
| Negative Reinforcement | 15 | 41 | 24 | 2 | 0 | |||||||||||
| Q30 | Negative Punishment | 3 | 13.50 | 0.001 | 23 | 10.60 | 0.001 | 18 | 3.45 | 0.063 | 2 | 0.00 | 1 | 0 | - | - |
| Negative Reinforcement | 21 | 51 | 31 | 2 | 0 | |||||||||||
| Tremendous | High | Moderate | Little | Very Little | ||||||||||||
|---|---|---|---|---|---|---|---|---|---|---|---|---|---|---|---|---|
| Score | Chi^2 Value | p-Value | Score | Chi^2 Value | p-Value | Score | Chi^2 Value | p-Value | Score | Chi^2 Value | p-Value | Score | Chi^2 Value | p-Value | ||
| Q7 | Ethos | 5 | 1.29 | 0.256 | 62 | 39.56 | <0.001 | 50 | 34.57 | <0.001 | 12 | 7.14 | 0.007 | 1 | 0.33 | 0.563 |
| Pathos | 2 | 9 | 6 | 2 | 2 | |||||||||||
| Q8 | Ethos | 4 | 0.14 | 0.705 | 45 | 5.09 | 0.024 | 35 | 3.50 | 0.061 | 7 | 0.00 | 1 | 2 | 0.33 | 0.563 |
| Logos | 3 | 26 | 21 | 7 | 1 | |||||||||||
| Q9 | Ethos | 4 | 0.14 | 0.705 | 28 | 3.17 | 0.075 | 29 | 0.07 | 0.789 | 3 | 4.57 | 0.032 | 2 | 0.33 | 0.563 |
| Aesthetics | 3 | 43 | 27 | 11 | 1 | |||||||||||
| Q10 | Pathos | 3 | 0.14 | 0.705 | 35 | 0.01 | 0.905 | 31 | 0.64 | 0.422 | 5 | 1.14 | 0.285 | 2 | 0.33 | 0.563 |
| Logos | 4 | 36 | 25 | 9 | 1 | |||||||||||
| Q11 | Pathos | 2 | 1.29 | 0.256 | 13 | 28.52 | <0.001 | 11 | 20.64 | <0.001 | 2 | 7.14 | 0.007 | 2 | 0.33 | 0.563 |
| Aesthetics | 5 | 58 | 45 | 12 | 1 | |||||||||||
| Q12 | Logos | 3 | 0.14 | 0.705 | 18 | 7.25 | 0.001 | 17 | 8.64 | 0.003 | 4 | 2.57 | 0.108 | 1 | 0.33 | 0.563 |
| Aesthetics | 4 | 53 | 39 | 10 | 2 | |||||||||||
| Q13 | Ethos | 5 | 1.29 | 0.256 | 63 | 42.61 | <0.001 | 49 | 31.50 | <0.001 | 11 | 4.57 | 0.032 | 1 | 0.33 | 0.563 |
| Pathos | 2 | 8 | 7 | 3 | 2 | |||||||||||
| Q14 | Ethos | 3 | 0.14 | 0.705 | 35 | 0.01 | 0.905 | 34 | 2.57 | 0.108 | 7 | 0.00 | 1 | 2 | 0.33 | 0.563 |
| Logos | 4 | 36 | 22 | 7 | 1 | |||||||||||
| Q15 | Ethos | 4 | 0.14 | 0.705 | 32 | 0.69 | 0.406 | 29 | 0.07 | 0.789 | 2 | 7.14 | 0.007 | 2 | 0.33 | 0.563 |
| Aesthetics | 3 | 39 | 27 | 12 | 1 | |||||||||||
| Q16 | Pathos | 3 | 0.14 | 0.705 | 25 | 6.21 | 0.012 | 30 | 0.29 | 0.592 | 5 | 1.14 | 0.285 | 2 | 0.33 | 0.563 |
| Logos | 4 | 46 | 26 | 9 | 1 | |||||||||||
| Q17 | Pathos | 2 | 1.29 | 0.256 | 12 | 31.11 | <0.001 | 10 | 23.14 | <0.001 | 2 | 7.14 | 0.007 | 2 | 0.33 | 0.563 |
| Aesthetics | 5 | 59 | 46 | 12 | 1 | |||||||||||
| Q18 | Logos | 4 | 0.14 | 0.705 | 26 | 5.09 | 0.024 | 23 | 1.79 | 0.181 | 7 | 0.00 | 1 | 1 | 0.33 | 0.563 |
| Aesthetics | 3 | 45 | 33 | 7 | 2 | |||||||||||
| Q19 | Positive Reinforcement | 6 | 3.57 | 0.587 | 40 | 1.14 | 0.285 | 30 | 0.29 | 0.592 | 7 | 0.00 | 1 | 2 | 0.33 | 0.563 |
| Positive Punishment | 1 | 31 | 26 | 7 | 1 | |||||||||||
| Q20 | Positive Reinforcement | 4 | 0.14 | 0.705 | 42 | 2.38 | 0.122 | 33 | 1.79 | 0.181 | 11 | 4.57 | 0.032 | 2 | 0.33 | 0.563 |
| Negative Punishment | 3 | 29 | 23 | 3 | 1 | |||||||||||
| Q21 | Positive Reinforcement | 4 | 0.14 | 0.705 | 32 | 0.69 | 0.406 | 21 | 3.50 | 0.061 | 7 | 0.00 | 1 | 2 | 0.33 | 0.563 |
| Negative Reinforcement | 3 | 39 | 35 | 7 | 1 | |||||||||||
| Q22 | Positive Punishment | 3 | 0.14 | 0.705 | 39 | 0.69 | 0.406 | 37 | 5.79 | 0.016 | 7 | 0.00 | 1 | 1 | 0.33 | 0.563 |
| Negative Punishment | 4 | 32 | 19 | 7 | 2 | |||||||||||
| Q23 | Positive Punishment | 2 | 1.29 | 0.256 | 29 | 2.38 | 0.122 | 27 | 0.07 | 0.789 | 6 | 0.29 | 0.592 | 0 | 3.00 | 0.083 |
| Negative Reinforcement | 5 | 42 | 29 | 8 | 3 | |||||||||||
| Q24 | Negative Punishment | 0 | 7.00 | 0.008 | 15 | 23.68 | <0.001 | 19 | 5.79 | 0.016 | 8 | 0.29 | 0.592 | 0 | 3.00 | 0.083 |
| Negative Reinforcement | 7 | 56 | 37 | 6 | 3 | |||||||||||
| Q25 | Positive Reinforcement | 6 | 3.57 | 0.587 | 44 | 4.07 | 0.043 | 33 | 1.79 | 0.181 | 7 | 0.00 | 1 | 3 | 3.00 | 0.083 |
| Positive Punishment | 1 | 27 | 23 | 7 | 0 | |||||||||||
| Q26 | Positive Reinforcement | 4 | 0.14 | 0.705 | 50 | 11.85 | 0.001 | 38 | 7.14 | 0.007 | 10 | 2.57 | 0.108 | 3 | 3.00 | 0.083 |
| Negative Punishment | 3 | 21 | 18 | 4 | 0 | |||||||||||
| Q27 | Positive Reinforcement | 4 | 0.14 | 0.705 | 38 | 0.35 | 0.552 | 26 | 0.29 | 0.592 | 9 | 1.14 | 0.285 | 2 | 0.33 | 0.563 |
| Negative Reinforcement | 3 | 33 | 30 | 5 | 1 | |||||||||||
| Q28 | Positive Punishment | 3 | 0.14 | 0.705 | 39 | 0.69 | 0.406 | 36 | 4.57 | 0.032 | 6 | 0.29 | 0.592 | 2 | 0.33 | 0.563 |
| Negative Punishment | 4 | 32 | 20 | 8 | 1 | |||||||||||
| Q29 | Positive Punishment | 1 | 3.57 | 0.587 | 30 | 1.70 | 0.191 | 30 | 0.29 | 0.592 | 8 | 0.29 | 0.592 | 0 | 3.00 | 0.083 |
| Negative Reinforcement | 6 | 41 | 26 | 6 | 3 | |||||||||||
| Q30 | Negative Punishment | 1 | 3.57 | 0.587 | 17 | 19.28 | 0.001 | 19 | 5.79 | 0.016 | 9 | 1.14 | 0.285 | 0 | 3.00 | 0.083 |
| Negative Reinforcement | 6 | 54 | 37 | 5 | 3 | |||||||||||
| 18–30 | 31–45 | 46+ | Prefer Not to Answer | |
|---|---|---|---|---|
| Aesthetics | 4.39 | 4.30 | 4.14 | 3.84 |
| Ethos | 4.40 | 4.25 | 3.96 | 3.56 |
| Logos | 3.63 | 3.432 | 3.26 | 3.32 |
| Pathos | 4.05 | 4.05 | 3.87 | 3.32 |
| Comparison of Persuasion Techniques | 18–30 | 31–45 | 46+ | Prefer Not to Answer | ||||
|---|---|---|---|---|---|---|---|---|
| t-Value | p-Value | t-Value | p-Value | t-Value | p-Value | t-Value | p-Value | |
| Ethos with Pathos | 2.47 | 0.019 | 1.69 | 0.063 | 0.6957 | 0.2532 | 1.54 | 0.080 |
| Ethos with Logos | 1.80 | 0.054 | 2.42 | 0.020 | 2.41 | 0.021 | 0.55 | 0.297 |
| Aesthetics with Ethos | 0.10 | 0.460 | 0.82 | 0.217 | 2.57 | 0.016 | 1.19 | 0.133 |
| Aesthetics with Pathos | 2.57 | 0.016 | 2.04 | 0.037 | 2.14 | 0.032 | 1.99 | 0.040 |
| Aesthetics with Logos | 1.80 | 0.054 | 2.57 | 0.016 | 3.07 | 0.007 | 1.07 | 0.155 |
| Logos with Pathos | 0.96 | 0.181 | 0.75 | 0.059 | 1.95 | 0.042 | 0.00 | 0.500 |
| Male | Female | Non-Binary | Prefer Not to Mention | |
|---|---|---|---|---|
| Aesthetics | 4.26 | 4.31 | 4.30 | 3.80 |
| Ethos | 4.13 | 4.29 | 4.30 | 3.66 |
| Logos | 3.46 | 3.47 | 2.90 | 3.13 |
| Pathos | 3.93 | 4.04 | 3.90 | 3.46 |
| Comparison of Persuasion Techniques | Male | Female | Non-Binary | Prefer Not to Mention | ||||
|---|---|---|---|---|---|---|---|---|
| t-Value | p-Value | t-Value | p-Value | t-Value | p-Value | t-Value | p-Value | |
| Ethos with Pathos | 1.59 | 0.075 | 1.94 | 0.044 | 2.52 | 0.017 | 1.50 | 0.086 |
| Ethos with Logos | 2.50 | 0.018 | 1.91 | 0.045 | 2.45 | 0.019 | 0.96 | 0.181 |
| Aesthetics with Ethos | 2.15 | 0.031 | 0.30 | 0.385 | 0.00 | 0.500 | 1.00 | 0.173 |
| Aesthetics with Pathos | 2.50 | 0.018 | 2.24 | 0.027 | 2.52 | 0.017 | 1.76 | 0.057 |
| Aesthetics with Logos | 2.95 | 0.009 | 1.97 | 0.041 | 2.45 | 0.019 | 1.17 | 0.137 |
| Logos with Pathos | 1.60 | 0.073 | 1.3060 | 0.1139 | 1.76 | 0.057 | 0.58 | 0.287 |
| Tremendous | High | Moderate | Little | |
|---|---|---|---|---|
| Aesthetics | 4.44 | 4.28 | 4.15 | 4.75 |
| Ethos | 4.51 | 4.22 | 4.02 | 4.50 |
| Logos | 3.27 | 3.50 | 3.46 | 3.55 |
| Pathos | 4.08 | 4.05 | 3.82 | 4.00 |
| Comparison of Persuasion Techniques | Tremendous | High | Moderate | Little | ||||
|---|---|---|---|---|---|---|---|---|
| t-Value | p-Value | t-Value | p-Value | t-Value | p-Value | t-Value | p-Value | |
| Ethos with Pathos | 3.18 | 0.006 | 1.64 | 0.069 | 1.19 | 0.132 | 1.58 | 0.076 |
| Ethos with Logos | 3.08 | 0.007 | 2.09 | 0.034 | 1.51 | 0.084 | 3.16 | 0.006 |
| Aesthetics with Ethos | 1.13 | 0.144 | 1.24 | 0.123 | 1.77 | 0.057 | 1.82 | 0.052 |
| Aesthetics with Pathos | 2.68 | 0.013 | 2.27 | 0.026 | 2.10 | 0.034 | 2.17 | 0.030 |
| Aesthetics with Logos | 2.90 | 0.009 | 2.28 | 0.025 | 1.90 | 0.046 | 3.63 | 0.003 |
| Logos with Pathos | 1.92 | 0.045 | 1.55 | 0.079 | 0.92 | 0.191 | 1.03 | 0.166 |
| Tremendous | High | Moderate | Little | Very Little | |
|---|---|---|---|---|---|
| Aesthetics | 4.00 | 4.44 | 4.17 | 3.97 | 4.73 |
| Ethos | 3.68 | 4.42 | 4.02 | 3.97 | 5.00 |
| Logos | 2.91 | 3.46 | 3.54 | 3.42 | 3.00 |
| Pathos | 3.74 | 4.20 | 3.82 | 3.42 | 4.86 |
| Comparison of Persuasion Techniques | Tremendous | High | Moderate | Little | Very Little | |||||
|---|---|---|---|---|---|---|---|---|---|---|
| t-Value | p-Value | t-Value | p-Value | t-Value | p-Value | t-Value | p-Value | t-Value | p-Value | |
| Ethos with Pathos | 0.48 | 0.320 | 1.77 | 0.056 | 1.37 | 0.103 | 3.55 | 0.003 | 1.00 | 0.173 |
| Ethos with Logos | 1.53 | 0.081 | 2.40 | 0.021 | 1.50 | 0.085 | 1.65 | 0.068 | 7.17 | 0.001 |
| Aesthetics with Ethos | 2.55 | 0.016 | 0.23 | 0.411 | 2.77 | 0.012 | 0.00 | 0.500 | 1.37 | 0.103 |
| Aesthetics with Pathos | 2.44 | 0.020 | 1.88 | 0.048 | 2.40 | 0.021 | 2.48 | 0.018 | 0.56 | 0.293 |
| Aesthetics with Logos | 2.17 | 0.030 | 2.44 | 0.020 | 1.97 | 0.042 | 1.49 | 0.087 | 5.09 | 0.001 |
| Logos with Pathos | 1.66 | 0.067 | 1.80 | 0.054 | 0.81 | 0.219 | 0.00 | 0.500 | 6.03 | 0.001 |
Appendix B
- Q1
- Definitions:Recycling process—You place the cardboard box in the dedicated recycle bin or return it to the dedicated recycling yard, which is then recycled to make a new cardboard box.Reusing process—You place the cardboard box in the dedicated reuse bin or return it to the dedicated reuse yard, where it is reused for shipping goods, and then the cardboard box is cleaned and prepared for another use.
- I understood the difference between these two processes.
- Q2
- Please enter your email id—_______________________
- Q3
- What gender do you identify as?
- Male
- Female
- Non-binary
- Prefer not to answer
- Q4
- What is your age?
- 0–17 years old
- 18–30 years old
- 31–45 years old
- 46+
- Prefer not to answer
- Q5
- What are your current recycling efforts?
- Very Little
- Little
- Moderate
- High
- Tremendous
- Q6
- How much awareness do you have of the environment and climate change?
- Very Little
- Little
- Moderate
- High
- Tremendous
- Q7
- Which one is more likely to influence you for assigning the cardboard box to the reuse bin rather than the recycling bin–
- A charitable organization committed to preventing environmental degradation gets a suitable donation for each box I assign to the reusing process.
- A charitable organization committed to helping Florida panthers from going extinct gets a suitable donation for each box I assign to the reusing process.
- Q8
- Which one is more likely to influence you for assigning the cardboard box to the reuse bin rather than the recycling bin–
- A charitable organization committed to preventing environmental degradation gets a suitable donation for each box I assign to the reusing process.
- I get a suitable cash reward for each box I assign to the reusing process.
- Q9
- Which one is more likely to influence you for assigning the cardboard box to the reuse bin rather than the recycling bin–
- A charitable organization committed to preventing environmental degradation gets a suitable donation for each box I assign to the reusing process.
- A charitable organization committed to keeping my city clean gets a suitable donation for each box I assign to the reusing process.
- Q10
- Which one is more likely to influence you for assigning the cardboard box to the reuse bin rather than the recycling bin–
- A charitable organization committed to helping Florida panthers from going extinct gets a suitable donation for each box I assign to the reusing process.
- I get a suitable cash reward for each box I assign to the reusing process.
- Q11
- Which one is more likely to influence you for assigning the cardboard box to the reuse bin rather than the recycling bin–
- A charitable organization committed to helping Florida panthers from going extinct gets a suitable donation for each box I assign to the reusing process.
- A charitable organization committed to keeping my city clean gets a suitable donation for each box I assign to the reusing process.
- Q12
- Which one is more likely to influence you for assigning the cardboard box to the reuse bin rather than the recycling bin–
- I get a suitable cash reward for each box I assign to the reusing process.
- A charitable organization committed to keeping my city clean gets a suitable donation for each box I assign to the reusing process.
- Q13
- Which one is more likely to influence you for returning the cardboard box to the reuse yard rather than the recycling yard –
- A charitable organization committed to preventing environmental degradation gets a suitable donation for each box I return to the reuse yard.
- A charitable organization committed to helping Florida panthers from going extinct gets a suitable donation for each box I return to the reuse yard.
- Q14
- Which one is more likely to influence you for returning the cardboard box to the reuse yard rather than the recycling yard –
- A charitable organization committed to preventing environmental degradation gets a suitable donation for each box I return to the reuse yard.
- I get a suitable cash reward for each box I return to the reuse yard.
- Q15
- Which one is more likely to influence you for returning the cardboard box to the reuse yard rather than the recycling yard –
- A charitable organization committed to preventing environmental degradation gets a suitable donation for each box I return to the reuse yard.
- A charitable organization committed to keeping my city clean gets a suitable donation for each box I return to the reuse yard.
- Q16
- Which one is more likely to influence you for returning the cardboard box to the reuse yard rather than the recycling yard –
- A charitable organization committed to helping Florida panthers from going extinct gets a suitable donation for each box I return to the reuse yard.
- I get a suitable cash reward for each box I return to the reuse yard.
- Q17
- Which one is more likely to influence you for returning the cardboard box to the reuse yard rather than the recycling yard –
- A charitable organization committed to helping Florida panthers from going extinct gets a suitable donation for each box I return to the reuse yard.
- A charitable organization committed to keeping my city clean gets a suitable donation for each box I return to the reuse yard.
- Q18
- Which one is more likely to influence you for returning the cardboard box to the reuse yard rather than the recycling yard –
- I get a suitable cash reward for each box I return to the reuse yard.
- A charitable organization committed to keeping my city clean gets a suitable donation for each box I return to the reuse yard.
- Q19
- Which one is more likely to influence you for assigning the cardboard box to the reuse bin rather than the recycling bin–
- I get a suitable cash reward for each box I assign to the reuse process.
- I get penalized with a suitable cash penalty for not assigning the boxes to the reuse process.
- Q20
- Which one is more likely to influence you for assigning the cardboard box to the reuse bin rather than the recycling bin–
- I get a suitable cash reward for each box I assign to the reuse process.
- My product discount is taken away from me which was offered to me for every cardboard box I assign to the reuse process.
- Q21
- Which one is more likely to influence you for assigning the cardboard box to the reuse bin rather than the recycling bin–
- I get a suitable cash reward for each box I assign to the reuse process.
- My shipping charges are waived after I assign a suitable number of boxes to the reuse process.
- Q22
- Which one is more likely to influence you for assigning the cardboard box to the reuse bin rather than the recycling bin–
- I get penalized with a suitable cash penalty for not assigning the boxes to the reuse process.
- My product discount is taken away from me which was offered to me for every cardboard box I assign to the reuse process.
- Q23
- Which one is more likely to influence you for assigning the cardboard box to the reuse bin rather than the recycling bin–
- I get penalized with a suitable cash penalty for not assigning the boxes for the reusing process.
- My shipping charges are waived after I assign a suitable number of boxes to the reuse process.
- Q24
- Which one is more likely to influence you for assigning the cardboard box to the reuse bin rather than the recycling bin–
- My product discount is taken away from me which was offered to me for every cardboard box I assign to the reuse process.
- My shipping charges are waived after I assign a suitable number of boxes to the reuse process.
- Q25
- Which one is more likely to influence you for returning the cardboard box to the reuse yard rather than the recycling yard –
- I get a suitable cash reward for each box I return to the reuse yard.
- I get penalized with a suitable cash penalty for not returning the boxes to the reuse yard.
- Q26
- Which one is more likely to influence you for returning the cardboard box to the reuse yard rather than the recycling yard –
- I get a suitable cash reward for each box I return to the reuse yard.
- My product discount is taken away from me which was offered to me for every cardboard box I return to the reuse yard.
- Q27
- Which one is more likely to influence you for returning the cardboard box to the reuse yard rather than the recycling yard –
- I get a suitable cash reward for each box I return to the reuse yard.
- My shipping charges are waived after I return a suitable number of boxes to the reuse yard.
- Q28
- Which one is more likely to influence you for returning the cardboard box to the reuse yard rather than the recycling yard –
- I get penalized with a suitable cash penalty for not returning the boxes to the reuse yard.
- My product discount is taken away from me which was offered to me for every cardboard box I return to the reuse yard.
- Q29
- Which one is more likely to influence you for returning the cardboard box to the reuse yard rather than the recycling yard –
- I get penalized with a suitable cash penalty for not returning the boxes to the reuse yard.
- My shipping charges are waived after I return a suitable number of boxes to the reuse yard.
- Q30
- Which one is more likely to influence you for returning the cardboard box to the reuse yard rather than the recycling yard –
- My product discount is taken away from me which was offered to me for every cardboard box I return to the reuse yard.
- My shipping charges are waived after I return a suitable number of boxes to the reuse yard.
- Q31
- I am likely to assign a cardboard box to the reuse process rather than assigning it to the recycling process if—(Strongly disagree, Somewhat disagree, Neither agree nor disagree, Somewhat agree, and Strongly agree) (NO QUESTION)
- Q32
- A charitable organization committed to preventing environmental degradation gets a suitable donation for each box I assign to the reuse process.
- Q33
- A charitable organization committed to helping Florida panthers from going extinct gets a suitable donation for each box I assign to the reuse process.
- Q34
- I get a suitable cash reward for each box I assign to the reuse process.
- Q35
- A charitable organization committed to keeping my city clean gets a suitable donation for each box I assign to the reuse process.
- Q36
- A charitable organization trying to reduce global warming gets a suitable donation for each box I assign to the reuse process.
- Q37
- I am likely to assign a cardboard box to the reuse process rather than assigning it to the recycling process if—(Strongly disagree, Somewhat disagree, Neither agree nor disagree, Somewhat agree, and Strongly agree) (NO QUESTION)
- Q38
- A charitable organization trying to repair the ozone layer gets a suitable donation for each box I assign to the reuse process.
- Q39
- I save money off my shipping charges for each box I assign to the reuse process.
- Q40
- A charitable organization committed to preventing the addition of trash into landfills gets a suitable donation for each box I assign to the reuse process.
- Q41
- A charitable organization committed to reducing pollution gets a suitable donation for each box I assign to the reuse process.
- Q42
- A charitable organization committed to helping polar bears from going extinct gets a suitable donation for each box I assign to the reuse process.
- Q43
- I am likely to assign a cardboard box to the reuse process rather than assigning it to the recycling process if—(Strongly disagree, Somewhat disagree, Neither agree nor disagree, Somewhat agree, and Strongly agree) (NO QUESTION)
- Q44
- I get a suitable discount on my favorite shopping brands for each box I assign to the reuse process.
- Q45
- A charitable organization committed to cleaning the trash in my city gets a suitable donation for each box I assign to the reuse process.
- Q46
- A charitable organization trying to decrease the depletion of fossil fuel gets a suitable donation for each box I assign to the reuse process.
- Q47
- A charitable organization committed to helping endangered species gets a suitable donation for each box I assign to the reuse process.
- Q48
- I get public recognition after I assign a suitable number of boxes to the reuse process.
- Q49
- I am likely to assign a cardboard box to the reuse process rather than assigning it to the recycling process if—(Strongly disagree, Somewhat disagree, Neither agree nor disagree, Somewhat agree, and Strongly agree) (NO QUESTION)
- Q50
- A charitable organization committed to keeping our environment clean gets a suitable donation for each box I assign to the reuse process.
- Q51
- A charitable organization committed to reducing climate change gets a suitable donation for each box I assign to the reuse process.
- Q52
- A charitable organization committed to preserving the environment for future generations gets a suitable donation for each box I assign to the reuse process.
- Q53
- I get a gift card for my favorite fast-food brand for each box I assign to the reuse process.
- Q54
- A charitable organization committed to decreasing dirty landfills gets a suitable donation for each box I assign to the reuse process.
- Q55
- I prefer driving sustainable electric cars over gasoline-powered cars.
- Q56
- I prefer environment-friendly fabric bags over cheap plastic bags in grocery stores.
- Q57
- I routinely donate food/money to the less fortunate.
- Q58
- I work hard to receive praise from my boss.
- Q59
- I avoid losing important documents by organizing them in the first place.
References
- United States Environmental Protection Agency. Learn about Sustainability. Available online: https://www.epa.gov/sustainability/learn-about-sustainability (accessed on 18 July 2023).
- United Nations. Causes and Effects of Climate Change. Available online: https://www.un.org/en/climatechange/science/causes-effects-climate-change (accessed on 18 July 2023).
- Korhonen, M.R.; Dahlbo, H. Reducing Greenhouse Gas Emissions by Recycling Plastics and Textiles into Products; Finnish Environment Institute: Helsinki, Finland, 2007; Available online: http://hdl.handle.net/10138/38425 (accessed on 18 July 2023).
- King, M.F.; Gutberlet, J. Contribution of cooperative sector recycling to greenhouse gas emissions reduction: A case study of Ribeirão Pires, Brazil. J. Waste Manag. 2013, 33, 2771–2780. [Google Scholar] [CrossRef]
- Turner, D.A.; Williams, I.D.; Kemp, S. Greenhouse gas emission factors for recycling of source-segregated waste materials. Resour. Conserv. Recycl. 2015, 105, 186–197. [Google Scholar] [CrossRef] [Green Version]
- Dunn, J.B.; Gaines, L.; Sullivan, J.; Wang, M.Q. Impact of recycling on cradle-to-gate energy consumption and greenhouse gas emissions of automotive lithium-ion batteries. Environ. Sci. Technol. 2012, 46, 12704–12710. [Google Scholar] [CrossRef]
- Nguyen, T.K.L.; Ngo, H.H.; Guo, W.; Nguyen, T.L.H.; Chang, S.W.; Nguyen, D.D.; Varjani, S.; Lei, Z.; Deng, L. Environmental impacts and greenhouse gas emissions assessment for energy recovery and material recycle of the wastewater treatment plant. Sci. Total Environ. 2021, 784, 147135. [Google Scholar] [CrossRef]
- Gu, B. Research on the impact of plastic recycling industry on greenhouse gas emissions. IOP Conf. Ser. Earth Environ. Sci. 2021, 781, 032030. [Google Scholar] [CrossRef]
- Meys, R.; Kätelhön, A.; Bachmann, M.; Winter, B.; Zibunas, C.; Suh, S.; Bardow, A. Achieving net-zero greenhouse gas emission plastics by a circular carbon economy. Science 2021, 374, 71–76. [Google Scholar] [CrossRef]
- Contribution of Working Group III to the Fourth Assessment Report of the Intergovernmental Panel on Climate Change; Metz, B.; Davidson, O.R.; Bosch, P.R.; Dave, R.; Meyer, L.A. (Eds.) Cambridge University Press: Cambridge, UK; New York, NY, USA, 2007; Available online: https://archive.ipcc.ch/publications_and_data/ar4/wg3/en/contents.html (accessed on 18 July 2023).
- Abila, B. Households’ perception of financial incentives in endorsing sustainable waste recycling in Nigeria. Recycling 2018, 3, 28. [Google Scholar] [CrossRef] [Green Version]
- Gilli, M.; Nicolli, F.; Farinelli, P. Behavioural attitudes towards waste prevention and recycling. Ecol. Econ. 2018, 154, 294–305. [Google Scholar] [CrossRef]
- Kattoua, M.G.; Al-Khatib, I.A.; Kontogianni, S. Barriers on the propagation of household solid waste recycling practices in developing countries: State of Palestine example. J. Mater. Cycles Waste 2019, 21, 774–785. [Google Scholar] [CrossRef]
- Seacat, J.D.; Boileau, N. Demographic and community-level predictors of recycling behavior: A statewide, assessment. J. Environ. Psychol. 2018, 56, 12–19. [Google Scholar] [CrossRef]
- Li, C.; Wang, Y.; Li, Y.; Huang, Y.; Harder, M.K. The incentives may not be the incentive: A field experiment in recycling of residential food waste. Resour. Conserv. Recycl. 2021, 168, 105316. [Google Scholar] [CrossRef]
- Ketkale, H.; Simske, S. Encouraging Reuse in the Corrugated Packaging Industry Using Persuasion and Operant Conditioning. Sustainability 2022, 14, 6454. [Google Scholar] [CrossRef]
- Ketkale, H.; Simske, S. A LifeCycle Analysis and Economic Cost Analysis of Corrugated Cardboard Box Reuse and Recycling in the United States. Resources 2023, 12, 22. [Google Scholar] [CrossRef]
- Krrosnick, J.A.; Presser, S. Question and Questionnaire Design. In Handbook of Survey Research, 2nd ed.; Wright, J., Marsden, P., Eds.; Elsevier: San Diego, CA, USA, 2009; pp. 263–313. [Google Scholar]
- Glasow, P.A. Fundamentals of Survey Research Methodology; MITRE: McLean, VA, USA, 2005. [Google Scholar]
- Martin, E. Survey questionnaire construction. Surv. Methodol. 2006, 13, 1–13. [Google Scholar]
- Olson, K. An Examination of Questionnaire Evaluation by Expert Reviewers. Field Methods 2010, 22, 295–318. [Google Scholar] [CrossRef] [Green Version]
- Hinkin, T.R. A Brief Tutorial on the Development of Measures for Use in Survey Questionnaires. Organ. Res. Methods 1998, 1, 104–121. [Google Scholar] [CrossRef]
- Schriesheim, C.A.; Eisenbach, R.J. An Exploratory and Confirmatory Factor-Analytic Investigation of Item Wording Effects on the Obtained Factor Structures of Survey Questionnaire Measures. J. Manag. 1995, 21, 1177–1193. [Google Scholar] [CrossRef]
- Mak, T.M.; Iris, K.M.; Tsang, D.C.; Hsu, S.C.; Poon, C.S. Promoting food waste recycling in the commercial and industrial sector by extending the Theory of Planned Behaviour: A Hong Kong case study. J. Clean. Prod. 2018, 204, 1034–1043. [Google Scholar] [CrossRef]
- Hong, S.; Adams, R.M. Household responses to price incentives for recycling: Some further evidence. Land Econ. 1999, 75, 505–514. [Google Scholar] [CrossRef]
- Thøgersen, J. Monetary incentives and recycling: Behavioural and psychological reactions to a performance-dependent garbage fee. J. Consum. Policy 2003, 26, 197–228. [Google Scholar] [CrossRef]
- Abila, B.; Kantola, J. The perceived role of financial incentives in promoting waste recycling—Empirical evidence from Finland. Recycling 2019, 4, 4. [Google Scholar] [CrossRef] [Green Version]
- Gibovic, D.; Bikfalvi, A. Incentives for Plastic Recycling: How to Engage Citizens in Active Collection. Empirical Evidence from Spain. Recycling 2021, 6, 29. [Google Scholar] [CrossRef]
- OECD. Improving Markets for Recycled Plastics: Trends, Prospects and Policy Responses; OECD Publishing: Paris, France, 2018. [Google Scholar] [CrossRef]
- Geyer, R.; Jambeck, J.R.; Law, K.L. Production, use, and fate of all plastics ever made. Sci. Adv. 2017, 3, e1700782. [Google Scholar] [CrossRef] [Green Version]

| Q7 | Ethos | 130 | Q19 | Positive Reinforcement | 85 |
| Pathos | 21 | Positive Punishment | 66 | ||
| Q8 | Ethos | 93 | Q20 | Positive Reinforcement | 92 |
| Logos | 58 | Negative Punishment | 59 | ||
| Q9 | Aesthetics | 85 | Q21 | Negative Reinforcement | 85 |
| Ethos | 66 | Positive Reinforcement | 66 | ||
| Q10 | Pathos | 76 | Q22 | Positive Punishment | 87 |
| Logos | 75 | Negative Punishment | 64 | ||
| Q11 | Aesthetics | 121 | Q23 | Negative Reinforcement | 87 |
| Pathos | 30 | Positive Punishment | 64 | ||
| Q12 | Aesthetics | 108 | Q24 | Negative Reinforcement | 109 |
| Logos | 43 | Negative Punishment | 42 |
| Question Number | Persuasion Technique | Observed Score | Expected Score | Chi-Square Score | p-Value |
|---|---|---|---|---|---|
| Q7 | Ethos | 130 | 75.5 | 78.68 | <0.001 * |
| Pathos | 21 | ||||
| Q8 | Ethos | 93 | 75.5 | 8.11 | 0.004 * |
| Logos | 58 | ||||
| Q9 | Aesthetics | 85 | 75.5 | 2.39 | 0.122 |
| Ethos | 66 | ||||
| Q10 | Pathos | 76 | 75.5 | 0.01 | 0.935 |
| Logos | 75 | ||||
| Q11 | Aesthetics | 121 | 75.5 | 54.84 | <0.001 * |
| Pathos | 30 | ||||
| Q12 | Aesthetics | 108 | 75.5 | 27.98 | <0.001 * |
| Logos | 43 |
| Question Number | Operant Condition | Observed Score | Expected Score | Chi-Square Score | p-Value |
|---|---|---|---|---|---|
| Q19 | Positive Reinforcement | 85 | 75.5 | 2.39 | 0.122 |
| Positive Punishment | 66 | ||||
| Q20 | Positive Reinforcement | 92 | 75.5 | 7.21 | 0.007 * |
| Negative Punishment | 59 | ||||
| Q21 | Negative Reinforcement | 85 | 75.5 | 2.39 | 0.122 |
| Positive Reinforcement | 66 | ||||
| Q22 | Positive Punishment | 87 | 75.5 | 3.50 | 0.061 |
| Negative Punishment | 64 | ||||
| Q23 | Negative Reinforcement | 87 | 75.5 | 3.50 | 0.061 |
| Positive Punishment | 64 | ||||
| Q24 | Negative Reinforcement | 109 | 75.5 | 29.72 | <0.001 * |
| Negative Punishment | 42 |
| Q13 | Ethos | 129 | Q25 | Positive Reinforcement | 93 |
| Pathos | 22 | Positive Punishment | 58 | ||
| Q14 | Ethos | 81 | Q26 | Positive Reinforcement | 105 |
| Logos | 70 | Negative Punishment | 46 | ||
| Q15 | Aesthetics | 82 | Q27 | Positive Reinforcement | 79 |
| Ethos | 69 | Negative Reinforcement | 72 | ||
| Q16 | Logos | 86 | Q28 | Positive Punishment | 86 |
| Pathos | 65 | Negative Punishment | 65 | ||
| Q17 | Aesthetics | 123 | Q29 | Negative Reinforcement | 82 |
| Pathos | 28 | Positive Punishment | 69 | ||
| Q18 | Aesthetics | 90 | Q30 | Negative Reinforcement | 105 |
| Logos | 61 | Negative Punishment | 46 |
| Question Number | Persuasion Technique | Observed Score | Expected Score | Chi-Square Score | p-Value |
|---|---|---|---|---|---|
| Q13 | Ethos | 129 | 75.5 | 75.82 | <0.001 * |
| Pathos | 22 | ||||
| Q14 | Ethos | 81 | 75.5 | 0.80 | 0.370 |
| Logos | 70 | ||||
| Q15 | Aesthetics | 82 | 75.5 | 1.11 | 0.290 |
| Ethos | 69 | ||||
| Q16 | Logos | 86 | 75.5 | 2.92 | 0.087 |
| Pathos | 65 | ||||
| Q17 | Aesthetics | 123 | 75.5 | 59.76 | <0.001 * |
| Pathos | 28 | ||||
| Q18 | Aesthetics | 90 | 75.5 | 5.57 | 0.018 |
| Logos | 61 |
| Question Number | Operant Condition | Observed Score | Expected Score | Chi-Square Score | p-Value |
|---|---|---|---|---|---|
| Q25 | Positive Reinforcement | 93 | 75.5 | 8.113 | 0.004 * |
| Positive Punishment | 58 | ||||
| Q26 | Positive Reinforcement | 105 | 75.5 | 23.053 | <0.001 * |
| Negative Punishment | 46 | ||||
| Q27 | Positive Reinforcement | 79 | 75.5 | 0.325 | 0.568 |
| Negative Reinforcement | 72 | ||||
| Q28 | Positive Punishment | 86 | 75.5 | 2.921 | 0.087 |
| Negative Punishment | 65 | ||||
| Q29 | Negative Reinforcement | 82 | 75.5 | 1.119 | 0.290 |
| Positive Punishment | 69 | ||||
| Q30 | Negative Reinforcement | 105 | 75.5 | 23.053 | <0.001 * |
| Negative Punishment | 46 |
| Persuasion Technique | Question Number | Score | Mean Score |
|---|---|---|---|
| Aesthetics | Q35 | 4.37 | 4.28 |
| Q40 | 4.31 | ||
| Q45 | 4.32 | ||
| Q50 | 4.28 | ||
| Q54 | 4.13 | ||
| Ethos | Q32 | 4.19 | 4.21 |
| Q36 | 4.25 | ||
| Q41 | 4.28 | ||
| Q46 | 4.07 | ||
| Q51 | 4.26 | ||
| Logos | Q34 | 4.06 | 3.46 |
| Q39 | 4.06 | ||
| Q44 | 3.80 | ||
| Q48 | 2.21 | ||
| Q53 | 3.15 | ||
| Pathos | Q33 | 3.56 | 3.98 |
| Q38 | 4.04 | ||
| Q42 | 3.99 | ||
| Q47 | 4.05 | ||
| Q52 | 4.28 |
| Comparison of Persuasion Techniques | t-Value | p-Value |
|---|---|---|
| Ethos (4.21) with Pathos (3.98) | 2.25 | 0.024 * |
| Ethos (4.21) with Logos (3.46) | 2.59 | 0.013 * |
| Aesthetics (4.28) with Ethos (4.21) | 1.57 | 0.073 |
| Aesthetics (4.28) with Pathos (3.98) | 2.94 | 0.007 * |
| Aesthetics (4.28) with Logos (3.46) | 2.84 | 0.008 * |
| Logos (3.46) with Pathos (3.98) | 1.61 | 0.069 |
| Ethos | Pathos | Logos | Aesthetics | Positive Reinforcement | Positive Punishment | Negative Punishment | Negative Reinforcement | |||
|---|---|---|---|---|---|---|---|---|---|---|
| Based on Age | 18–30 | Mean | 30.3 | 10.7 | 29.8 | 36.0 | 30.2 | 32.8 | 17.0 | 26.0 |
| Std. Dev. | 12.5 | 4.9 | 5.7 | 9.0 | 6.5 | 6.8 | 4.6 | 6.7 | ||
| 31–45 | Mean | 35.3 | 16.3 | 21.7 | 35.8 | 30.2 | 28.3 | 18.8 | 32.7 | |
| Std. Dev. | 8.9 | 10.2 | 5.2 | 8.2 | 5.3 | 4.6 | 2.4 | 4.9 | ||
| 46+ | Mean | 25.7 | 12.0 | 12.3 | 24.8 | 23.2 | 9.8 | 15.8 | 27.2 | |
| Std. Dev. | 6.2 | 7.7 | 4.6 | 5.8 | 5.0 | 2.3 | 8.8 | 5.4 | ||
| Prefer Not to Answer | Mean | 3.3 | 1.3 | 1.7 | 3.6 | 3.2 | 0.7 | 2.0 | 4.2 | |
| Std. Dev. | 1.4 | 1.4 | 0.5 | 0.5 | 1.0 | 0.5 | 1.7 | 1.0 | ||
| Based on Gender | Male | Mean | 44.7 | 19.8 | 26.5 | 45.8 | 38.7 | 28.7 | 28.0 | 42.7 |
| Std. Dev. | 12.1 | 13.8 | 5.8 | 10.3 | 5.4 | 4.0 | 7.1 | 6.0 | ||
| Female | Mean | 46.5 | 19.5 | 37.3 | 50.6 | 44.8 | 41.3 | 23.3 | 44.5 | |
| Std. Dev. | 15.3 | 8.8 | 9.2 | 9.1 | 9.3 | 8.4 | 3.2 | 8.5 | ||
| Prefer Not to Mention | Mean | 2.0 | 0.7 | 1.0 | 2.4 | 2.5 | 0.0 | 1.3 | 2.2 | |
| Std. Dev. | 0.9 | 1.0 | 0.0 | 0.5 | 0.5 | 0.0 | 1.4 | 1.0 | ||
| Non-Binary | Mean | 1.5 | 0.3 | 0.7 | 1.4 | 0.7 | 1.7 | 1.0 | 0.7 | |
| Std. Dev. | 0.5 | 0.5 | 0.5 | 0.5 | 0.8 | 0.5 | 0.6 | 0.5 | ||
| Based on Awareness | Tremendous | Mean | 14.7 | 6.0 | 11.5 | 15.6 | 12.2 | 10.5 | 7.8 | 17.5 |
| Std. Dev. | 4.1 | 2.4 | 3.4 | 3.5 | 3.7 | 2.1 | 3.9 | 3.0 | ||
| High | Mean | 48.7 | 19.3 | 30.3 | 48.8 | 44.0 | 33.3 | 28.2 | 42.5 | |
| Std. Dev. | 14.7 | 13.7 | 7.3 | 11.0 | 5.3 | 5.6 | 5.8 | 7.1 | ||
| Moderate | Mean | 28.7 | 13.0 | 22.3 | 34.0 | 29.0 | 25.5 | 16.0 | 27.5 | |
| Std. Dev. | 10.3 | 7.6 | 5.0 | 6.1 | 4.9 | 5.3 | 1.9 | 4.7 | ||
| Little | Mean | 2.7 | 2.0 | 1.3 | 1.8 | 1.5 | 2.3 | 1.7 | 2.5 | |
| Std. Dev. | 0.5 | 0.6 | 0.5 | 0.4 | 0.8 | 0.5 | 0.8 | 0.5 | ||
| Based on Recycling Efforts | Tremendous | Mean | 4.2 | 2.3 | 3.7 | 3.8 | 4.7 | 1.8 | 2.5 | 5.0 |
| Std. Dev. | 0.8 | 0.5 | 0.5 | 1.1 | 1.0 | 1.0 | 1.6 | 1.7 | ||
| High | Mean | 44.2 | 17.0 | 31.3 | 48.8 | 41.0 | 32.5 | 24.3 | 44.2 | |
| Std. Dev. | 15.3 | 10.7 | 9.9 | 9.1 | 6.0 | 5.2 | 7.6 | 9.0 | ||
| Moderate | Mean | 37.7 | 15.8 | 22.3 | 35.6 | 30.2 | 29.8 | 19.7 | 32.3 | |
| Std. Dev. | 9.5 | 11.5 | 3.2 | 9.4 | 6.0 | 5.6 | 1.8 | 4.6 | ||
| Little | Mean | 7.0 | 3.2 | 7.2 | 10.8 | 8.5 | 6.8 | 6.5 | 6.2 | |
| Std. Dev. | 4.0 | 1.5 | 1.8 | 2.2 | 1.8 | 0.8 | 2.4 | 1.2 | ||
| Very Little | Mean | 1.7 | 2.0 | 1.0 | 1.2 | 2.3 | 0.7 | 0.7 | 2.3 | |
| Std. Dev. | 0.5 | 0.0 | 0.0 | 0.4 | 0.5 | 0.8 | 0.8 | 1.0 | ||
| Aesthetics | Ethos | Logos | Pathos | ||
|---|---|---|---|---|---|
| Based on Age | 18–30 | 4.40 | 4.40 | 3.63 | 4.06 |
| 31–45 | 4.31 | 4.25 | 3.43 | 4.05 | |
| 46+ | 4.15 | 3.97 | 3.27 | 3.87 | |
| Prefer Not to Answer | 3.84 | 3.56 | 3.32 | 3.32 | |
| Based on Gender | Male | 4.27 | 4.14 | 3.47 | 3.94 |
| Female | 4.32 | 4.30 | 3.48 | 4.05 | |
| Non-Binary | 4.30 | 4.30 | 2.90 | 3.90 | |
| Prefer Not to Mention | 3.80 | 3.67 | 3.13 | 3.47 | |
| Based on Awareness | Tremendous | 4.44 | 4.52 | 3.28 | 4.08 |
| High | 4.29 | 4.22 | 3.50 | 4.05 | |
| Moderate | 4.16 | 4.02 | 3.47 | 3.83 | |
| Little | 4.75 | 4.50 | 3.55 | 4.00 | |
| Based on Recycling Efforts | Tremendous | 4.00 | 3.69 | 2.91 | 3.74 |
| High | 4.44 | 4.42 | 3.47 | 4.21 | |
| Moderate | 4.17 | 4.03 | 3.54 | 3.83 | |
| Little | 3.97 | 3.97 | 3.43 | 3.43 | |
| Very Little | 4.73 | 5.00 | 3.00 | 4.87 |
| [16] Reference Question Number | Question Number (Current Survey) | Score |
|---|---|---|
| Q13 | Q55 | 3.66 |
| Q14 | Q56 | 4.54 |
| Q17 | Q57 | 3.60 |
| Q27 | Q58 | 3.46 |
| Q32 | Q59 | 4.14 |
| [16] Reference Question Number | Entropy Values from [16] | Question Number (Current Survey) | Entropy Values from this Survey | Entropy Difference | Entropy Difference (%) |
|---|---|---|---|---|---|
| Q13 | 2.11 | Q55 | 2.10 | 0.01 | 0.47% |
| Q14 | 1.92 | Q56 | 1.30 | 0.62 | 32.29% |
| Q17 | 2.03 | Q57 | 2.11 | −0.08 | −3.94% |
| Q27 | 2.21 | Q58 | 2.11 | 0.10 | 4.52% |
| Q32 | 2.16 | Q59 | 1.74 | 0.42 | 19.44% |
Disclaimer/Publisher’s Note: The statements, opinions and data contained in all publications are solely those of the individual author(s) and contributor(s) and not of MDPI and/or the editor(s). MDPI and/or the editor(s) disclaim responsibility for any injury to people or property resulting from any ideas, methods, instructions or products referred to in the content. |
© 2023 by the authors. Licensee MDPI, Basel, Switzerland. This article is an open access article distributed under the terms and conditions of the Creative Commons Attribution (CC BY) license (https://creativecommons.org/licenses/by/4.0/).
Share and Cite
Ketkale, H.; Simske, S. Demographic Considerations in Incenting Reuse of Corrugated Cardboard Boxes. Sustainability 2023, 15, 11600. https://doi.org/10.3390/su151511600
Ketkale H, Simske S. Demographic Considerations in Incenting Reuse of Corrugated Cardboard Boxes. Sustainability. 2023; 15(15):11600. https://doi.org/10.3390/su151511600
Chicago/Turabian StyleKetkale, Harshwardhan, and Steven Simske. 2023. "Demographic Considerations in Incenting Reuse of Corrugated Cardboard Boxes" Sustainability 15, no. 15: 11600. https://doi.org/10.3390/su151511600
APA StyleKetkale, H., & Simske, S. (2023). Demographic Considerations in Incenting Reuse of Corrugated Cardboard Boxes. Sustainability, 15(15), 11600. https://doi.org/10.3390/su151511600