Article

Impact Analysis of Smart Road Stud on Driving Behavior and Traffic Flow in Two-Lane Two-Way Highway

School of Traffic and Transportation Engineering, Central South University, Changsha 410083, China
*
Author to whom correspondence should be addressed.
Sustainability 2023, 15(15), 11559; https://doi.org/10.3390/su151511559
Submission received: 7 June 2023 / Revised: 19 July 2023 / Accepted: 24 July 2023 / Published: 26 July 2023
(This article belongs to the Special Issue Traffic Flow, Road Safety, and Sustainable Transportation)

Abstract

:
The smart road stud (SRS) system can improve the driver’s overtaking behavior through light guidance, which shows great potential in raising the traffic efficiency of two-way two-lane roads (TWTL). In this paper, we propose a light guidance system based on SRS and a combination of driving simulator and microscopic traffic simulation methodologies for evaluating the effect of smart road studs on a TWTL traffic flow. The driving simulation results reveal that SRSs do not only drastically alter microscopic driving characteristics but also it significantly influences drivers’ decision-making process for overtaking. The frequency of overtaking with SRS escalated by 114.58% compared to that without, with the key differential in overtaking decision patterns manifesting predominantly in the selection of distance between oncoming vehicles traveling in the opposite direction. Microsimulation results demonstrate that the implementation of a smart stud system can enhance both the safety and traffic efficiency on the TWTL roadway with limited sight.

1. Introduction

In China’s existing road traffic system, the mileage of two-way two-lane roads accounts for more than 90% of the total mileage of national highways, and 84.76% of the total accidents occur on such roads. At the same time, the two-way two-lane traffic flow is heterogeneous, slow trucks will slow down the speed of cars, forming a phenomenon called moving bottleneck which reduces the traffic efficiency [1].
Solutions to this issue may include the development of ‘smart highways’, a concept entailing the integration of modern sensing, computation, communication, and control technologies such as vehicular networking, the Internet of Things, cloud computing, big data, and artificial intelligence [2]. Smart road studs, a crucial element of smart highways, have attracted substantial research interest in recent years. Smart road studs are based on solar-powered road studs, adding IoT communication, magnet detection, and self-illumination functional modules, so that they can judge the precise position of the vehicle on the lane, real-time speed, and vehicle classification, offering driving guidance through LED lights.
Currently, there are various means of guidance systems to help drivers while they are driving, such as traffic signal systems, road markings, in-car GPS, and apps with navigation functions and connected vehicle functionalities. Overtaking assistance is an important function in a guidance system, which is usually implemented by vehicle-to-vehicle (V2V) communication in connected vehicles. However, the market share of V2V-capable vehicles has not been high due to the requirement for V2V communication precision, which limits its effect. Using light guidance with smart road studs to provide overtaking assistance to all vehicles on the road rather than using just connected vehicles will solve the problem.
There are three levels of implementation of smart road studs: lane marking, risk zone warning, and guidance of complex driving behavior. Today, road studs are commonly used as road markers to guide the driver’s line of sight. Some spikes are used for accident warnings in tunnels and distance warnings in foggy weather according to the actual traffic conditions. Overtaking assistance, which belongs to the implementation of smart road studs involving complex driving behavior along with vehicle position judgment, safe overtaking distance judgment, and the driver’s grasp of the overtaking opportunity displayed by the smart spike, is different from risk zone warning. While current studies are mainly focused on the detection algorithm and the accuracy of smart studs, drivers’ behavioral characteristics under the influence of SRS’ light guidance and the impact on traffic flow require further exploration. This paper aims to examine drivers’ overtaking decisions in the context of a smart stud system, comparing scenarios with and without the system, and to construct a two-dimensional traffic flow simulation to investigate the effects of the SRS system on traffic flow, speed, and service level under various conditions.

2. Literature Overview

2.1. Smart Road Stud

Road studs are commonly employed as passive measures to enhance traffic safety. It is reported that South Wales and Norfolk amplified road visibility by integrating solar-powered road studs, significantly decreasing nighttime accidents [3]. Concurrently, Shahar and Reed substantiated through simulated driving experiments that drivers could enhance driving comfort by following the luminance of road studs [4,5]. Villa experimentally derived a brightness model to guarantee road stud visibility under varying environmental conditions [6]. In terms of road stud network development, Samardzija et al. proposed a system which connected sensors installed near the road edge to a cellular network via wireless technology, building a miniature network of 20 road studs and a cellular gateway. This system facilitated the transmission of messages from sensors to a monitoring center [7].
Smart road studs, along with smart roads, are an emerging concept introduced in recent years which refers to the application of next-generation sensing, computing, and communication technologies such as in-vehicle networks, Internet of Things, cloud computing, big data analytics, and artificial intelligence for accurate, real-time sensing and communication of traffic and road conditions to accurately capture the status of roads and provide traffic improvement services [2]. By providing more comprehensive information coverage of roads, vehicles and human drivers can be aware of hazardous traffic and road conditions, adverse weather conditions, traffic congestion, etc., enabling a range of safety and efficiency-related applications.
However, while considerable research has been conducted on the detection algorithm and precision of smart studs [4,8,9], their influence on drivers’ behavior under the guidance of smart stud lights and their overall effect on traffic flow is yet to be sufficiently explored. This paper aims to analyze the driver’s lane-changing decisions under the smart road stud system by comparing scenarios both with and without the stud system.

2.2. Two-Lane Two-Way Driving Behavior Characteristics

The behavioral characteristics of drivers on two-way two-lane roads will vary under different road and weather conditions. In the research of driving behavior, driving simulators are widely used for the consideration of controllability, repeatability, and safety. Lobjois et al. demonstrated the effectiveness of the low-cost driving simulator with a Logitech G25 steering wheel in measuring driving behavior and speed using a comparative experiment [10].
In terms of overtaking decision models, Toledo et al. were the first to consider driver heterogeneity and traffic state dependence and to elevate the decision process from lane change intentions to the perception of a mutual understanding of the right of way, proposing a discrete choice model for lane change behavior decisions based on utility theory [11]. Li et al. used a level-k game theory framework to develop an overtaking decision model that considered the interaction between vehicles with different driving styles [12]. Artificial intelligence models are also a hot topic for current research applications. Balal et al. incorporated a fuzzy inference system into the logical reasoning process of lane-changing decisions, but its applicability conditions were limited to free lane-changing [13]. Xie et al. used a deep learning model, which has a higher accuracy rate compared with the ordinary machine learning model, to mine the lane-changing behavior in the NGSIM dataset [14]. By using a Bayesian network model to model the uncertainty of overtaking behavior, Vlahogianni investigated the differences in overtaking decisions by gender and visualized the details of the overtaking decision model using conditional probability, which improved the interpretability of the model to some extent [15]. Therefore, a similar model is used to model the driver’s overtaking behavior in this paper.

2.3. Microscopic Simulation

Microscopic traffic simulation has proven to be highly applicable in the field of traffic simulation. However, current existing commercial simulation simulators (Vissim, SUMO, Transmodeler, and AIMSUN) and widely used cellular automata models are lane-based one-dimensional traffic flow models, which do not fully reflect all microscopic driving behavior features.
While two-dimensional models have been reported in the literature before such as the optimal control model, discrete choice model, and self-driven-particle model [16,17,18], force-based models are widely used and perform well in two-dimensional traffic simulation without lane delineation [19]. Inspired by Helbing’s social force model (SFM) for pedestrian dynamics [20], each agent in a force-based model receives virtual forces generated from the physical boundary or social relationship between the agent and its neighbor. Based on SFM, Anvari et al. described and evaluated a shared-space microscopic mixed traffic model based on a social force model using data from the shared space of Brighton [21]. Yang et al. first introduced gap forces, side-by-side vehicles based on the previous social force models for motor vehicles [22]. Delpiano et al. replicated the lateral friction between vehicles and the slack phenomenon at the bottleneck of the ramp merge based on the social force model paradigm [23]. Zhao found strong similarities in the flow-density diagrams and trajectories of pedestrians, bicycles, and vehicles, and the results obtained using a social force model to simulate the three road users were in remarkable agreement with the field data [24].
In order to reproduce more complex traffic behaviors, subsequent studies started to incorporate rule-based decision modules. Johora et al. combined game theory and social force models to construct a generic model to generate real trajectories of pedestrians and cars in shared spaces, clustered the parameters in the game theory model to group road users, and used the clustering results to improve the model performance [25]. Yoon designed a two-tier algorithm for autonomous driving planning and guidance. In the tactical layer, the algorithm selects lanes by comparing the magnitude of social forces between different lanes; then, lane tracking is implemented in the execution layer. This algorithm can efficiently accomplish vehicle trajectory tracking in complex situations with multiple lanes [26].
The current relevant two-dimensional microsimulation models are mostly applied to urban intersections, ramps, and non-motorized mixed traffic scenarios and are less applied in two-way two-lane scenarios, so it is meaningful to construct two-dimensional microsimulation models to simulate the overtaking behavior of vehicles in two-way two-lane scenarios.

3. Materials and Methods

3.1. Overall Framework

In this study, an integrated approach is used, combining virtual reality driving simulation and traffic microsimulation, including four steps: (1) design of the smart road stud system, (2) driving simulation experiment, (3) micro traffic simulation, and (4) result analysis.

3.2. The Visual Guide of Smart Road Stud System

Unlike freeway traffic flow, the act of overtaking on two-lane two-way roads in both directions requires the use of the opposite lane of oncoming traffic, which can significantly increase the risk of head-on collisions, especially when drivers fail to realize the adequacy of the available overtaking distance [27]. The overtaking maneuver on two-lane two-way roads is divided into four categories: ordinary overtaking, flying overtaking, overtaking multiple vehicles, and following overtaking (which is also called piggybacking). Normal overtaking maneuvers are those in which the overtaking vehicle follows the leading vehicle at a constant speed and waits for a sufficient gap to perform the overtaking maneuver [28]. Subsequently, the overtaking vehicle accelerates to change lanes and performs the overtaking maneuver.
As shown in Figure 1, normal overtaking maneuvers are believed to begin when the driver of the overtaking vehicle develops a desire to overtake the leading vehicle traveling in front of him. The driver follows the leading vehicle at a constant speed and waits for sufficient clearance to perform the overtaking maneuver. The driver evaluates a variety of factors to determine whether to overtake or not (the specific judgment process will be discussed later), and after passing the overtaking decision, the overtaking vehicle accelerates to change lanes and performs the overtaking maneuver.
In order to avoid collision with other vehicles during the overtaking process, a certain safety distance should be maintained between vehicles. Currently, most safe distance models are calculated using vehicle dynamics to get the relative position relationship that the rear vehicle can ensure safety in in the case of sudden braking of the front vehicle n − 1, i.e., to satisfy the spacing between vehicles before and after overtaking is greater than d n 1 , n s a f e .
d n 1 , n s a f e = v n 1 ( t ) τ n + v n 1 ( t ) 2 2 a n 1 m a x d e c v n ( t ) 2 2 a n m a x d e c
where v n ( t ) represents the velocity of the vehicle n and τ n represents the driver’s reaction time. a n m a x d e c represents the maximum deceleration of vehicle n.
When the vehicle starts to overtake, record the start moment of the borrowing lane overtaking as t ; v n t is the longitudinal velocity of the vehicle n to be overtaken along the road centerline direction at this time; the longitudinal velocity of the vehicle n 1 to be overtaken is v n 1 t . From the longitudinal velocity change of the borrowing lane overtaking vehicle, the velocity change goes through two processes: from the longitudinal velocity v n t , it accelerates to the maximum longitudinal speed v n m a x with the maximum longitudinal acceleration a n m a x and then overtakes the overtaken vehicle n 1 with the maximum speed v n m a x until it returns to this lane, and these two processes take t 1 and t 2 , respectively.
t 1 = v n m a x v n ( t ) a n m a x ,
t 2 = d n 1 , n 0 + d n , n 1 safe   + l n 1 s n t + t 1 s n ( t ) v n m a x ,
Consider setting aside some redundant distance d e x t r a with the opposite vehicle to ensure safety. Thus, the safe distance d n , n ¯ s a f e for entering the opposite lane can be expressed as the following equation:
d n , n safe   = s n t + t 1 + t 2 s n t + v n t t 1 + t 2 + d extra   = d n 1 , n s a fe   + d n , n 1 safe   + l n 1 + v n 1 t t 1 + t 2 + v n t t 1 + t 2 + d extra   ,
Throughout the overtaking behavior, it is assumed that the leading vehicle and the oncoming vehicle are traveling at their respective speeds in their respective lanes, independent of the position, speed, and acceleration of the passing vehicle. While this may be considered a bit too conservative, we do not want the overtaking assist function to rely on the oncoming vehicle’s braking, as this action could lead to a collision if the oncoming vehicle does not brake.
With respect to the overtaking decision, this paper assumes that drivers start considering whether to overtake when they first see the leading vehicle. Obviously, the decision to overtake on a two-lane highway requires the driver to enter the opposing lane, and the most imminent accident risk comes from the opposing vehicle. Therefore, in order to overtake, there should be sufficient clearance between the opposing vehicles. In this study, each relative gap in traffic is considered as an opportunity to overtake; this opportunity ends when the opposing vehicle passes the target vehicle, and a new opportunity to overtake begins. Each time, the smart road stud system determines whether the gap in the opposite lane satisfies the requirement of the safe distance d n , n ¯ s a f e for entering the opposite lane, and if it does, the smart road stud within the d n , n ¯ s a f e for entering the opposite lane as shown in Figure 1 displays a green light to create a moving window to indicate to the driver that it is safe to overtake at this time.

3.3. Driving Simulator Experimental

3.3.1. Experimental Scenario

The experiment was conducted in the first comprehensive experiment building of the School of Civil Engineering, Central South University, and the driving simulator includes a Logitech G29 force-feedback steering wheel, foot pedals, a gearbox, and a fixed driving seat.
The driving scenario simulated a typical two-way two-lane scenario in China, with a lane width of 3.75 m, a 1.5 m wide shoulder, and a design speed of 60 km·h−1. As shown in Figure 2, the experimental road section consisted of 10 straight sections as well as 10 circular curves, including a 300 m straight section at the starting point; straight line acceleration sections, with the lengths of the straight line sections between the circular curves varying from 120 m to 550 m; as well as turning angles of 60° and the radius set to 200 m for the circular curves. The environment around the road is similar to the typical mountainous two-way two-lane environment, with trees and buildings set on both sides of the road to simulate the typical two-way two-lane road with limited sight distance characteristics.
In order to display the smart road studs in the driving simulation environment, a 3D model of the smart road studs was created in 3Dmax and imported into Prescan as road segments. The luminous effect of the smart road studs was simulated by using translucent spheres in Prescan. During the simulation, invoke Prescan’s Simulink mode and program to calculate the safety distance using Formulas (1)–(4). If there is an oncoming vehicle within the driver’s safety distance, the translucent sphere corresponding to the smart road stud within the driver’s safety distance will display a red light; otherwise, it will display a green light.
For the background traffic flow, the opposing lane was controlled by Simulink to generate traffic flow into the experimental section at an interval of 50 m~500 m evenly distributed in the opposing lane. For the same-directional convoy, a convoy of two trucks with a 50 m interval was set in front of the driver’s vehicle, and the convoy contained 10 trucks with the same speed, i.e., each driver could perform overtaking up to 10 times during the experiment.
All background vehicles traveled at a uniform speed, and the speed distribution conformed to the relevant statistics of the field survey, i.e., 51.2 km·h−1 for small cars with a normal distribution of 7.265 standard deviation and 45.5 km·h−1 for heavy trucks with a normal distribution of 6.137 standard deviation.

3.3.2. Participants

In this experiment, 36 drivers were recruited, and all held a C1 driver’s license and were not professional drivers. The mean age of the subjects was 24.34 years with a standard deviation of 4.84, and the mean driving age was 4.56 years with a standard deviation of 7.62.

3.3.3. Procedure

Before the experiment, each subject was asked to abide by traffic rules and daily driving habits. At the same time, it is emphasized that the smart road stud is an intelligent device that indicates whether the distance of the opposite traffic flow meets the safe overtaking conditions through the road and does not force the driver to follow the lights.
Every subject was asked to operate the simulator for at least one hour on a straight test road to become familiar with the driving simulator until the subject could steadily and accident-free complete the following, overtaking, and other actions on the test road before starting the experiment. At the same time, all subjects were informed that the driving simulation might cause dizziness, nausea, and other adverse reactions before the test drive and that they could stop the experiment at any time.
Once the experiment started, each driver was asked to drive in both scenarios in a randomized order. Every subject was asked to re-run the experiment if any collision happened. A screenshot during the driving simulation experiment is shown in Figure 3.

3.4. Force-Based Microscopic Simulation

The microsimulation model is mainly divided into two parts: the Bayesian network model which controls vehicle overtaking decisions and the social force model which generates vehicle action.

3.4.1. TAN-Based Overtaking Decision Model

To demonstrate the difference in driving behavior between using and not using SRS in microsimulation, we have decided to utilize data from driving simulator experiments to train a machine learning model that determines the overtaking behavior of each vehicle in the microsimulation.
Bayesian networks are characterized by their ability to describe joint probability distributions of variables, a feature which offers an edge in handling uncertainty and intricate probabilistic inference tasks. Applications of Bayesian networks span across traffic volume prediction, traffic accident prediction, and lane-changing decisions [15,29,30]. The fundamental assumption of the plain Bayesian algorithm is the independence of attributes. However, drivers’ decisions on overtaking maneuvers are evaluated based on a spectrum of traffic conditions during driving, which encompass interdependent variables like distance, relative speed, and acceleration. In contrast, the Tree Augmented Naive Bayes (TAN) algorithm introduces dependencies among variables to the standard Bayesian model. Each feature is permitted to depend on the category variables and, at most, one other feature, thereby facilitating training with correlated features.
A Bayesian network can be represented by an undirected graph N , L , Θ , where N represents the nodes, representing each random variable of the network, i.e., the factors that affect the driver’s motivation to overtake, such as speed, distance, etc.; L represents the directed edges between the nodes { e i j | 1 i , j n , a n d   i j }, where e i j represents the dependency relationship between nodes X i and X j , taking the value of 1 for connected and 0 for unconnected; and Θ is the set of parameters of the Bayesian network { θ 1 , , θ n }, where θ i represents the conditional probability of node X i ; essentially, Bayes is the set of probability distributions P B of all variables for different attribute classes c j :
P B x 1 , , x n = i = 1 n   P B x i c j
here: P B x 1 , , x n is the joint probability distribution of all features; P B x i c j is the posterior probability of x i under the assumption of c j ; c j in this paper is the driver’s choice to overtake or not overtake, j takes value 1 when the driver decides to overtake and value 2 when not to overtake, and C is the set of overtaking decisions c 1 , c 2 .
The posterior probabilities of all classes of attributes C can be computed by introducing all features X i of a new sample X into Equation (5), and the class with the highest probability is used as the classification result:
c l a s s i f y x 1 , , x n = arg m a x n   p ( c ) i = 1 n   p x i c j
The tree-augmented Bayesian algorithm is based on the abovementioned plain Bayesian model, and in order to better express the dependencies between attributes, Friedman introduced the concept of mutual information value I to quantify the dependencies between different nodes X i and X j :
I x i , x j = x i X , x j X   P x i , x j l o g 2 P x i , x j P x i P x j

3.4.2. Finite States Machine

A variety of different mathematical methods are currently used in microscopic traffic flow simulations and software for lane-changing decisions, including Finite State Machine (FSM), game theory, and Hidden Markov Models [12,31,32]. Among these methods, FSMs are widely used in robot behavior, pedestrian behavior modeling, and self-driving car decision systems because of their simplicity, computational efficiency, and robustness in unexpected situations.
A finite state machine can be represented by a quintet U, namely:
U = Σ , Γ , S , s ( 0 ) , δ
where: Σ denotes the state and parameters of the input state machine, and the inputs involved in this paper include the coordinates, velocity, acceleration, and relative position of the vehicle with other vehicles; Γ denotes the final state of the state machine output, which represents the state machine in this paper; S = s 1 , s 2 , , s n denotes the set of states and, in this paper, includes free driving, following, overtaking and aborting overtaking, where the overtaking maneuver is divided into four categories: ordinary overtaking, flying overtaking, overtaking multiple vehicles, and following overtaking; s ( 0 ) is the initial state as an element of S , using the final state of the vehicle at the previous time step or the initial state at the moment of vehicle generation. δ is the state transfer equation: δ : S × Σ S , which is the individual state thresholds of the transfer and the way of judging the state transfer. This finite state machine is shown in Figure 4:

3.4.3. Social Forces

In the SFM, an object’s dynamics are captured by a driving force and repulsive forces exerted by other road users. The driving force propels the object freely towards its destination at its desired speed, while the repulsive force signifies the desire to maintain a safe distance from other road users. Furthermore, boundaries of infrastructure like fences and markers exert a unique repulsive force, defined as boundary forces, which limit the object’s reach within a certain area.
When a vehicle is in free flow, if the vehicle n fails to reach or exceed its desired speed v n 0 at a certain time t, a forward driving force accelerates or decelerates the vehicle to achieve the desired speed within the relaxation time τ. The calculation formula of speed and forward driving force F n d r v
F n d r v = v n 0 v n ( t ) / τ
where v n 0 and v n t are the expected speed and actual speed of vehicle n, respectively; τ is the relaxation time.
During the course of driving, the vehicle maintains a safe distance from other objects. On a two-way two-lane road, the driver demonstrates an intention to keep a distance from proximate vehicles to avoid collision risk during following, overtaking, or merging. This intention is uniformly represented by an exponential function that decreases with distance. The repulsive force F n s v with other vehicles m is expressed as
F n , m s v = A s v exp d n , m B s v n n , m s v
where A s v is the strength of the repulsive force of the side car; d n , m is the distance from n cars to m cars; B s v is the range of the repulsive force of the vehicle; and n n , m s v represents the standard vector perpendicular to the boundary direction of vehicle n and pointing to vehicle m.
The original SFM considers the constraints of vehicles driving near the boundaries on both sides of the lane and uses an exponential function to characterize this effect. During an overtaking period on a two-way two-lane road, the driver additionally reverts to the original lane. Thus, the lane repulsion force F n b o u is expressed as
F n b o u i = A b o u i exp d b B bou   n bou   , i = 1,2
where i represents the boundaries of different lanes; A b o u i is the lane repulsion force intensity of the i-th boundary; d b is the minimum longitudinal distance of the nearest road boundary; B b o u is the expected action strength of n when returning to this lane; and n b o u represents the standard vector perpendicular to the boundary and pointing to the center of the lane.
When the vehicle is in the following state, in order to avoid an accident with the vehicle n − 1 in front, it is necessary to introduce a car following force to maintain a certain speed according to the movement state of the vehicle ahead. The Gipps model is claimed to be effective to reproduce such phenomenon in microscopic simulation [22]:
F n f o l = v n g v n ( t ) / τ
v n g = b n τ n + b n 2 τ 2 + b n 2 g n ( t ) v n ( t ) τ + v n 1 2 ( t ) / b n 1 n n , n 1 f o l
where F n f o l is the following force of the vehicle; b n is the maximum deceleration of vehicle n; and g n is the distance between vehicle n and vehicle n − 1.
Referring to the form of a bicycle’s overtaking force, we decouple the overtaking force in the lateral and longitudinal directions as F n o t x and F n o t y . When drivers generate the desire to pass, F n o t y should reach the maximum within the range of d s 1 and d s 2 , which denote the safe distance from the front vehicle, and gradually decrease to 0 after leaving this range. The vehicle is assumed to maintain a constant acceleration to the maximum speed, so the form of longitudinal overtaking driving force F n o t x adopts the form of a forward driving force. The overtaking driving forces are constructed as follows:
F n o t x = A o t x v n m a x v n ( t ) / τ r , n n n o t x
F n o t y = A o t y H d s 0 d r d s 1 d r + d s 2 n n o t y
where H( ) is the Heaviside function; A o t x and A o t y are the strengths of the overtaking driving force in the x direction and the y direction, respectively; v n m a x is the speed limit value Δ s is the longitudinal distance from the vehicle in front; and d s 0 is the furthest distance to generate overtaking driving force. This paper takes 1.2 × ( d s 1 + d s 1 ); d s 1 and d s 2 are the safety distances from the vehicle n − 1 before and after overtaking.
The social forces received by the driver in different driving states should also be different. For example, the vehicle should not consider the effect of the following force F n f o l when accelerating and overtaking and should not consider the overtaking force F n o t x and F n o t y when following a lead vehicle. In summary, the social force model combined with the finite state machine is shown in the following:
F n ( t ) = F n d v + F n b o u i , Free   driving F n d v + F n b o u i + F n , m s v + F n , n 1 , f o l , Car   following F n d v + F n b o u i + F n , m s v + F n o t x + F n o t v , Normal   overtaking F n d v + F n b o u i + F n , m s v + F n o t x + F n o t y + F n , n 1 f o l , Piggybacking F n d v + F n b o u i + F n , m s v + F n , n + 1 , f o l , Overtaking   abortion
where F n ( t ) denotes the resultant force. F n d v is the forward driving force. F n b o u i represents the boundary force. F n f o l is the following force; F n o t x and F n o t y are decoupled overtaking forces.

3.4.4. Calibration

The parameters of the model are calibrated by using field aerial photography data and traffic sensors on a typical two-way two-lane road in Yongxing, China. YOLOv5 is used to track the target vehicle in the aerial video and extract its average travel time, position, speed, and acceleration [33]. The number of overtaking maneuvers by the vehicle through the combination is calculated by the program and manually. These statistics are based on the separate statistics of cars and trucks without SRS. For the sake of convenience, vehicles with a length of less than 6 m are classified as cars, and the rest are classified as trucks. We have calibrated the social forces by minimizing a mixed objective function consisting of the observed average velocity and overtake times.
D ( β ) = i = 1 2 x i ( β ) x ^ i x ^ i 2 ,
where x i denotes average velocity and overtake times in simulation and x ^ i denotes average velocity and overtake times observed in aerial photography.
After employing the genetic algorithm (GA) to calibrate the parameters of the model like other microscopic models [19,22,34,35], the errors of vehicle speed and overtaking frequency of the simulation model obtained by the genetic algorithm are 7.71% and 9.51%, which shows that the model has high reliability. The parameter values calibrated is shown in Table 1.

4. Results

4.1. Driving Simulator Results

4.1.1. Overtaking Frequency

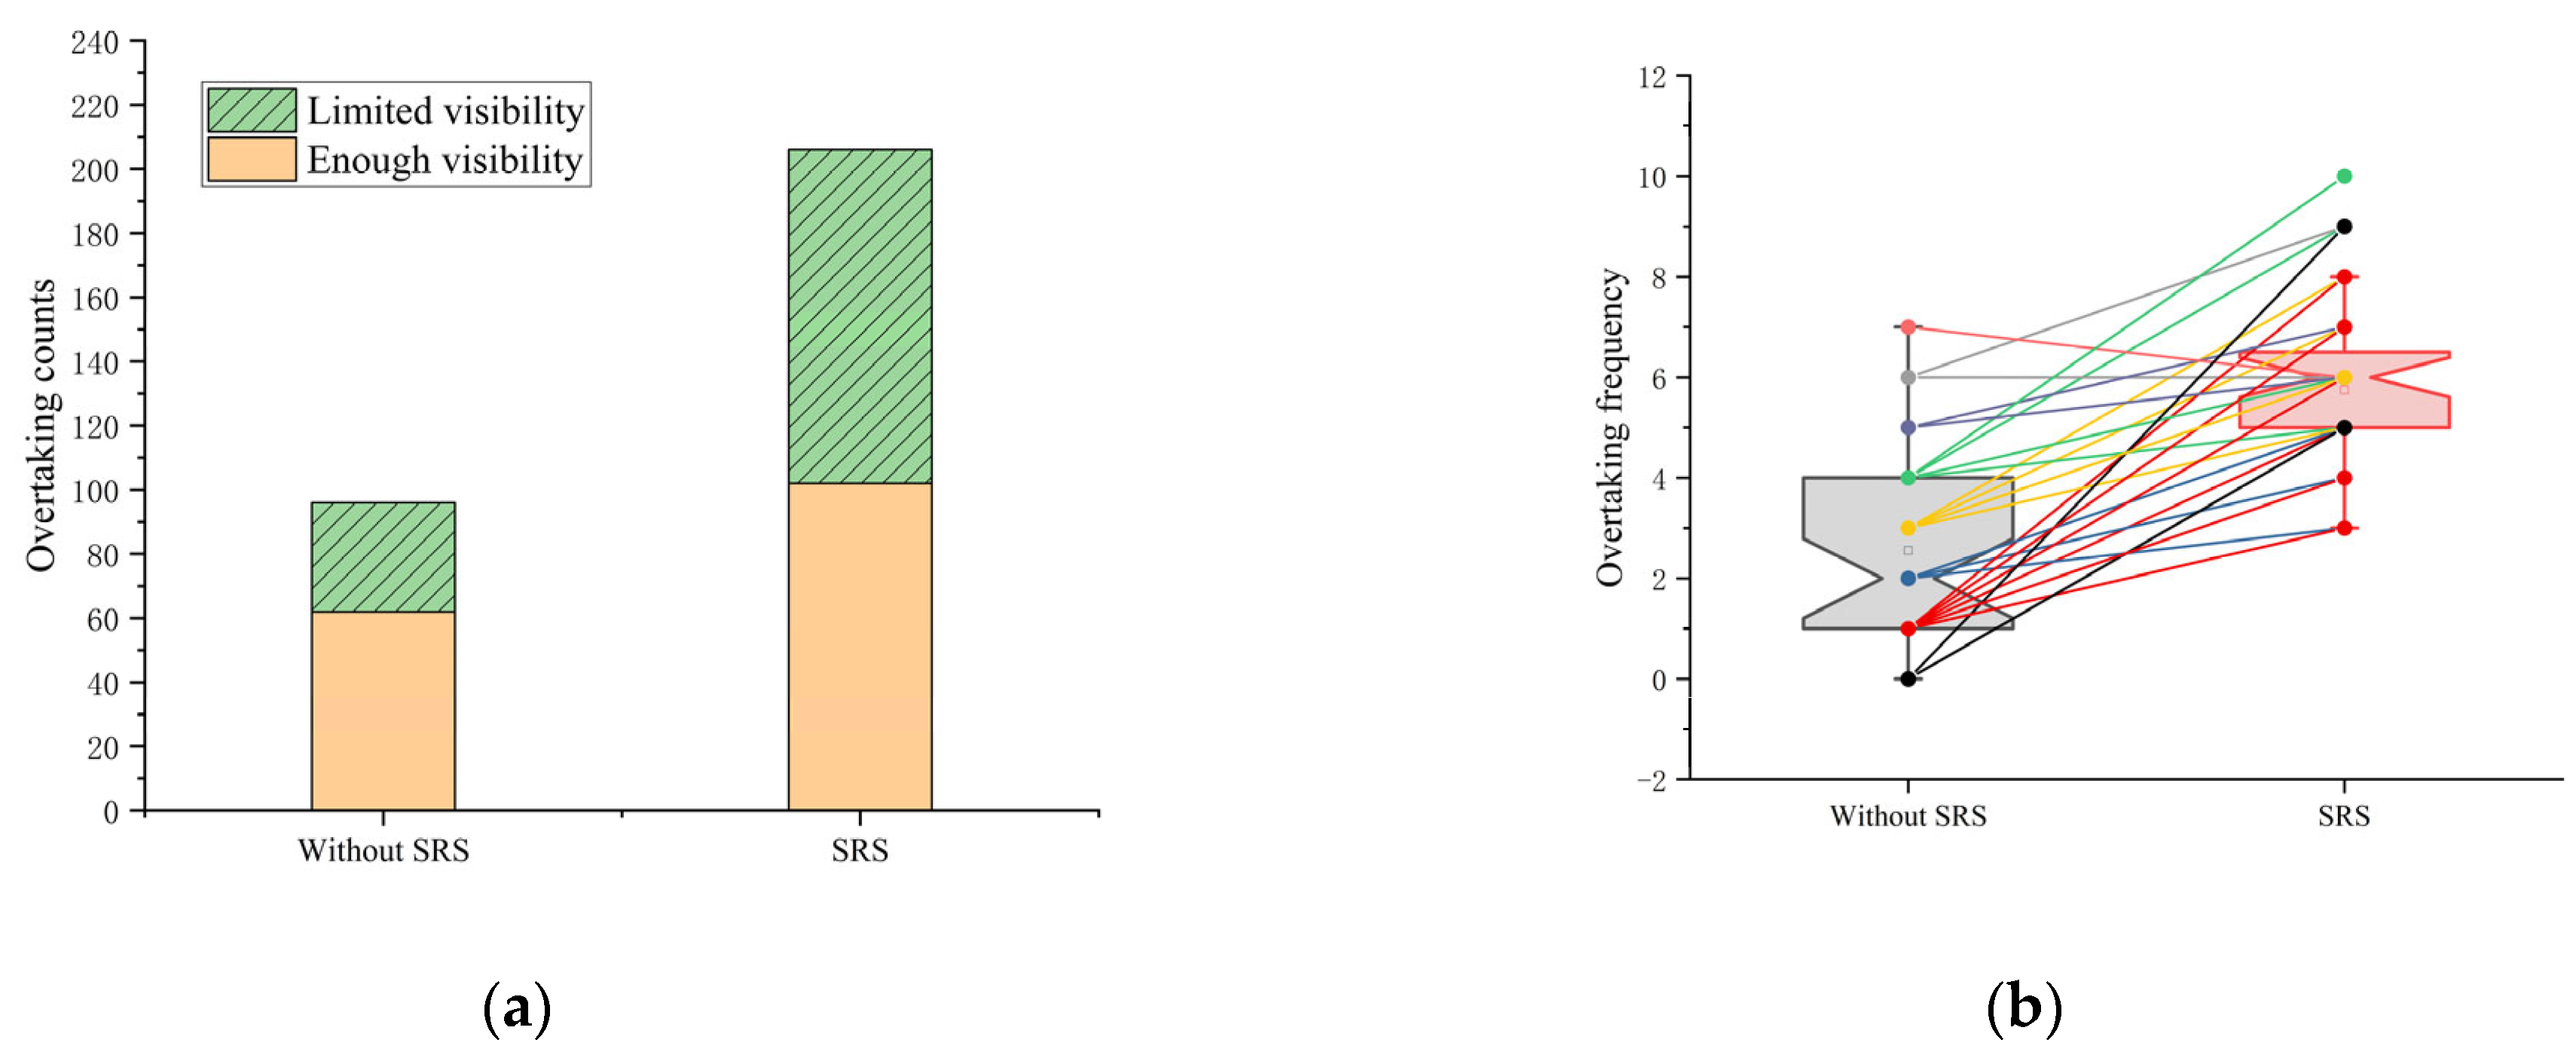
The overtaking frequency, i.e., the number of overtaking maneuvers completed by the driver, is treated as one overtaking maneuver during the data processing by passing one preceding vehicle with the whole body and returning to the home lane. The number of overtaking maneuvers performed by all volunteers with and without spikes is summarized in Figure 5.
Thirty-six drivers completed a total of 302 successful overtaking maneuvers in 72 driving experiments, 8.38 times per capita. The total number of overtaking behaviors in the no-nails scenario was 96, compared to 206 in the with-nails scenario, an increase of 114.58% compared to the no-nails scenario. The overtaking behavior in which the starting point or the end point of overtaking is in the curved road section is defined as overtaking in the case of poor sight distance, in which 34 overtaking behaviors were performed in the scenario without spikes, while 104 overtaking behaviors were performed in the scenario with spikes. The significance test of the difference (paired-samples t-test) shows that the difference in over-all overtake frequency and overtake frequency with limited visibility between the two scenarios is significant (p > 0.01). It can be seen that drivers overtake more frequently in the studded environment and tend to overtake more at poor sight distance than in the normal scenario. This is because smart spikes provide drivers with out-of-sight distance traffic information in poor sight distance sections, effectively helping drivers to overtake more often while ensuring safety.
It is also evident that for the individual driver, the number of overtaking times for most drivers has increased significantly. The median number of overtaking times with and without studding was 3, while the median number of overtaking times with studding was 6, indicating that studding effectively increased the frequency of overtaking. At the same time, most of the overtaking frequencies of the drivers with the guidance of road studs were concentrated between 5 and 7 times, compared with the frequency of 1–5 times in the general scenario; the distribution of the overtaking frequency of drivers with the guidance of road studs was more concentrated.

4.1.2. Driving Characteristics

The driver needs to accelerate the vehicle longitudinally and laterally to overtake the preceding vehicle in the overtaking process, which involves dynamic changes in velocity, acceleration, and relative position between the participating vehicles, so several trajectory-related overtaking behavior variables need to be extracted to describe the characteristics of the driver’s overtaking behavior.
Combined with the literature related to overtaking behavior, the relevant variables with more significant effects in the overtaking process include the overtaking duration, overtaking distance, the distance and speed difference between the starting moment of overtaking and the vehicle in front and the opposite direction, the distance between the ending moment of overtaking and the vehicle being overtaken, the maximum lateral acceleration of the entering the opposite lane, the maximum lateral acceleration of the lane merging, and other indicators, as well as the following time experienced before overtaking.
These indicators can be further classified as driver operation-related variables in the overtaking process, i.e., the driving behavior taken by the driver in the overtaking process such as the steering wheel steering amplitude, which is reflected in the vehicle, i.e., the lateral and longitudinal acceleration of the vehicle, etc.; and overtaking decision-related variables, i.e., those affecting the driver’s choice of overtaking behavior at the beginning moment of overtaking, such as the relative position of the vehicle, vehicle speed, etc.
The driver operation-related variables adopted in this paper for the overtaking process include the average longitudinal acceleration, peak lateral acceleration when entering the opposite lane (Peak lateral acceleration1), peak lateral acceleration in the lane merging (Peak lateral acceleration2), and overtaking distance during the overtaking process. The corresponding statistical results of the 302 overtaking behaviors in the simulated driving experiment are shown in Table 2. Since these variables did not all pass the normal distribution test hypothesis, the Wilcoxon signed rank test as a nonparametric test was used to compare the differences in driver behavior with and without lane spike scenarios.
According to the results of the Wilcoxon test for the variables related to driver operation during overtaking, it can be seen that there is no significant difference in any of the variables related to driver operation in the process of overtaking guided by the road stud system. It means that the road studs will not affect the normal operation of the driver in the process of guiding the driver and will not increase the load of the driver in the process of overtaking operations.
Therefore, the behavior related to driver operation in the road-stud-guided environment in the later simulation procedure remains the same as that in the normal environment.

4.1.3. Overtaking Decision Characteristics

According to related studies, drivers decide whether to perform overtaking behavior by considering several microscopic traffic characteristics when an overtaking opportunity arises. In this paper, five characteristics, including the speed of the vehicle, the speed difference between the vehicle in front and the oncoming vehicle in the opposite direction relative to the vehicle, the headway of the vehicle in front, and the gap between the overtaking vehicles in the opposite direction, were selected for statistics and analysis of the moment of the overtaking opportunity. In the driving simulation experiment, 36 drivers experienced a total of 1078 overtaking opportunities, 28.01% of which were grasped and implemented by the drivers. Among the overtaking behaviors performed, the percentage of no oncoming traffic in the field of view was 30.71%.
The descriptive statistics of the variables of interest during the execution of the overtaking behavior are shown in Table 3:
According to Table 3, only one of the variables related to drivers’ overtaking decisions was significantly different at the p < 0.05 level for the overtaking gap. The smaller mean value of the overtaking gap when performing overtaking in the smart-road-stud-guided scenario indicates that drivers tend to perform overtaking under the smart-road-stud-guided scenario with a shorter distance between oncoming vehicles, which can increase the frequency of overtaking on the roadway, which is consistent with the overtaking frequency statistics. The standard deviation of the overtaking gap at the place where drivers choose to overtake in the smart road studding scenario is significantly lower, which on the one hand indicates that smart road studs can make drivers’ overtaking behavior more regular; on the other hand, it indicates that drivers in the smart road studding environment are more sensitive to the headway spacing of oncoming vehicles and have a higher probability to choose to overtake in the case of suitable spacing.
In summary, the studded environment has a significant impact on drivers’ overtaking decisions, and the drivers’ lane change decisions in the studded and normal environments should be modeled separately.

4.1.4. Tree Augmented Naive Bayes

The microscopic traffic features of the vehicle at the moment of passing a vehicle in the opposite lane in the driving simulation experiment were extracted as the dataset of the TAN network. This dataset contains, among others, 1191 overtaking opportunities, and the data sets with and without the SRS environments were divided into a training set and a test set according to 8:2, respectively, to train the network. The TAN model achieved accuracies of 88.10% and 90.45% in the test set for the without and with spikes scenarios, respectively.
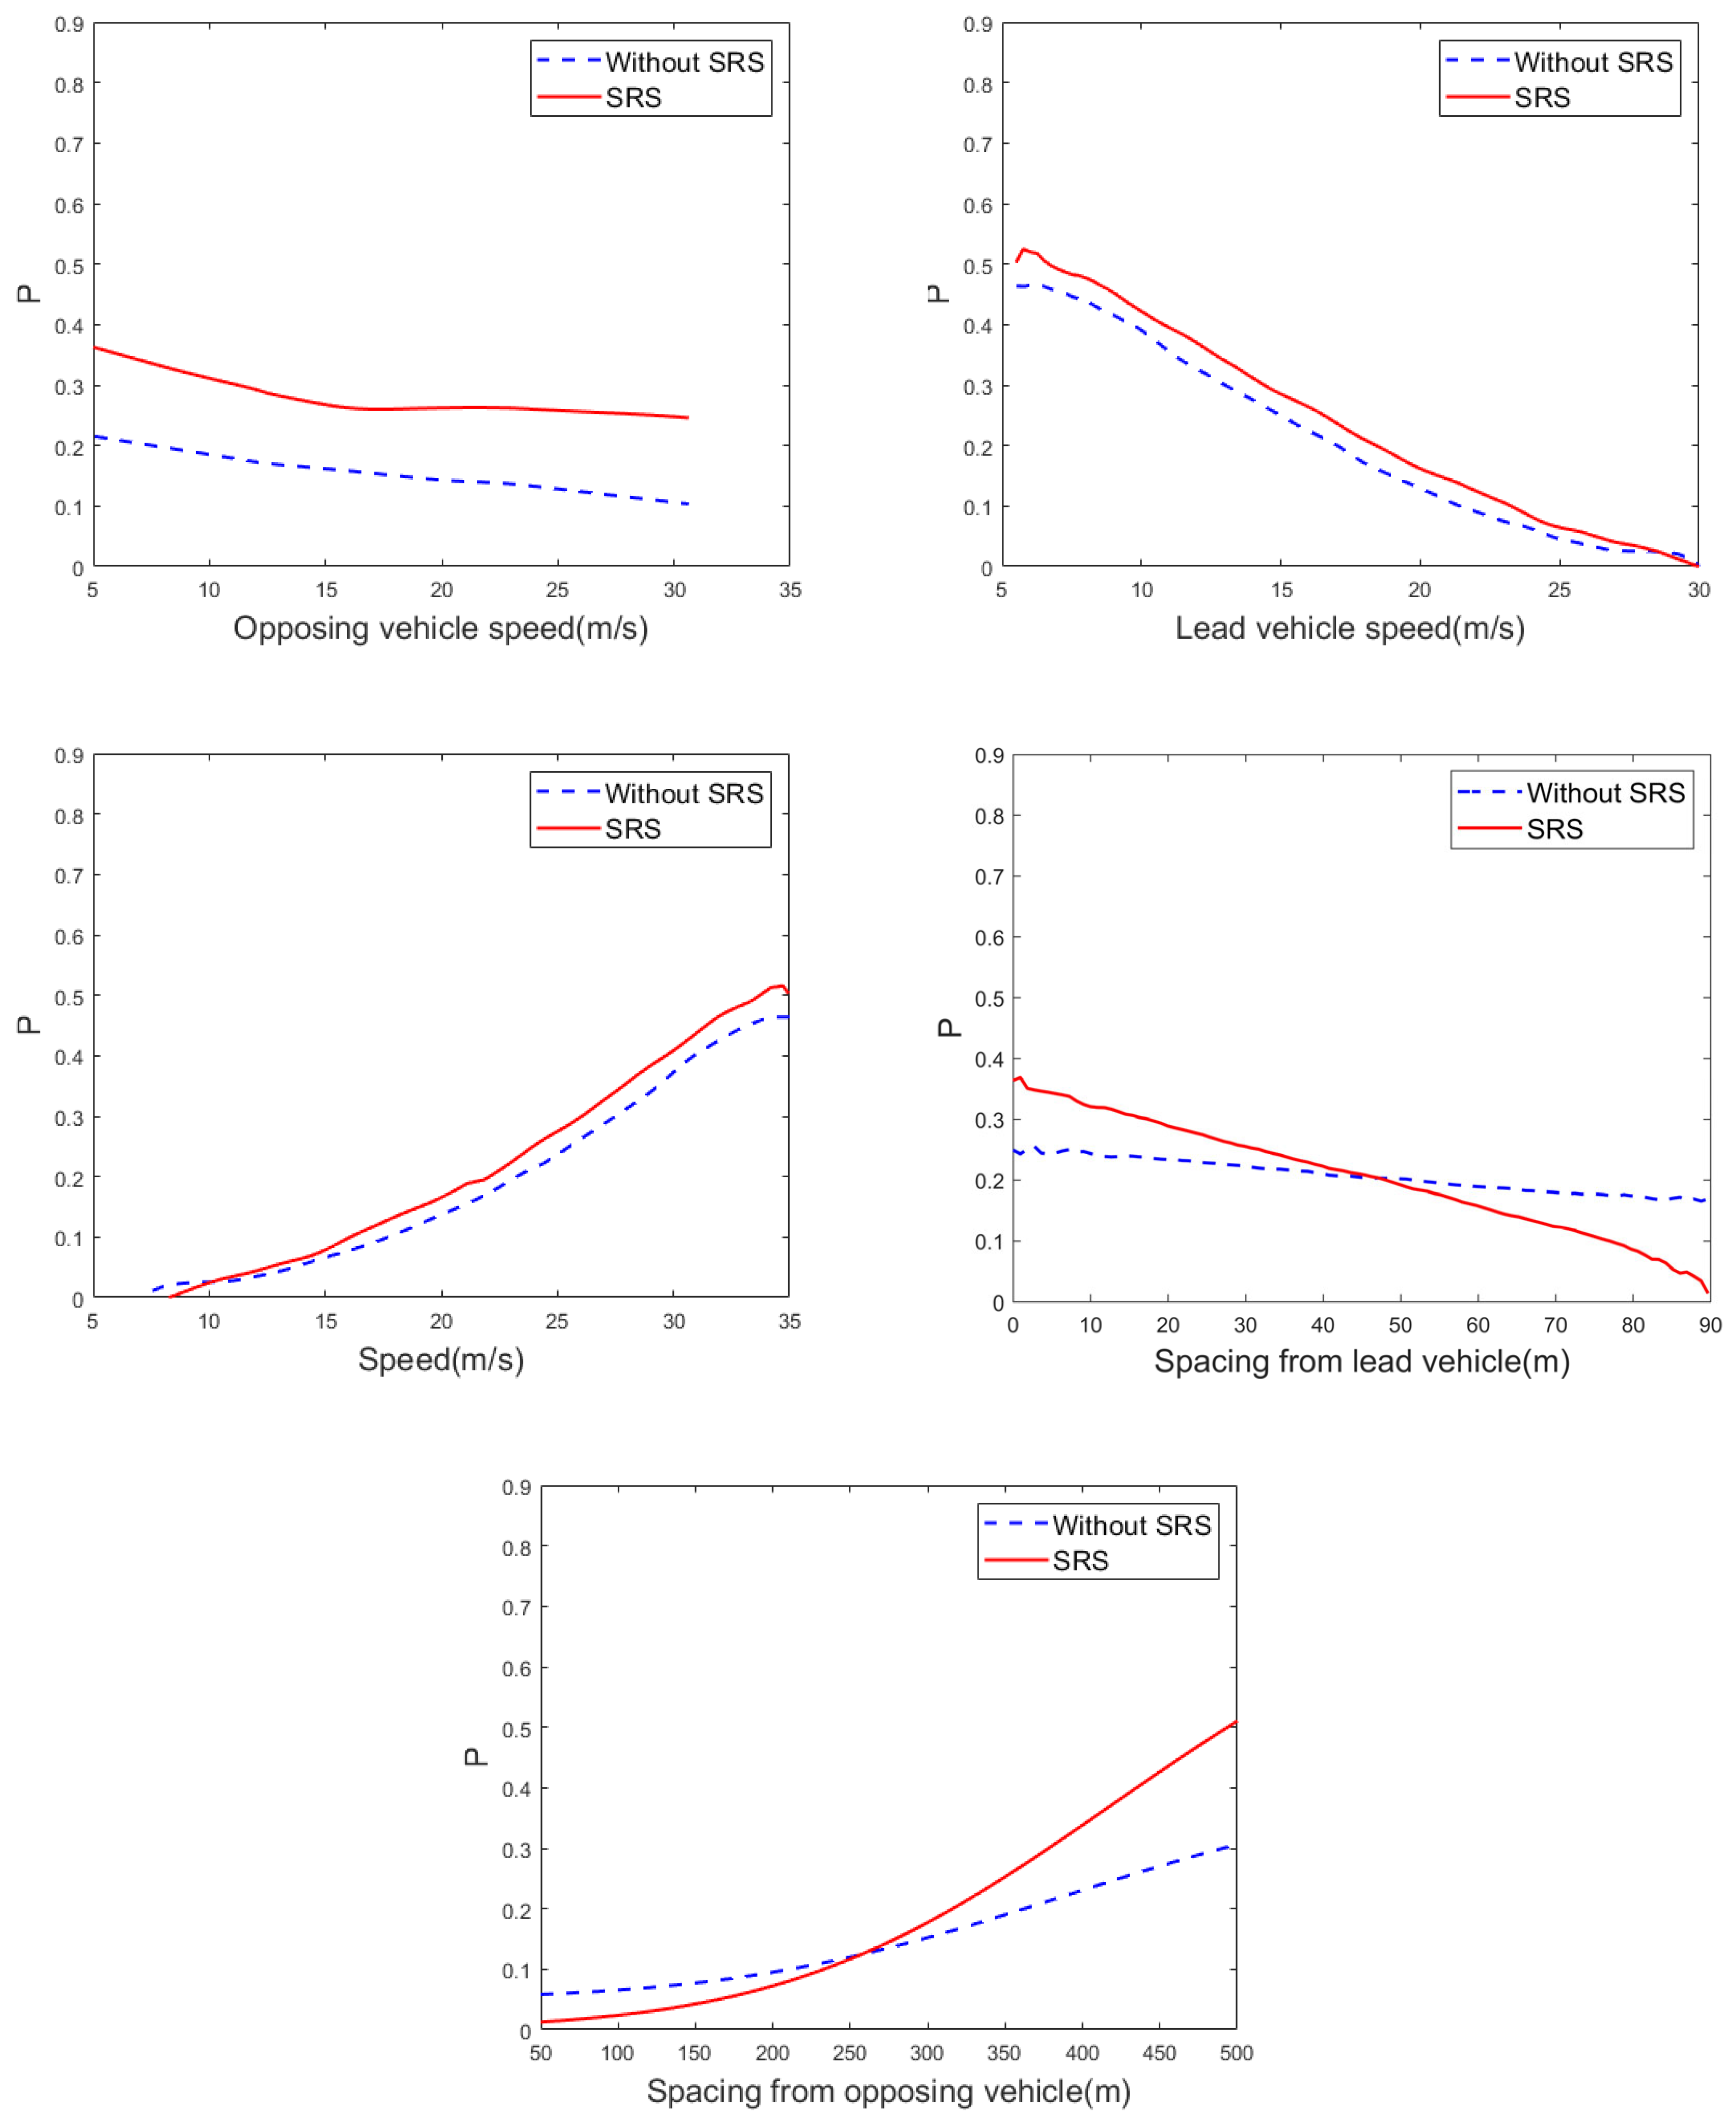
Figure 6 depicts the relationship between the overtaking probability P(Overtake) and the operation-related variables.
Figure 6 illustrates that as the speed of oncoming traffic increases, the probability of drivers electing to overtake gradually decreases. The effect of road studs on this decrease is nuanced: when the oncoming traffic’s speed is less than 60 km/h, drivers’ probability of overtaking decreases in both scenarios—with and without road studs. However, after the speed of oncoming traffic surpasses 60 km/h, the overtaking probability of drivers in the road studs scenario remains relatively stable, while a mild decline is observed in the absence of road studs. This suggests that drivers are more inclined to execute an overtaking maneuver when oncoming vehicles are moving slower, and road studs can assist drivers in seizing more overtaking opportunities in such low-speed circumstances.
In terms of the lead vehicle speed, the faster the driver is moving relative to the car ahead, the higher the likelihood of the driver opting for an overtaking maneuver. This stems from the fact that a larger speed differential with the vehicle ahead signifies more impedance to the driver’s progress, enhancing their desire to overtake and consequently leading to a higher overtaking probability. It is worth noting that there is a significant decrease in the probability of overtaking the lead vehicle’s speed compared to the opposing vehicle’s speed. This can be attributed to the inaccurate prediction of oncoming vehicles by drivers [36] while drivers are more sensitive to the speed of the vehicle ahead which is much more nearby.
Regarding the vehicle’s speed, the instantaneous speed at the point of the overtaking decision somewhat reflects the average vehicle speed. A higher driver’s speed implies a greater likelihood of hindrance by the vehicle in front, hence increasing the probability of an overtaking maneuver.
As for the distance to the lead vehicle, a slight decrease in the driver’s overtaking probability is observed as this distance increases. The influence of the distance to the vehicle ahead on the overtaking decision was not as significant as in other studies, possibly due to the close spacing between same-direction convoys in the driving simulation experiment. Consequently, the correlation between the driver’s overtaking decision and the distance to the vehicle ahead might not be fully exemplified in the training set.
Concerning the spacing of the oncoming vehicle in the opposite direction (i.e., the overtaking gap), the driver’s overtaking probability markedly rises as this gap enlarges. Notable differences are observed in the overtaking decisions of drivers with and without studs: compared to drivers guided by studs, those in the regular scenario without studs tend to overtake more when the distance between oncoming vehicles is small. However, when this distance exceeds 240 m, drivers with studs are more likely to choose overtaking than those without studs. Thus, the overtaking probability in the absence of studs is higher than that with studs.

4.2. Microscopic Simulation Results

4.2.1. Effects of the Rate of Trucks

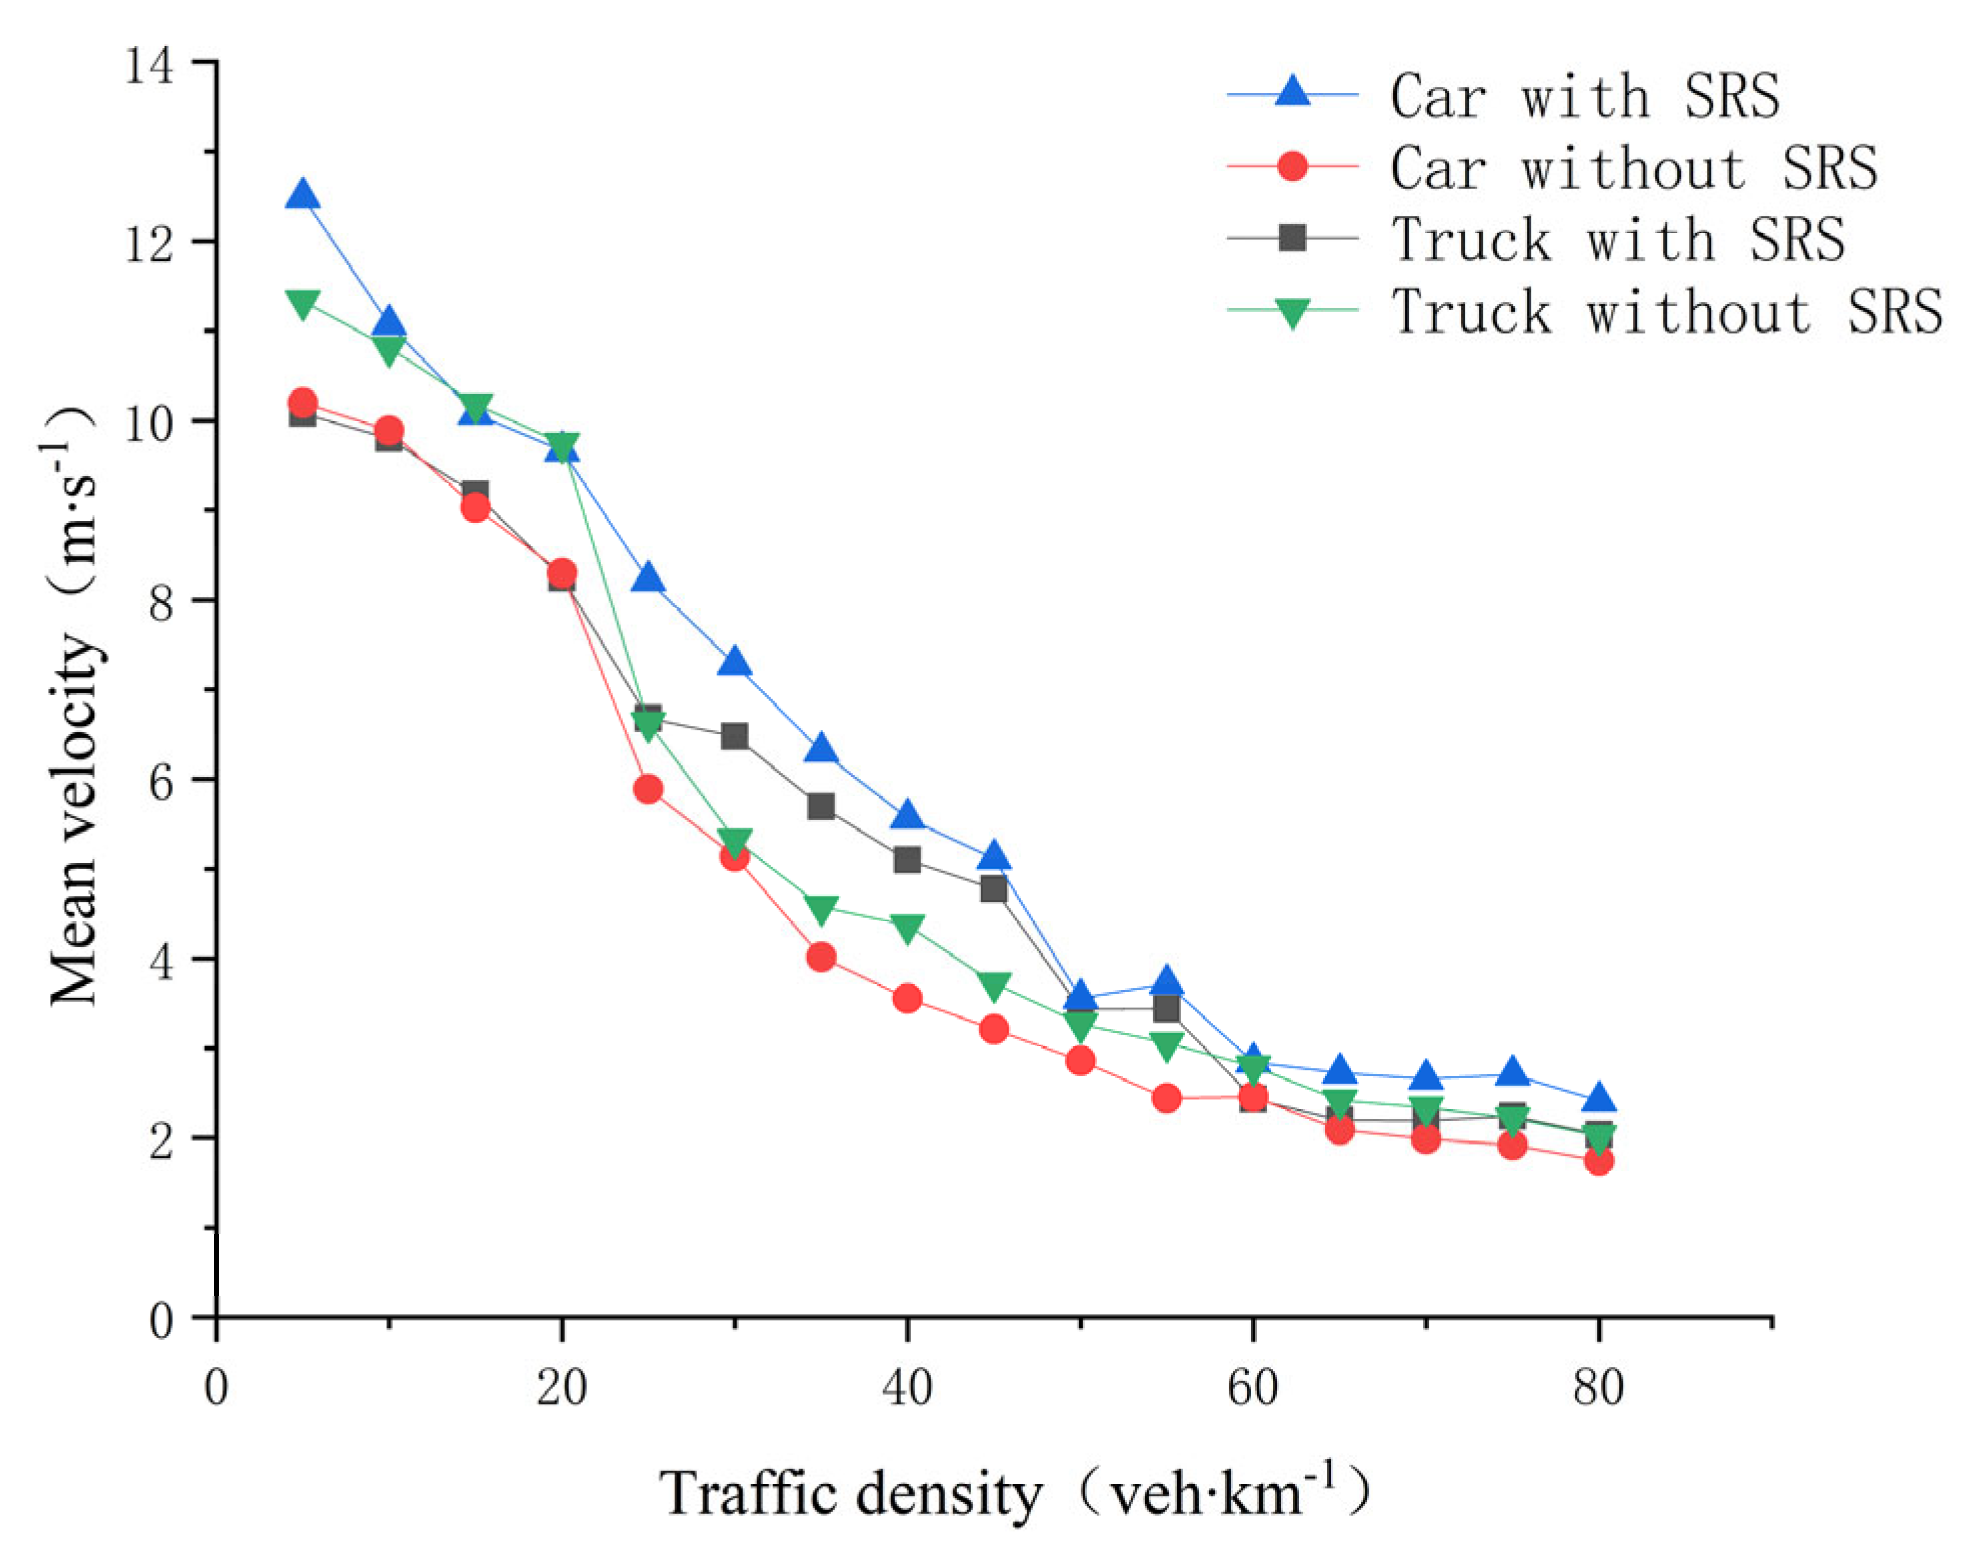
In a two-way two-lane traffic flow, the speed characteristics of small and large vehicles can be very different. Figure 7 shows the speed-density comparison of drivers of different vehicle types under the simulation experiment based on the field data with a truck mixing rate of 10% and the proportion of no-overtaking zone of 70%.
Under the free flow of 5 veh·km−1~20 veh·km−1, the speed characteristics of the traffic are mainly determined by the vehicle type; when the road usage rate is not high, the distance between vehicles is large enough in the overtaking gap, and the small cars with strong motor performance can lend a hand to maintain a faster running speed by overtaking without the constraints of trucks.
With the initial traffic density in the range of 20 veh·km−1~60 veh·km−1 increasing, the flow rate reaches the maximum critical flow and then drops abruptly. When the vehicle operating characteristics are separated according to the system with or without road studs, the average speed of the vehicle under the visual induction of road studs is slower than that driven by the driver alone, which is mainly due to the fact that intelligent road studs can help the faster small vehicles to overtake more to reduce the negative impact of slower trucks. As a result, traffic efficiency is significantly improved. Full manual driving requires a longer range of visual information to ensure the safety of traffic, resulting in reduced traffic efficiency.
In the high-density two-lane traffic flow, the small workshop distance leads to a reduction in the number of vehicles satisfying the lane change criteria to overtake and the overall traffic flow operation is constrained by the slow traffic.
Figure 8 presents the degree of traffic enhancement for heterogeneous traffic flows with varying truck ratios, comparing the manual driving heterogeneous traffic flow with that with the SRS visual guide.
An analysis of traffic improvement rates associated with smart road studs at diverse densities reveals a distinct trend contingent on increasing density across different truck mixing ratios. The traffic improvement rate peaks within the density range of 35–40 vehicles per kilometer and subsequently declines linearly beyond this optimum density, extending up to 55 vehicles per kilometer.
This trend can be attributed to the road system’s state at low densities, which hovers between free-flowing and congested states. The traffic flow demonstrates characteristics of both following and overtaking behaviors, as well as free-flowing patterns, enabling it to reach maximum traffic volume or capacity. The primary role of smart road studs is to facilitate overtaking maneuvers by smaller vehicles trailing behind trucks, enhancing road usage. Consequently, as traffic density increases, the number of vehicles that can benefit from smart road studs grows, culminating in a peak traffic improvement rate near the critical density.
Furthermore, the visual guidance system effectuates substantial traffic improvement within the high-density range of 60–80 vehicles per kilometer when the truck mixing ratio ranges from 60% to 90%. In situations of high density and high truck mixing ratio, a significant traffic bottleneck effect emerges, leading to vehicle segregation and clustering. This phenomenon slows down the traffic flow and raises the number of cars trailing trucks and awaiting overtaking opportunities. The smart road stud system facilitates overtaking maneuvers for smaller vehicles under these circumstances, thereby alleviating the bottleneck effect and bolstering traffic volumes.

4.2.2. Effects of the Rate of Road Section with Restricted Sight Distance

Early Highway Capacity Manuals (HCMs) utilized the Percent Time-spent-following (PTSF) metric—the ratio of vehicle time spent trailing another vehicle to total travel time—to assess road service quality for two-lane roads. However, its efficacy and precision have been questioned. In the revised HCM, the proportion of trailing drivers, defined as the ratio of drivers in following mode when traversing a road segment, is employed to gauge the extent of speed reduction for faster vehicles caused by slower ones.
Figure 9 demonstrates that the ratio of drivers in the following state tends to increase with traffic density. Compared to the no-passing zone environment, the ratio of drivers in the following state under equivalent conditions is reduced with smart studs. This suggests that smart studs can alleviate the delay incurred by faster cars trailing slower ones, thereby effectively enhancing the service level on both lanes.
Upon comparison of the fitted curves representing the percentage of following drivers at 90%, 60%, and 30% of the passing zone, the maximum reduction in following drivers due to the stud system is observed to be 1.25%, 2.03%, and 7.85%, respectively. The performance of the stud system in a 30% passing zone surpasses the other two scenarios. This is likely because poor sight distance road sections, which occupy a high proportion, provide less room for overtaking maneuvers, consequently reducing the probability of drivers overtaking under ordinary circumstances. Conversely, the propensity for drivers to choose to overtake on poor sight distance roads, such as curves, substantially increases under the road stud system.

4.2.3. Smart Road Studs’ Effect on Traffic Conflict

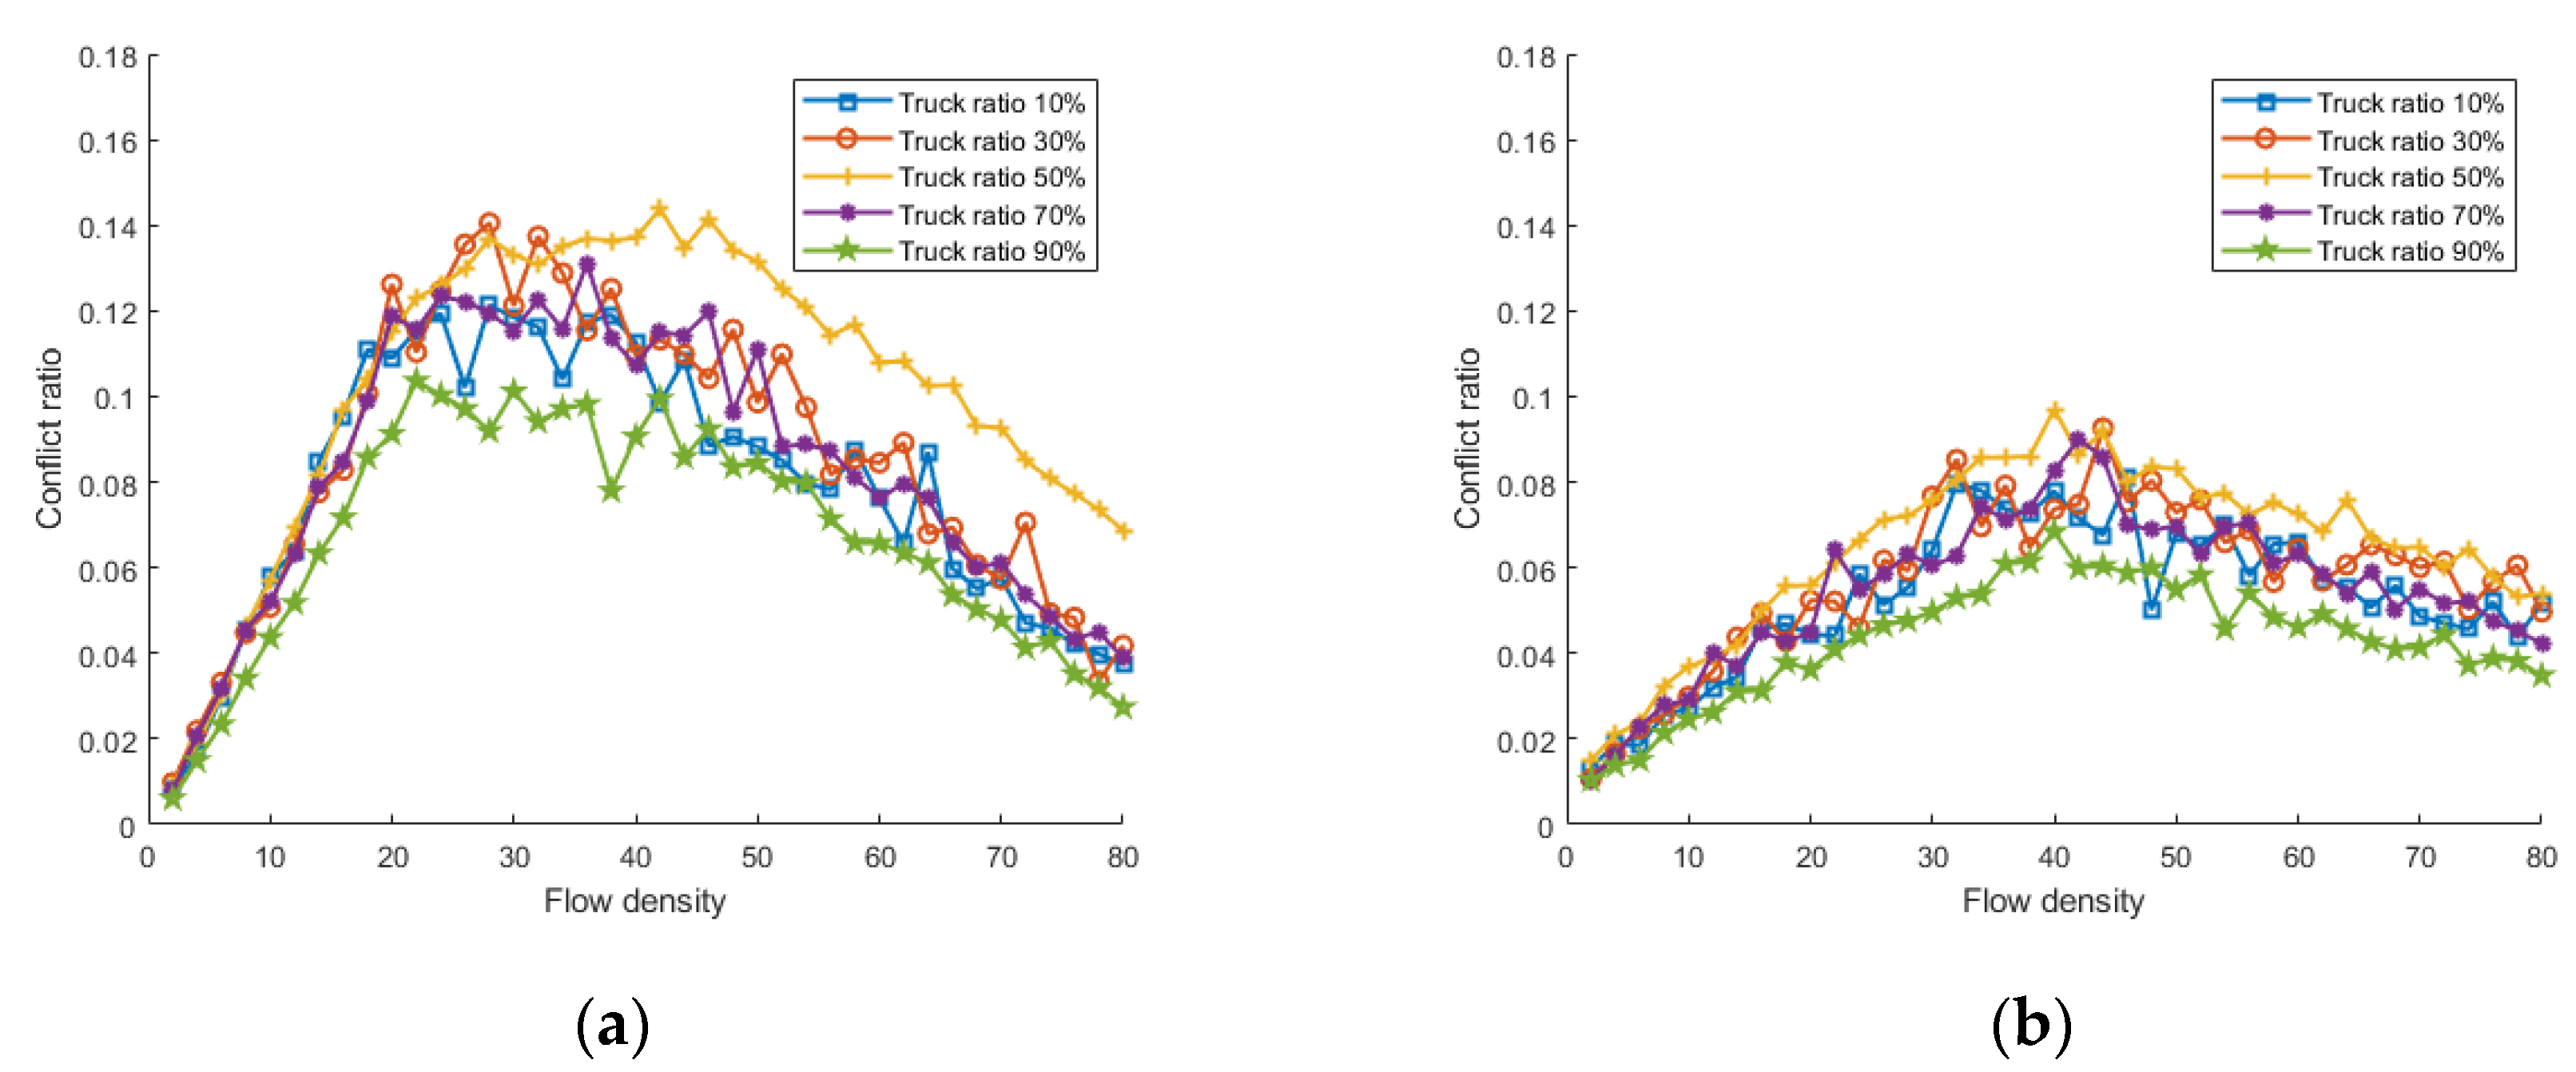
As depicted in Figure 10, a correlation between the traffic conflict rate and both traffic density and truck occupancy ratio can be discerned under equivalent road conditions.
At a constant truck occupancy level, the traffic conflict rate tends to rise gradually with increased traffic density until reaching a density of 30 vehicles per km. This is attributable to road traffic volume not yet meeting road capacity, allowing vehicles a larger reentry gap, thus escalating the number of traffic conflicts as vehicle interactions increase. Between densities of 30–50 vehicles per km, the traffic conflict rate appears to stabilize. However, when traffic density continues to rise, the traffic conflict rate correspondingly diminishes. This reduction is due to traffic flow reaching a saturation or congestion state, where increased vehicle numbers prohibit overtaking due to the lack of a sufficient reentry gap. Moreover, vehicle speed also significantly reduces due to increased vehicular interaction. As the opportunity for overtaking decreases, the number of traffic conflicts similarly falls, leading to a decreased traffic conflict rate.
The traffic conflict rate in the SRS road environment is noticeably lower than it is in the normal environment. This is a consequence of the intelligent stud system recommending overtaking only when adequate reentry space exists. This is evident in the overtaking decision model, where the likelihood of drivers opting to overtake when the oncoming lane’s distance is small is significantly reduced compared to a normal environment. This suggests that drivers in a typical environment are more prone to risky overtaking maneuvers without meeting safety prerequisites.
In conclusion, the smart stud system effectively minimizes the likelihood of drivers choosing high-risk overtaking behaviors, thereby enhancing road safety.

5. Conclusions

This paper aimed to study the influence of a smart road stud sensor system on drivers’ driving behavior in rural two-lane two-way roads under different traffic conditions and its effect on traffic flow and safety, using a combined simulation approach with a driving simulator and traffic microsimulation.
The experiment results show that smart road studs can improve the success rate of vehicle lane change in the road environment with a mixed flow of small cars and trucks, thus improving the roadway capacity. And the results also have reference significance for other traffic light guidance systems alike. Simulation results show that, with the increase in truck mixing rate, the lane capacity will be significantly reduced, but the intelligent road stud warning system can well mitigate this trend; at the same time, the intelligent road studs in 20 veh·km−1~60 veh·km−1 traffic density contribute about 10% of the traffic improvement rate while reducing the traffic conflict rate.
However, this paper also has some limitations. The driving simulation experiments in this study focus more on reflecting the driver’s response characteristics when faced with light guidance, rather than proposing an intelligent overtaking strategy. In the future, we will consider introducing more intelligent overtaking strategies such as overtaking multiple vehicles in front [37].
This paper demonstrates that SRS or light guidance systems alike can improve traffic flow operation by influencing drivers’ overtaking choices. The results show that the smart road stud system can make better use of road access resources under the premise of ensuring safety, which shows a possible way to decrease traffic accidents and contribute to sustainable transportation development.

Author Contributions

Conceptualization, M.L.; methodology, M.L.; software, Q.L.; validation, Q.L. and M.L.; formal analysis, M.L. and Q.L.; data curation, Q.L.; writing—original draft preparation, Q.L. and M.L.; writing—review and editing, J.F., Q.N., M.L. and Q.L. All authors have read and agreed to the published version of the manuscript.

Funding

This research was funded by the CHANGSHA MUNICIPAL NATURAL SCIENCE FOUNDATION, grant number kq2208282.

Institutional Review Board Statement

Not applicable.

Informed Consent Statement

Not applicable.

Data Availability Statement

Not applicable.

Conflicts of Interest

On behalf of all authors, the corresponding author states that there are no conflicts of interest.

References

  1. Ou, H.; Tang, T.Q. Impacts of Moving Bottlenecks on Traffic Flow. Phys. A Stat. Mech. Its Appl. 2018, 500, 131–138. [Google Scholar] [CrossRef]
  2. Mao, G.; Hui, Y.; Ren, X.; Li, C.; Shao, Y. The Internet of Things for Smart Roads: A Road Map from Present to Future Road Infrastructure. IEEE Intell. Transp. Syst. Mag. 2022, 14, 66–76. [Google Scholar] [CrossRef]
  3. Le Roux, J.H.; Barnard, A.; Booysen, M.J. Remotely controllable wireless road stud network. In Proceedings of the 16th International IEEE Conference on Intelligent Transportation Systems (ITSC), The Hague, The Netherlands, 6–9 October 2013; pp. 762–766. [Google Scholar]
  4. Shahar, A.; Brémond, R. Toward Smart Active Road Studs for Lane Delineation. In Proceedings of the TRA2014—Transport Research Arena: Transport Solutions: From Research to Deployment-Innovate Mobility, Mobilise Innovation! Paris, France, 14–17 April 2014. [Google Scholar]
  5. Reed, N. Driver Behaviour in Response to Actively Illuminated Road Studs: A Simulator Study; Project Report 143; Transport Research Laboratory: Crowthorne, UK, 2006. [Google Scholar]
  6. Villa, C.; Bremond, R.; Saint Jacques, E. Visibility and Discomfort Glare of LED Road Studs. Light. Res. Technol. 2015, 47, 945–963. [Google Scholar] [CrossRef]
  7. Samardzija, D.; Kovac, E.; Isailovic, D.; Miladinovic, B.; Katona, M. Road Nail: Intelligent Road Marking System Testbed. In Proceedings of the Second IEEE Vehicular Networking Conference, VVNC 2010, Jersey City, NJ, USA, 13–15 December 2010. [Google Scholar]
  8. Wang, H.; Sun, Y.; Quan, W.; Ma, X.; Ochieng, W.Y. Traffic Volume Measurement Based on a Single Smart Road Stud. Measurement 2022, 187, 110150. [Google Scholar] [CrossRef]
  9. Tao, Z.; Quan, W.; Wang, H. Innovative Smart Road Stud Sensor Network Development for Real-Time Traffic Monitoring. J. Adv. Transp. 2022, 2022, 8830276. [Google Scholar] [CrossRef]
  10. Lobjois, R.; Faure, V.; Désiré, L.; Benguigui, N. Behavioral and Workload Measures in Real and Simulated Driving: Do they Tell Us the Same Thing About the Validity of Driving Simulation? Saf. Sci. 2021, 134, 105046. [Google Scholar] [CrossRef]
  11. Toledo, T.; Koutsopoulos, H.N.; Ahmed, K.I. Estimation of Vehicle Trajectories with Locally Weighted Regression. Transp. Res. Rec. 2007, 1999, 161–169. [Google Scholar] [CrossRef] [Green Version]
  12. Li, D.; Pan, H. Two-Lane Two-Way Overtaking Decision Model with Driving Style Awareness Based on a Game-Theoretic Framework. Transp. A Transp. Sci. 2022, 19, 2076755. [Google Scholar] [CrossRef]
  13. Balal, E.; Cheu, R.L.; Sarkodie-Gyan, T. A Binary Decision Model for Discretionary Lane Changing Move Based on Fuzzy Inference System. Transp. Res. Part C-Emerg. Technol. 2016, 67, 47–61. [Google Scholar] [CrossRef]
  14. Xie, D.-F.; Fang, Z.-Z.; Jia, B.; He, Z. A Data-Driven Lane-Changing Model Based on Deep Learning. Transp. Res. Part C Emerg. Technol. 2019, 106, 41–60. [Google Scholar] [CrossRef]
  15. Vlahogianni, E.I.; Golias, J.C. Bayesian Modeling of the Microscopic Traffic Characteristics of Overtaking in Two-Lane Highways. Transp. Res. Part F Traffic Psychol. Behav. 2012, 15, 348–357. [Google Scholar] [CrossRef]
  16. Zhao, J.; Knoop, V.L.; Wang, M. Microscopic Traffic Modeling Inside Intersections: Interactions Between Drivers. Transp. Sci. 2022, 57, 135–155. [Google Scholar] [CrossRef]
  17. Zhao, J.; Knoop, V.L.; Sun, J.; Ma, Z.; Wang, M. Unprotected Left-Turn Behavior Model Capturing Path Variations at Intersections. In Proceedings of the 26th IEEE International Conference on Intelligent Transportation Systems (ITSC 2023), Bilbao, Spain, 24–28 September 2023. [Google Scholar]
  18. Kanagaraj, V.; Treiber, M. Self-Driven Particle Model for Mixed Traffic and Other Disordered Flows. Phys. A Stat. Mech. Its Appl. 2018, 509, 1–11. [Google Scholar] [CrossRef] [Green Version]
  19. Chao, Q.; Liu, P.; Han, Y.; Lin, Y.; Li, C.; Miao, Q.; Jin, X. A Calibrated Force-Based Model for Mixed Traffic Simulation. IEEE Trans. Vis. Comput. Graph 2021, 29, 1664–1677. [Google Scholar] [CrossRef]
  20. Helbing, D.; Molnar, P. Social Force Model for Pedestrian Dynamics. Phys. Rev. E 1995, 51, 4282–4286. [Google Scholar] [CrossRef] [PubMed] [Green Version]
  21. Anvari, B.; Bell, M.G.H.; Sivakumar, A.; Ochieng, W.Y. Modelling Shared Space Users via Rule-Based Social Force Model. Transp. Res. Part C Emerg. Technol. 2015, 51, 83–103. [Google Scholar] [CrossRef] [Green Version]
  22. Yang, D.; Zhou, X.; Su, G.; Liu, S. Model and Simulation of the Heterogeneous Traffic Flow of the Urban Signalized Intersection with an Island Work Zone. IEEE Trans. Intell. Transp. Syst. 2019, 20, 1719–1727. [Google Scholar] [CrossRef]
  23. Delpiano, R.; Herrera, J.C.; Laval, J.; Coeymans, J.E. A Two-Dimensional Car-Following Model for Two-Dimensional Traffic Flow Problems. Transp. Res. Part C Emerg. Technol. 2020, 114, 504–516. [Google Scholar] [CrossRef]
  24. Zhao, Y.X.; Zhang, H.M. A Unified Follow-the-Leader Model for Vehicle, Bicycle and Pedestrian Traffic. Transp. Res. Part B Methodol. 2017, 105, 315–327. [Google Scholar] [CrossRef]
  25. Johora, F.T.; Yang, D.; Muller, J.P.; Ozguner, U. On the Generalizability of Motion Models for Road Users in Heterogeneous Shared Traffic Spaces. IEEE Trans. Intell. Transp. Syst. 2022, 23, 23084–23098. [Google Scholar] [CrossRef]
  26. Yoon, D.D.; Ayalew, B. Social Force Aggregation Control for Autonomous Driving with Connected Preview. In Proceedings of the 2019 American Control Conference (ACC), Philadelphia, PA, USA, 10–12 July 2019; pp. 1388–1393. [Google Scholar]
  27. Asaithambi, G.; Shravani, G. Overtaking Behaviour of Vehicles on Undivided Roads under Mixed Traffic Conditions. In Proceedings of the 20th International Conference of Hong Kong Society for Transportation Studies, Hong Kong, China, 12–14 December 2015. [Google Scholar]
  28. Hegeman, G.; Brookhuis, K.; Hoogendoorn, S. Opportunities of Advanced Driver Assistance Systems towards Overtaking. Eur. J. Transp. Infrastruct. Res. 2005, 5. [Google Scholar] [CrossRef]
  29. Castillo, E.; Menéndez, J.M.; Sánchez-Cambronero, S. Predicting Traffic Flow Using Bayesian Networks. Transp. Res. Part B Methodol. 2008, 42, 482–509. [Google Scholar]
  30. Vlahogianni, E.I.; Webber Jr, C.L.; Geroliminis, N.; Skabardonis, A. Statistical Characteristics of Transitional Queue Conditions in Signalized Arterials. Transp. Res. Part C Emerg. Technol. 2007, 15, 392–403. [Google Scholar] [CrossRef]
  31. Sun, J.; Liu, H.; Ma, Z. Modelling and Simulation of Highly Mixed Traffic Flow on Two-Lane Two-Way Urban Streets. Simul. Model. Pract. Theory 2019, 95, 16–35. [Google Scholar] [CrossRef]
  32. Qi, D.; Soffker, D. In Improved Driving Behaviors Prediction Based on Fuzzy Logic-Hidden Markov Model (FL-HMM). In Proceedings of the 2018 IEEE Intelligent Vehicles Symposium (IV), Changshu, China, 26–30 June 2018; pp. 2003–2008. [Google Scholar]
  33. Wang, J.F.; Chen, Y.; Dong, Z.K.; Gao, M.Y. Improved YOLOv5 Network for Real-Time Multi-Scale Traffic Sign Detection. Neural Comput. Appl. 2023, 35, 7853–7865. [Google Scholar] [CrossRef]
  34. Brockfeld, E.; Kuehne, R.D.; Wagner, P. Calibration and Validation of Microscopic Models of Traffic Flow. Transp. Res. Rec. J. Transp. Res. Board 2005, 1934, 179–187. [Google Scholar] [CrossRef]
  35. Jin, C.-J.; Knoop, V.L.; Jiang, R.; Wang, W.; Wang, H. Calibration and Validation of Cellular Automaton Traffic Flow Model with Empirical and Experimental Data. IET Intell. Transp. Syst. 2018, 12, 359–365. [Google Scholar] [CrossRef] [Green Version]
  36. Gray, R.; Regan, D.M. Perceptual Processes Used by Drivers during Overtaking in a Driving Simulator. Hum. Factors 2005, 47, 394–417. [Google Scholar] [CrossRef]
  37. Chen, J.; Bhat, M.; Jiang, S.; Zhao, D. Advanced Driver Assistance Strategies for a Single-Vehicle Overtaking a Platoon on the Two-Lane Two-Way Road. IEEE Access 2020, 8, 77285–77297. [Google Scholar] [CrossRef]
Figure 1. The smart road stud system and overtaking maneuver guide.
Sustainability 15 11559 g001
Figure 2. Driving simulation scene.
Sustainability 15 11559 g002
Figure 3. Driving simulation screenshot in Prescan.
Sustainability 15 11559 g003
Figure 4. Finite states machine.
Sustainability 15 11559 g004
Figure 5. Overtaking frequency. (a) Overtaking counts; (b) Increase in the counts of overtaking.
Sustainability 15 11559 g005
Figure 6. Graphical representation of the relationship between the probability P(Overtake) of successful overtake and the operation-related variables.
Sustainability 15 11559 g006
Figure 7. Velocity-density graph of different types of vehicles.
Sustainability 15 11559 g007
Figure 8. Traffic volume enhancement with different truck ratios.
Sustainability 15 11559 g008
Figure 9. Percent of followers at different passing zone ratios. Red represents using SRS, while blue represents without SRS (a) 90% passing zone; (b) 60% passing zone; (c) 30% passing zone.
Sustainability 15 11559 g009
Figure 10. Traffic conflict ratio. (a) Without SRS; (b) SRS.
Sustainability 15 11559 g010
Table 1. Calibrated or observed parameter values.
ParameterTruckCar
τ 1.471.11
A s v 4.312.25
A b o u 1 2.284.47
A b o u 2 0.761.25
A b o u 3 1.240.52
A f o l 0.921.13
A o t x 0.881.26
B s v 4.512.95
B b o u 5.332.42
v n 0 41.555.2
l 126
Table 2. Statistics of operation-related variables.
Longitudinal
Acceleration (m/s2)
Peak Lateral
Acceleration1 (m/s2)
Peak Lateral
Acceleration2 (m/s2)
Overtaking
Distance (m)
Without SRSMean1.072.332.81221.13
Standard deviation0.451.170.9958.14
With SRSMean1.082.102.97212.23
Standard deviation0.421.081.1666.33
Wilcoxon−0.27−0.81−0.14−0.09
Sig.0.7820.4160.8870.927
Table 3. Statistics of decision-related variables.
Speed
(km/h)
Lead Vehicle Speed (km/h)Opposing Vehicle Speed (km/h)Opposing Vehicle Spacing (m)Spacing (m)
Without SRSMean56.7947.3851.14305.4122.29
Standard deviation5.577.799.2367.245.63
With SRSMean57.9047.3850.80271.6827.61
Standard deviation6.888.0510.1726.8116.15
Wilcoxon−0.954−0.80219.890−0.406−3.629
Sig.0.3400.4220.8910.6850.000
Disclaimer/Publisher’s Note: The statements, opinions and data contained in all publications are solely those of the individual author(s) and contributor(s) and not of MDPI and/or the editor(s). MDPI and/or the editor(s) disclaim responsibility for any injury to people or property resulting from any ideas, methods, instructions or products referred to in the content.