Article

Sustainable Performance Assessment towards Sustainable Consumption and Production: Evidence from the Indian Dairy Industry

National Institute of Technology Patna, Patna 800005, India
*
Author to whom correspondence should be addressed.
Sustainability 2023, 15(15), 11555; https://doi.org/10.3390/su151511555
Submission received: 1 June 2023 / Revised: 17 July 2023 / Accepted: 22 July 2023 / Published: 26 July 2023
(This article belongs to the Special Issue Sustainable Supply Chain and Lean Manufacturing)

Abstract

:
The current global economic status quo is widely seen as unsustainable in the food sector. The field of sustainability science is still rather fragmented, covering a wide range of techniques and issues, despite the large number of publications in this area. Due to population growth, the food supply chain (FSC) and farmers have to produce more food. The UN estimates that one-third of edible food is wasted, producing greenhouse gases. A balance must be struck between company operations and social, environmental, and economic activities for sustainable development of the FSC. To assist FSC organizations in managing sustainable advancement, this study created a methodology for the assessment of sustainable performance. We provide a sustainable assessment system using a fuzzy analytic hierarchy process, fuzzy VIKOR, and fuzzy TOPSIS. Our research framework evaluated the sustainability of three cooperative-society-run Indian dairy firms. Our study gives environmental criteria the highest weight (0.33) and social criteria the lowest (0.16), with economic reasons (0.306) and business operations (0.204) falling in the middle. Supply chain costs, on average, are given the highest weight, and capacity utilization, the lowest weight. Three dairy industries are ranked (DPI3, DPI1, and DPI2) based on sustainable performance. By modifying the maximum set utility value and validating VIKOR results with TOPSIS, we have checked the robustness of this performance assessment tool. This research aids dairy businesses in achieving several Sustainable Development Goals, including sustainable production and consumption, through the regular assessment of their sustainable performance.

1. Introduction

The sustainable supply chain management (SSCM) literature has grown alongside the dominant discourse that economic, environmental, and social sustainability can be simultaneously achieved through practices that legitimize a win–win business case, with a focus on the potential contributions to the triple bottom line [1,2]. Sustainability agendas based on the win–win business case, according to Gaya and Phillips [3], only succeed because they adhere to the mainstream language of increasing profits rather than questioning the current paradigm [4]. For obvious reasons, the dairy supply chain has a significant global impact on CO2 emissions due to the necessity of the regular refrigeration of perishable dairy products [5]. The United Nations Sustainable Development Goals (SDGs) have ushered in a new era of global development, aiming to address urgent global challenges related to the environment, society, and economy. In response to these challenges, many industrial corporations have acknowledged the significance of the SDGs and are actively reporting on various topics aligned with these goals. These topics include water management, health and safety, working conditions, and climate change. These corporations recognize the importance of aligning their practices with the SDGs to contribute to a sustainable future. As a result, through incorporating a comprehensive triple bottom line (TBL) approach, sustainable performance assessment has become essential for tracking progress toward sustainable development. Unlike traditional performance assessment, which primarily focuses on economic aspects, sustainable performance assessment integrates all dimensions of the TBL (environmental, social, and economic) within a single framework. This broader perspective enables firms to assess their progress across environmental, social, and economic aspects. With this context in mind, the objective of this study is to develop a sustainable performance assessment framework specifically designed for the food supply chain.
Producing food often involves a network of interconnected SCs and includes several processes [6]. Decisions and management systems that impact sustainability performance are developed and implemented by SC members, particularly in the operations and marketing departments [7,8]. The manufacturing capacities of most SC members must meet sustainability credentials, which have a significant impact on green marketing [9]. Today, the management of stakeholders effectively necessitates integrating customers’ concerns about environmental and social responsibility with other dimensions of value [10,11]. Stakeholder interactions (such as supplier partnerships), logistics, and customer relationships can amplify or attenuate sustainability performance and production-related hazards, whereas process design and technology often determine the waste created and resources and energy used [10]. The monitoring of sustainable development progress is important, and it depends on many criteria and subcriteria. Hence, one important question arises, i.e., “what are the critical Indicators which is used in measure the sustainable performance of dairy industry?” Although many references in the literature have determined the critical criteria and subcriteria for performance assessment, very little work has been conducted regarding the Indian context of dairy firms that are working towards the achievement of SCP. In order to create a sustainable performance assessment framework, researchers generally use the three criteria of environmental, social, and economic sustainability; however, some researchers include another dimension, for example, circular, resilience, flexibility, and business operations. However, Kumar et al. [12] built a similar sustainability assessment framework for the agri-food supply chain and tested their framework with three dairy industries, but they utilized circular as the fourth dimension alongside the three TBL dimensions. In contrast, this study uses four dimensions in building a performance assessment framework, three are from the triple bottom line of sustainability (environment, social, and economic), and the fourth is business operations.
The second research question that arises is as follows: “how the sustainable performance assessment model is developed and for assessing sustainability of dairy industries (DPIs)?” This question arises because the literature suggests various methodologies that can be used for building a performance assessment model. Here, the multicriteria decision-making (MCDM) technique is one of the pioneering techniques that is available, and we utilized an MCDM technique combined with a fuzzy-based AHP-VIKOR research model that is verified with fuzzy TOPSIS. The choice of an integrated MCDM over another technique was made because this technique provides accurate findings on qualitative data, uses easy-to-use technology, and requires fewer data [13]. We projected several research objectives as targets to achieve from this study, which are shown below.

Research Objectives (ROs)

RO1: To identify the key performance indicators for the sustainability assessment of the dairy industry.
RO2: To prioritize the identified sustainable performance indicators and evaluate the sustainability of the selected Indian dairy industries.
An integrated MCDM methodology has been utilized to build a sustainability assessment framework for DPIs. We have applied the Delphi methodology for the identification of key sustainable performance indicators. The fuzzy AHP methodology has been used to compute the weightage of the indicators, whereas fuzzy VIKOR is used to rank the DPIs based on the performance of each indicator. The novelty of the research lies in the fact that this is the first study in the Indian context evaluating the sustainability of the DPIs in four dimensions (namely, environment, social, economic, and business operation). The inclusion of a business operation framework provides an in-depth assessment of sustainability in each context. We have also checked for the robustness of the research framework by employing fuzzy TOPSIS, which is a similar methodology to the F-VIKOR.

2. Literature Review

2.1. Sustainability in Dairy Supply Chain

According to Carter and Rogers [14], when environmental and social aspects of sustainability that extend beyond a firm’s boundary are combined with economic objectives in a deliberate long-term strategy along with the inclusion of SC activities in firm sustainability, it can create a pervasive and less imitable set of processes as well as potential bases for competitive advantage for them and associated chain members. Carter and Rogers [14] define sustainability as a strategic transparent integration of an organization’s social, environmental, and economic goals along with key inter-organizational business processes for improving the individual company’s and its supply chains’ long-term economic performance.
The dairy industry is a major contributor to global warming because of the massive amounts of greenhouse gases (GHGs) it emits [15]. The dairy industry’s greenhouse gas emissions climbed by 18% from 2005 levels to 2015 levels, which is a deep concern for the global environment [16]. The production of these relies heavily on the use of fossil fuels at every stage of the process, which comes mostly from the enteric fermentation of bovine stomach contents [17]. On the other hand, the dairy industry generates 70–80% of the total rural economy as well as 45–55% of employment. Human diets rely heavily on dairy products because they provide a substantial amount of protein and several critical minerals and vitamins, including calcium and vitamin B12 [18]. Dairy products (including cheese, milk, and butter) contribute roughly 14% to overall consumption in affluent nations and about 5% in underdeveloped countries in terms of dietary calorie intake [19]. A considerable increase in demand for dairy products raises questions about the sector’s long-term viability considering the rapidly expanding global population, rising per capita income, and “Westernizing” food patterns in the East [20]. In fact, between 2020 and 2030, the market for fresh dairy products is predicted to grow at a compound annual rate of 1.0%. [20]. Despite their nutritional significance, dairy products are produced with a substantially larger carbon footprint than their plant-based counterparts [21]. Low-meat, vegetarian, and vegan diets are on the rise as a result of consumers’ increased concern for environmental impact and animal welfare [22]. In fact, compared to meat eaters, vegans produce around half as many greenhouse gas emissions from their food choices [23]. Therefore, adopting a plant-based diet might significantly aid in the preservation of the natural world. However, with a large number of advantages and disadvantages in the environmental aspects, balance between people, planet, and profit, is required, and hence, sustainable development in the dairy industry is necessary. Towards the development of sustainability, regular performance monitoring is one of the major tasks. Regular sustainability assessment is required for the continuous improvement of sustainable development in the dairy industry. From farmers to markets, there are multiple steps in the dairy supply chain, and at each stage, there are different risk factors that might have an impact on sustainability, as shown below in Table 1.

2.2. Sustainable Performance Assessment in Dairy Supply Chain

Most definitions of SPA focus on it being a decision-making aid that prioritizes long-term sustainability. Several studies have applied the TBL concept of sustainability to the food industry to investigate sustainable performance [12,24,25]. However, many studies evaluating the food industry’s efficacy simply look at sustainability with an environmental focus [15,26]. Using a combined Slacks-based measure (SBM) and data envelopment analysis (DEA) technique, Cecchini et al. [27] assessed the environmental performance of dairy companies. Life cycle assessment (LCA) methods have been used to evaluate the environmental impact of the dairy industry [15,26,28]. The performance impact of the multi-tier supply chain is measured, and a theoretical framework for societal SD was developed by Mohammed et al. [29]. Using a combination of TISM and ANP, Chen et al. [30] created a socially responsible supplier assessment methodology. The analytical methodology and FSC performance metrics were created by Moazzam et al. [31] based on efficiency, flexibility, responsiveness, and quality. Using the notion of the circular economy, Kazancoglu et al. [32] designed a method for evaluating the effectiveness of FSC’s reverse logistics. By bringing together the circular economy, Industry 4.0, and cleaner manufacturing, Gupta et al. [33] designed a hybrid ethical and sustainable business performance paradigm. Barriers to sustainable company operations were examined by Kumar et al. [34] from the viewpoints of Industry 4.0 and the circular economy. With a fuzzy decision-making trial and evaluation laboratory (DEMATEL) based on ANP and TOPSIS approaches, Sufiyan et al. [35] assessed long-term FSC performance. Environmental degradation, social welfare, and economic insecurity were all areas where Bloemhof et al. [36] found that TBL might be utilized in FSC. To reduce carbon dioxide emissions, overall SC costs, and gridlock while still meeting the SDG, the SSC network was built [37].

2.3. Sustainability KPIs

Given the evolving context and the dynamic nature of environmental, social, and economic aspects, the adoption of new sustainable Key Performance Indicators (KPIs) becomes imperative. These KPIs need to be carefully selected to ensure that they provide a comprehensive assessment of an organization’s performance, encompassing the entire value chain, considering industry-specific context, engaging stakeholders, and aligning with strategic objectives. Choosing the appropriate KPIs is of utmost importance for organizations [33]. Researchers in the field of sustainability assessment have used only TBL dimensions in the past Kumar et al. [12], but Gupta et al. [33] have combined the TBL with Industry 4.0, the circular economy, and clean technology to improve manufacturing organization performance. The six-dimensional approach used by Chen et al. [30] provided that, to choose a socially responsible food provider, one must consider price, longevity, quality, service, communication, and collaboration. Using an integrated, sustainable, and adaptable supply chain as their starting point, Negri et al. [38] created a conceptual framework. Lean, agile, resilient, and sustainable supply chains are the focus of a conceptual framework established by Sharma et al. [39]. When evaluating the effectiveness of a reverse supply chain, Dev et al. [40] use a circular economy approach.
Focusing on social costs influenced by activities like investment in the collection and the size of the end-user market that determines profits is important since they are based on a trade-off analysis between economic and environmental performance and the functioning of I4.0 and circular economy [40]. Past environmental KPIs used by researchers [41] include greenhouse gas emissions, use of water and electricity, green logistics, and more. As a result, economic performance indicators include profit, food quality, logistical efficiency, revenue growth, R&D spending, etc. [36,42]. Profit sharing, employee well-being, human resources, supply chain (SC) transparency, gender equity, etc., were all used as social KPIs by researchers [43]. Key performance indicators (KPIs) for CEP in the SSC include waste management, recovery, recycling, and the efficacy of reverse logistics [44] (Table 2).

2.4. Tools and Techniques

Sustainability assessment tools may be positioned along three dimensions of the categorization framework established by Morrison-Saunders et al. [48]: (1) underlying sustainability discourses, (2) representations of sustainability within the assessment process, and (3) the decision-making environment. Information creation for decision making, complexity structuring, operationalization, a venue for participation, discussion, and deliberation, and social learning are all goals of SA, as stated by [49]. A further goal of SA, as stated by Moldavska and Welo [50], is “to help decision-makers, simplifying the identification of measures that they should do in the endeavor to contribute to sustainable development.” They added that SA was to alert them of problems that needed fixing within the organization. A review of the relevant literature revealed that researchers have previously employed a wide range of qualitative and quantitative methods to evaluate various outcomes. For environmental sustainability assessment in FSC, several studies have used LCA [15]. While several studies have used data envelopment analysis (DEA) methods to evaluate sustainability [27], others have turned to balanced scorecards [43]. The sustainability assessment of FSC has been conducted using various MCDM methods [51]. Fuzzy TOPSIS was used by Govindan et al. (2013) [46] to rate vendors on their contribution to environmental sustainability. Green SC performance is quantified by Uygun and Dede [52] using a DEMATEL-ANP-TOPSIS hybrid model of the MCDM. The SCOR model may be connected to supply chain performance indicators such as dependability, responsiveness, flexibility, cost, asset metrics, and sustainability [53]. SCOR is a methodology for measuring the environmental effect of an organization’s supply chain activities in terms of its capacity for sustainability and natural resource management [53]. Because the SRPM framework’s practical applicability is dependent on a resource-based perspective, the SCOR model is used to clearly align the business processes and activities (i.e., plan, source, make, deliver, and return) as firm resources are important in identifying the scope for socio-economic and socio-environmental sustainability.

2.5. Research Gap

Rising population and smart lifestyles place greater requirements on dairy products. The main contributors to greenhouse gas emissions are huge waste generation (around 1/3rd of the total edible food) and unsustainable food consumption [31,54]. In order to achieve zero waste, governments and international organizations pressure food firms to reevaluate their business plans considering current SD and integrate social and environmental goals into their economic goals [55], whereas Kumar et al. [12] stress the circular economy as a requirement for better sustainable development and add it as sustainable performance assessment tool for the agri-food supply chain. However, researchers suggest that excellence in business operations is the major driver for the success of dairy firms in sustainable aspects [56,57]. According to Mangle et al. [58], for sustainable development in the dairy sector, the business operation excellence dimension along with the TBL of sustainability is a driving factor. Thus, this study includes it to make our performance assessment framework unique for the dairy industry, which also fulfills the available gaps. Various SDGs, including zero hunger, the most important of the 17 targets, as well as SCP, have been realized in this research framework by focusing on waste reduction and business excellence.

3. Methodology

3.1. Research Methodology

An integrated MCDM approach, including Delphi, fuzzy AHP, and fuzzy VIKOR has been utilized. A study approach consisting of three stages has been used (see Figure 1) in order to accomplish the goal of providing a sustainable performance assessment framework for the dairy industry in order to attain SCP. The first step consists of performing a rigorous literature search in order to find sustainable performance indicators (SPIs) (refer to Table 2). During this phase, the SPIs are modified and approved with the help of experts from academia and the dairy industry, and Delphi has been utilized to choose the best set of SPIs. The experts from academia and industry were given a questionnaire containing the identified SPIs and were asked to rate the relevance of the SPIs toward sustainable performance assessment for the dairy industry. The questionnaire can be found in the Appendix A under the part labelled “Appendix A.1.”
In the second phase, experts were invited to prepare pairwise evaluations of the SPIs and their relative relevance. The panel of experts from academia and the dairy industry were invited on the Microsoft teams platform to fill the questionnaire sheet for AHP. The AHP questionnaire can be found in Appendix A.2, which is filled using a nine-point fuzzy scale, as can be found below in Table 3. These evaluations were then used in the computations of the weightage. An AHP has been utilized so that the relative weights of the SPIs can be calculated. Following the outcome of the fuzzy weight assessment in the third phase, we evaluated sustainable performance and ranked the three Indian dairy industries for each SPI. The fuzzy VIKOR technique has been applied to conduct the assessment of sustainable performance. The questionnaire that was used to acquire the data for the fuzzy VIKOR model may be found in Appendix A.3. of the accompanying document. On the five-point fuzzy linguistic word that is displayed in Table 4, the F-VIKOR questionnaire has been asked to be completed. The next paragraphs will go into further information regarding these three steps.

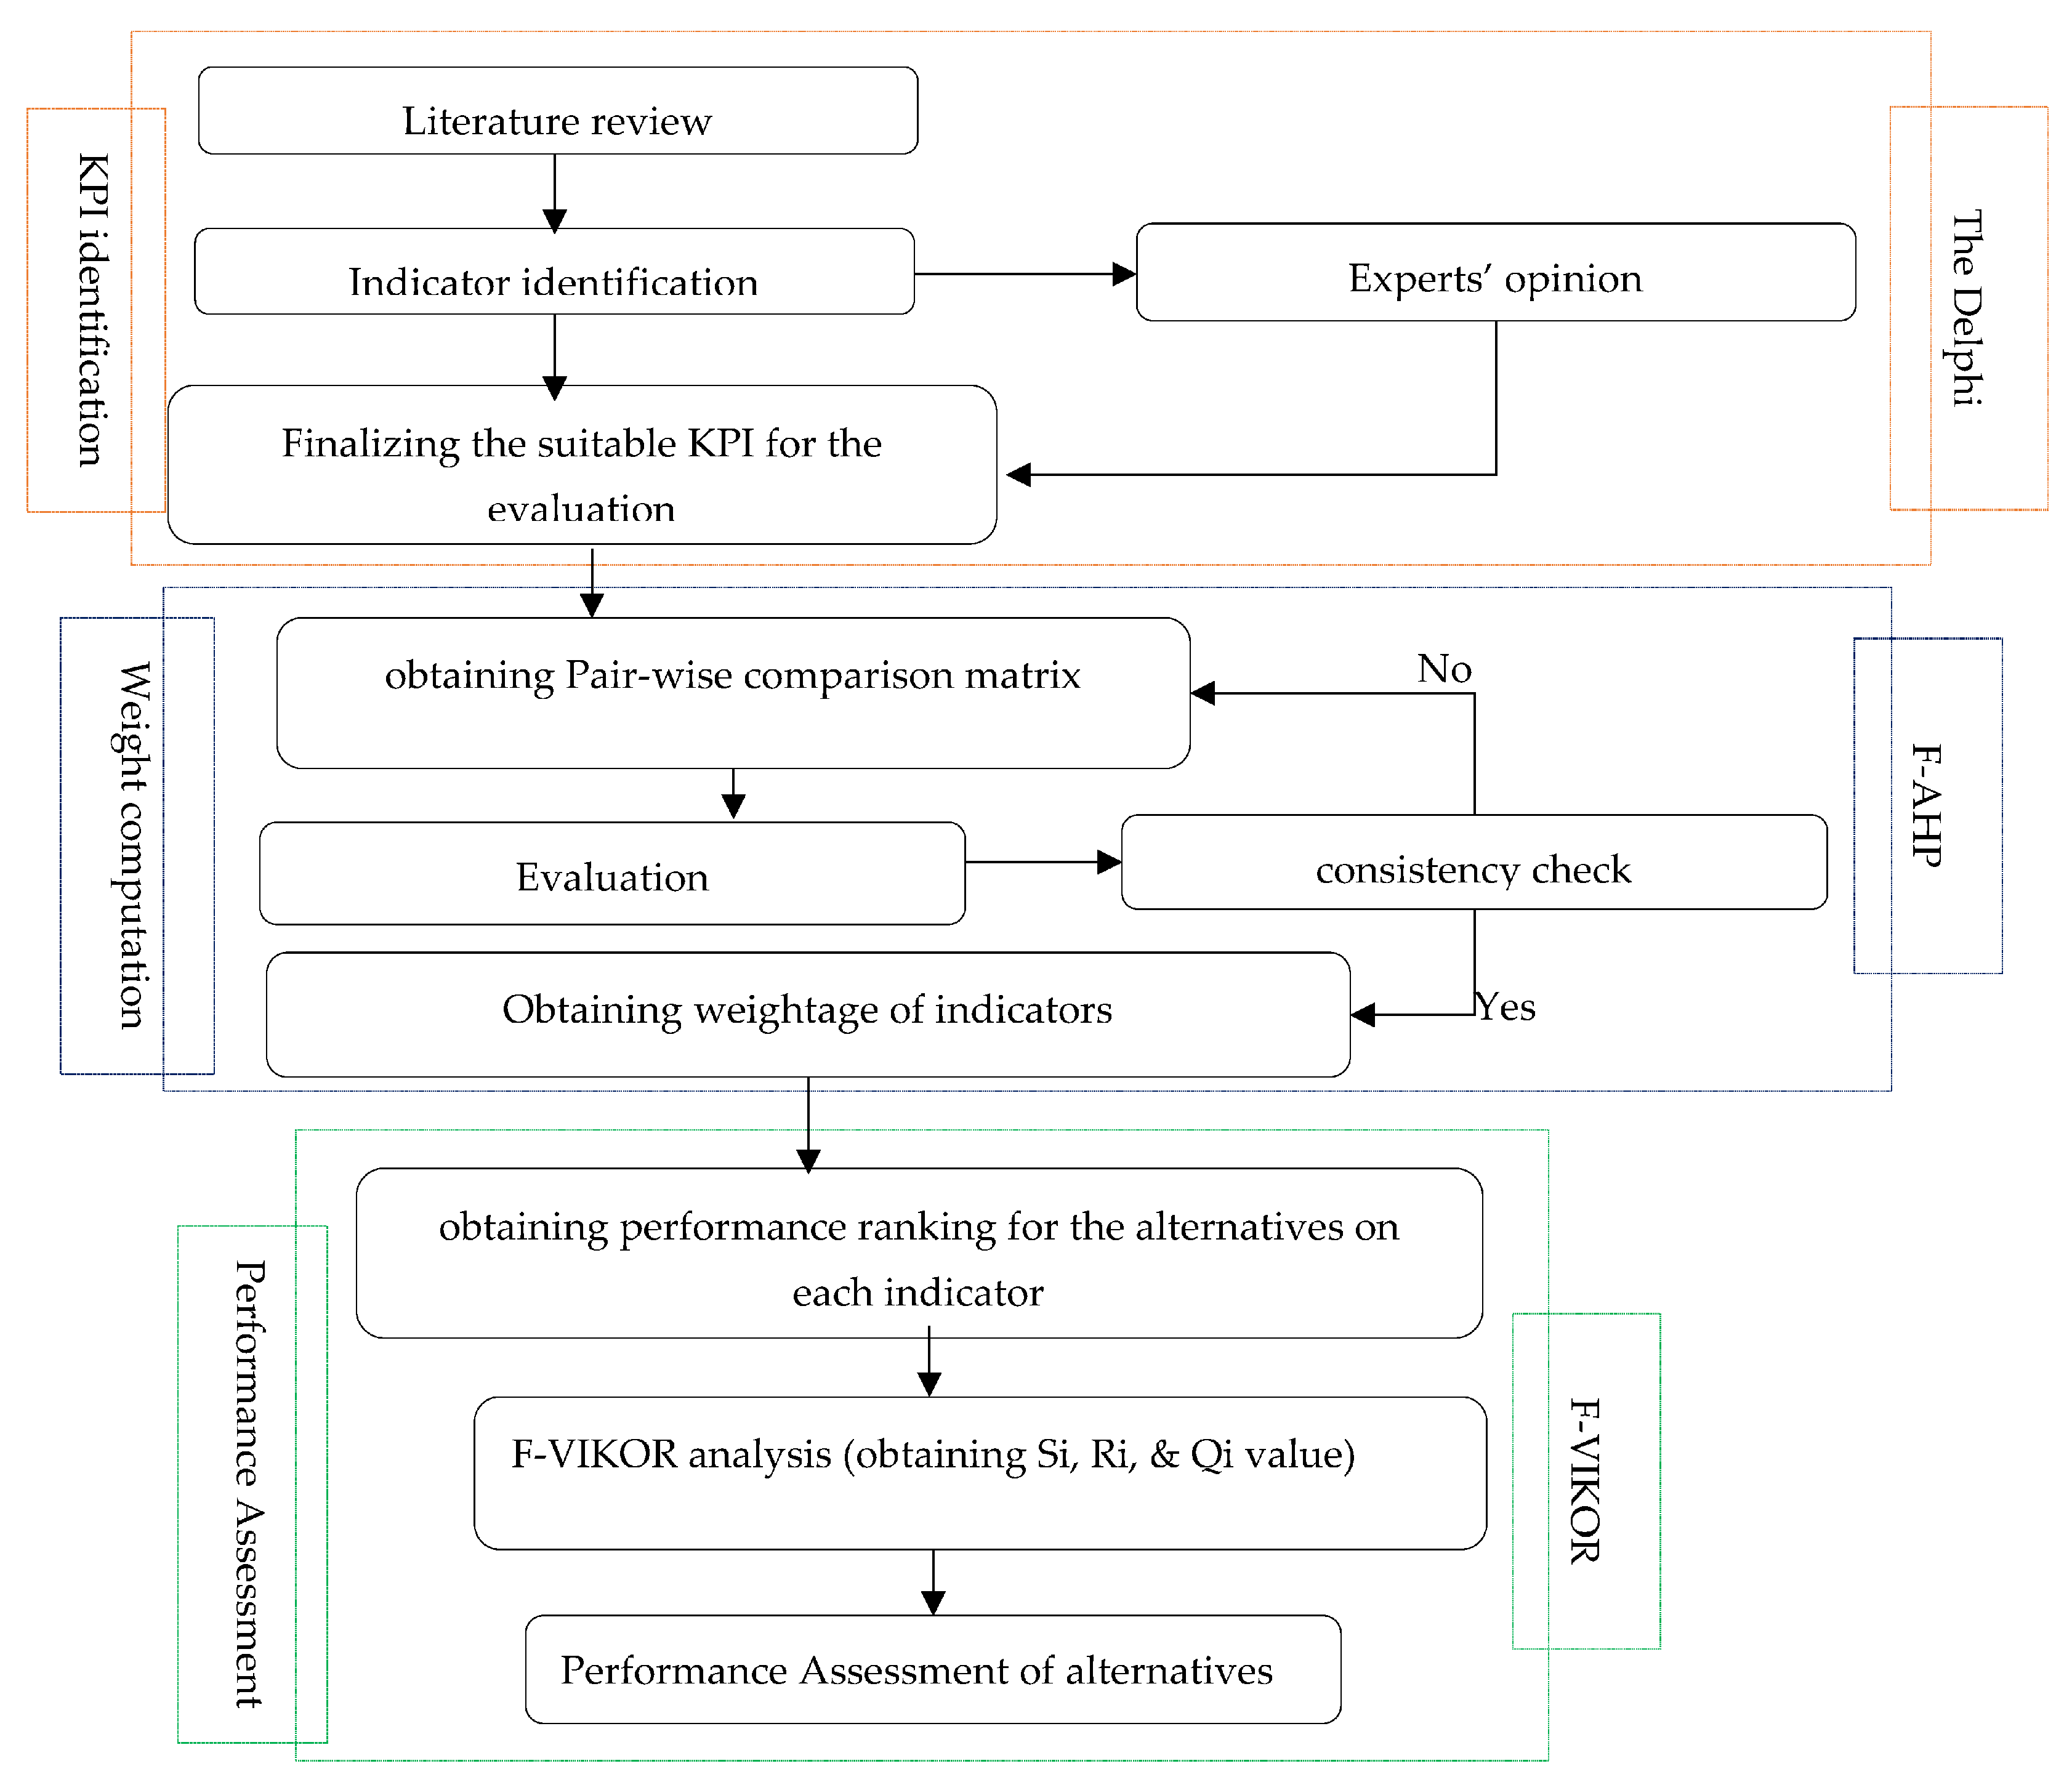
The Methodological Steps

The brief methodological steps have been provided as follows.
  • In the first step, we identified 25 sustainable performance indicators from the literature and made a questionnaire to sort them. The questionnaire (shown in Appendix A.1) was circulated to collect the responses for the Delphi study to sort the PIs, and finally, 19 PIs were finalized.
  • In the second step, we made a questionnaire to obtain pairwise importance weight for the computation of the weights of the indicators using the F-AHP methodology. Through conducting talks with three industrial and two academic professionals, we prepared the pairwise importance matrix. The AHP methodology provided by Kumar et al. [12] has been followed.
  • In the last step, we utilized the fuzzy VIKOR methodology, which is provided by Vinodh et al. (2013). To simplify the calculation, we opted for different linguistic fuzzy numbers and scales [59]. Thus, we utilized a 5-point linguistic variable from very-poor to very-high performance, with a triangular fuzzy scale between 1 and 9; however, Ref. [59] used the same linguistic term but have a trapezoidal fuzzy number between 0 and 1. The fuzzy numbers of the linguistic scale are shown in Table 3.

3.2. Data Collection and Demographic Profile

The data collection process consisted of three phases. In the first phase, the data were collected to establish the sustainable performance indicators (SPIs) for the Delphi study. A questionnaire, provided in Appendix A.1, was circulated among 50 experts in the field. We received a total of 26 responses, and the demographic profile of the experts can be found in Table A5 in the Appendix A. It is important to note that all the experts selected for this study have backgrounds in the dairy industry and sustainable supply chain management. We have taken every precaution to ensure the confidentiality of the experts by assuring them that their personal details will not be disclosed. In the first phase of data collection, experts were asked to rate the sustainable performance indicators (SPIs) on a scale of 1 to 5. Based on the analysis of the 26 received responses, 19 SPIs were found to have a mean rating above the threshold value of 3 [60]. For the second phase of data collection, a question sheet was prepared for the analytical hierarchy process (AHP) and is provided in Appendix A.2. A panel consisting of three experts, who had also participated in the Delphi study, was formed. These experts were selected from different dairy industries. The experts were invited to join a session on the Microsoft Teams platform to complete the question sheet (shown in Appendix A.2). It is important to note that the personal information of the experts and the raw data from their respective industries were kept strictly confidential. The demographic background of these experts can be found in Table A5 in the Appendix A. Although we initially requested two or more experts from each dairy industry to participate in the SPI discussion for the AHP but due to their busy schedules, we were only able to obtain the participation of one expert from each of the three dairy industries. The experts selected for this study hold executive officer and production manager positions in three different Indian dairy industries. They possess a minimum of 15 years of experience and hold at least a master’s degree qualification. In the third phase of data collection, we engaged with the dairy cooperative office. This decision was made to leverage their comprehensive understanding of all the dairy plants within the cooperative network. By involving experts from the dairy cooperative, we aimed to mitigate the potential bias that could arise if experts from the same industry as the one being assessed were selected. The three experts from the dairy cooperative provided their feedback on the performance of all three dairy industries using a linguistic scale in the VIKOR data collection sheet provided in Appendix A.3. Each of these dairy cooperative members has more than 10 years of experience in the operations field, ensuring their familiarity with every industry under consideration. The demographic profile of the experts involved in this study can be found in Table 4.

4. Results

4.1. Sustainable Performance Assessment

The sustainable performance assessment framework for the dairy industry is shown in Figure 2. We chose four dimensions, namely business operations, environment, economic, and social, with a total of 19 PIs. Business operations has four, environment criteria has seven, and economic and social criteria also have four indicators each. Regarding the distinction between business and economic aspects, we acknowledge that business operations can take into account environmental, social, and other complex factors in addition to economic ones. In order to align with the triple bottom line (TBL) idea, we have separated business operations from the conventional performance assessment model. Researchers tend to give economic factors more weight in traditional models, where the emphasis is primarily on evaluating economic performance and may overlook the assessment of environmental and social aspects. Therefore, just as Kumar et al. [12] took the circular dimension as the fourth criterion by not integrating it with environment, we took the business operations dimension separately as the fourth dimension for the sustainable performance model. With the nineteen indicators (sub-criteria) and four dimensions (criteria), we have developed a three-stage performance assessment framework, including the Delphi, F-AHP, and F-VIKOR methodology. We have utilized our SPA framework to evaluate thee sustainability of three north Indian dairy industries based on the identified criteria and sub-criteria. The findings of the three-phase performance assessment framework have been discussed in the following sub-sections.

4.1.1. Phase Ⅰ Identification of Sustainable KPIs: Delphi Study

In the very first step, we identified 26 sub-criteria (indicators) used to assess the sustainability of the dairy industry as well as perishable food. From the twenty-six sub-criteria, we utilized the most common method for sorting, i.e., the Delphi method, and finally, we obtained 19 performance indicators, which belong to four different criteria of sustainable performance assessment. We kept a threshold value set to the mean of the respondent’s ratings as no less than 3, as per the suggestion of Kumar et al. [60]. The computed average scores of the sub-criteria are shown in Table 5. Seven indicators, namely, the diversity of the market, average wages per person per year, effective number of refrigerated carriers, chilling capacity, hazard substance exposure, donation to charity, and workforce utilization, were rejected when using the Delphi method. However, the effective number of refrigerated carriers and chilling capacity have an average score of 2.75; therefore, the inclusion of these indicators was discussed with experts, but they suggested not to include them as they are indirectly associated with cold chain effectiveness. Another rejected indicator has mean values of 1.7 and 2.4.

4.1.2. Phase Ⅱ Criteria and Sub-Criteria Weight Computation Using F-AHP

The fuzzy analytic hierarchy process (F-AHP) technique has been utilized to compute the weightage of the criteria and sub-criteria, which is further utilized to evaluate the performance of the dairy industry. On the nine-point fuzzy scale shown in Table 3, the pairwise comparison among each criterion and sub-criterion within the criteria has been prepared, as shown in Table A1. Based on the pairwise comparison data obtained from the expert panel, we employed stepwise F-AHP, following [12]. The criteria weight and the local and global weight of the sub-criteria are shown in Table 6. For the consistency of the obtained results, we checked the consistency index (CI), which was obtained from the fuzzy of the maximum eigenvalue, and is shown in Table 6. From Table 6, the consistency index for each sub-criteria matrix has been found to be less than 0.1 (10%), between 0.03 and 0.08, indicating that the obtained weight is consistent.
The findings show that experts provided a maximum weight of 0.33 (33%) to the environmental criteria and a minimum weight of 0.16 (16%) to the social criteria, whereas that between business operation and economic criteria has a weightage of 0.204 and 0.306, respectively. Within the environmental criteria share of renewable energy utilization are the top-weighted criteria, with a weight of 0.232, while the green supplier is the least-weighted sub-criteria, with a weight of 0.078. EBO is the most weighted indicator in BO, with 0.340, while CUR is the least-weighted indicator, with 0.108. ASC is the top-weighted economic sub-criteria, while RND is the least-weighted economic sub-criteria, with 0.336 and 0.207, respectively. In the social criteria, TRA is the most weighted, with 0.423, and EGR is the least weighted, with 0.170. However, from a global perspective, the top-ranked indicator is ASC, with a weight of 0.103, while CUR is the least-ranked indicator.

4.1.3. Phase Ⅲ Sustainable Performance Assessment of the Dairy Industry

To evaluate the sustainable performance of the dairy industry, the F-VIKOR methodology has been applied. The F-VIKOR takes input as the weightage obtained from F-AHP and the performance matrix filled from the expert that evaluates each DPI on every indicator on the linguistic scale. We prepared a performance matrix from the three experts from the executive of the dairy cooperative, as provided in Table A1. The aggregation, when performed to build a single performance matrix, the aggregate performance matrix is shown in Appendix A (Table A2). Group utility (Si), indivisible regret (Ri), and VIKOR index (Qi) have been computed. After applying the F-VIKOR methodology, the Ri, Si, and Qi values have been obtained. The Qi value computed at a maximum set utility of (μ) = 0.5 is provided in Table 7. Based on the Si, Ri, and Qi (refer to Table A3 and Table A4), we have three rankings; however, the lower value of the Qi is advantageous, so the rank of the DPIs has been computed in increasing order of the Qi value. Based on the Qi value, DPI3 has the lowest value of 0.0596 and is ranked 1st and selected as the best sustainable dairy industry, whereas DPI1 has a Qi value of 0.269, ranked 2nd, and DPI2 has a maximum Qi value of 0.75, which is ranked as the least sustainable dairy industry. From Table 7, the rank of all the DPIs are the same for all three (Si, Ri, and Qi) indices; hence, the ranking of DPIs are DPI3—DPI1—DPI2.

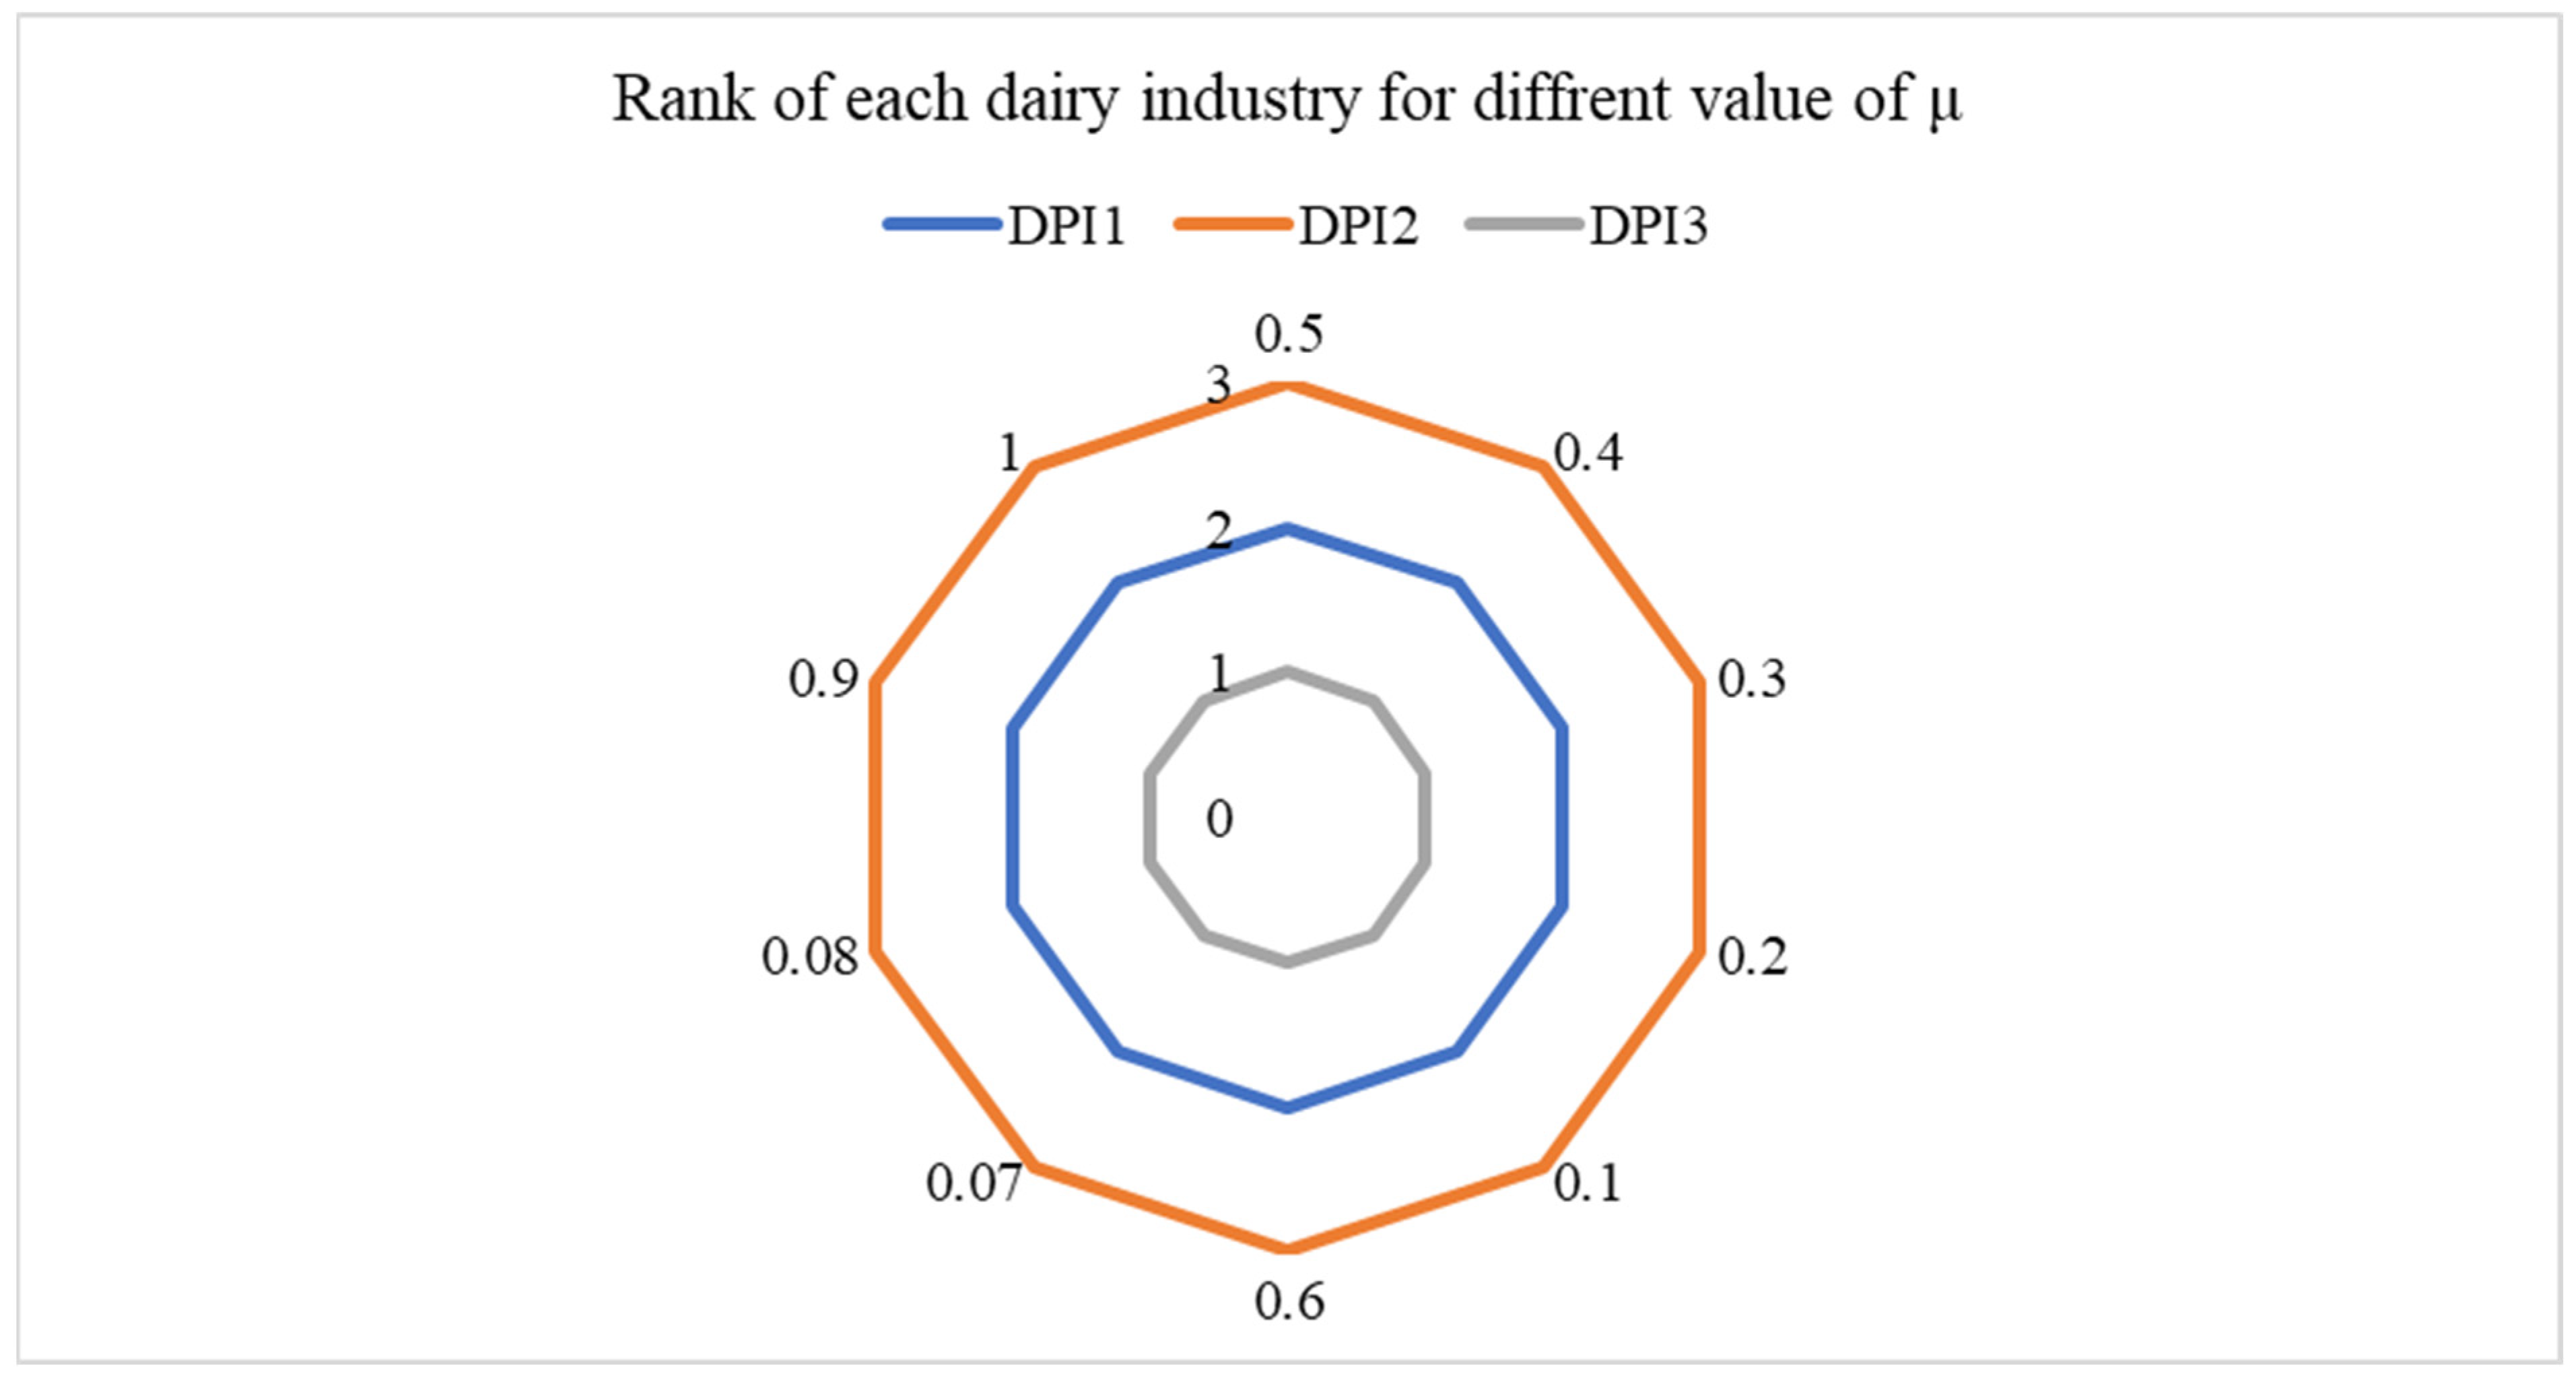
4.2. Sensitivity Analysis

We checked the sensitivity of the results obtained from fuzzy VIKOR in two ways: (i) by changing the maximum set utility value of μ (0 to 1) in 10 as in the step of 0.1 and checked for variation in the rankings of the DPIs; (ii) we employed F-TOPSIS to an alternate method of ranking the DPIs to check the variations in the rank. In Figure 3, we show the variation in the rank of the DPIs by varying the maximum set utility value, and the results clearly show that there are no variations in the ranks of the DPIs; hence, we have robust results. For the same input, we utilized F-TOPSIS to compute the rankings of the DPIs, and the results in Figure 4 clearly show that the ranks of all DPIs are the same as those obtained using F-VIKOR. However, we can say that the obtained ranking of the DPIs is robust, hence the ranking of the DPIs is DPI3—DPI1—DPI2.

5. Discussions

5.1. Discussions on Findings

A sustainable performance assessment framework has been proposed in Figure 2 that utilizes integrated multi-criteria decision-making tools. The MCDM tools include Delphi, F-AHP, and F-VIKOR. We have also performed sensitivity checks for the robustness of the findings through another MCDM methodology, F-TOPSIS. F-TOPSIS and F-VIKOR are similar types of MCDM tools that are utilized to verify the findings of each other. We raised some important questions in the introduction that will not be addressed well, and by answering these questions, we fulfill the gap found in the literature. Our first research question is what are the critical aspects (criteria and Indicators) where the sustainability of the dairy industry has been measured? To answer this RQ, we thoroughly studied the available literature on the sustainability assessment of DPIs, and based on the literature study, we take the opinions of the experts and applied Delphi. From the opinion of experts, we propose four dimensions, where the sustainability of the DPIs must be measured, which are environmental, social, economic, and business operations. For sustainability assessment, most pieces of literature only discuss environmental, social, and economic aspects, but we include business operations as another dimension. This research identifies and finalizes 19 indicators from Delphi analysis belonging to four dimensions. We have identified seven indicators for environmental aspects and twelve indicators, four each from social, economic, and business operations. After this, we try to answer another RQ, i.e., what are the weightage and their rankings of the criteria (Dimensions) and Indicators? To answer this RQ, we applied F-AHP to compute the criteria and indicator weights. Because of the simplicity of the AHP, the researchers mostly applied it, while fuzzy theory has been introduced to overcome the judgmental error and vagueness. However, the computed results are highly consistent, as the CI value for every criterion and indicator are below 10%. The findings indicate that the environmental criteria are the most significant criteria and that social are the least weighted criteria, as also found in [12]. The criteria and indicator weight and their rankings are shown in Table 6.
Based on the F-AHP findings, we evaluated the sustainability of the three north Indian dairy industries, providing an answer to the third RQ: which is the best sustainable dairy industry of the three main north Indian dairy plant? All three dairy industries belong to the dairy cooperative society (refer to Figure A1). Through F-VIKOR and F-TOPSIS, we ranked the three DPIs based on their performance in terms of the indicators. DPI3—DPI1—DPI2 is the ranking of the three DPI of north India, which is the same as both F-VIKOR and F-TOPSIS. We also ranked the three DPIs on each aspect, as shown in Figure 4. From Figure 4, it has been clearly found that DPI3, which is ranked first by F-VIKOR, is also ranked first in terms of environmental and social dimensions while ranked third on two other aspects, i.e., economic and business operations.
DPI2 ranked first in terms of the economic aspect, while DPI1 ranked first in business operations. DPI1 performed lowest in terms of the environment aspect as well as social aspects, as shown in Figure 5. This study helps managers identify the aspects requiring imrpovement to become highly sustainable processing industries.

5.2. Discussion on SDG and Dairy Industry

The dairy industry plays a vital role in sustainable development and has the potential to contribute to several sustainable development goals (SDGs). Through the production of high-quality dairy products, it actively supports the achievement of SDG 2: Zero Hunger and SDG 3: Good Health and Well-being. The implementation of quality standards and hazard analysis and critical control points (HACCPs) indicator ranking third among the overall key performance indicators (KPIs) identified in this study is crucial in facilitating progress toward these SDGs. SDG 2: Zero Hunger: Dairy products contain a variety of critical elements, such as proteins, vitamins, and minerals. The dairy industry contributes greatly to food security and the battle against malnutrition through the manufacturing and distributing dairy products. SDG 3: Promotion of Health and Well-being: Dairy products are essential in promoting a healthy and balanced diet. They supply important nutrients for human growth and development, such as calcium for strong bones and teeth. However, in order to ensure the health and well-being of both persons and animals participating in the dairy sector, ethical consumption and production practices must be promoted. It promotes economic growth and livelihoods by creating jobs throughout the dairy value chain, which includes farming, processing, distribution, and marketing [61,62]. SDG 12: Responsible Consumption and Production: By implementing efficient resource management, reducing waste, and minimizing environmental impact, the dairy industry can work toward sustainable production practices. The dairy industry can help achieve this goal by promoting sustainable packaging, efficient energy use, and responsible water management [63]. According to our findings, the use of renewable energy emerges as the second-ranked indicator, playing a significant role in both climate action and the preservation of life on land. Climate action: SDG 13, the dairy industry, particularly livestock farming, can have serious environmental consequences, including greenhouse gas emissions. Sustainable agricultural practices, improved waste management, and the use of renewable energy sources can all help to reduce the industry’s carbon footprint and mitigate the effects of climate change. SDG 15: Terrestrial Life: Dairy farming is dependent on healthy ecosystems, including meadows and forests, which provide animals with food, water, and habitat. Sustainable land management strategies, such as preserving biodiversity, reducing deforestation, and fostering regenerative agriculture, can assist in the conservation and repair of ecosystems related to the dairy industry. Partnerships for Goals (SDG 17) Collaboration among various stakeholders, such as the government, dairy industry associations, farmers, and consumers, is essential for attaining sustainable development. Building collaborations and exchanging expertise can aid in the identification and implementation of best practices, innovative technology, and legislation to enhance dairy industry sustainability.

5.3. Research Implications

This research provides significant contributions from both theoretical as well as managerial perspectives that will help firms in SDG attainment. In the following sub-sections, the contributions of the research have been explored.

5.3.1. Theoretical Implications

The study provides better knowledge of the assessment of sustainable dairy supply chain performance via the study of an Indian dairy case. It makes three significant contributions to the knowledge of sustainability and performance assessment of the dairy industry. First, the findings broaden our prior knowledge of criteria and sub-criteria through exploration and prioritization, capturing the whole characteristics of the procedure to determine those which would play a major role to attain SDG and advance SD. Research can improve our comprehension of the results, contributing toward providing a clear thought for managers while taking key decisions on the criterion and evaluating the sustainability of the dairy industry.
Second, the authors developed a sustainable framework by including one additional dimension, namely, business operations, to the current TBL dimensions. The inclusion of business operations components in TBL functions as a driver of sustainable TBL, generating economy while reducing the environmental effects through effective business operations. As a result, the study addresses a shortage of substantial framework-based empirical discoveries, particularly in the Indian dairy supply chain. To the best of our knowledge, this is the first empirical attempt to incorporate the business operations component into the three current aspects of sustainability. It is noted that Kumar et al. [12] include circular economy as the fourth dimension if TBL to build a performance assessment framework for the agri-food supply chain. Third, we employed a strong framework based on the Delphi-AHP-VIKOR methodology to precisely assess the complicated challenges and provide the most effective solution.

5.3.2. Managerial Implications

Contemporary research on sustainability assessment in the dairy supply chain is quite limited, while its application is widely needed for sustainable development and waste minimization. Our research has crucial practical consequences in revealing several facets of the suggested sustainable framework. The following are the main practical implications of the current work. The TBL of sustainability, including business operations, is covered by this framework for assessing sustainability performance, making it highly distinctive and intriguing. Circular metrics are included in this framework’s environment component as well. This study framework’s main areas of focus are waste reduction, excellent business operations, and circular development, which include all defined TBL sustainability components. Dairy industries used our research approach to analyze their sustainability and compare it to their top rivals, enabling them to make continual improvements. Businesses may reduce their GHG emissions by measuring their commitment to sustainability. The study’s top two performance indicators are the average cost of the supply chain and the percentage of renewable energy, indicating that the performance framework has put a strong emphasis on the economic and environmental sectors. The next three performance indicators are efficient business operations, quality, and traceability metrics, suggesting that the assessment framework is quite balanced and innovative as well as beneficial for managers to analyze sustainability.

6. Conclusions

Pressure from governments, non-governmental organizations (NGOs), consumers, and other international organizations, as well as biodiversity change, have lately increased companies’ interest in SSC, and thus the dairy industry is seeking to incorporate SD practices. As a result, the UN’s 17 SDGs for governments to aim for, and corporate organizations, including the supply chain, must collaborate to achieve it. As a result, sustainability reviews are crucial for understanding a firm’s progress toward sustainability. From this study, readers are provided answers to a couple of questions, first, what are the critical Indicators which is used to measure the sustainable performance of the dairy industry and second, how the sustainable performance assessment model is developed and used to assess the sustainability of DPIs? However, this research is quite interesting as it integrates the important dimension, i.e., business operations excellence with the TBL dimensions as it is important for dairy as well as other firms. In this study, the dimensions are ranked as economic, environment, business operations, and social in decreasing order. Additionally, the two performance indicators are the average cost of the supply chain and the percentage of renewable energy belonging to economic and environment dimensions. Our performance assessment framework provides rankings to three dairy plants, DPI3, DPI1 and DPI2, in increasing order, with both F-VIKOR and F_TOPSIS methods suggested as being highly reliable frameworks.

Limitations and Future Research Direction

This study has significant limitations because it is only intended for the sustainable development of dairy industries. However, based on the consistency of delivering valuable results as suggested by sensitivity analysis, this framework should not be limited to geographical locations, even though we tested it only with Indian dairy firms. However, the framework needs to be tested with dairy firms of other geographies from India. Regarding the applicability of the SPA tool, it has been validated using three Indian dairy industries, all of which belong to dairy cooperative societies. Therefore, this study is certainly relevant to dairy industry operations run by cooperative societies. However, other dairy industries following a similar model can also utilize this tool to assess their sustainable performance. It is worth noting that in the future, modifications may be necessary to adapt the tool for other types of structural dairy industries. Due to the fact that business operations indicators cannot be combined with any TBL dimensions and that the circular economy has a significant influence on the environment, we maintained them distinct based on expert advice and literature recommendations.

Author Contributions

Conceptualization, M.K. and V.K.C.; methodology, analysis, and data collection, M.K.; validation, M.K. and V.K.C.; writing—original draft preparation, M.K.; writing—review and editing, M.K. and V.K.C.; supervision, V.K.C. All authors have read and agreed to the published version of the manuscript.

Funding

This research received no external funding.

Institutional Review Board Statement

Not applicable.

Informed Consent Statement

Informed consent was obtained from all subjects involved in the study.

Data Availability Statement

Not applicable.

Conflicts of Interest

The authors declare no conflict of interest.

Abbreviations

FSCFood supply chain
SSCMSustainable supply chain management
DSCDairy supply chain
KPIKey performance indicator
PIsPerformance indicators
GHGGreenhouse gas emission
DPIDairy Industry
AHPAnalytic hierarchy process
TOPSISTechnique for order
VIKORVIseKriterijumska Optimizacija I Kompromisno Resenje (Multicriteria Optimization and Compromise Solution, with pronunciation)
SDSustainable development
SCPSustainable consumption and production
SDGSustainable development goal
SRPMSupplier relationship and performance measurement
SCORSupply chain operations reference

Appendix A

Table A1. Raw data for AHP.
RNDASCREGUQSTRAGEQEGRPSHGSRCCEWMTGHGMEMGRMSREEBORCDUOTCUR
RND11/211
ASC2112
REG1111/2
UQS11/221
TRA 1232
GEQ 1/2112
EGR 1/3111
PSH 1/21/211
GSR 121/31/21/31/21/4
CCE 1/2111/211/31/4
WMT 3111211
GHG 2211211
MEM 311/21/2111/4
GRM 2311111
SRE 4411411
EBO 1312
RCD 1/311/21/4
UOT 1212
CUR 1/241/21
Table A2. Raw data for fuzzy VIKOR.
EN1EN2EN3EN4EN5EN6EN7SO1SO2SO3SO4EC1EC2EC3EC4BO1BO2BO3BO4
Expert 1DP1G.VGVPG.AG.VGPG.PG.G.VGVPAG.VGPA
DP2AG.VGPPG.VPG.VPG.VGVPG.VPG.AAGP
DP3G.VGG.AAVGG.VGAPVGG.AAVGG.PPA
Expert 2 EN1EN2EN3EN4EN5EN6EN7SO1SO2SO3SO4EC1EC2EC3EC4BO1BO2BO3BO4
DP1VGG.pG.G.G.VGAG.AG.VGG.VPPG.VGAG.
DP2AG.G.AG.VPVPG.PVGG.VPG.VPG.AAAG.
DP3G.VGVGG.VGAG.VGAPVGG.AAG.G.PPVG
EN1EN2EN3EN4EN5EN6EN7SO1SO2SO3SO4EC1EC2EC3EC4BO1BO2BO3BO4
Expert 3DP1VGVGAAVGG.VGPG.G.G.G.VGG.G.G.GPG.
DP2G.G.VGPVPG.PG.VPG.VGG.G.G.G.AAPVP
DP3G.VGG.AG.VGG.G.AG.VGAPAVGAPGA
Table A3. Computational matrix for fuzzy VIKOR.
EN1EN2EN3EN4EN5EN6EN7SO1SO2SO3SO4EC1EC2EC3EC4BO1BO2BO3BO4
DP17.897.893.337.116.677.008.673.787.005.007.007.447.891.335.007.006.673.786.22
DP25.787.008.673.784.115.002.117.002.117.447.892.117.003.677.005.005.005.004.11
DP37.008.677.445.786.677.115.007.895.784.568.676.224.225.007.896.223.004.566.22
Xi+7.898.678.677.116.677.118.673.787.007.448.677.447.895.007.897.006.675.006.22
Xi-5.787.003.333.784.115.002.117.892.114.567.002.114.221.335.005.003.003.784.11
Si
DP10.000.050.320.000.000.000.000.000.000.140.240.000.000.210.250.000.000.180.00
DP20.340.100.000.230.070.080.170.130.110.000.110.200.080.080.080.430.110.000.16
DP30.140.000.070.090.000.000.090.170.030.170.000.050.350.000.000.170.230.060.00
Table A4. Qi value for each dairy plant in every aspect.
OverallBOECSOEN
DP10.3030.4150.6651.0001.000
DP20.7501.0000.0000.2930.269
DP30.0000.0200.6970.0000.000
Table A5. Demographic profile of experts.
ExpertiseDesignationExperienceGander
Expert 1Supply chain managementProfessor18Male
Expert 2Warehouse managementProduction manager16Female
Expert 3ProcurementProcurement officer10Female
Expert 4Supply chain managementProfessor17Male
Expert 5MarketingSales and marketing manager17Male
Expert 6Sustainable developmentProfessor15Male
Expert 7Waste managementProduction engineer17Female
Expert 8Performance assessmentProfessor17Female
Expert 9 *Sustainable developmentProduction manager16Female
Expert 10 *Waste managementExecutive officer17Male
Expert 11Sustainable developmentProfessor18Male
Expert 12ProcurementProcurement officer13Male
Expert 13Supply chain managementProfessor20Male
Expert 14MarketingSales and marketing manager13Male
Expert 15Human resourceHuman resource manager17Female
Expert 16Waste managementProfessor14Female
Expert 17Sustainable developmentProfessor14Female
Expert 18Supply chain managementProfessor18Female
Expert 19MarketingSales and marketing manager18Male
Expert 20 *Sustainable developmentExecutive officer16Male
Expert 21Production planningProduction manager12Female
Expert 22Quality managementProcurement officer14Female
Expert 23Supply chain managementProfessor14Male
Expert 24Sustainable developmentProfessor18Female
Expert 25Waste managementProduction manager14Male
Expert 26Supplier selectionProduction manager15Male
Expert 27 #Sustainable developmentCooperative member15Male
Expert 28 #Production planningCooperative member12Male
Expert 29 #Sustainable developmentCooperative member14Male
Note: * marked experts denote experts involved in F-AHP experts panel as well as Delphi study, # marked experts are those who participated in F-VIKOR data collection belong to dairy cooperative society
Figure A1. The dairy cooperative society framework. Note: Orange-colored process shows system boundary where the present study focused.
Sustainability 15 11555 g0a1
Blank Questionnaire Consent Form
Dear Sir/Madam,
Warm greetings of the day! We hope this message finds you well. We are reaching out to you to seek your valuable expertise and opinion on our questionnaire. Our research focuses on assessing the sustainable performance of the Indian dairy industry. We would like to share with you a list of sustainable key performance indicators (KPIs) that we have compiled for creating our performance assessment tool.
We greatly appreciate your expertise and kindly request your response to help us in this endeavor. Please rest assured that we will treat your personal details with the utmost confidentiality and they will never be shared with anyone. Your expertise opinion is of immense value to us, and we encourage you to provide your insights without any hesitation.
Thank you in advance for considering our invitation, and we look forward to receiving your valuable input.
Best regards,
Authors’ Team

Appendix A.1. Questionnaire for Performance Criteria Selection

Personal detail
What is your name:
Please specify your gender:
Where are you working:
How much experience do you have in dairy sector:
At which position you are working:
Please rate the sub-criteria that is useful for sustainable performance assessment of dairy industry on 1 to 5 1 indicates highly disagree and 5 indicates highly agree
Sustainable KPIs for Dairy IndustryQuestionRate between 1–5
12345
Effective business and operations (EBO)Effective business and operation is an important indicators for sustainable performance assessment (SPA) of dairy industry
Use of Quality standards and HACCP (UQS)Use of Quality standards and HACCP is an important indicator for SPA of dairy industry
Green supplier (GSR)Green suppliers an important indicator for SPA of dairy industry
Diversity of market Diversity of market is an important indicator for SPA of dairy industry
Cold chain effectiveness (CCE)Cold chain effectiveness is an important indicator for SPA of dairy industry
Responsiveness to customer demand (RCD)Responsiveness to customer demand is an important indicator for SPA of dairy industry
Use of Technology (UOT)Use of Technology is an important indicator for SPA of dairy industry
Waste management (WMT)Waste management is an important indicator for SPA of dairy industry
Research and development (RND)Research and development is an important indicators for SPA of dairy industry
Average wages per person per year Average wages per person per year is an important indicator for SPA of dairy industry
Average supply chain cost (ASC)Average supply chain cost (ASC)
Chilling Capacity Chilling Capacity is an important indicator for SPA of dairy industry
Capacity utilization rate (CUR)Capacity utilization rate is an important indicator for SPA of dairy industry
Effective number of Refrigerated carriers Effective number of Refrigerated carriers is an important indicator for SPA of dairy industry
Traceability (TRA)Traceability is an important indicator for SPA of dairy industry
GHG emission (GHG)GHG emission is an important indicator for SPA of dairy industry
Hazard substance exposure Hazard substance exposure is an important indicator for SPA of dairy industry
Gender equity (GEQ)Gender equity is an important indicator for SPA of dairy industry
Employment generation (EGR)Employment generation is an important indicator for SPA of dairy industry
Donation to charity (DC)Donation to charity is an important indicator for SPA of dairy industry
Utilization of modern environment management system (MEM)Utilization of modern environment management system is an important indicator for SPA of dairy industry
Utilization of green and recycled material (GER)Utilization of green and recycled material is an important indicator for SPA of dairy industry
workforce utilizationworkforce utilization is an important indicator for SPA of dairy industry
Share of renewable energy (SRE)Share of renewable energy is an important indicator for SPA of dairy industry
Profit sharing (PSH)Profit sharing is an important indicator for SPA of dairy industry
Revenue growth (REG)Revenue growth is an important indicator for SPA of dairy industry
Additional sub criteria you suggested: -.

Appendix A.2. Questionnaire for Performance Criteria and Sub-Criteria Weight Evaluation

Personal detail
What is your name:
Please specify your gender:
Where are you working:
How much experience do you have in dairy sector:
At which position you are working:
1EconomicSocial Business operations
Environmental criteria
2Environmental criteria Social Business operations
Economic
3Environmental criteria EconomicBusiness operations
Social
4Environmental criteria EconomicSocial
Business operations
Business operations
RCDUOTCUR
EBO
EBOUOTCUR
RCD
EBORCDCUR
UOT
EBORCDUOT
CUR
Note: Effective business and operations, EBO; responsiveness to customer demand, RCD; use of technology, UOT; capacity utilization rate, CUR.
Environmental criteria
CCEWMTGHGMEMGRMSRE
GSR
GSRWMTGHGMEMGRMSRE
CCE
CCEGSRGHGMEMGRMSRE
WMT
CCEWMTGSRMEMGRMSRE
GHG
CCEWMTGHGGSRGRMSRE
MEM
CCEWMTGHGMEMGSRSRE
GRM
CCEWMTGHGMEMGRMGSR
SRE
Note: Green supplier, GSR; cold chain effectiveness, CCE; waste management, WMT; GHG emissio n, GHG; utilization of modern environment management system, MEM; utilization of green and recycled material, GRM; share of renewable energy, SRE.
Economic criteria
ASCREGUQS
RND
RNDREGUQS
ASC
ASCRNDUQS
REG
ASCREGRND
UQS
Note: Research and development, RND; average supply chain cost, ASC; revenue growth, REG; use of quality standards and HACCP, UQS.
Social criteria
GEQEGRPSH
TRA
TRAEGRPSH
GEQ
GEQGEQPSH
EGR
GEQEGREGR
PSH
Note: Traceability, TRA; gender equity, GEQ; employment generation, EGR; profit sharing, PSH.

Appendix A.3. Questionnaire for Alternatives Selection through VIKOR

Personal detail
What is your name:
Please specify your gender:
Where are you working:
How much experience do you have in dairy sector:
At which position you are working:
How do you rate Dairy Industry A, Dairy Industry B, and Dairy industry C on the below mentioned sustainable performance indicators in five-point linguistic Likert scale between (Very Poor to Very high).
The linguistic Likert Scale for the performance ranking is: -
VPVery poor
PPoor
AAverage
HHigh
VHVery high
Criteria GSRCCEWMTGHGMEMGRMSRE
Dairy IndustriesDIA
DPB
DPC
Note: Green supplier, GSR; cold chain effectiveness, CCE; waste management, WMT; GHG emission, GHG; utilization of modern environment management system, MEM; utilization of green and recycled material, GRM; share of renewable energy, SRE.
Criteria TRAGEQEGRPSH
Dairy IndustriesDIA
DPB
DPC
Note: Traceability, TRA; gender equity, GEQ; employment generation, EGR; profit sharing, PSH.
Criteria RNDASCREGUQS
Dairy IndustriesDIA
DPB
DPC
Note: Research and development, RND; average supply chain cost, ASC; revenue growth, REG; use of quality standards and HACCP, UQS.
Criteria EBORCDUOTCUR
Dairy IndustriesDIA
DPB
DPC
Note: Effective business and operations, EBO; responsiveness to customer demand, RCD; use of technology, UOT; capacity utilization rate, CUR.

References

  1. Matthews, L.; Power, D.; Touboulic, A.; Marques, L. Building Bridges: Toward Alternative Theory of Sustainable Supply Chain Management. J. Supply Chain Manag. 2016, 52, 82–94. [Google Scholar] [CrossRef] [Green Version]
  2. Pagell, M.; Shevchenko, A. Why Research in Sustainable Supply Chain Management Should Have No Future. J. Supply Chain Manag. 2014, 50, 44–55. [Google Scholar] [CrossRef]
  3. Gayá, P.; Phillips, M. Imagining a Sustainable Future: Eschatology, Bateson’s Ecology of Mind and Arts-Based Practice. Organization 2016, 23, 803–824. [Google Scholar] [CrossRef] [Green Version]
  4. Prasad, P.; Elmes, M. In the Name of the Practical: Unearthing the Hegemony of Pragmatics in the Discourse of Environmental Management. J. Manag. Stud. 2005, 42, 845–867. [Google Scholar] [CrossRef]
  5. Cannas, V.G.; Ciccullo, F.; Pero, M.; Cigolini, R. Sustainable Innovation in the Dairy Supply Chain: Enabling Factors for Intermodal Transportation. Int. J. Prod. Res. 2020, 58, 7314–7333. [Google Scholar] [CrossRef]
  6. Gerbens-Leenes, P.W.; Moll, H.C.; Schoot Uiterkamp, A.J.M. Design and Development of a Measuring Method for Environmental Sustainability in Food Production Systems. Ecol. Econ. 2003, 46, 231–248. [Google Scholar] [CrossRef]
  7. De Burgos Jiménez, J.; Céspedes, J.J. Environmental Performance as an Operations Objective. Int. J. Oper. Prod. Manag. 2001, 21, 1553–1572. [Google Scholar] [CrossRef]
  8. Ilbahar, E.; Kahraman, C.; Cebi, S. Evaluation of Sustainable Energy Planning Scenarios with a New Approach Based on FCM, WASPAS and Impact Effort Matrix. Environ. Dev. Sustain. 2022. [Google Scholar] [CrossRef]
  9. Sarkis, J. Manufacturing’s Role in Corporate Environmental Sustainability Concerns for the New Millennium. Int. J. Oper. Prod. Manag. 2001, 21, 666–686. [Google Scholar] [CrossRef]
  10. Angell, L.C.; Klassen, R.D. Integrating Environmental Issues into the Mainstream: An Agenda for Research in Operations Management. J. Oper. Manag. 1999, 17, 575–598. [Google Scholar] [CrossRef]
  11. Tasdemir, C.; Gazo, R.; Quesada, H.J. Sustainability Benchmarking Tool (SBT): Theoretical and Conceptual Model Proposition of a Composite Framework. Environ. Dev. Sustain. 2020, 22, 6755–6797. [Google Scholar] [CrossRef]
  12. Kumar, M.; Sharma, M.; Raut, R.D.; Mangla, S.K.; Choubey, V.K. Performance Assessment of Circular Driven Sustainable Agri-Food Supply Chain towards Achieving Sustainable Consumption and Production. J. Clean. Prod. 2022, 372, 133698. [Google Scholar] [CrossRef]
  13. Hendiani, S.; Sharifi, E.; Bagherpour, M.; Ghannadpour, S.F. A Multi-Criteria Sustainability Assessment Approach for Energy Systems Using Sustainability Triple Bottom Line Attributes and Linguistic Preferences. Environ. Dev. Sustain. 2020, 22, 7771–7805. [Google Scholar] [CrossRef]
  14. Carter, C.R.; Rogers, D.S. A Framework of Sustainable Supply Chain Management: Moving toward New Theory. Int. J. Phys. Distrib. Logist. Manag. 2008, 38, 360–387. [Google Scholar] [CrossRef]
  15. Kumar, M.; Kumar Choubey, V.; Deepak, A.; Gedam, V.V.; Raut, R.D. Life Cycle Assessment (LCA) of Dairy Industry: A Case Study of North India. J. Clean. Prod. 2021, 326, 129331. [Google Scholar] [CrossRef]
  16. Aziz, E. The Impact of COVID-19 on Food and Agriculture in Asia and the Pacific and FAO’s Response. In Proceedings of the 35th Session of the Regional Conference for Asia and the Pacific, Virtual, 1–4 September 2020; pp. 1–16. [Google Scholar]
  17. Ladha-Sabur, A.; Bakalis, S.; Fryer, P.J.; Lopez-Quiroga, E. Mapping Energy Consumption in Food Manufacturing. Trends Food Sci. Technol. 2019, 86, 270–280. [Google Scholar] [CrossRef]
  18. Soetan, K.O.; Olaiya, C.O.; Oyewole, O.E. The Importance of Mineral Elements for Humans, Domestic Animals and Plants: A Review. African J. Food Sci. 2010, 4, 200–222. [Google Scholar]
  19. Gerosa, S.; Skoet, J. Milk Availability: Trends in Production and Demand and Medium-Term Outlook; Food and Agriculture Organization of the United Nations (FAO): Rome, Italy, 2012. [Google Scholar]
  20. OECD/FAO. Chapter 7. Dairy and Dairy Products. In OECD-FAO Agricultural Outlook 2018–2027; Food and Agriculture Organization of the United Nations (FAO): Rome, Italy, 2018. [Google Scholar]
  21. Lacour, C.; Seconda, L.; Allès, B.; Hercberg, S.; Langevin, B.; Pointereau, P.; Lairon, D.; Baudry, J.; Kesse-Guyot, E. Environmental Impacts of Plant-Based Diets: How Does Organic Food Consumption Contribute to Environmental Sustainability? Front. Nutr. 2018, 5, 8. [Google Scholar] [CrossRef] [Green Version]
  22. Fehér, A.; Gazdecki, M.; Véha, M.; Szakály, M.; Szakály, Z. A Comprehensive Review of the Benefits of and the Barriers to the Switch to a Plant-Based Diet. Sustainability 2020, 12, 4136. [Google Scholar] [CrossRef]
  23. Scarborough, P.; Appleby, P.N.; Mizdrak, A.; Briggs, A.D.M.; Travis, R.C.; Bradbury, K.E.; Key, T.J. Dietary Greenhouse Gas Emissions of Meat-Eaters, Fish-Eaters, Vegetarians and Vegans in the UK. Clim. Change 2014, 125, 179–192. [Google Scholar] [CrossRef] [Green Version]
  24. Kazancoglu, Y.; Ekinci, E.; Mangla, S.K.; Sezer, M.D.; Kayikci, Y. Performance Evaluation of Reverse Logistics in Food Supply Chains in a Circular Economy Using System Dynamics. Bus. Strateg. Environ. 2020, 30, 71–91. [Google Scholar] [CrossRef]
  25. Ivo de Carvalho, M.; Relvas, S.; Barbosa-Póvoa, A.P. A Roadmap for Sustainability Performance Assessment in the Context of Agri-Food Supply Chain. Sustain. Prod. Consum. 2022, 34, 565–585. [Google Scholar] [CrossRef]
  26. Noya, L.I.; Vasilaki, V.; Stojceska, V.; González-García, S.; Kleynhans, C.; Tassou, S.; Moreira, M.T.; Katsou, E. An Environmental Evaluation of Food Supply Chain Using Life Cycle Assessment: A Case Study on Gluten Free Biscuit Products. J. Clean. Prod. 2018, 170, 451–461. [Google Scholar] [CrossRef]
  27. Cecchini, L.; Venanzi, S.; Pierri, A.; Chiorri, M. Environmental Efficiency Analysis and Estimation of CO2 Abatement Costs in Dairy Cattle Farms in Umbria (Italy): A SBM-DEA Model with Undesirable Output. J. Clean. Prod. 2018, 197, 895–907. [Google Scholar] [CrossRef]
  28. Houssard, C.; Maxime, D.; Benoit, S.; Pouliot, Y.; Margni, M. Comparative Life Cycle Assessment of Five Greek Yogurt Production Systems: A Perspective beyond the Plant Boundaries. Sustainability 2020, 12, 9141. [Google Scholar] [CrossRef]
  29. Mohammed, A.; Harris, I.; Govindan, K. A Hybrid MCDM-FMOO Approach for Sustainable Supplier Selection and Order Allocation. Int. J. Prod. Econ. 2019, 217, 171–184. [Google Scholar] [CrossRef]
  30. Chen, Y.; Wang, S.; Yao, J.; Li, Y.; Yang, S. Socially Responsible Supplier Selection and Sustainable Supply Chain Development: A Combined Approach of Total Interpretive Structural Modeling and Fuzzy Analytic Network Process. Bus. Strateg. Environ. 2018, 27, 1708–1719. [Google Scholar] [CrossRef]
  31. Moazzam, M.; Akhtar, P.; Garnevska, E.; Marr, N.E. Measuring Agri-Food Supply Chain Performance and Risk through a New Analytical Framework: A Case Study of New Zealand Dairy. Prod. Plan. Control 2018, 29, 1258–1274. [Google Scholar] [CrossRef]
  32. Kazancoglu, Y.; Sagnak, M.; Mangla, S.K.; Sezer, M.D.; Pala, M.O. A Fuzzy Based Hybrid Decision Framework to Circularity in Dairy Supply Chains through Big Data Solutions. Technol. Forecast. Soc. Change 2021, 170, 120927. [Google Scholar] [CrossRef]
  33. Gupta, H.; Kumar, A.; Wasan, P. Industry 4.0, Cleaner Production and Circular Economy: An Integrative Framework for Evaluating Ethical and Sustainable Business Performance of Manufacturing Organizations. J. Clean. Prod. 2021, 295, 126253. [Google Scholar] [CrossRef]
  34. Kumar, S.; Raut, R.D.; Nayal, K.; Kraus, S.; Yadav, V.S.; Narkhede, B.E. To Identify Industry 4.0 and Circular Economy Adoption Barriers in the Agriculture Supply Chain by Using ISM-ANP. J. Clean. Prod. 2021, 293, 126023. [Google Scholar] [CrossRef]
  35. Sufiyan, M.; Haleem, A.; Khan, S.; Khan, M.I. Evaluating Food Supply Chain Performance Using Hybrid Fuzzy MCDM Technique. Sustain. Prod. Consum. 2019, 20, 40–57. [Google Scholar] [CrossRef]
  36. Bloemhof, J.M.; van der Vorst, J.G.A.J.; Bastl, M.; Allaoui, H. Sustainability Assessment of Food Chain Logistics. Int. J. Logist. Res. Appl. 2015, 18, 101–117. [Google Scholar] [CrossRef]
  37. Jouzdani, J.; Govindan, K. On the Sustainable Perishable Food Supply Chain Network Design: A Dairy Products Case to Achieve Sustainable Development Goals. J. Clean. Prod. 2021, 278, 123060. [Google Scholar] [CrossRef]
  38. Negri, M.; Cagno, E.; Colicchia, C.; Sarkis, J. Integrating Sustainability and Resilience in the Supply Chain: A Systematic Literature Review and a Research Agenda. Bus. Strateg. Environ. 2021, 30, 2858–2886. [Google Scholar] [CrossRef]
  39. Sharma, V.; Raut, R.D.; Mangla, S.K.; Narkhede, B.E.; Luthra, S.; Gokhale, R. A Systematic Literature Review to Integrate Lean, Agile, Resilient, Green and Sustainable Paradigms in the Supply Chain Management. Bus. Strateg. Environ. 2021, 30, 1191–1212. [Google Scholar] [CrossRef]
  40. Dev, N.K.; Shankar, R.; Qaiser, F.H. Industry 4.0 and Circular Economy: Operational Excellence for Sustainable Reverse Supply Chain Performance. Resour. Conserv. Recycl. 2020, 153, 104583. [Google Scholar] [CrossRef]
  41. Miranda-Ackerman, M.A.; Azzaro-Pantel, C.; Aguilar-Lasserre, A.A.; Bueno-Solano, A.; Arredondo-Soto, K.C. Green Supplier Selection in the Agro-Food Industry with Contract Farming: A Multi-Objective Optimization Approach. Sustainability 2019, 11, 7017. [Google Scholar] [CrossRef] [Green Version]
  42. Kumar, A.; Mangla, S.K.; Kumar, P.; Karamperidis, S. Challenges in Perishable Food Supply Chains for Sustainability Management: A Developing Economy Perspective. Bus. Strateg. Environ. 2020, 29, 1809–1831. [Google Scholar] [CrossRef]
  43. Qorri, A.; Mujkić, Z.; Kraslawski, A. A Conceptual Framework for Measuring Sustainability Performance of Supply Chains. J. Clean. Prod. 2018, 189, 570–584. [Google Scholar] [CrossRef]
  44. Cicatiello, C.; Franco, S.; Pancino, B.; Blasi, E.; Falasconi, L. The Dark Side of Retail Food Waste: Evidences from in-Store Data. Resour. Conserv. Recycl. 2017, 125, 273–281. [Google Scholar] [CrossRef]
  45. Choubey, V.K.; Kumar, M. Modelling the Interaction among the Key Performance Indicators of Sustainable Supply Chain in Perspective of Perishable Food. Int. J. Logist. Syst. Manag. 2023, 45, 108–130. [Google Scholar] [CrossRef]
  46. Govindan, K.; Khodaverdi, R.; Jafarian, A. A Fuzzy Multi Criteria Approach for Measuring Sustainability Performance of a Supplier Based on Triple Bottom Line Approach. J. Clean. Prod. 2013, 47, 345–354. [Google Scholar] [CrossRef]
  47. Kumar, M.; Choubey, V.K. Analysis of Sustainable Performance Indicators in Dairy Supply Chain Using Fuzzy-DEMATEL. Int. J. Logist. Syst. Manag. 2022, 1, 1. [Google Scholar] [CrossRef]
  48. Morrison-Saunders, A.; Pope, J. Conceptualising and Managing Trade-Offs in Sustainability Assessment. Environ. Impact Assess. Rev. 2013, 38, 54–63. [Google Scholar] [CrossRef] [Green Version]
  49. Waas, T.; Hugé, J.; Block, T.; Wright, T.; Benitez-Capistros, F.; Verbruggen, A. Sustainability Assessment and Indicators: Tools in a Decision-Making Strategy for Sustainable Development. Sustainability 2014, 6, 5512–5534. [Google Scholar] [CrossRef] [Green Version]
  50. Moldavska, A.; Welo, T. A Holistic Approach to Corporate Sustainability Assessment: Incorporating Sustainable Development Goals into Sustainable Manufacturing Performance Evaluation. J. Manuf. Syst. 2019, 50, 53–68. [Google Scholar] [CrossRef]
  51. Kumar, M.; Choubey, V.K.; Raut, R.D.; Jagtap, S. Enablers to Achieve Zero Hunger through IoT and Blockchain Technology and Transform the Green Food Supply Chain Systems. J. Clean. Prod. 2023, 405, 136894. [Google Scholar] [CrossRef]
  52. Uygun, Ö.; Dede, A. Performance Evaluation of Green Supply Chain Management Using Integrated Fuzzy Multi-Criteria Decision Making Techniques. Comput. Ind. Eng. 2016, 102, 502–511. [Google Scholar] [CrossRef]
  53. Stohler, M.; Rebs, T.; Brandenburg, M. Toward the Integration of Sustainability Metrics into the Supply Chain Operations Reference (SCOR) Model. In Greening of Industry Networks Studies; Springer: Berlin/Heidelberg, Germany, 2018; Volume 5, pp. 49–60. [Google Scholar]
  54. Stranieri, S.; Riccardi, F.; Meuwissen, M.P.M.; Soregaroli, C. Exploring the Impact of Blockchain on the Performance of Agri-Food Supply Chains. Food Control 2021, 119, 107495. [Google Scholar] [CrossRef]
  55. Yontar, E.; Ersöz, S. Investigation of Food Supply Chain Sustainability Performance for Turkey’s Food Sector. Front. Sustain. Food Syst. 2020, 4, 68. [Google Scholar] [CrossRef]
  56. Gold, S.; Hahn, R.; Seuring, S. Sustainable Supply Chain Management in “Base of the Pyramid” Food Projects-A Path to Triple Bottom Line Approaches for Multinationals? Int. Bus. Rev. 2013, 22, 784–799. [Google Scholar] [CrossRef]
  57. Farrukh, A.; Mathrani, S.; Sajjad, A. A Natural Resource and Institutional Theory-Based View of Green-Lean-Six Sigma Drivers for Environmental Management. Bus. Strateg. Environ. 2022, 31, 1074–1090. [Google Scholar] [CrossRef]
  58. Mangla, S.K.; Sharma, Y.K.; Patil, P.P.; Yadav, G.; Xu, J. Logistics and Distribution Challenges to Managing Operations for Corporate Sustainability: Study on Leading Indian Diary Organizations. J. Clean. Prod. 2019, 238, 117620. [Google Scholar] [CrossRef]
  59. Vinodh, S.; Varadharajan, A.R.; Subramanian, A. Application of Fuzzy VIKOR for Concept Selection in an Agile Environment. Int. J. Adv. Manuf. Technol. 2013, 65, 825–832. [Google Scholar] [CrossRef]
  60. Kumar, M.; Raut, R.D.; Sharma, M.; Choubey, V.K.; Paul, S.K. Enablers for Resilience and Pandemic Preparedness in Food Supply Chain. Oper. Manag. Res. 2022, 15, 1198–1223. [Google Scholar] [CrossRef]
  61. Burksiene, V.; Dvorak, J.; Burbulyte-Tsiskarishvili, G. Sustainability and sustainability marketing in competing for the title of European Capital of Culture. Organizacija 2018, 51, 66–78. [Google Scholar] [CrossRef] [Green Version]
  62. Dvorak, J.; Razova, I. Empirical validation of blue ocean strategy sustainability in an international environment. Found. Manag. 2018, 10, 143–162. [Google Scholar] [CrossRef] [Green Version]
  63. Mills, D.; Pudney, S.; Pevcin, P.; Dvorak, J. Evidence-based public policy decision-making in smart cities: Does extant theory support achievement of city sustainability objectives? Sustainability 2021, 14, 3. [Google Scholar] [CrossRef]
Figure 1. Three-phase research methodology for sustainability assessment of dairy supply chain.
Sustainability 15 11555 g001
Figure 2. Sustainable performance assessment framework.
Sustainability 15 11555 g002
Figure 3. Variation in rank through F-VIKOR for each value of μ.
Sustainability 15 11555 g003
Figure 4. Rank of each dairy industry from F-VIKOR and F-TOPSIS and closeness coefficient.
Sustainability 15 11555 g004
Figure 5. Rank of each DPI on each criteria of sustainability.
Sustainability 15 11555 g005
Table 1. Identified Risks factors at each step of the dairy supply chain for sustainability.
StageRisk FactorDescription
FarmerLand DegradationFarmland can become less sustainable over the long term due to soil erosion, deforestation, and excessive pesticide usage.
Climate ChangeClimate change: The production and quality of milk can be impacted by more unpredictable weather patterns, such as droughts or floods.
Animal HealthInfections and diseases that affect dairy animals might spread, resulting in lower productivity and more frequent usage of antibiotics.
Milk Collection and Processing:Energy UsePoor methods for gathering and processing milk can result in higher energy use and greenhouse gas emissions.
Water UsageDuring the production of milk, inefficient water management and excessive water use can put pressure on the local water supply.
Food Safety Mishandling or contamination of milk during collection and processing can endanger consumer health and tarnish the dairy industry’s reputation.
Packaging and Transportation:Packaging Waste Packaging waste, such as plastic containers improperly disposed of, can cause environmental damage.
Carbon FootprintExcessive long-distance shipping and ineffective transportation operations can raise greenhouse gas emissions and carbon footprint.
Supply Chain Transparency It may be challenging to maintain ethical and sustainable practices throughout the supply chain in the absence of traceability and monitoring tools.
Consumer and Retail:Food Waste: Dairy products that are improperly handled, stored, or that have expired can produce a lot of food waste.
Consumer AwarenessConsumer demand for sustainable goods may be impacted by consumers’ ignorance or indifference to sustainable dairy producing processes.
Pricing Pressure Market dynamics and price pressures may force businesses to slash costs in ways that undermine sustainability initiatives.
Table 2. Performance indicators with description and source.
Performance Indicators PIsDescriptionSource
Effective business and operations (EBO)Business effectiveness and operations play a significant role in achieving a balance among the sustainable triple bottom-line approach. Optimal business operations help the environment, society, and economy.[45]
Use of Quality standards and HACCP (UQS)The use of high-quality standards and HACCP standards in the food system helps to lower food wastage along with high satisfaction to the consumer.[12]
Green supplier (GSR)The selection of green suppliers is a crucial step in reaching the objective of sustainable development since it helps to minimize emissions from the very beginning of the supply chain.[46]
Cold chain effectiveness (CCE)The efficacy of the cold chain plays a vital role in the supply chain for dairy products since it gives the product longer shelf life, ensures optimum emissions from refrigerated vehicles, and reduces waste of transportation.[12]
Responsiveness to customer demand (RCD)Responsiveness to customer demand helps to create long-lasting relationships with customers, timely delivery of a product, and an increase in demand.[46]
Use of Technology (UOT)The dairy industry has recently realized the importance of applying technology to automate production, maintain hygienic standards, fulfil orders from customers, deliver products on time, and monitor emissions in real time.[12,46]
Waste management (WMT)Waste management metrics measure how well SC’s waste management practices dispose of hazardous and chemical waste for SCP, aiding in the achievement of SDG 12.4.[12]
Research and development (RND)Nowadays, sustainable growth is absolutely necessary inside the company to produce an eco-friendly product to maintain our ecosystem by reducing environmental effects and harmful food ingredients, so research and development will play a significant role.[12,46]
Average supply chain cost (ASC)Total supply chain costs are the leading indicator of any supply chain performance. Various costs are associated with the supply chain cost, such as procurement cost, holding cost, shortage cost, and transportation cost. Need to use sustainable procurement and transportation network.[47]
Capacity utilization rate (CUR)Proper use of the company’s warehouse, shop floor, delivery vans, and other facilities within the firm is important.[47]
Traceability (TRA)Traceability is a cutting-edge technology that is often used for monitoring and tracking to improve product security and safety. It allows the consumer to track their order details and delivery of the product.[46]
GHG emission (GHG)By calculating equivalent carbon emissions, greenhouse gas emissions are the key indicator for monitoring and mitigating environmental damage.[12]
Gender equity (GEQ)Gender equity in the business organization is recommended to take advantage of experience from a diverse set of people. With gender equity, a firm’s social performance is improved.[46]
Employment generation (EGR)Employment generation is an important social measurement that is used to assess a firm’s social performance based on its ability to generate employment.[12]
Utilization of modern environment management system (MEM)Another strategy for tracking and managing the environmental impact/emissions generated by the firm is to use a modern environment management system. The MEM system enables real-time monitoring of the firm’s environmental emissions, which can then be readily managed and used to develop reduction strategies to improve environmental performance.[47]
Utilization of green and recycled material (GER)The use of green and recyclable materials in the dairy industry, particularly packaging materials, helps to reduce waste and GHG emissions, hence improving environmental performance.[47]
Share of renewable energy (SRE)The utilization of renewable energy in the dairy firm is important to lower GHG emissions.[12]
Profit sharing (PSH)Profit sharing among farmers and suppliers is a key factor in improving the social performance of the dairy business. Because the dairy sector is so reliant on farmers and vice versa, maximal profit sharing is critical to improving social performance.[12]
Revenue growth (REG)Continuous revenue expansion is also an important component of dairy enterprises in order to increase economic performance.[12]
Table 3. Fuzzy scale for AHP.
ScaleLMUReciprocalLMU
1111
21231/21/31/21
32341/31/41/31/2
43451/41/51/41/3
54561/51/61/51/4
65671/61/71/61/5
76781/71/81/71/6
87891/81/91/81/7
99991/91/91/91/9
Table 4. Fuzzy scale for VIKOR.
Lower (L)Medium (M)Upper (U)
Very poor (VP)113
Poor (P)135
Average (A)357
Good (H)579
Very good (VH)799
Table 5. The Delphi analysis.
Performance IndicatorsSymbolAverage ScoreDecision
Effective business and operations EBO3.1A
Use of quality standards and HACCPUQS3.1A
Green supplierGSR3.3A
Diversity of market MD2.4R
Cold chain effectivenessCCE3.1A
Responsiveness to customer demandRCD3.3A
Use of technologyUOT3.55A
Waste managementWMT3.1A
Research and developmentRND3.2A
Average wages per person per year WPP2.7R
Average supply chain costASC3.05A
Chilling capacity CC2.75R *
Capacity utilization rateCUR3.35A
Effective number of refrigerated carriers ERC2.75R *
TraceabilityTRA3.1A
GHG emission GHG3.15A
Hazard substance exposure HSE2.7R
Gender equityGEQ3.15A
Employment generationEGR3.25A
Donation to charity (DC)EMS2.7R
Utilization of modern environment management systemMEM3.05A
Utilization of green and recycled materialGRM3.05A
Workforce utilizationCR232.7R
Share of renewable energySRE3.1A
Profit sharingPSH3.95A
Revenue growthREG3.25A
Notes: * in decision column shows indicators that are rejected but included in study indirectly, while bold signifies rejection.
Table 6. Weight obtained from F-AHP and sensitivity result.
IndicatorsSub Criteria Sub-Criteria Local WeightSub-Criteria Local RankCriteriaCriteria RankSub-Criteria Global WeightSub-Criteria Global RankEigenvalue (λ)CI
Effective business and operations EBO0.3401 0.06944.200.08
Capacity utilization rate CUR0.1084Business operations
(BO)
0.02219
Use of technologyUOT0.3072 0.2040.0638
Responsiveness to customer demandRCD0.2453 0.05012
Green supplierGSR0.0787 0.026188.470.05
Cold chain effectivenessCCE0.0806 0.02617
Waste managementWMT0.1653Environment (EN)0.3300.05410
GHG emission GHG0.1722 0.0579
Utilization of modern environment management systemMEM0.1085 0.03614
Utilization of green and recycled materialGRM0.1644 0.05411
Share of renewable energySRE0.2321 0.0772
Research and developmentRND0.2074 0.06364.180.07
Average supply chain costASC0.3361EC
Economic (EC)
0.1031
Revenue growthREG0.2073 0.3060.0636
Use of quality standards and HACCPUQS0.2502 0.0763
TraceabilityTRA0.4231 0.06854.080.03
Gender equityGEQ0.2342Social (SO)0.1600.03713
Employment generationEGR0.1704 0.02716
Profit sharingPSH0.1743 0.02815
Table 7. The F-VIKOR results for sustainable assessment of dairy industries.
SiRiQi (@ μ = 0.5)Rank
DPI11.8113330.3190.269652
DPI22.0718830.4280.753
DPI31.5063320.3450.0596331
S*, R*1.5063320.319
S-, R-2.0718830.428
Disclaimer/Publisher’s Note: The statements, opinions and data contained in all publications are solely those of the individual author(s) and contributor(s) and not of MDPI and/or the editor(s). MDPI and/or the editor(s) disclaim responsibility for any injury to people or property resulting from any ideas, methods, instructions or products referred to in the content.

