Article

Exploring Interacting Effects of Forest Restoration on Wildfire Risk, Hydropower, and Environmental Flows

1
Independent Consultant, Mount Vernon, WA 98274, USA
2
Blue Forest Conservation, Sacramento, CA 95822, USA
3
Department of Civil & Environmental Engineering, University of California, Davis, CA 95616, USA
4
The Nature Conservancy, Sacramento, CA 95811, USA
*
Authors to whom correspondence should be addressed.
Sustainability 2023, 15(15), 11549; https://doi.org/10.3390/su151511549
Submission received: 7 March 2023 / Revised: 3 July 2023 / Accepted: 17 July 2023 / Published: 26 July 2023

Abstract

:
Forest fires in the western U.S. are increasing in size and intensity, partly due to overstocked forests, a legacy of fire exclusion. Forest restoration can mitigate fire severity and improve ecological health, but funding poses challenges to meaningfully scaling restoration efforts. Co-benefits of restoration can expand the funding options for forest management. In particular, streamflow enhancement may justify financial participation from water and hydroelectric utilities and environmental organizations. However, most efforts to estimate the value of this benefit do not account for interacting effects of restoration, fire, and operational constraints, including environmental flows. To address this, we coupled multiple models using generalizable techniques in order to quantify the impact of restoration on fire behavior, water yield, and hydropower generation in a California reservoir system subject to real-world constraints. The modeled results show water yield benefits from treatment alone, with greater benefits accruing with a return of low-intensity fire. Average annual runoff with treatment increases by 1.67 to 1.95 thousand acre-feet (1.5 to 1.8%) depending on the fire scenario, creating up to 2880 MWh and USD 115,000 of annual generation and revenue. These modest but non-negligible impacts could account for 8.2–15.8% of restoration costs, supporting the co-benefits model to drive investment in forest management.

1. Introduction

Across the western United States, unplanned and uncontrolled wildfires in forested regions are growing in frequency, size, and intensity. The increased fire activity is due to both climate change and a legacy of fire exclusion from the landscape over the past two centuries [1,2,3]. The latter has resulted in overstocked landscapes with high fuel load and low variability in vegetation density, both favorable conditions for rapid fire spread. Ecologically focused forest restoration, including fuel reduction, meadow restoration, and native species regeneration, can improve landscape resilience to high-severity fire, increase controllability of fire, and support reintroduction of low-to-moderate fire [2]. However, given the extent of western forested lands at high risk of fire, current funding levels are inadequate to reach the pace and scale of management activities necessary to improve fire response [4,5]. Recent increases in Congressional appropriations for forest restoration represent investments in the single-digit billions of dollars, but estimates on the nationwide need on public lands alone run an order of magnitude higher, conservatively assuming costs of USD 1000 per acre [6,7]. These funding challenges exacerbate other significant hurdles, including lack of skilled human resource capacity and increasingly severe climate conditions that constrain work windows.
Increased attention has recently been given to leveraging economic returns from restoration activities in order to motivate additional investment in these projects. These returns are referred to as “co-”benefits of restoration; in other words, positive impacts separate from—but accruing alongside—the central goals of increased habitat health and resilience to wildfire [8,9,10,11,12,13,14,15,16]. Common co-benefits may include enhanced streamflow, snowpack retention, carbon sequestration, and recreation enhancement.
Of these, impacts to streamflow have potential to leverage additional funds due to the widespread dependence in the western U.S. on water supply from forested areas and the relative ease of quantifying water-related revenue (e.g., [17,18]). Streamflow co-benefits from restoration work may be realized in two ways: as direct, positive changes due to restoration activities (e.g., increased water yield) or in the form of reduced risk of negative impacts resulting from a catastrophic fire (e.g., avoided sediment and debris build-up behind dams). Both the positive direct benefits and avoided negative benefits are the result of disturbance (management or fire or both) that changes vegetation structure and density while also altering soil properties.
Increased water yield is largely the result of reduced water use by vegetation after forest restoration. Restoration activities typically reduce overall fuel loads and range from lighter prescription burns to more intensive mechanical thinning [19,20]. In wetter systems like the central Sierra Nevada of California, the first-order effect of this reduction in vegetation is to lower evapotranspiration, which produces additional run-off, infiltration, or both [18,21,22]. This additional streamflow can translate into direct revenue enhancement for water agencies and hydroelectric utilities.
The potential for forest restoration to positively impact water supply has been previously examined by indirect assessments (e.g., [11,23,24,25,26]) or qualitative reasoning about potential impacts of changed hydrology [10,27,28,29,30]. These approaches highlight the potential for significant monetary benefits, but do not speak to how site-specific benefits may be enhanced or limited by local biophysical, infrastructure, and institutional considerations, which are critical for understanding the actual returns that may justify co-investment for co-benefits.
We address the gap between process-based biophysical studies and consideration of built infrastructure by applying an integrated modeling framework to the French Meadows Restoration Project, an in-progress restoration project in the central Sierra Nevada of California, to demonstrate how the hydrologic benefits of forest management may be quantified for a hydroelectric utility. We focus on enhanced streamflow (the ecosystem service “water yield”) because this first-order effect relies on well-understood ecohydrologic principles and because treatment directly affects hydrologic environmental services, even in the absence of fire. This analysis provides project developers, land managers, and water agencies with improved estimates on the hydropower value of water yield from forest restoration and, thus, the potential of volumetric water benefits to help drive investments in these projects.
To quantify the water yield benefits of the French Meadows Project in an operational context, we construct a complete process-based modeling chain linking restoration vegetation change, fire modeling, ecohydrologic modeling, and a reservoir systems model. We examine the following questions:
  • How does modified vegetation affect water yield under different wildfire occurrence scenarios, including absence of fire?
  • How do changes in water yield impact the ability of a water agency to concurrently achieve hydropower production and enhanced environmental flow goals?
  • How do operational constraints impact the potential for water yield benefits to motivate cost-sharing in forest restoration work?
Our results indicate that the water yield impacts of treatment are small relative to total reservoir inflows but positive and significant in absolute terms for treatment scenarios that include either no or moderate levels of fire. Thus, we find that vegetation treatments can generate sufficient additional water to meet environmental flow goals for our study watershed while still enhancing electricity generation revenue. We also demonstrate that ignoring infrastructure operations and the diminishing marginal returns of water yield can overestimate the generation benefits of treatment.

2. Materials and Methods

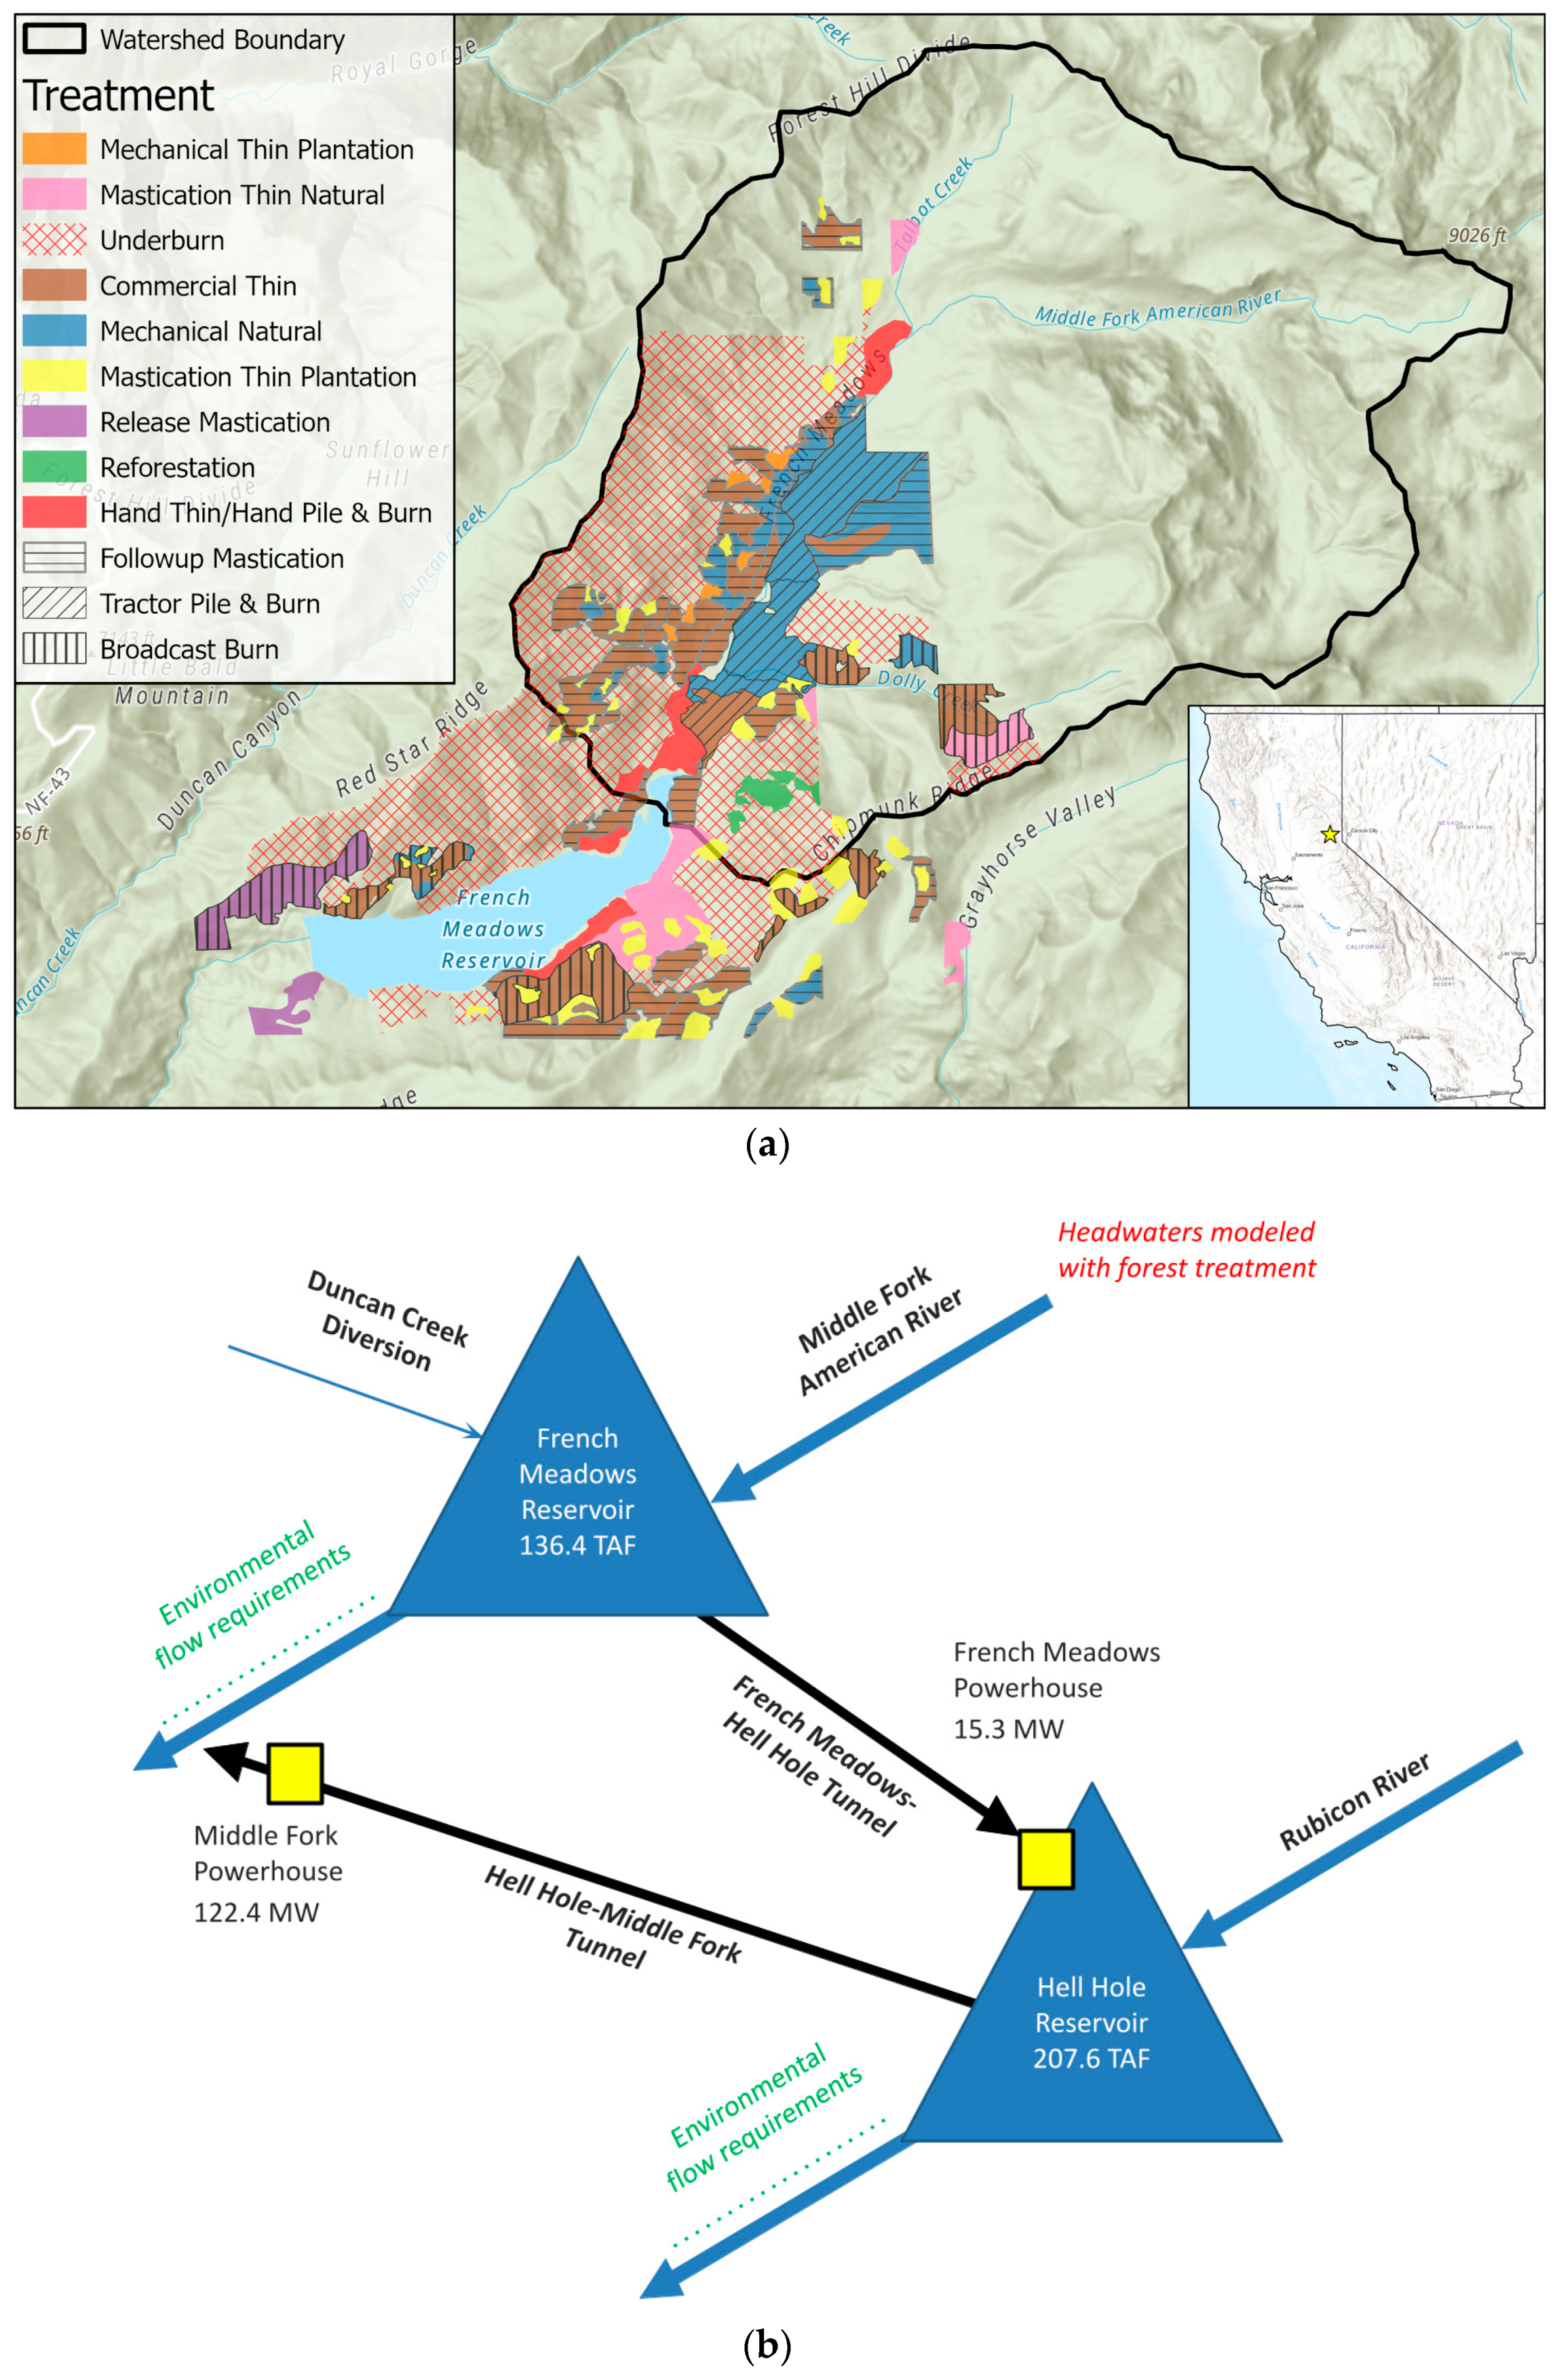
2.1. Study Context: The American River Headwaters

Our study models an in-progress forest restoration project in the headwaters of the American River, on the west side of California’s Sierra Nevada (Figure 1a). A collaborative effort begun in 2015 between the American River Conservancy, The Nature Conservancy, and the U.S. Forest Service, the French Meadows Project aims to reduce the risk of high intensity wildfires, improve forest health and resilience, increase tree species diversity, and restore meadows on 118 square kilometers upstream of the French Meadows Reservoir on the Middle Fork of the American River [31]. It includes a combination of mechanical and hand thinning, mastication, and prescribed burns and ranges from 1595 to 2200 m of elevation (Figure 1a).
Downstream from the project is the French Meadows Reservoir, a 136,400 acre-foot storage reservoir that is part of the Middle Fork American River Project, a large network of reservoirs and hydrologic routing used for flow regulation and hydropower (Figure 1b) (We use acre-feet as the volumetric unit in this study since it is the default unit considered in water policy discourse in California; one acre-foot is equal to approximately 1233 cubic meters). French Meadows is operated by the Placer County Water Agency (PCWA), primarily for hydropower production, while also providing domestic water, irrigation deliveries and meeting release requirements for (ecological) instream flows and recreation (rafting). The Middle Fork American River Project is regulated by the Federal Energy Regulatory Commission (FERC), which sets operating requirements, including environmental flows, during the licensing process.
French Meadows Project activities were designed first and foremost to restore and enhance forest resilience, particularly to the growing risk of catastrophic wildfire, and were not designed to optimize water yield potential. As such, benefits to water supply were not guaranteed, and any materialized supply enhancements are considered additional or co-benefits of the work.

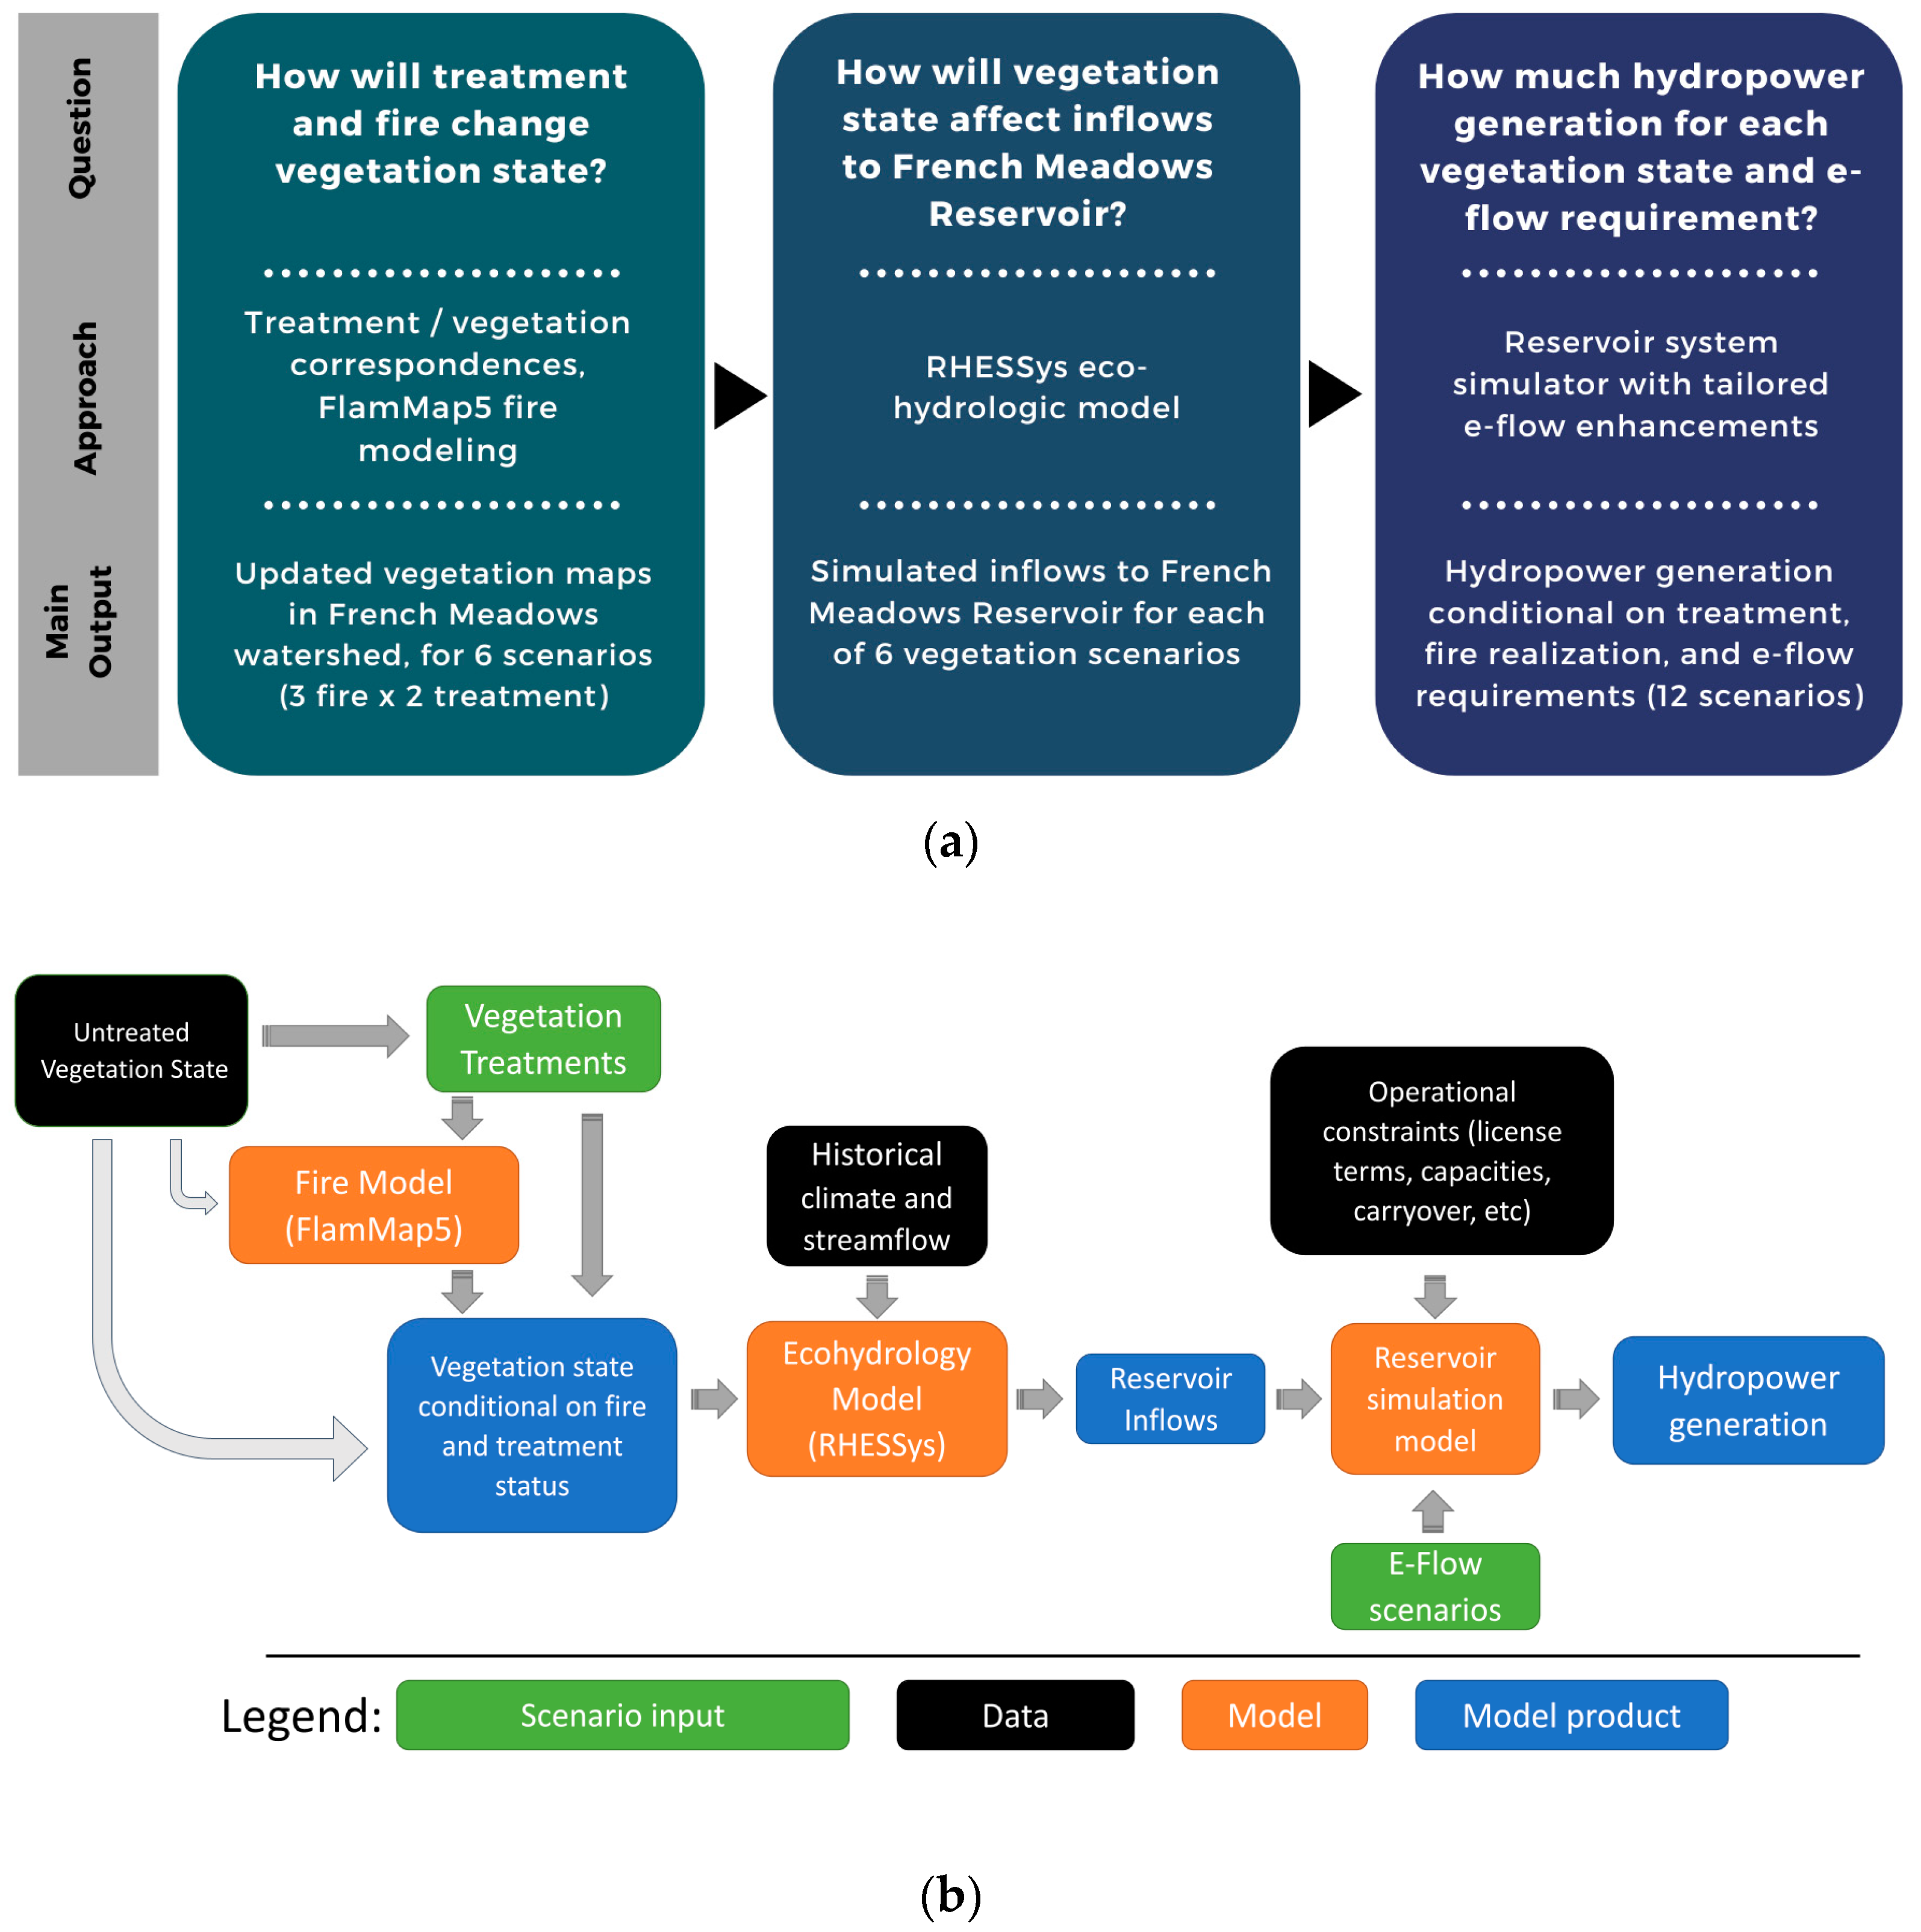
2.2. An Integrated Modeling Workflow to Link Vegetation State to Hydropower and Environmental Flows

Our study examines hydropower generation and intermediate outcomes along three dimensions:
  • Whether restoration efforts are carried out or not (“treated” vs. “untreated”);
  • Severity of fire that occurs (“no fire”, “moderate”, and “extreme”);
  • Level of environmental flow requirements (default or “FERC” versus enhanced or “FERC+”).
The impact of variation along each of these dimensions was assessed at successive steps of an integrated modeling flow (Figure 2). First, the fire and ecohydrologic modeling resulted in six scenarios based on a combination of vegetation treatment state (treatment or no treatment) and fire type (no fire, moderate, or extreme). Next, reservoir modeling results (providing hydroelectric power generation) are run for each of those six scenarios, with and without the enhanced (FERC+) environmental flow scenario, leading to twelve scenarios in total. We briefly describe each model and certain key inputs below, with more complete documentation provided in the Supplementary Materials.

2.3. Vegetation Scenarios for Fire and Ecohydrologic Modeling

Vegetation maps describing untreated conditions were developed from the LANDFIRE database [32] with supplemental forest structure data from recent LiDAR acquisitions. Parameters used to represent the different treatment types within the French Meadows Project were canopy cover fraction and canopy bulk density (for input to the fire modeling) and canopy cover fraction and leaf area index (LAI) (for input to the ecohydrologic modeling). Canopy cover is defined as the fraction of ground covered by forest canopy, while LAI is a dimensionless number defined as the surface area of leaves covering the area of ground. Additional detail is provided in Section I of the Supplementary Materials.
We modeled forest fuel-reduction treatments as they were planned. Within the drainage area upstream of the inlet to French Meadows Reservoir (hereafter “the catchment”), this included prescribed fire (1708 hectares), mechanical thinning of commercial stands where some of the cost is offset by timber sales (525 hectares), thinning of non-commercial stands (392 hectares), mastication (1405 hectares), and hand thinning (103 hectares), for a total of 4132 treatment hectares. Meadow restoration involved thinning and prescribed fire (28 hectares). Fire modeling is affected by the full treatment plan, which extended beyond the drainage area to French Meadows Reservoir (see Figure 1a and Supplementary Materials, Section I), while our focus is on the hydrologic impact only, so aside from fire behavior, we limit our analysis to the catchment itself.

2.4. Fire Modeling

Spatially explicit, wildfire-impacted vegetation scenarios that form the starting point of our modeling chain were drawn from a third-party consultant deliverable developed in support of the environmental permitting process for the French Meadows Project (see Supplementary Materials, Section I for details; [33]). Wildfire behavior metrics were calculated for a moderate-fire scenario and an extreme-fire scenario using FlamMap5, a fire behavior mapping and analysis program that computes potential fire behavior characteristics (spread rate, flame length, fireline intensity, among others) over a landscape for probabilistic weather and fuel moisture conditions [34]. The fire start locations were generated based on the relative density of historical wildfire occurrences (wildfires greater than 10 acres in size that occurred from 1992–2015) [35].
FlamMap5 was run stochastically and generated 100,000 fire perimeters. Because statistical runs of the ecohydrologic and the reservoir models were not feasible, we implemented a method to convert the FlamMap5 statistical summaries of fire events (burn probability and canopy fraction burned) to representative fire polygons and spatially explicit inputs for the ecohydrologic model (see Supplementary Materials, Section I). The final results from this process were four spatially explicit maps of canopy fraction burned: one each for a representative moderate fire and a representative extreme fire under treated and untreated conditions.

2.5. Ecohydrologic Modeling

The six vegetation states (including the no-fire scenario) determined by treatment and fire modeling were used as inputs to a RHESSys ecohydrologic model of the watershed. RHESSys (Regional Hydro-Ecologic Simulation System) is a basin-scale modeling framework of the storage and fluxes of water and nutrients [36]. RHESSys has a hierarchical spatial structure that incorporates a vegetation stratum, landscape patch, meteorological zone, and hillslope within a basin. Spatial inputs of elevation, soil, and vegetation are driven by a meteorological time-series of temperature and precipitation to produce outputs of evapotranspiration and stream runoff at a daily timestep. RHESSys has been previously used in applications of forest ecosystems, montane watersheds, and reservoir management [37,38,39]. Due to the explicitness of its representation of vegetation and, in-turn, vegetation-driven evapotranspiration and streamflow, it is particularly suited to the investigations performed in this study.
Since our interest was on the marginal effect of vegetation, only the canopy cover fraction and LAI were varied, representing vegetation conditions as the result of treatment and/or fire. Other inputs were held constant across model runs. RHESSys was calibrated based first on snowpack melt-out date and then on streamflow. Snowpack melt-out was calibrated by adjusting the temperature range at which precipitation shifts from rain to snow and the radiation melt coefficient, while streamflow was calibrated based on soil characteristics.
To verify model performance, we examined the effects under nine calibration parameter sets that passed minimum performance thresholds with respect to daily, seasonal, and annual streamflow and found marginal effects of treatment to be qualitatively robust in terms of relative differences across scenarios, as shown by the parallel coordinate plot in Figure S4 in the Supplementary Materials. Given this similarity, we chose to present results from the run with the lowest annual error, for simplicity and because it was consistently the most conservative in terms of marginal effect of treatment. This primary model achieved an out-of-sample Nash–Sutcliffe Efficiency of 0.73 and an average total error of −6.4%, which was bias-corrected before being supplied as input to the reservoir model. For detailed information on both steps of the calibration process, including input data, parameter definitions, and objective functions, see Section II of the Supplementary Materials.

2.6. Reservoir Systems Modeling

We constructed a parsimonious model of the portions of the American River Headwaters system likely to be significantly affected by changing inflows to French Meadows Reservoir. The system includes cross-watershed transfers that complicate hydropower and environmental flow management. Key hydrologic features of the system, shown in Figure 1b, include the following:
  • Inflows to French Meadows Reservoir from the Middle Fork American River (modeled using RHESSys as described above);
  • Inflows to Hell Hole Reservoir from its watershed (assumed to follow historical patterns);
  • Transfers from French Meadows Reservoir to Hell Hole Reservoir (which produce some power);
  • Releases from Hell Hole Reservoir to the Middle Fork Powerhouse, which generates power before releasing to the Middle Fork American River;
  • Releases from French Meadows and Hell Hole Reservoirs to their respective rivers. Both satisfy environmental flow requirements but do not produce power.
The model is implemented in Python using data and relationships drawn from publicly available materials on FERC relicensing [40,41]. Our analysis is based on a machine learning calibration of reservoir operating rules as a function of time of year and reservoir stage [42]. The reservoir simulation model was first calibrated to replicate historic operations behavior as determined by water releases, while enforcing the constraint of meeting baseline environmental flow requirements. The simulation was then used to evaluate the RHESSys inflow scenarios combined with each of the two environmental flow requirement scenarios to obtain the hydropower generation results. For additional information on the reservoir modeling process, see Section III of the Supplementary Materials.
While it does not represent the exact operating policies implemented by PCWA (for which PCWA operates a proprietary model), testing indicates this sub-component reasonably reproduces historical storage behavior (Figure S10 in the Supplementary Materials) and also serves as a generic representation of reservoir operations in the mid-elevation Sierra. While this model was designed with PCWA and the French Meadows Reservoir in mind, it can be straightforwardly replaced with a utility’s preferred systems model for replication elsewhere.

2.7. Environmental Flow Enhancements

To represent environmental flow concerns, we included the FERC license terms for environmental flows for French Meadows and Hell Hole Reservoirs in the reservoir model and explored the impact of altering them to further enhance flows for a threatened species, the Foothill yellow-legged frog (scientific name Rana boylii, hereafter FYLF). The environmental flow requirements specified in the 2020 license (“FERC” scenario) include spring pulse flows, minimum instream flows, and down ramping rates for spill flows. We focused on environmental flows for FYLF because the species is listed as endangered or threatened in four out of six genetic clades across the state [43]. FYLF in the American River are part of the North Sierra distinct population and not listed; however, this population has low connectivity and a small size which could affect recolonization following a catastrophic wildfire. Another major threat to FYLF is flow alteration from dams and diversions.
While the license was granted in 2020, the multi-year duration of the license renewal process meant that default spring pulse flows and spill flows associated with the license were specified before additional research showed the importance of a slower recession rate to protect FYLF egg development and prevent stranding tadpoles [44,45]. We therefore also modeled a “FERC+” spring pulse flow and spill flow for both reservoirs that better aligns with recent science on FYLF and meets the recommended recession threshold of <20% flow decrease between a two-day period. These FERC+ values were developed within the relicense modifications proposed by the U.S. Forest Service to reduce the risk of stranding aquatic biota [41]. They amount to both more release of more total water allocated to environmental flows and constrain the timing of the release, thereby introducing a potential trade-off with hydropower generation. The spring pulse flow releases for both reservoirs are shown in Figure S12 in the Supplementary Materials, Section III.

3. Results

3.1. Vegetation and Fire Modeling Outputs

Canopy cover fraction and LAI—the vegetation characteristics from treatment and fire modeling that were used as inputs to the ecohydrologic modeling—are summarized here. Vegetation reductions with respect to the no-fire/no-treatment scenario were relatively modest, except under the extreme-fire/no-treatment scenario (Table 1). While these metrics are not a direct measure of fire type (e.g., surface fire, underburn, and crown fire), high percentage losses in canopy cover and LAI under this scenario (47% and 63%, respectively) suggest intense fire behavior such as widespread active or passive crown fire. Treatment yielded significant reductions in area burned under the moderate-fire scenario (reduction of 32%), but not under the extreme-fire scenario, where area burned remained virtually unchanged (Table 1). This was true despite a significant reduction in burn severity metrics: while treatment lowered both LAI and canopy cover compared to the untreated scenario under moderate-fire conditions (−9% LAI and −7.5% canopy cover), treatment scenarios with extreme fire resulted in higher LAI and canopy cover (by 66 and 8%, respectively) due to the mitigating effects of treatment on extreme fire spread and severity (Table 1). These reductions in LAI and canopy cover are within the ranges previously reported in the literature [28]. Full results of fire and vegetation structure modeling are presented in the Supplementary Materials, Section I, including more in-depth discussion of dependence on weather conditions and choice of scenarios.

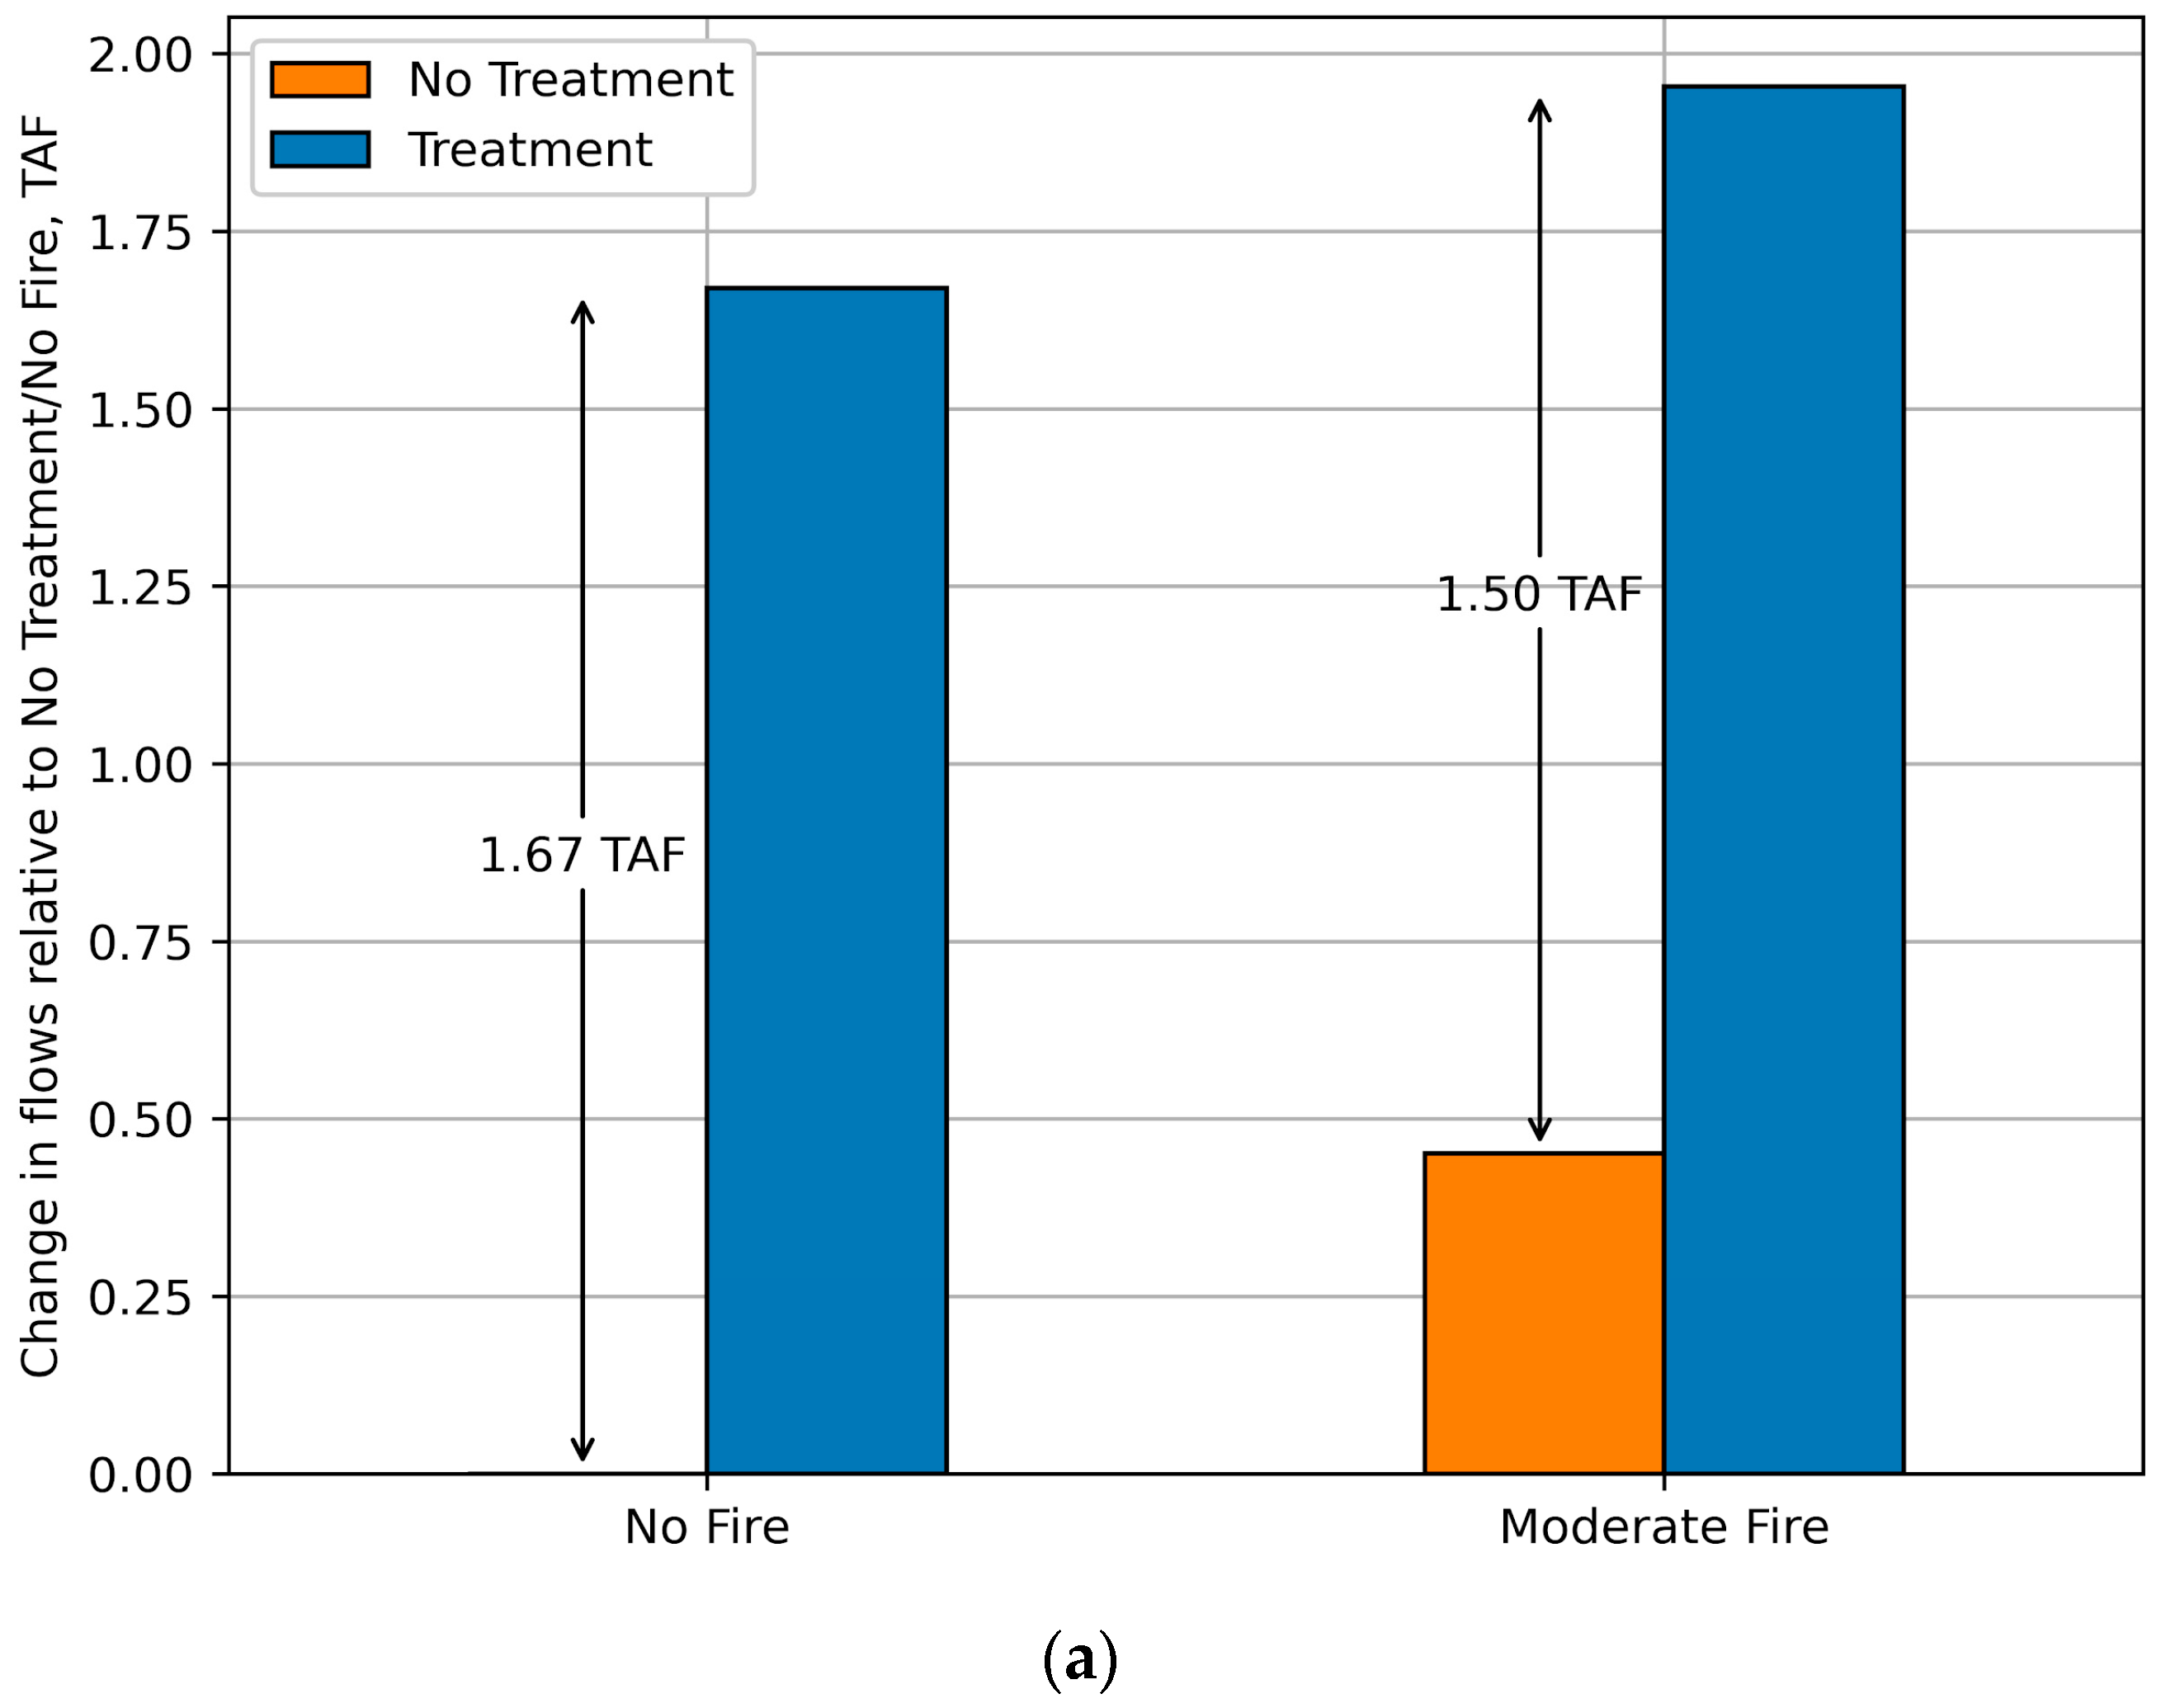
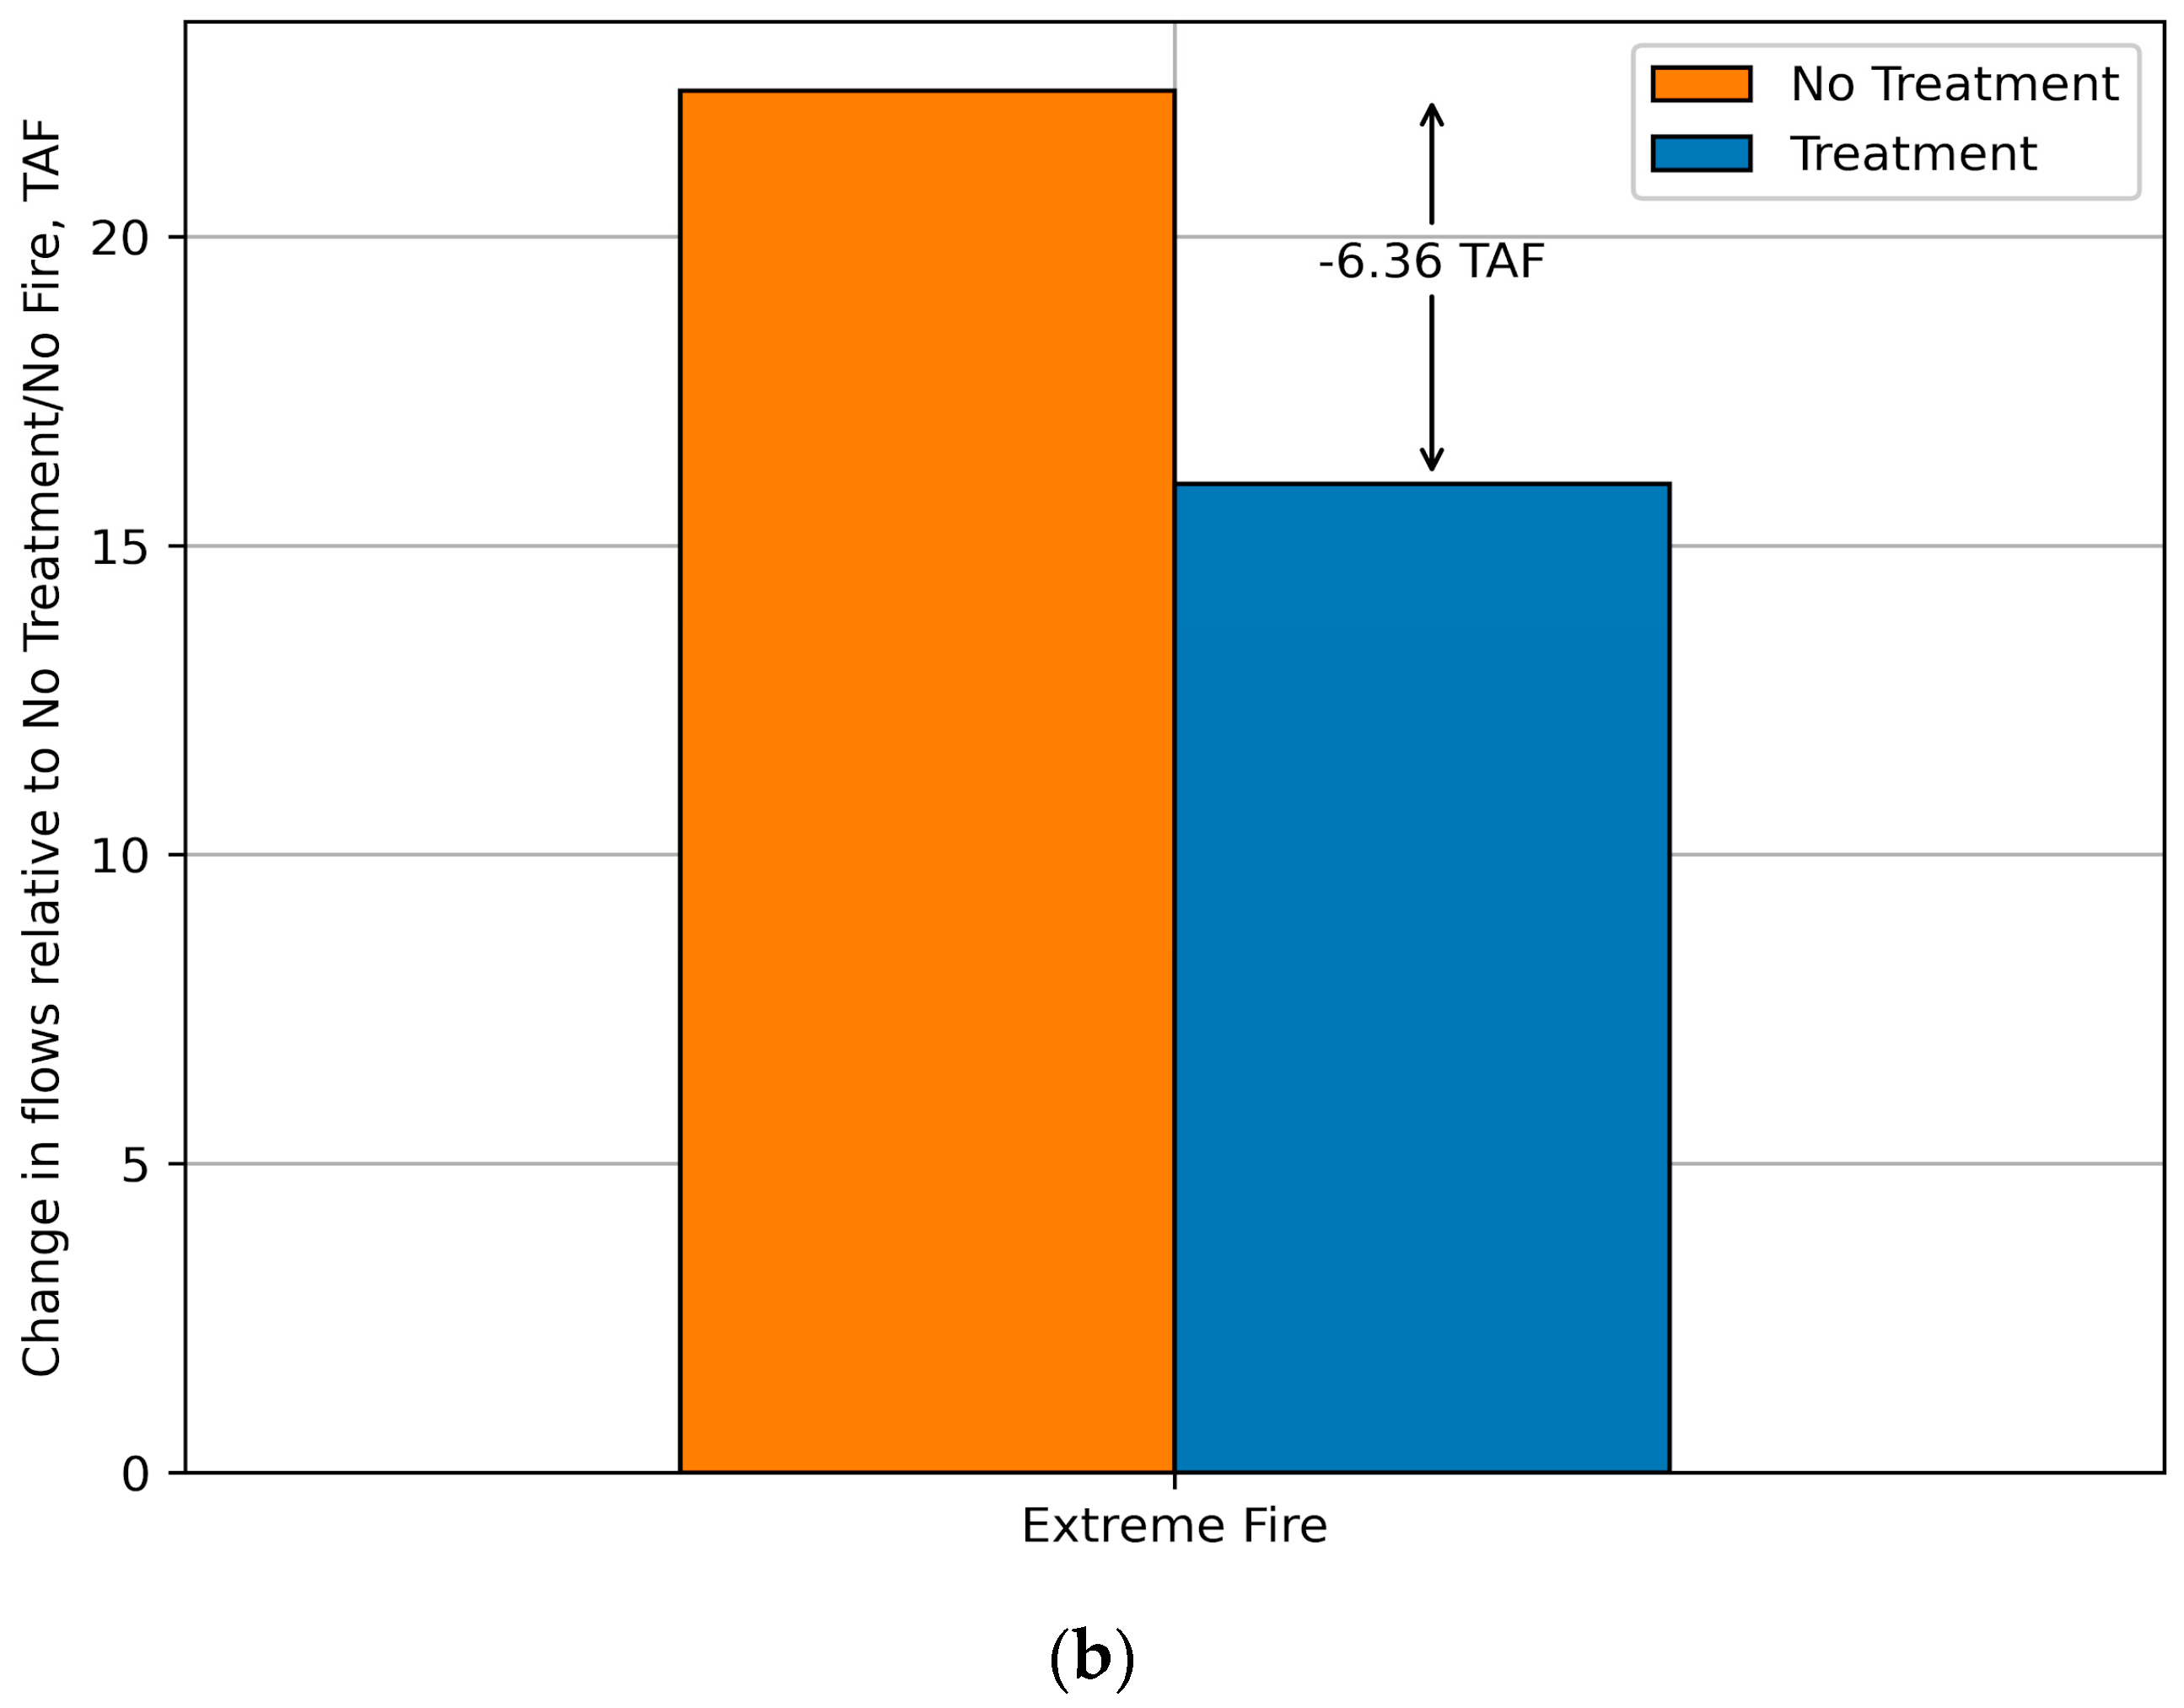
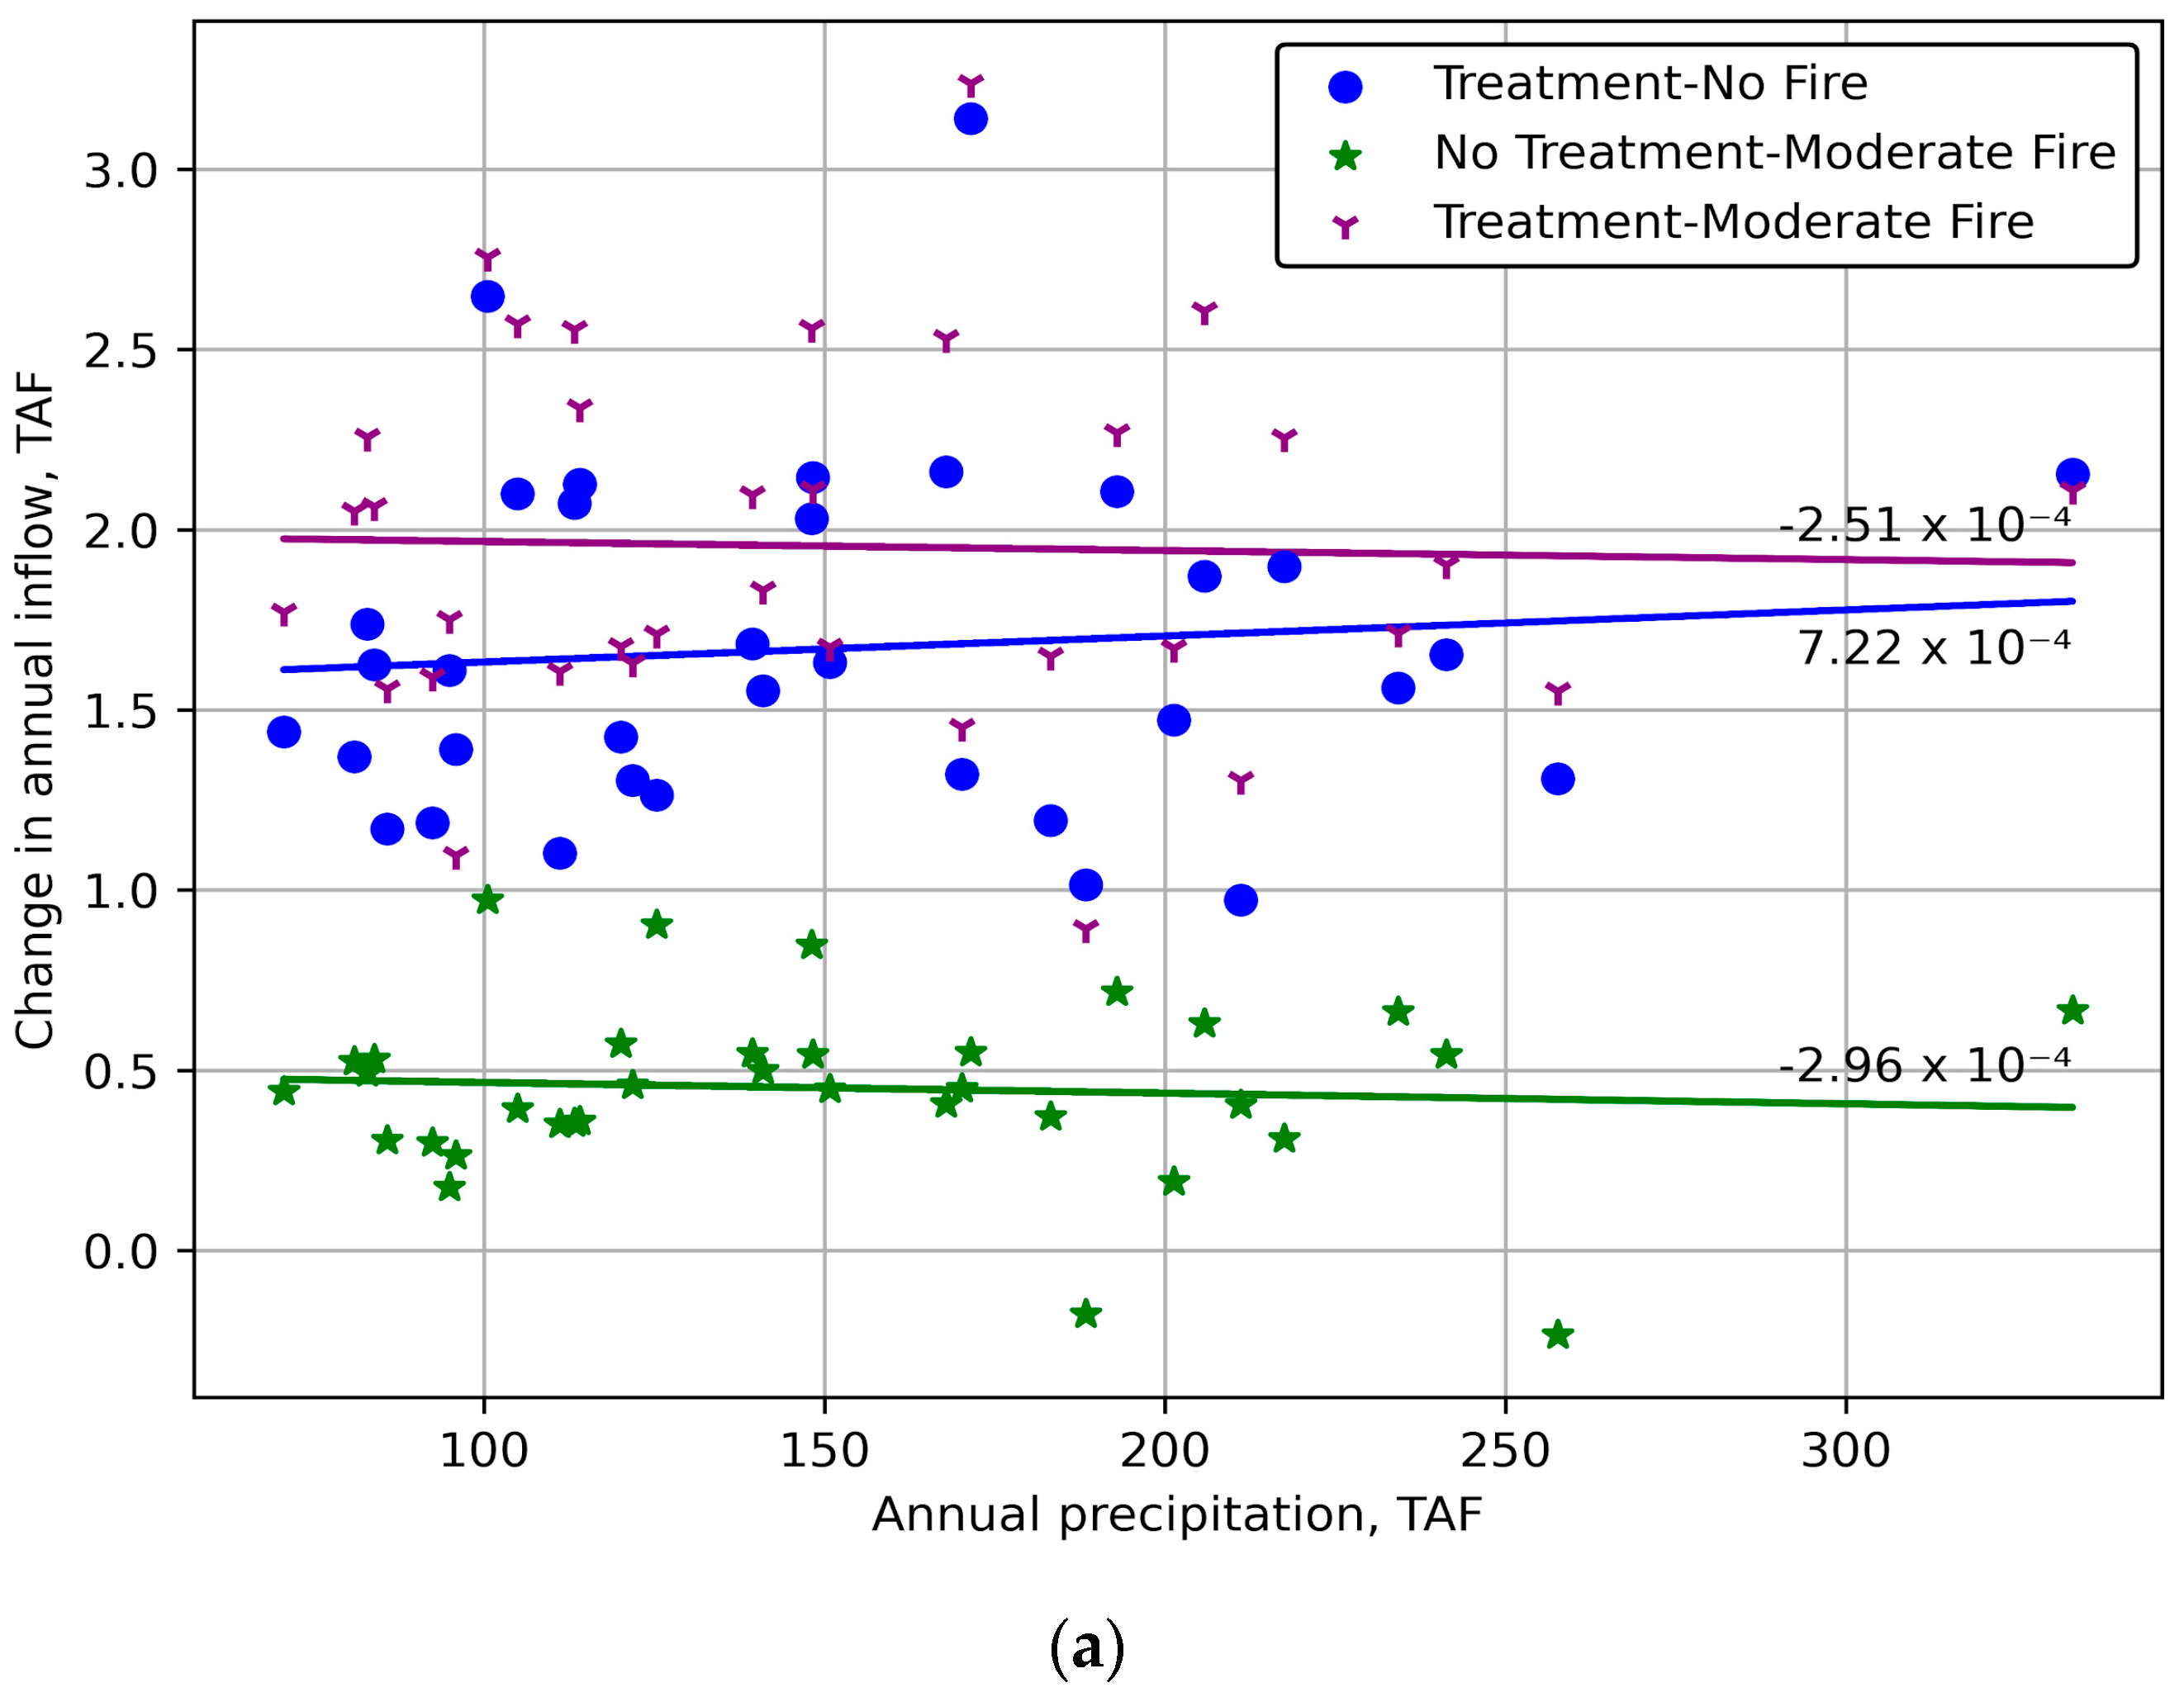
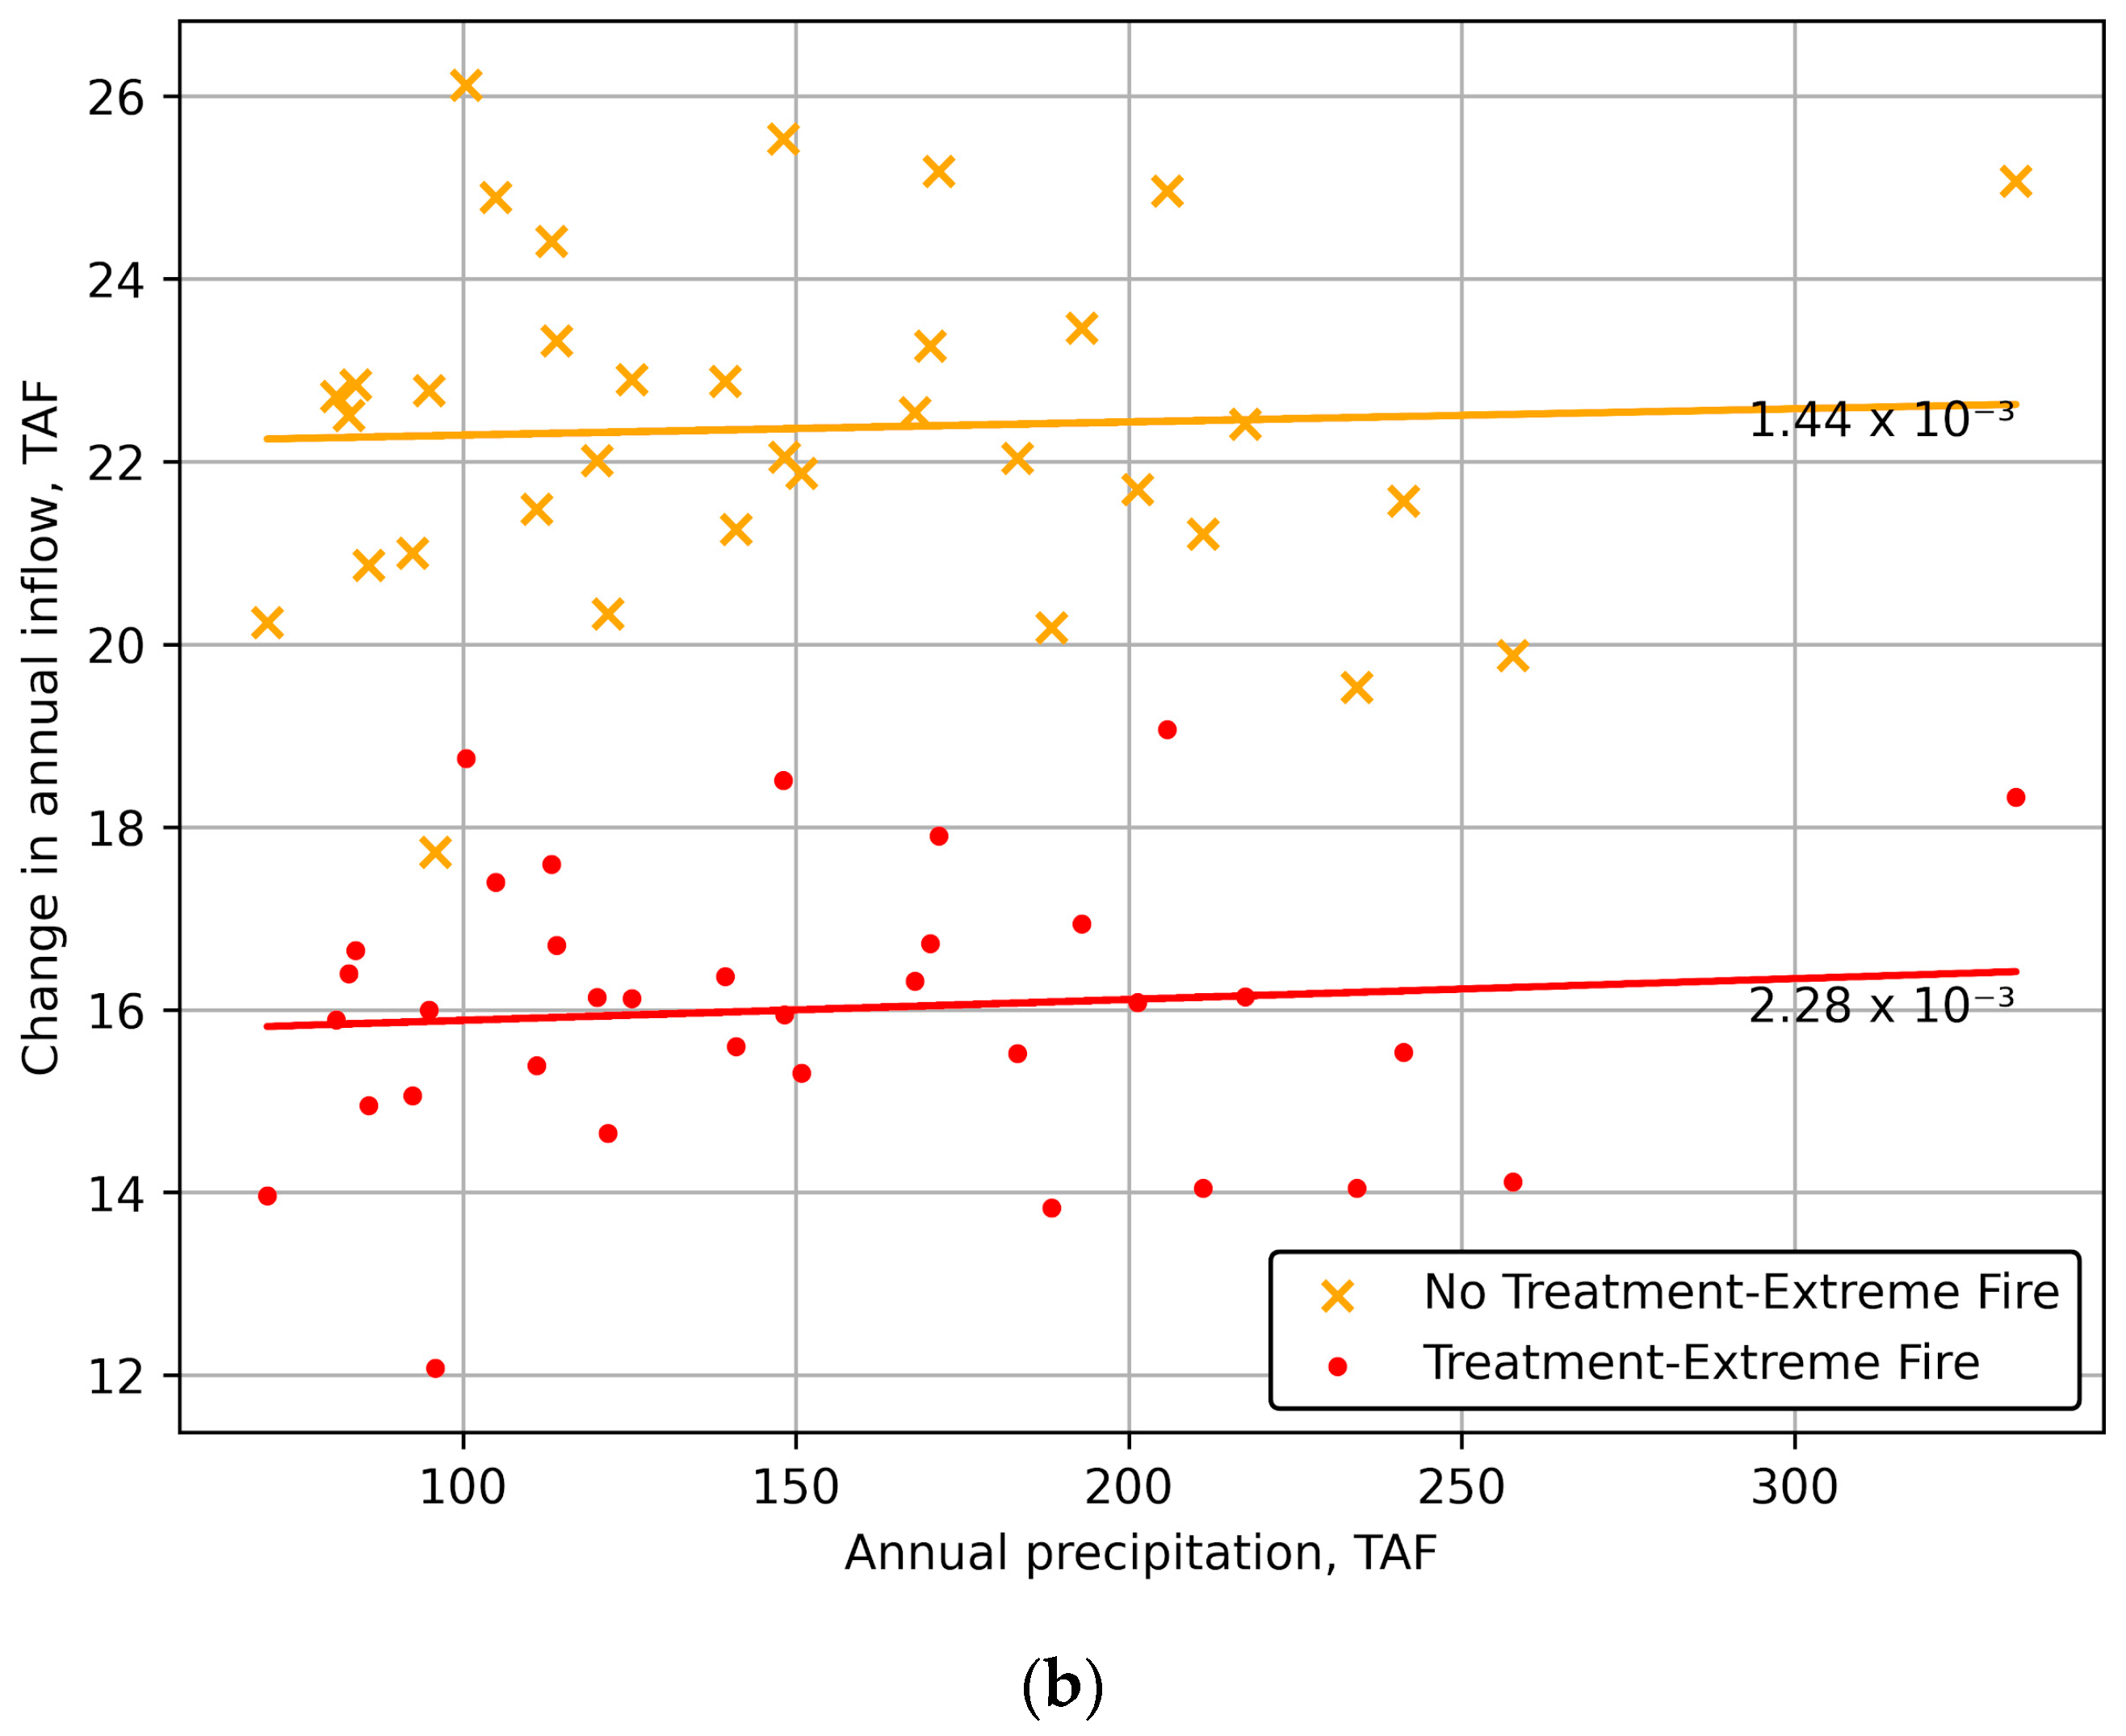
3.2. Water Yield Impact of Restoration and Fire

3.2.1. Average Annual Impacts

Forest restoration in the absence of fire has a small percentage impact on flows, but the impact is significant in magnitude. Treatment increased annual average inflows by more than 1.67 TAF or 1.5% of the average annual inflows into French Meadows Reservoir compared to a no-treatment/no-fire scenario (Figure 3).
As expected, flow impacts are inversely related to vegetation impacts: scenarios that result in lower vegetation tend to result in higher flows and vice versa (Figure S9 in the Supplementary Materials, Section II). Thus, holding treatment status constant, greater fire severity increases inflows. Holding fire status constant, treatment increases inflows for the no- or moderate-fire scenarios, but decreases them for extreme fire. This is because the protective effect of the treatment lessens the severity of vegetation loss to extreme fire by more than the amount of vegetation that is removed as part of treatment (Figure 3b), whereas vegetation removal associated with treatment dominates under moderate fire. With an average annual inflow under the no-treatment/no-fire scenario of approximately 109 TAF, the percentage increases in flows resulting from treatment for no- and moderate-fire scenarios are modest. However, they represent up to 1.67 TAF annually in absolute quantities. The percentage changes associated with extreme fire are approximately an order of magnitude larger (approximately 15–20% of average annual flows), but these correspond to damaged and undesirable watershed conditions, as further discussed in Section 4.

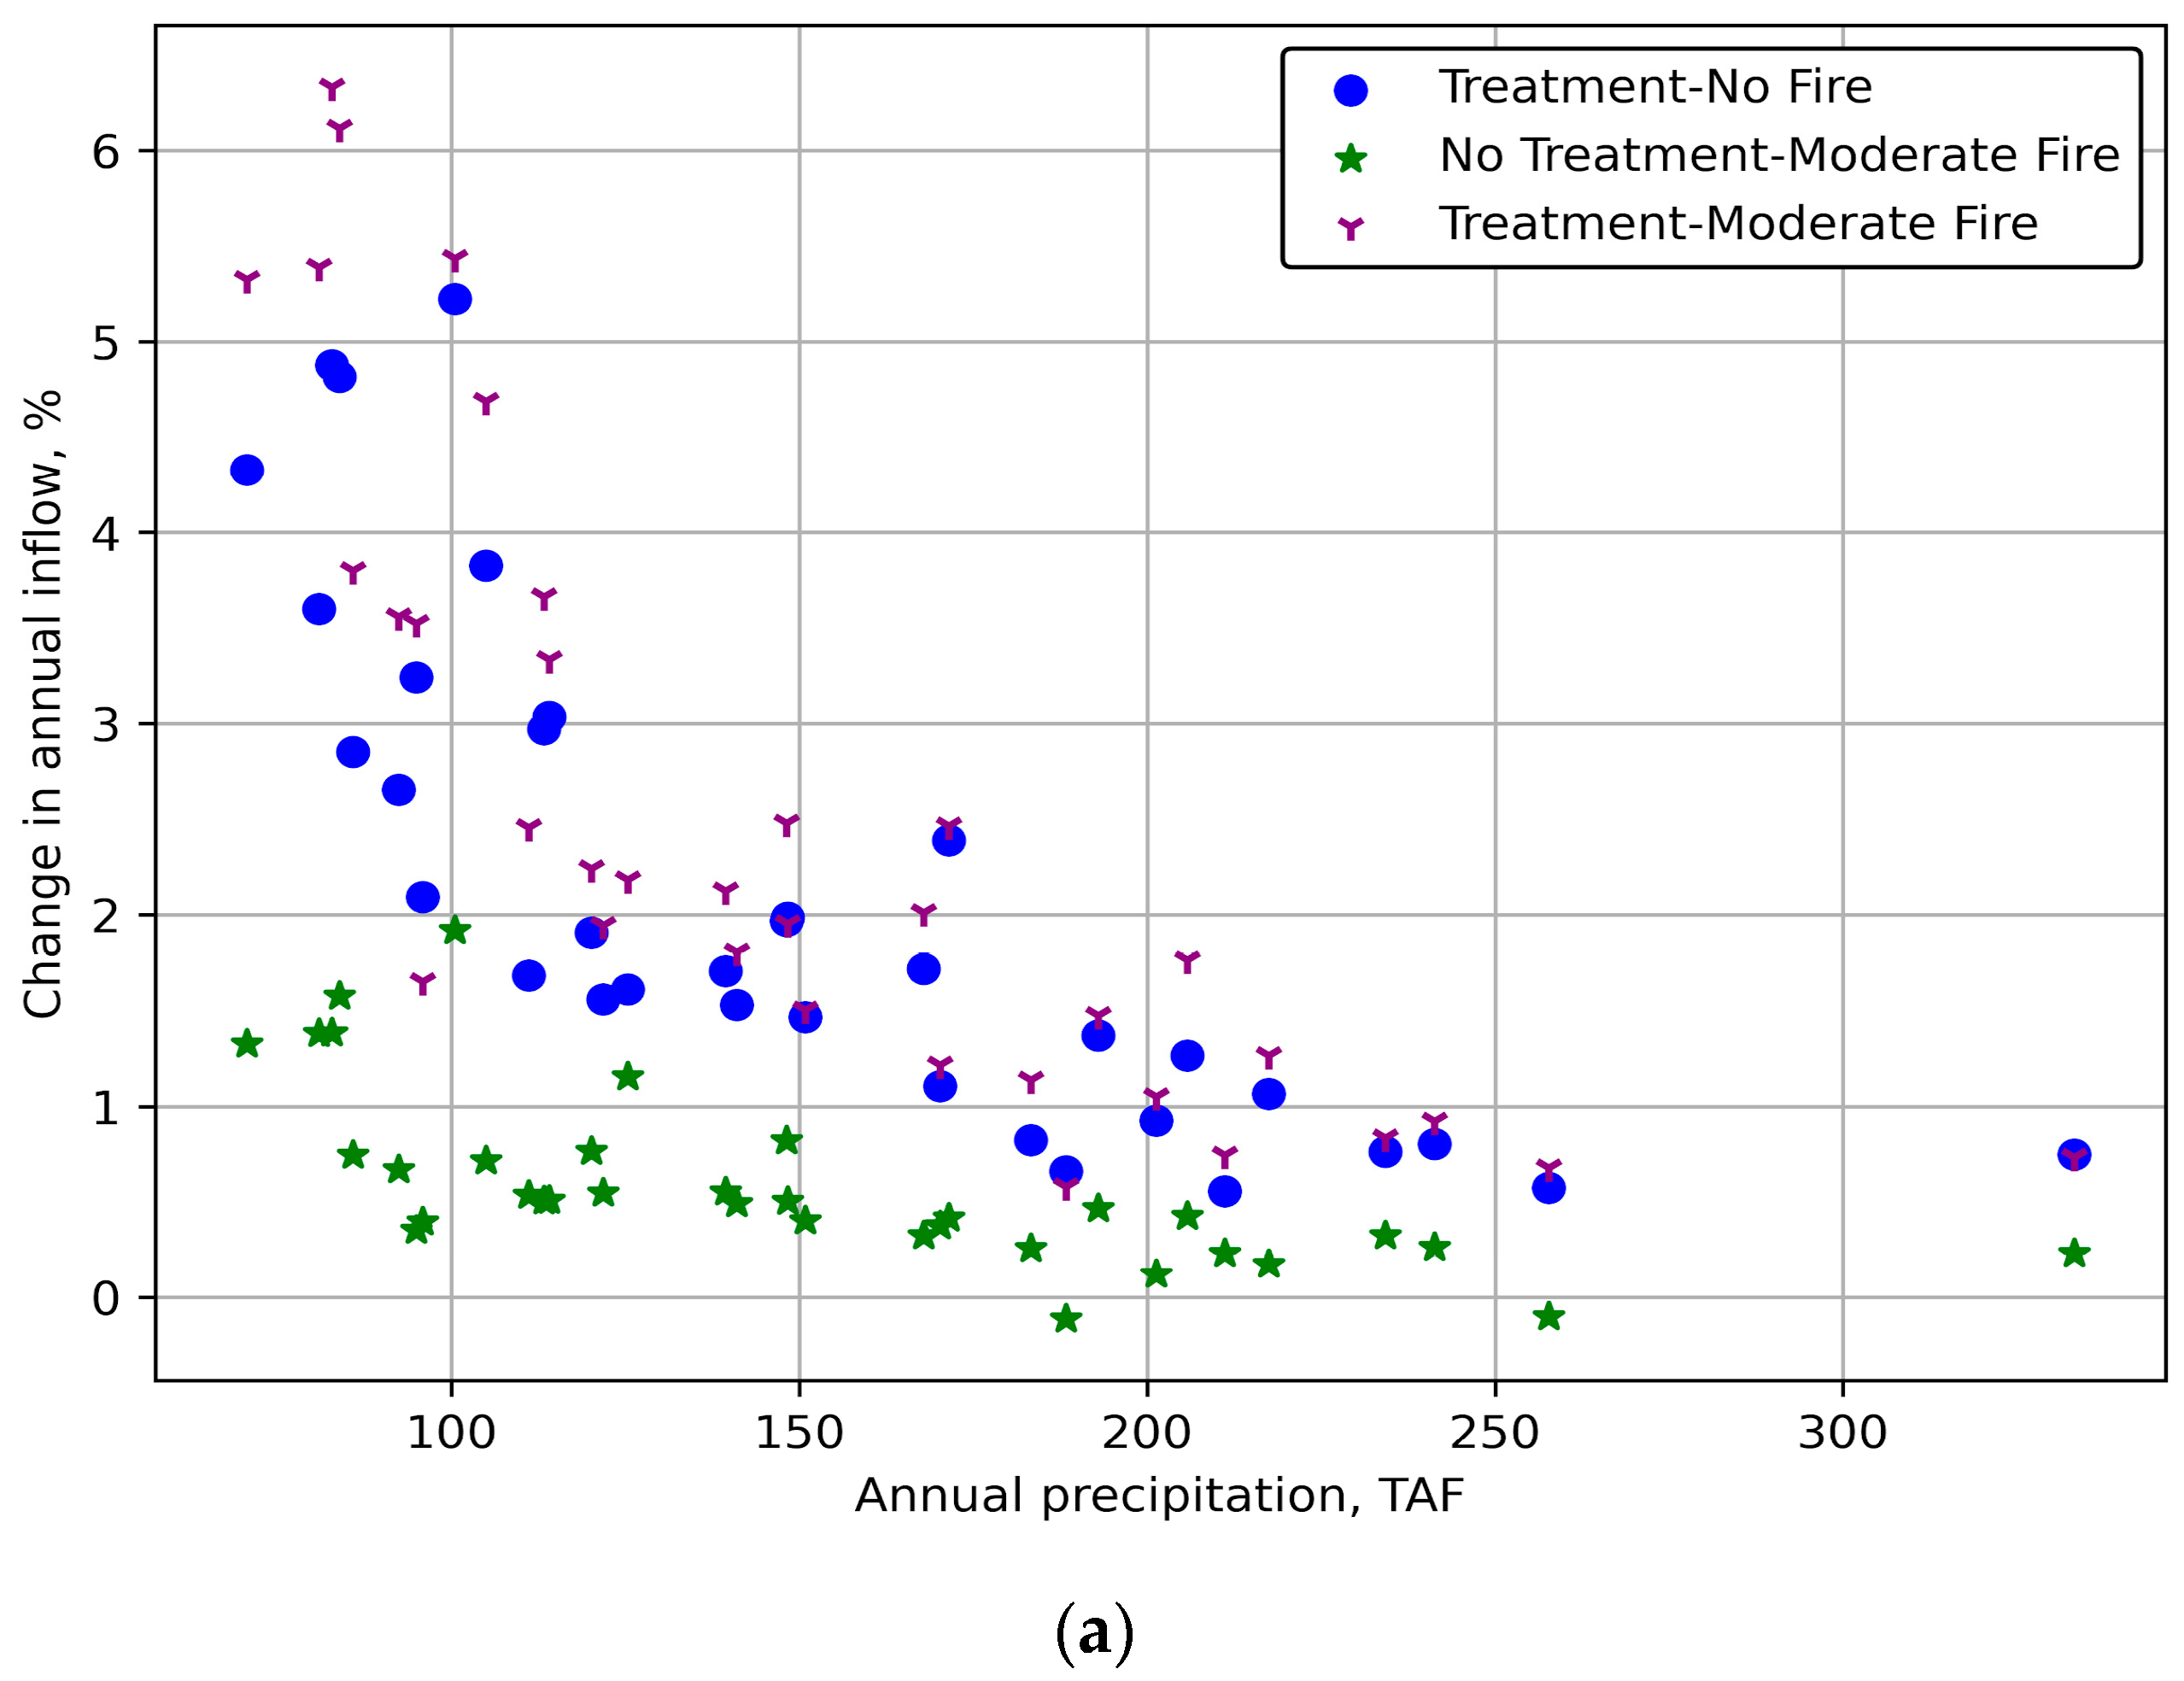
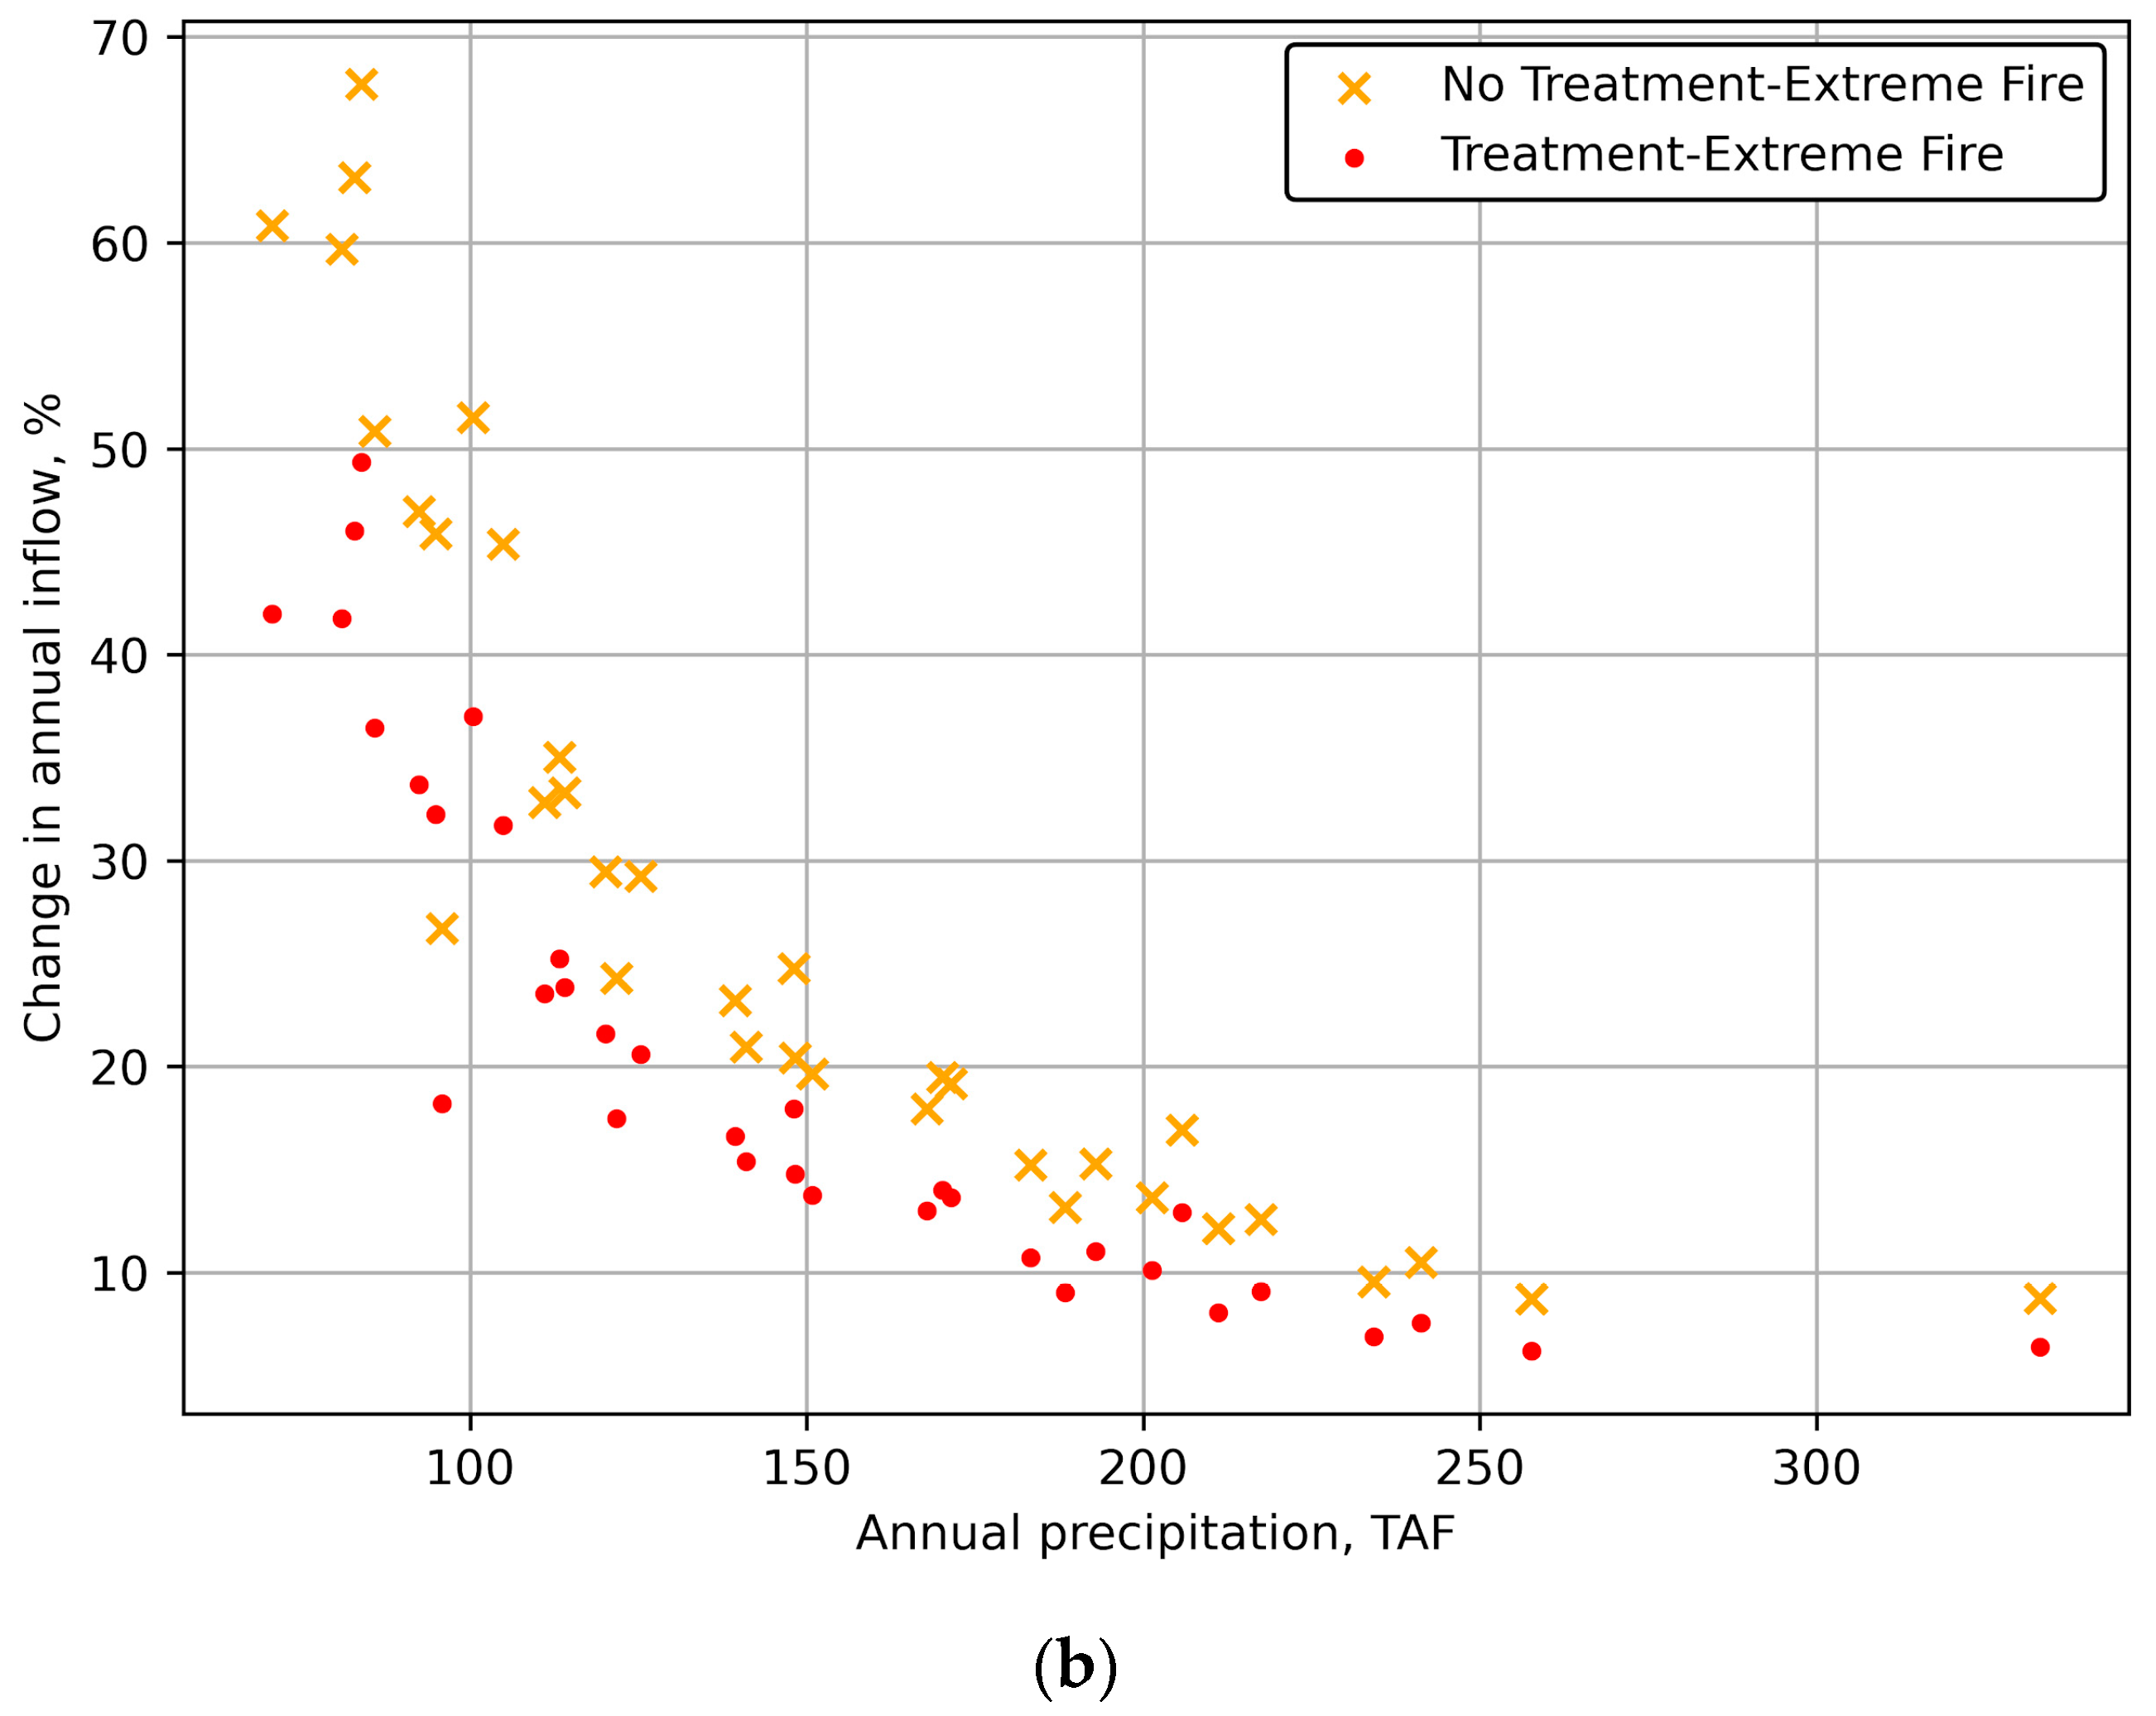
3.2.2. Variation within and across Years

The absolute volumetric increase in inflows to French Meadows Reservoir for a given vegetation/fire scenario is mostly invariant by annual precipitation (Figure 4), due to the relatively consistent interannual plant water use in the energy-limited American River basin [46]. By extension, relative changes in annual inflow (presented as percentages) are higher in drier years (Figure 5), which may imply higher per-volume value in dry years based on economic fundamentals of supply and demand (in addition to its use for hydropower, water may be diverted to other uses farther downstream).

3.3. Hydrology Impacts on Reservoir Operations

Changes in inflows due to treatment and fire interact with environmental flow requirements to impact average annual generation. Note that the total number of scenarios is now doubled because there are two reservoir management cases for each case treatment/fire scenario: one under current environmental flow requirements (FERC), and one under enhanced environmental flow requirements (FERC+, indicated by hatching). All results are still presented as absolute differences compared to the no-treatment/no-fire scenario.
With existing environmental flow requirements (FERC scenario) and an assumed electricity price of USD 40/MWh, revenue may be enhanced by upwards of USD 115,000 per year under no- or moderate-fire scenarios (Figure 6). (The CAISO locational marginal price averaged USD 34.81/MWh over the 2010–2016 water years during which the model was calibrated; given inflation, price volatility, and fundamental uncertainty, we use USD 40/MWh as a notional forward-looking value grounded in the price history, which is also in line with median values identified in [47].) Notably, most of this enhancement (USD 99,200 annually) is realized by treatment alone and is not contingent on the occurrence of moderate fire. Moreover, the results show that under both the no-fire and moderate-fire scenarios, enough extra water is generated to enable a simultaneous increase in generation while meeting enhanced environmental flow requirements. Under these same fire scenarios, enhanced flow requirements resulted in a loss of revenue without treatment.
Extreme fire, especially in the absence of treatment, results in revenue generation one to two orders of magnitude higher than other treatment/fire scenarios (Figure 6). This is due to the high runoff volumes generated under this scenario (Figure 3), but would be accompanied by many unacceptable negative impacts to water quality, reservoir sediment loading, land type conversion, and loss of ecosystem resilience, which are not modeled as part of this study (see Section 4.1). Additionally, even the generation benefits may not be as significant as modeled here if these other factors drive an alteration to the operating regime of the reservoir, for example, shutting down to protect turbines during periods of high sediment flow.

4. Discussion

In the following three subsections, we discuss the implications of restoration work and revenue enhancements for hydroelectric utilities and how water yield benefits may motivate investment in headwater protection. Utilizing some simple benchmarking comparisons, we illustrate the importance of including reservoir models as part of an integrated modeling scheme, the implications of revenue generation for cost-sharing restoration work, and end by contextualizing these results within the broader goal of achieving landscape-scale ecological resilience.

4.1. The Value of Integrated Modeling

Integrated, process-based modeling studies that link ecohydrologic impacts of headwater vegetation treatment to operational models at downstream control points (such as reservoirs and diversions) are so far relatively limited in the literature (see Simonit et al. [17] for a reliability-focused example in Arizona), and to our knowledge, none have explicitly coupled physically based models of water enhancements with hydropower generation models that include operational constraints. More research has been performed on joint vegetation and fire modeling to estimate water yields, but it has not connected these outputs to a reservoir model [10,27,48], while Guo et al. [49] consider hydropower generation impacts from hypothetical vegetation treatments using a data-driven water yield model. Hurford et al. [50] use an integrated water resource system simulation to link gray infrastructure management and downstream ecosystem services, but they do not connect upstream vegetation management to the reservoir inputs.
Our modeling results upstream of reservoir operations support existing research findings [22,46,51,52] that fuel reductions, both with and without the return of fire to the landscape, can increase water yields by decreasing plant water use. However, our integrated modeling reveals the limitations of using aggregate estimates of volumetric water yield, such as those provided by these studies, to estimate the associated energy production values. These aggregated estimates [11,24] involve making a simple calculation that pairs physical principles with public data, as might be undertaken by a project developer that does not commission a modeling study. One approach compares inflows to what has been generated historically and assumes that incremental inflows will generate a similar amount [11]. A second approach involves starting from first principles by identifying how much energy is produced by a given unit of water passing through the hydropower cascade, assuming it produces the maximum energy achievable given the efficiency of the relevant generating units [24]. (This is simply the change in potential energy mgΔh scaled down by turbine efficiency, where m is the mass of a given volume of water, g is acceleration due to gravity, and Δh is head, the elevation change from reservoir surface to powerhouse.) Both approaches can be further refined using a scaling factor that attempts to account for the reality that the fraction of incremental water that will be utilized for generation may differ from the theoretical maximum or from historical averages (as performed in [11], which uses 25%).
For example, using the “first principles” approach in the French Meadows system, a turbine efficiency of 80% and an average head of 757 m gives a theoretical maximum generation of 2.03 MWh/acre-foot. Recognizing that it would be naive for a project developer to assume this theoretical maximum would be reached, this generation potential can be scaled down with public gauge data, providing an estimate of the average fraction of inflows to French Meadows Reservoir that actually reach each powerhouse. This gives a unit generation potential of 1.66 MWh/acre-foot, or 81.6% of the theoretical maximum. (The full calculations underlying this exercise can be found in Section III of the Supplementary Materials.)
To illustrate the consequences of using such simplifying assumptions, Table 2 compares this value to the generation potential as estimated by the integrated modeling approach of this paper. The first column of numbers shows the generation potential under each fire scenario for FERC environmental flows, calculated using the differential numbers labeled on the bar graphs in Figure 3 and Figure 6 (see Table S12 in Section III of the Supplementary Materials). They are then presented in the second column as a percentage of the total theoretical maximum generation (2.03 MWh/acre-foot) described above. This then allows us to calculate the relative difference between the two methods—i.e., the overestimate associated with the first principles approach (numeric column 3).
This exercise implies that even this refined, data-informed version of the engineering approach would still overestimate incremental generation by 11.7 to 73.6 percent (Table 2, third column). In fact, even the highest generation potential estimated from integrated modeling is considerably below the theoretical maximum (Table 2, first and second columns). Moreover, the values exhibit significant diminishing returns based on the total flow enhancement from fire and treatment (blue bars in Figure 3 and first column of Table S12 in the Supplementary Materials). The potentially significant magnitude of the overestimate, along with the marked diminishing returns, indicates integrated reservoir modeling is valuable for creating a fair characterization of the benefits of forest treatment for hydroelectric utilities—whether to inform the project treatment area, post-treatment fire management, or benefit-sharing plans.
The analysis above speaks to the importance of extending the level of model integration typically represented in the literature. At the same time, even this study does not fully represent the integrated optimization problem faced by water utilities. In particular, reservoir modeling results could also be coupled with time-varying water and energy prices to more accurately determine the effect of treatment on utility finances. In addition, refined assumptions in the current model could also influence the value of treatment for revenue generation. For example, the model did not consider the impact of sediment transport, which would be a particular concern in the fire-impacted scenarios and may limit the benefit of additional water yield (by reducing reservoir storage or interrupting turbine operation). However, the most severe sediment impacts are likely to result from extreme fire [53,54], which is undesirable for multiple other reasons and not a realistic restoration goal (see Section 4.3 for additional discussion on resilient landscapes).
Integrated modeling is also important for addressing temporal flow dynamics and accurately assessing water yield impacts. While we summarize our results in terms of annual averages, the modeling was performed on a daily timestep in order to capture seasonal changes to operating constraints (such as environmental flows). Modeling at those timescales can also capture other dynamics that impact reservoir conditions and operations. The most notable example is that increased inflows may lead to increased flood risk since the same biophysical mechanisms that lead to enhanced water yield (e.g., greater and faster runoff due to decreased vegetation) may increase peak flows specifically. This was not a concern for this reservoir, since the magnitude of peaks due to treatment was small relative to the potential impacts of catastrophic fire. However, this may be an issue for other locations and may require integrated modeling to address. Furthermore, the magnitude of annual flow changes, while potentially valuable and of a reasonably expected magnitude based on the modeled vegetation reductions, may nevertheless be difficult to detect with traditional in situ measurement approaches [55,56,57]. This suggests the need for a modeling approach that is not only data driven, but also integrates data with known, process-based structural relationships that can be captured by an integrated model such as the one we present here.

4.2. Implications for Cost-Sharing

The hydropower generation and revenue enhancements that our modeling indicates can be achieved through headwater forest restoration are noteworthy for their potential to motivate investments in restoration projects. The increased flows due to vegetation treatments alone amount to at least 1.5% of baseline average annual inflows into the French Meadows Reservoir, with greater increases possible under scenarios with fire and higher percentage increases when water is most scarce. These average percent increases suggest flow enhancements can help support both environmental flows and hydropower production. In fact, in our case study context, the flow increments from treatment are sufficient not only to enhance revenue, but also to create a win–win scenario in which they fully offset generation losses that would be incurred by imposing more stringent (i.e., FERC+) e-flow requirements (see Figure 6a, in which the with-treatment, FERC+ scenarios are higher revenue than the control scenario).
The total generation benefit to hydroelectric utilities depends not only on the increase in average annual revenue as modeled (see Figure 6), but also on the projection of annual revenues over time (influenced by the decay rate of the water yield benefits due to vegetation regrowth; see [21]) and the rate at which future benefits are discounted (see Section IV in the Supplementary Materials for further details on the selected range of discount rates). Depending on the discount rate and benefit duration, the treatment/no-fire scenario would generate a present value between USD 840,000 and USD 1,620,000, or 8.2 to 15.8% of relevant project costs, under the default FERC scenario (Figure 7; total project costs are assumed to be USD 16.6 M USD, of which USD 10.3 M are attributed to treatments affecting the French Meadows inflows; see Supplementary Materials, Section IV). If low-to-moderate intensity fire is able to be reintroduced to the landscape (as modeled in our moderate-fire scenario), the present value of flows would increase a further 16 percent. These values are roughly commensurate with other studies of the same area [49].
The estimates provided in Figure 7 show that hydropower revenues may be non-trivial, but are still insufficient to cover project costs. However, this study was conservative in two ways that did not account for the full potential value of restoration projects: first, the value of the hydropower benefit stream was estimated conservatively, and second, it constitutes only one of several possible benefit streams accruing to one of multiple possible stakeholders.
The hydropower benefit stream estimation was conservative in terms of model specification, as the water yield benefit stream itself was estimated with the calibration parameter set that had the lowest annual average water yield among parameter sets that passed minimum criteria, and the present value calculation assumes minimal vegetation management to maintain the differential effect of the initial treatment. In addition, the hydropower revenue estimates assume no “re-optimization” of reservoir operations to adapt to the changing overall inflow regime and any given state of the watershed (e.g., snowpack storage). Doing so holds potential to push out the trade-off frontier of reservoir management objectives [58], creating opportunities to find the most preferred balance between generation revenue, revenue from additional monetized water uses, and other social benefits.
Regarding overall benefit streams, we monetized only the hydropower revenue from changes in reservoir in-flows. However, enhanced water yield can also be used as water supply for consumptive use, which is not valued here, and second-order runoff volume and timing benefits may also accrue from this type of restoration project. These latter benefits stem from increasing and prolonging snowpack [59], increasing soil water retention [60], and maintaining a cooler water temperature [61,62]. Beyond strictly hydrologic benefit streams, there are also likely to be risk reduction benefits from mitigating the likelihood of extreme fire and associated harmful water-related impacts, such as an increase in runoff velocity and flood risk [63], a decrease in snowpack through reduced albedo [64,65], and a decrease in water quality [66,67,68]. In addition, forest restoration can protect other stakeholders such as cities, counties, and electric utilities from fire risk; protect public health in the broader smokeshed; and protect and enhance recreation opportunities.
Volumetric water benefits for hydropower, as revealed by our study, therefore may be leveraged alongside other co-benefits of a given project to support multi-stakeholder cost-sharing. A limited number of such co-funded projects have already been undertaken across the U.S., including Denver Water’s Forests to Faucets program in collaboration with the U.S. Forest Service and Colorado State Forest Service; the Yuba Water Agency’s contributions to North Yuba Forest Partnership projects; and the Forest First program, a collaboration between water agencies in the Santa Ana River watershed and the U.S. Forest Service. The French Meadows Project modeled here was partly funded by PCWA based on an interest in general headwater protection, but more specific modeling exercises like those presented here could help motivate additional contributions based on revenue generation potential as well as expand similar efforts to other regions. In addition to motivating participation in these types of collaborations, modeling that helps quantify benefit streams can also inform negotiations about such trade-offs between stakeholders and even provide the informational basis for interested stakeholders to compensate others to reach a particular combination of benefits.

4.3. Moving towards Landscape Resilience

The actual impact of forest treatments described in this paper will depend on the subsequent occurrence of fire and the severity at which such a fire burns. From a revenue perspective, the most conservative assumptions for the net impact of restoration are the no-fire (treatment-only) scenarios because they do not depend on the uncertain occurrence of a fire (Figure 6). Under the moderate-fire scenarios we modeled, treatment alone accounts for the majority of the revenue enhancement under both the FERC and FERC+ operating conditions, with moderate fire providing a marginal gain (on top of treatment) of USD 16,000 and USD 17,200 per year, respectively, both representing gains of less than 0.1%. Thus, there is a financial argument for utilities to support restoration even in the absence of fire, though fire that has more extensive vegetation impacts while still being acceptably manageable could provide greater benefit.
Indeed, the scenarios that assume a return of moderate fire to the landscape may be the most realistic. Given the increasing occurrence, size, and severity of wildland fire in California [3,69,70,71], the no-fire scenarios may be increasingly untenable, and forest management of the type modeled in this paper is usually intended to improve ecosystem resilience and restore healthy mild-to-moderate fire to the landscape [72,73]. Achieving this in the long-term would require ongoing management activities at additional cost, but would aim to reduce the risk of extreme-fire scenarios that can be both environmentally and financially damaging.
Should management objectives fail to prevent extreme fire, the impacts to volumetric water yield are significant. Extreme fire on an untreated landscape generates the greatest increases in water yield of any of the modeled scenarios (Figure 3), and if such a fire did not fundamentally threaten other co-objectives in management, this would be the most advantageous scenario for energy and revenue production. However, as noted in Section 4.2, extreme fire typically poses other landscape and water-related risks, including erosion [66], changes in runoff patterns [63], and black carbon contamination on snow [65]. Moreover, in the absence of post-fire management, regrowth of thirsty grass and shrubs after severe disturbance can actually decrease water yield in the long run [74,75,76].
In this context, treatment can help mitigate losses from extreme fire that are contrary to water management goals. The no-treatment/extreme-fire scenario results in the greatest loss of vegetation relative to the baseline of any scenario (63% loss of LAI and 47% loss of canopy cover; Table 1). Losses on this scale are associated with high-severity fires such as active or passive crown fires (see, e.g., [77]), which can result in the type of extreme damage to vegetation, ecosystems, and built infrastructure that forest management aims to avoid. However, those losses are mitigated under the treatment/extreme-fire scenario (38% loss of LAI and 43% loss of canopy cover relative to baseline). Thus, the removal of vegetation due to treatment is more than counterbalanced by avoided losses in the event of an extreme fire. Since vegetation loss is directly tied to post-fire effects including erosion and black carbon contamination, such work can be valuable to water agencies beyond direct volumetric water enhancement.
Treatments thus have positive benefits for revenue generation, risk protection, and landscape resilience. While this work specifically quantifies revenue generation from direct volumetric water yield enhancement, these impacts should not be considered in isolation from broader resilience benefits that healthier landscapes provide to the water and energy sectors. Further work should consider how the multiple objectives of management interact and quantify the overall impact for hydroelectric utilities.

5. Conclusions

This paper presents an integrated modeling approach to estimate the downstream water yield enhancements that result from headwaters restoration in a forested watershed of the California Sierra Nevada. The modeling approach examines the impact that operational and environmental flow requirements have on the revenue generation that can be expected by the enhanced water yield.
We find that fuels reduction and thinning activities yield small but non-trivial increases in volumetric water yield under both no-fire and moderate-fire scenarios. When coupled with extreme fire, vegetation treatments reduce the water yield compared to extreme fire on an untreated landscape. Since extreme fire is usually associated with a host of negative environmental and water resources impacts, vegetation treatments in this case can still be seen as a positive mitigating factor.
Second, we find that environmental flow regulations impact the total revenue that can be expected from enhanced water yield, but that vegetation treatments can produce enough additional water volume to offset generation losses that would be expected if flow requirements were enhanced.
Finally, based on a simple cost–benefit analysis, we find that the total enhanced revenue from additional water yield accounts for 8.2–15.8% of upfront restoration costs. Thus, coupled with other co-benefits, enhanced water yield could be leveraged for cost-sharing projects aimed at restoring landscape-scale headwater resilience.

Supplementary Materials

The supplemental information contains additional detail on results, materials, and methods and can be downloaded at: https://www.mdpi.com/article/10.3390/su151511549/s1. References [78,79,80,81,82,83,84,85,86] are cited in the Supplementary Materials.

Author Contributions

B.P.B., P.C.S., J.D.H., K.N.W. and E.S. conceived the research. E.S. coordinated fire modeling. P.C.S. coordinated and implemented the RHESSys ecohydrologic modeling. K.N.W. developed the environmental flow scenarios. J.D.H. coordinated and implemented the reservoir systems modeling. E.S. and K.N.W. coordinated stakeholder engagement. B.P.B. coordinated research and led model integration. T.M. and B.P.B. led drafting of the manuscript and development of figures. All authors reviewed and contributed edits to the manuscript and supplement. All authors have read and agreed to the published version of the manuscript.

Funding

B.P.B. and P.C.S. were primarily supported by a grant from the Ishiyama Foundation to the Water in the West Program while employed at the Woods Institute for the Environment at Stanford University, with additional in-kind contributions during the publication phase. T.M. was supported by Blue Forest Conservation. K.N.W. and E.S. were supported by The Nature Conservancy.

Data Availability Statement

This study did not involve primary data collection. Modeling products and availability of relevant code are described in the Supplementary Materials.

Acknowledgments

The authors gratefully acknowledge Marie Davis, Ben Ransom, and Darin Reintjes of Placer County Water Agency for their inputs to the modeling effort described in this paper. Sarah Yarnell, Amy Lind, and Craig Addley helped us interpret the environmental flows for Foothill yellow-legged frog established in the relicensing. The authors also gratefully acknowledge Phil Bowden, April Brough, and Joe Scott of Pyrologix for execution of the fire behavior modeling.

Conflicts of Interest

This research supports the goals of The Nature Conservancy and Blue Forest Conservation, both 501(c)(3) nonprofit organizations. The authors declare no financial conflicts of interest.

References

  1. Hessburg, P.F.; Prichard, S.J.; Keala Hagmann, R.; Povak, N.A.; Lake, F.K.; Hessburg, C.; Prichard, S.J.; Hagmann, R.K.; Povak, N.A.; Lake, F.K. Wildfire and Climate Change Adaptation of Western North American Forests: A Case for Intentional Management. Ecol. Appl. 2021, 31, e02432. [Google Scholar] [CrossRef]
  2. Prichard, S.J.; Hessburg, P.F.; Hagmann, R.K.; Povak, N.A.; Dobrowski, S.Z.; Hurteau, M.D.; Kane, V.R.; Keane, R.E.; Kobziar, L.N.; Kolden, C.A.; et al. Adapting Western North American Forests to Climate Change and Wildfires: 10 Common Questions. Ecol. Appl. 2021, 31, e02433. [Google Scholar] [CrossRef]
  3. Schoennagel, T.; Balch, J.K.; Brenkert-Smith, H.; Dennison, P.E.; Harvey, B.J.; Krawchuk, M.A.; Mietkiewicz, N.; Morgan, P.; Moritz, M.A.; Rasker, R. Adapt to More Wildfire in Western North American Forests as Climate Changes. Proc. Natl. Acad. Sci. USA 2017, 114, 4582–4590. [Google Scholar] [CrossRef] [PubMed]
  4. Belavenutti, P.; Chung, W.; Ager, A.A. The Economic Reality of the Forest and Fuel Management Deficit on a Fire Prone Western US National Forest. J. Environ. Manag. 2021, 293, 112825. [Google Scholar] [CrossRef] [PubMed]
  5. North, M.P.; Stephens, S.L.; Collins, B.M.; Agee, J.K.; Aplet, G.; Franklin, J.F.; Fulé, P.Z. Reform Forest Fire Management. Science 2015, 349, 1280–1281. [Google Scholar] [CrossRef]
  6. Testimony of Randy Moore Chief of USDA Forest Service 2021. Available online: https://docs.house.gov/meetings/AG/AG15/20210929/114078/HHRG-117-AG15-Wstate-MooreR-20210929.pdf (accessed on 12 February 2023).
  7. USDA Forest Service. Fiscal Year 2017 Budget Overview. USDA. 2016. Available online: https://www.fs.usda.gov/sites/default/files/fy-2017-fs-budget-overview.pdf (accessed on 12 February 2023).
  8. Blue Forest Conservation. Fighting Fire with Finance: A Roadmap for Collective Action; Blue Forest Conservation: Sacramento, CA, USA, 2017; p. 102. [Google Scholar]
  9. Culp, P.; Bayon, R.; Scott, J.; Melton, T. Liquid Assets: Investing for Impact in the Colorado River Basin 2015. Available online: http://encouragecapital.com/wp-content/uploads/docs/water-in-the-west-full-report-final_web.pdf (accessed on 25 July 2022).
  10. Gannon, B.M.; Wei, Y.; Thompson, M.P. Mitigating Source Water Risks with Improved Wildfire Containment. Fire 2020, 3, 45. [Google Scholar] [CrossRef]
  11. Podolak, K.; Edelson, D.; Kruse, S.; Aylward, B.; Zimring, M.; Wobbrock, N. Estimating the Water Supply Benefits from Forest Restoration in the Northern Sierra Nevada. In An Unpublished Report of the Nature Conservancy Prepared with Ecosystem Economics; The Nature Conservancy: San Francisco, CA, USA, 2015. [Google Scholar]
  12. Prestemon, J.P.; Abt, K.L.; Barbour, R.J. Quantifying the Net Economic Benefits of Mechanical Wildfire Hazard Treatments on Timberlands of the Western United States. For. Policy Econ. 2012, 21, 44–53. [Google Scholar] [CrossRef]
  13. Borchers-Arriagada, N.; Bowman, D.M.J.S.; Price, O.; Palmer, A.J.; Samson, S.; Clarke, H.; Sepulveda, G.; Johnston, F.H. Smoke Health Costs and the Calculus for Wildfires Fuel Management: A Modelling Study. Lancet Planet. Health 2021, 5, e608–e619. [Google Scholar] [CrossRef] [PubMed]
  14. Krofcheck, D.J.; Hurteau, M.D.; Scheller, R.M.; Loudermilk, E.L. Restoring Surface Fire Stabilizes Forest Carbon under Extreme Fire Weather in the Sierra Nevada. Ecosphere 2017, 8, e01663. [Google Scholar] [CrossRef]
  15. Stowell, J.D.; Yang, C.-E.; Fu, J.S.; Scovronick, N.C.; Strickland, M.J.; Liu, Y. Asthma Exacerbation Due to Climate Change-Induced Wildfire Smoke in the Western US. Environ. Res. Lett. 2022, 17, 014023. [Google Scholar] [CrossRef]
  16. Liang, S.; Hurteau, M.D.; Westerling, A.L. Large-scale Restoration Increases Carbon Stability under Projected Climate and Wildfire Regimes. Front. Ecol. Environ. 2018, 16, 207–212. [Google Scholar] [CrossRef] [Green Version]
  17. Simonit, S.; Connors, J.P.; Yoo, J.; Kinzig, A.; Perrings, C. The Impact of Forest Thinning on the Reliability of Water Supply in Central Arizona. PLoS ONE 2015, 10, e0121596. [Google Scholar] [CrossRef] [Green Version]
  18. Sun, G.; Caldwell, P.V.; McNulty, S.G. Modelling the Potential Role of Forest Thinning in Maintaining Water Supplies under a Changing Climate across the Conterminous United States: Response of Water Yield to Forest Thinning and Climate Change. Hydrol. Process. 2015, 29, 5016–5030. [Google Scholar] [CrossRef]
  19. Stephens, S.L.; Moghaddas, J.J.; Edminster, C.; Fiedler, C.E.; Haase, S.; Harrington, M.; Keeley, J.E.; Knapp, E.E.; McIver, J.D.; Metlen, K.; et al. Fire Treatment Effects on Vegetation Structure, Fuels, and Potential Fire Severity in Western U.S. Forests. Ecol. Appl. 2009, 19, 305–320. [Google Scholar] [CrossRef] [Green Version]
  20. Stephens, S.L.; Battaglia, M.A.; Churchill, D.J.; Collins, B.M.; Coppoletta, M.; Hoffman, C.M.; Lydersen, J.M.; North, M.P.; Parsons, R.A.; Ritter, S.M.; et al. Forest Restoration and Fuels Reduction: Convergent or Divergent? BioScience 2021, 71, 85–101. [Google Scholar] [CrossRef]
  21. Ma, Q.; Bales, R.C.; Rungee, J.; Conklin, M.H.; Collins, B.M.; Goulden, M.L. Wildfire Controls on Evapotranspiration in California’s Sierra Nevada. J. Hydrol. 2020, 590, 125364. [Google Scholar] [CrossRef]
  22. Roche, J.W.; Ma, Q.; Rungee, J.; Bales, R.C. Evapotranspiration Mapping for Forest Management in California’s Sierra Nevada. Front. For. Glob. Change 2020, 3, 69. [Google Scholar] [CrossRef]
  23. Kattelmann, R.C.; Berg, N.H.; Rector, J. The Potential for Increasing Streamflow from Sierra Nevada Watersheds 1. JAWRA J. Am. Water Resour. Assoc. 1983, 19, 395–402. [Google Scholar] [CrossRef]
  24. Stewart, W.C. Economic Assessment of the Ecosystem. In Sierra Nevada Ecosystem Project: Final report to Congress; Assessments and Scientific Basis for Management Options; University of California, Centers for Water and Wildland Resources: Davis, CA, USA, 1996; Volume III, pp. 973–1064. [Google Scholar]
  25. Marvin, S. Possible Changes in Water Yield and Peak Flows in Response to Forest Management. In Center for Water and Wildland Resources; University of California Davis: Davis, CA, USA, 1996; Volume 101, pp. 154–199. [Google Scholar]
  26. Ziemer, R.R. Water Yields from Forests: An Agnostic View. In Proceedings of the California Watershed Management Conference, West Sacramento, CA, USA, 18–20 November 1986; pp. 74–78. [Google Scholar]
  27. Saksa, P.C.; Bales, R.C.; Tague, C.L.; Battles, J.J.; Tobin, B.W.; Conklin, M.H. Fuels Treatment and Wildfire Effects on Runoff from Sierra Nevada Mixed-conifer Forests. Ecohydrology 2020, 13, e2151. [Google Scholar] [CrossRef]
  28. Saksa, P.C.; Conklin, M.H.; Battles, J.J.; Tague, C.L.; Bales, R.C. Forest Thinning Impacts on the Water Balance of Sierra Nevada Mixed-Conifer Headwater Basins. Water Resour. Res. 2017, 53, 5364–5381. [Google Scholar] [CrossRef] [Green Version]
  29. Bales, R.C.; Battles, J.J.; Chen, Y.; Conklin, M.H.; Holst, E.; O’Hara, K.L.; Saksa, P.; Stewart, W. Forests and Water in the Sierra Nevada: Sierra Nevada Watershed Ecosystem Enhancement Project. Sierra Nevada Research Institute Report. 2011. Available online: https://forests.berkeley.edu/sites/forests.berkeley.edu/files/146199.pdf (accessed on 2 July 2023).
  30. Jones, K.W.; Gannon, B.; Timberlake, T.; Chamberlain, J.L.; Wolk, B. Societal Benefits from Wildfire Mitigation Activities through Payments for Watershed Services: Insights from Colorado. For. Policy Econ. 2022, 135, 102661. [Google Scholar] [CrossRef]
  31. USDA Forest Service French Meadows. Available online: https://www.fs.usda.gov/project/?project=51549 (accessed on 7 September 2022).
  32. USGS LANDFIRE Existing Vegetation Type Layer. Available online: http://landfire.cr.usgs.gov/viewer/ (accessed on 16 July 2017).
  33. Smith, E. French Meadows Project Fire & Fuels Specialist Report. 2018. Available online: https://usfs-public.app.box.com/v/PinyonPublic/file/933979413993 (accessed on 27 January 2023).
  34. Ghodrat, M.; Shakeriaski, F.; Fanaee, S.A.; Simeoni, A. Software-Based Simulations of Wildfire Spread and Wind-Fire Interaction. Fire 2022, 6, 12. [Google Scholar] [CrossRef]
  35. Short, K.C.; Finney, M.A.; Scott, J.H.; Gilbertson-Day, J.W.; Grenfell, I.C. Spatial Dataset of Probabilistic Wildfire Risk Components for the Conterminous United States; Forest Service Research Data Archive; USDA Forest Service: Fort Collins, CO, USA, 2016. [Google Scholar]
  36. Tague, C.L.; Band, L.E. RHESSys: Regional Hydro-Ecologic Simulation System—An Object-Oriented Approach to Spatially Distributed Modeling of Carbon, Water, and Nutrient Cycling. Earth Interact. 2004, 8, 1–42. [Google Scholar] [CrossRef]
  37. Bart, R.R.; Tague, C.L.; Moritz, M.A. Effect of Tree-to-Shrub Type Conversion in Lower Montane Forests of the Sierra Nevada (USA) on Streamflow. PLoS ONE 2016, 11, e0161805. [Google Scholar] [CrossRef] [Green Version]
  38. Grant, G.E.; Tague, C.L.; Allen, C.D. Watering the Forest for the Trees: An Emerging Priority for Managing Water in Forest Landscapes. Front. Ecol. Environ. 2013, 11, 314–321. [Google Scholar] [CrossRef] [Green Version]
  39. López-Moreno, J.I.; Zabalza, J.; Vicente-Serrano, S.M.; Revuelto, J.; Gilaberte, M.; Azorin-Molina, C.; Morán-Tejeda, E.; García-Ruiz, J.M.; Tague, C. Impact of Climate and Land Use Change on Water Availability and Reservoir Management: Scenarios in the Upper Aragón River, Spanish Pyrenees. Sci. Total Environ. 2014, 493, 1222–1231. [Google Scholar] [CrossRef] [Green Version]
  40. Federal Energy Regulatory Commission Final Environmental Impact Statement for Hydropower License. Middle Fork American River Hydroelectric Project, FERC Project No. 2079-069. 2013. Available online: https://www.waterboards.ca.gov/waterrights/water_issues/programs/water_quality_cert/docs/mfar2079/mfar_final_eis.pdf (accessed on 24 July 2023).
  41. USDA Forest Service. Forest Service Final Conditions and Recommendations Provided under 18 CFR § 4.34 (b)(1) In Connection with the Application for Relicensing for the Middle American River Project (FERC No. 2079); U.S. Department of Agriculture Forest Service: Washington, DC, USA, 2012. [Google Scholar]
  42. Herman, J.D.; Giuliani, M. Policy Tree Optimization for Threshold-Based Water Resources Management over Multiple Timescales. Environ. Model. Softw. 2018, 99, 39–51. [Google Scholar] [CrossRef]
  43. US Fish and Wildlife Service. Endangered and Threatened Wildlife and Plants; Foothill Yellow-Legged Frog; Threatened Status With Section 4(d) Rule for Two Distinct Population Segments and Endangered Status for Two Distinct Population Segments (Proposed Rule) 2021. Available online: https://www.federalregister.gov/documents/2021/12/28/2021-27512/endangered-and-threatened-wildlife-and-plants-foothill-yellow-legged-frog-threatened-status-with (accessed on 12 February 2023).
  44. Yarnell, S.M.; Petts, G.E.; Schmidt, J.C.; Whipple, A.A.; Beller, E.E.; Dahm, C.N.; Goodwin, P.; Viers, J.H. Functional Flows in Modified Riverscapes: Hydrographs, Habitats and Opportunities. BioScience 2015, 65, 963–972. [Google Scholar] [CrossRef] [Green Version]
  45. Yarnell, S.; Peek, R.; Epke, G.; Lind, A. Management of the Spring Snowmelt Recession in Regulated Systems. JAWRA J. Am. Water Resour. Assoc. 2016, 52, 723–736. [Google Scholar] [CrossRef]
  46. Saksa, P.C.; Conklin, M.H.; Tague, C.L.; Bales, R.C. Hydrologic Response of Sierra Nevada Mixed-Conifer Headwater Catchments to Vegetation Treatments and Wildfire in a Warming Climate. Front. For. Glob. Change 2020, 3, 539429. [Google Scholar] [CrossRef]
  47. Su, Y.; Kern, J.D.; Reed, P.M.; Characklis, G.W. Compound Hydrometeorological Extremes across Multiple Timescales Drive Volatility in California Electricity Market Prices and Emissions. Appl. Energy 2020, 276, 115541. [Google Scholar] [CrossRef]
  48. Jones, K.W.; Cannon, J.B.; Saavedra, F.A.; Kampf, S.K.; Addington, R.N.; Cheng, A.S.; MacDonald, L.H.; Wilson, C.; Wolk, B. Return on Investment from Fuel Treatments to Reduce Severe Wildfire and Erosion in a Watershed Investment Program in Colorado. J. Environ. Manag. 2017, 198, 66–77. [Google Scholar] [CrossRef] [PubMed] [Green Version]
  49. Guo, H.; Goulden, M.; Chung, M.G.; Nyelele, C.; Egoh, B.; Keske, C.; Conklin, M.; Bales, R. Valuing the Benefits of Forest Restoration on Enhancing Hydropower and Water Supply in California’s Sierra Nevada. Sci. Total Environ. 2023, 876, 162836. [Google Scholar] [CrossRef] [PubMed]
  50. Hurford, A.P.; McCartney, M.P.; Harou, J.J.; Dalton, J.; Smith, D.M.; Odada, E. Balancing Services from Built and Natural Assets via River Basin Trade-off Analysis. Ecosyst. Serv. 2020, 45, 101144. [Google Scholar] [CrossRef]
  51. Goulden, M.L.; Bales, R.C. Mountain Runoff Vulnerability to Increased Evapotranspiration with Vegetation Expansion. Proc. Natl. Acad. Sci. USA 2014, 111, 14071–14075. [Google Scholar] [CrossRef] [PubMed]
  52. Bales, R.C.; Goulden, M.L.; Hunsaker, C.T.; Conklin, M.H.; Hartsough, P.C.; O’Geen, A.T.; Hopmans, J.W.; Safeeq, M. Mechanisms Controlling the Impact of Multi-Year Drought on Mountain Hydrology. Sci. Rep. 2018, 8, 690. [Google Scholar] [CrossRef] [Green Version]
  53. Pelletier, J.D.; Orem, C.A. How Do Sediment Yields from Post-Wildfire Debris-Laden Flows Depend on Terrain Slope, Soil Burn Severity Class, and Drainage Basin Area? Insights from Airborne-LiDAR Change Detection: Post-fire sediment yields measured by airborne lidar. Earth Surf. Process. Landforms 2014, 39, 1822–1832. [Google Scholar] [CrossRef]
  54. Rhoades, C.C.; Entwistle, D.; Butler, D. The Influence of Wildfire Extent and Severity on Streamwater Chemistry, Sediment and Temperature Following the Hayman Fire, Colorado. Int. J. Wildland Fire 2011, 20, 430–442. [Google Scholar] [CrossRef]
  55. Horner, I.; Renard, B.; Le Coz, J.; Branger, F.; McMillan, H.K.; Pierrefeu, G. Impact of Stage Measurement Errors on Streamflow Uncertainty. Water Resour. Res. 2018, 54, 1952–1976. [Google Scholar] [CrossRef] [Green Version]
  56. Kiang, J.E.; Gazoorian, C.; McMillan, H.; Coxon, G.; Le Coz, J.; Westerberg, I.K.; Belleville, A.; Sevrez, D.; Sikorska, A.E.; Petersen-Øverleir, A.; et al. A Comparison of Methods for Streamflow Uncertainty Estimation. Water Resour. Res. 2018, 54, 7149–7176. [Google Scholar] [CrossRef] [Green Version]
  57. Nicholson, T.; Babendreier, J.; Meyer, P.; Mohanty, S.; Hicks, B.; Leavesley, G. (Eds.) Proceedings of the International Workshop on Uncertainty, Sensitivity, and Parameter Estimation for Multimedia Environmental Modeling. Interagency Steering Committee on Multimedia Environmental Models. 2004. Available online: https://www.nrc.gov/reading-rm/doc-collections/nuregs/conference/cp0187/index.html (accessed on 27 June 2023).
  58. Cohen, J.S.; Zeff, H.B.; Herman, J.D. Adaptation of Multiobjective Reservoir Operations to Snowpack Decline in the Western United States. J. Water Resour. Plan. Manag. 2020, 146, 04020091. [Google Scholar] [CrossRef]
  59. Stevens, J.T. Scale-Dependent Effects of Post-Fire Canopy Cover on Snowpack Depth in Montane Coniferous Forests. Ecol. Appl. 2017, 27, 1888–1900. [Google Scholar] [CrossRef]
  60. Maurer, G.E.; Bowling, D.R. Seasonal Snowpack Characteristics Influence Soil Temperature and Water Content at Multiple Scales in Interior Western U.S. Mountain Ecosystems. Water Resour. Res. 2014, 50, 5216–5234. [Google Scholar] [CrossRef]
  61. Charron, C.; St-Hilaire, A.; Ouarda, T.B.M.J.; Van den Heuvel, M.R. Water Temperature and Hydrological Modelling in the Context of Environmental Flows and Future Climate Change: Case Study of the Wilmot River (Canada). Water 2021, 13, 2101. [Google Scholar] [CrossRef]
  62. Sadro, S.; Melack, J.M.; Sickman, J.O.; Skeen, K. Climate Warming Response of Mountain Lakes Affected by Variations in Snow. Limnol. Oceanogr. Lett. 2019, 4, 9–17. [Google Scholar] [CrossRef] [Green Version]
  63. Nasirzadehdizaji, R.; Akyuz, D.E. Predicting the Potential Impact of Forest Fires on Runoff and Sediment Loads Using a Distributed Hydrological Modeling Approach. Ecol. Model. 2022, 468, 109959. [Google Scholar] [CrossRef]
  64. Gleason, K.E.; Nolin, A.W. Charred Forests Accelerate Snow Albedo Decay: Parameterizing the Post-Fire Radiative Forcing on Snow for Three Years Following Fire. Hydrol. Process. 2016, 30, 3855–3870. [Google Scholar] [CrossRef]
  65. Uecker, T.M.; Kaspari, S.D.; Musselman, K.N.; Skiles, S.M. The Post-Wildfire Impact of Burn Severity and Age on Black Carbon Snow Deposition and Implications for Snow Water Resources, Cascade Range, Washington. J. Hydrometeorol. 2020, 21, 1777–1792. [Google Scholar] [CrossRef]
  66. Dobre, M.; Long, J.W.; Maxwell, C.; Elliot, W.J.; Lew, R.; Brooks, E.S.; Scheller, R.M. Water Quality and Forest Restoration in the Lake Tahoe Basin: Impacts of Future Management Options. Ecol. Soc. 2022, 27, 447–457. [Google Scholar] [CrossRef]
  67. Rhoades, C.C.; Nunes, J.P.; Silins, U.; Doerr, S.H. The Influence of Wildfire on Water Quality and Watershed Processes: New Insights and Remaining Challenges. Int. J. Wildland Fire 2019, 28, 721–725. [Google Scholar] [CrossRef] [Green Version]
  68. Smith, H.G.; Sheridan, G.J.; Lane, P.N.J.; Nyman, P.; Haydon, S. Wildfire Effects on Water Quality in Forest Catchments: A Review with Implications for Water Supply. J. Hydrol. 2011, 396, 170–192. [Google Scholar] [CrossRef]
  69. Goss, M.; Swain, D.L.; Abatzoglou, J.T.; Sarhadi, A.; Kolden, C.A.; Williams, A.P.; Diffenbaugh, N.S. Climate Change Is Increasing the Likelihood of Extreme Autumn Wildfire Conditions across California. Environ. Res. Lett. 2020, 15, 094016. [Google Scholar] [CrossRef] [Green Version]
  70. Khorshidi, M.S.; Dennison, P.E.; Nikoo, M.R.; AghaKouchak, A.; Luce, C.H.; Sadegh, M. Increasing Concurrence of Wildfire Drivers Tripled Megafire Critical Danger Days in Southern California Between1982 and 2018. Environ. Res. Lett. 2020, 15, 104002. [Google Scholar] [CrossRef]
  71. Swain, D.L. A Shorter, Sharper Rainy Season Amplifies California Wildfire Risk. Geophys. Res. Lett. 2021, 48, e2021GL092843. [Google Scholar] [CrossRef]
  72. Donovan, G.H.; Brown, T.C. An Alternative Incentive Structure for Wildfire Management on National Forest Land. For. Sci. 2005, 51, 387–395. [Google Scholar]
  73. Keane, R.E.; Karau, E. Evaluating the Ecological Benefits of Wildfire by Integrating Fire and Ecosystem Simulation Models. Ecol. Model. 2010, 221, 1162–1172. [Google Scholar] [CrossRef]
  74. Gronsdahl, S.; Moore, R.D.; Rosenfeld, J.; McCleary, R.; Winkler, R. Effects of Forestry on Summertime Low Flows and Physical Fish Habitat in Snowmelt-Dominant Headwater Catchments of the Pacific Northwest. Hydrol. Process. 2019, 33, 3152–3168. [Google Scholar] [CrossRef]
  75. Perry, T.D.; Jones, J.A. Summer Streamflow Deficits from Regenerating Douglas-Fir Forest in the Pacific Northwest, USA. Ecohydrology 2017, 10, e1790. [Google Scholar] [CrossRef]
  76. Segura, C.; Bladon, K.D.; Hatten, J.A.; Jones, J.A.; Hale, V.C.; Ice, G.G. Long-Term Effects of Forest Harvesting on Summer Low Flow Deficits in the Coast Range of Oregon. J. Hydrol. 2020, 585, 124749. [Google Scholar] [CrossRef]
  77. Moeser, C.D.; Broxton, P.D.; Harpold, A.; Robertson, A. Estimating the Effects of Forest Structure Changes From Wildfire on Snow Water Resources Under Varying Meteorological Conditions. Water Resour. Res. 2020, 56, e2020WR027071. [Google Scholar] [CrossRef]
  78. Brough, A.; Vogler, K.C.; Gilbertson-Day, J.W.; Scott, J.H. Potential Wildfire Behavior of Treatment Alternatives for the French Meadows/American River Headwaters Project Area; Pyrologix LLC: Missoula, MT, USA, 2017. [Google Scholar]
  79. Giuliani, M.; Herman, J.D.; Castelletti, A.; Reed, P. Many-Objective Reservoir Policy Identification and Refinement to Reduce Policy Inertia and Myopia in Water Management. Water Resour. Res. 2014, 50, 3355–3377. [Google Scholar] [CrossRef] [Green Version]
  80. Helmbrecht, D.J.; Blankenship, K. Modifying LANDFIRE Geospatial Data for Local Applications. 2016. Available online: https://www.conservationgateway.org/ConservationPractices/FireLandscapes/LANDFIRE/Documents/ModifyingLF_DataGuide_V1.pdf (accessed on 28 January 2023).
  81. Koza, J.R. Genetic Programing II: Automatic Discovery of Reusable Programs; MIT Press: Cambridge, MA, USA, 1994. [Google Scholar]
  82. LANDFIRE. The LANDFIRE Total FUel Change Tool (ToFuΔ) User’s Guide; USGS Earth Resources Observation and Science (EROS) Center: Sioux Falls, SD, USA, 2011. [Google Scholar]
  83. Reinhardt, E.; Lutes, D.; Scott, J. FuelCalc: A Method for Estimating Fuel Characteristics; USDA Forest Service: Fort Collins, CO, USA, 2006. [Google Scholar]
  84. Thornton, P.E.; Thornton, M.M.; Mayer, B.W.; Whilhelmi, N.; Wei, Y.; Devarkonda, R.; Cook, R.B. Daymet: Daily Surface Weather Data on a 1-Km Grid for North America, Version 2; ORNL DAAC: Oak Ridge, TN, USA, 2014. [Google Scholar]
  85. USDA Forest Service. Region 5 Vegetation Burn Severity Fire Perimeters; USFS Pacific Southwest Research Station, Fire & Aviation Management: McClellan, CA, USA, 2015. [Google Scholar]
  86. Son, K.; Tague, C.; Hunsaker, C. Effects of Model Spatial Resolution on Ecohydrologic Predictions and Their Sensitivity to Inter-Annual Climate Variability. Water 2016, 8, 321. [Google Scholar] [CrossRef] [Green Version]
Figure 1. (a) Location of the French Meadows Reservoir and catchment and project treatment plan. This study considers the impact of the full treatment on fire behavior, but estimates of ecohydrologic impacts on water supply and reservoir operations are within the catchment boundary (black outline). (b) American River Headwaters, showing the broader hydroelectric project.
Sustainability 15 11549 g001
Figure 2. (a) Qualitative modeling workflow including research questions, modeling approaches, and resulting product. (b) Mechanical modeling workflow. The scenarios explored at each stage are carried through and “crossed” with all others, resulting in a hydropower generation under a full factorial design of 12 scenarios (e-flow refers to environmental flows).
Sustainability 15 11549 g002
Figure 3. Impact of treatment on flows into French Meadows Reservoir for (a) moderate- and no-fire scenarios and (b) extreme-fire scenarios relative to the no-treatment/no-fire scenario. Columns are annotated with the differential impact of treatment on flows for each scenario.
Sustainability 15 11549 g003aSustainability 15 11549 g003b
Figure 4. Absolute change in annual inflows into French Meadows Reservoir by annual precipitation levels for (a) moderate- and no-fire scenarios and (b) extreme-fire scenarios relative to the no-treatment/no-fire scenario. Lines are annotated with their slopes.
Sustainability 15 11549 g004aSustainability 15 11549 g004b
Figure 5. Relative change in annual inflows into French Meadows Reservoir for (a) moderate- and no-fire scenarios and (b) extreme-fire scenarios relative to the no-treatment/no-fire scenario.
Sustainability 15 11549 g005aSustainability 15 11549 g005b
Figure 6. Interacted impact of fire, treatment, and FERC environmental flows requirement on power generation: (a) moderate- and no-fire scenarios and (b) extreme-fire scenarios. Results are presented as both absolute change in power generation (left axis) and change in revenue (right axis) relative to the no-treatment/no-fire scenario. The dollar values on the right axis assume a nominal price of USD 40/MWh. Note that the axis for the extreme fire results (b) does not include zero in order to more fully reveal the treatment and environmental flow scenario impacts.
Sustainability 15 11549 g006
Figure 7. Plot demonstrating the impact of benefit duration uncertainty and choice of discount rate uncertainty on water yield benefits relative to restoration project costs. Contours indicate the fraction of project cost that can be recovered by increased revenues as a function of discount rate and the duration over which the benefits from treatment are assumed to accrue. The most optimistic cases of long duration and low discount rate reach about one-sixth of the present value of the project costs, while shorter durations of benefits at higher discount rates are under one-tenth of the costs.
Sustainability 15 11549 g007
Table 1. Vegetation response to fire according to treatment condition.
UntreatedTreated
Fire ScenarioArea Burned (km2)LAICanopy CoverArea Burned (km2)LAICanopy Cover
No Fire-4.940.47-4.210.41
Moderate68.83.830.4046.73.490.37
Extreme75.11.830.2575.13.040.27
Table 2. Generation potential per unit inflow estimated using integrated modeling and first principles approaches.
MethodFire ScenarioUnit Generation Potential (MWh/Acre-Foot) Unit Generation
Potential
(% of Theoretical
Maximum *)
Overestimate
Associated with First Principles
Approach
Integrated modelingNo Fire1.4973.0%11.7%
Moderate Fire1.3968.4%19.3%
Extreme Fire0.95647.0%73.6%
First principles approachN/A1.6681.6%N/A
* theoretical maximum was calculated to be 2.03 MWh/acre-foot.
Disclaimer/Publisher’s Note: The statements, opinions and data contained in all publications are solely those of the individual author(s) and contributor(s) and not of MDPI and/or the editor(s). MDPI and/or the editor(s) disclaim responsibility for any injury to people or property resulting from any ideas, methods, instructions or products referred to in the content.

