Article

The Optimal Design of a Hybrid Solar PV/Wind/Hydrogen/Lithium Battery for the Replacement of a Heavy Fuel Oil Thermal Power Plant

1
Department of Electrical and Electronic Engineering, Faculty of Engineering and Technology, University of Buea, Buea P.O. Box 63, Cameroon
2
National Engineering School of Sousse ENISO Laboratory: Networked Objects, Control, and Communication Systems (NOCCS), National Engineering School of Sousse, Sousse 4054, Tunisia
3
Department of Electrical and Computer Engineering, Debre Markos University, Debre Markos P.O. Box 269, Ethiopia
4
College of Engineering and Technology, American University of the Middle East, Egaila 54200, Kuwait
5
Department of Electrical and Electronic Engineering Technology, Faculty of Engineering and the Built Environment, University of Johannesburg, Johannesburg 2006, South Africa
6
Department of Electrical and Computer Engineering, Hawassa University, Hawassa P.O. Box 05, Ethiopia
*
Authors to whom correspondence should be addressed.
Sustainability 2023, 15(15), 11510; https://doi.org/10.3390/su151511510
Submission received: 18 May 2023 / Revised: 11 July 2023 / Accepted: 12 July 2023 / Published: 25 July 2023

Abstract

:
Renewable energies are clean alternatives to the highly polluting fossil fuels that are still used in the power generation sector. The goal of this research was to look into replacing a Heavy Fuel Oil (HFO) thermal power plant in Limbe, southwest Cameroon, with a hybrid photovoltaic (PV) and wind power plant combined with a storage system. Lithium batteries and hydrogen associated with fuel cells make up this storage system. The total cost (TC) of the project over its lifetime was minimized in order to achieve the optimal sizing of the hybrid power plant components. To ensure the reliability of the new hybrid power plant, a criterion measuring the loss of power supply probability (LPSP) was implemented as a constraint. Moth Flame Optimization (MFO), Improved Grey Wolf Optimizer (I-GWO), Multi-Verse Optimizer (MVO), and African Vulture Optimization Algorithm (AVOA) were used to solve this single-objective optimization problem. The optimization techniques entailed the development of mathematical models of the components, with hourly weather data for the selected site and the output of the replaced thermal power plant serving as input data. All four algorithms produced acceptable and reasonably comparable results. However, in terms of proportion, the total cost obtained with the MFO algorithm was 0.32%, 0.40%, and 0.63% lower than the total costs obtained with the I-GWO, MVO, and AVOA algorithms, respectively. Finally, the effect of the type of storage coupled to the PV and wind systems on the overall project cost was assessed. The MFO meta-heuristic was used to compare the results for the PV–Wind–Hydrogen–Lithium Battery, PV–Wind–Hydrogen, and PV–Wind–Lithium Battery scenarios. The scenario of the PV–Wind–Hydrogen–Lithium Battery had the lowest total cost. This scenario’s total cost was 2.40% and 18% lower than the PV–Wind–Hydrogen and PV–Wind–Lithium Battery scenarios.

1. Introduction

The devastating effects of global warming on humanity are compelling human societies to alter their lifestyles in order to effectively combat this scourge. Electricity, heating, and transportation are the industries that emit the most greenhouse gases into the atmosphere. In 2016, these industries accounted for 73.2% of environmental greenhouse gas emissions [1]. In the power generation sector, the use of fossil fuels such as coal, heavy fuel oil, light fuel oil, and gas contributes to and accelerates global warming. Furthermore, fossil energy sources are becoming scarcer, and their depletion is anticipated within the next few decades [2]. Faced with this situation and its unanticipated environmental consequences, the nations of the world must expedite the energy transition by replacing thermal power plants with renewable energy plants, such as solar photovoltaic and wind power. As technologies mature [3,4] and become more competitive [5], these two renewable energy sources are becoming increasingly popular.
Cameroon, one of the world’s least developed countries, generated 23% of its electricity from thermal power plants in 2019 [6,7]. Nonetheless, the country has a relatively untapped potential for renewable energy resources that could be used to replace all of the thermal power plants that are currently installed and operational on its territory. In fact, the country receives relatively high levels of sunlight across its territory, with an average of 5.8 kWh/day/m2 in the north and 4.9 kWh/day/m2 in the rest of the country [8]. Neither is the country’s wind energy potential insignificant. According to the International Renewable Energy Agency (IRENA) study, Cameroon has a potential of nearly 979 TWh/year [9].
However, because wind and solar irradiation are unpredictable, using these two sources to replace perfectly controllable thermal power plants poses enormous challenges. To address this issue, storage systems are linked to renewable energy systems to ensure the continuity of energy supply to the various loads, even if there is a mismatch between production and demand. For large-scale applications, several storage systems are used, the most common of which is pump-hydro energy storage (PHES). Its installation, nevertheless, necessitates favorable topological conditions [10], as well as the availability of water [11]. Other storage systems, such as hydrogen produced by the decomposition of water and lithium-ion batteries, are promising for both large and small applications. Indeed, hydrogen can be used by fuel cells to generate electricity while emitting little chemical pollution [12]. The most widely used batteries in the world are lithium batteries, which account for the vast majority of the 16 GW installed globally [13]. Lithium batteries respond in milliseconds [14], have a high energy density, and have a slightly higher cycle number than the majority of battery types [15]. Combining these two types of storage with wind and PV systems could provide a viable alternative to thermal power plants, which are still used to generate electricity.
The installation of storage systems in conjunction with renewable energy systems has a significant impact on the competitiveness of such systems due to the total cost of the project. The proper sizing of such systems is critical. Some research has concentrated on smart grid concepts in order to reduce investment costs and, as a result, improve the profitability of renewable energy systems [16,17]. A number of studies have focused on the optimal sizing of these renewable energy systems, using either specialized software such as HOMER [18,19,20] or optimization techniques [21,22,23]. Meta-heuristic algorithms have been widely used for the optimal sizing of hybrid renewable energy sources because of their simple implementation, independence from gradient computations, and ability to depart from local optimal points [24,25]. These algorithms can handle nonlinearity and complexity in optimization models. Meta-heuristic approaches have an advantage over traditional optimization techniques in that they can handle non-convex optimization problems and can uncover and reach global optima, which is unusual when traditional techniques are used. Many meta-heuristic algorithms, such as the Whale Optimization Algorithm (WOA) [26], the Non-Dominated Sorting Genetic Algorithm-II (NSGA-II) [27], the Particle Swarm Optimization (PSO) [28], the Teaching-Learning-Based Optimization (TLBO) [29], the chameleon swarm algorithm (CSA) [30], the Grey Wolf Optimization (GWO) [31], and the Seagull Optimization Algorithm (SOA) [32], have been used to solve optimal sizing problems in hybrid renewable energy systems. Several research projects have been carried out using meta-heuristics for the optimal dimensioning of the components of renewable energy systems with energy storage systems such as lithium-ion batteries and/or fuel cells. Indeed, the optimal sizing of a PV/biogas/fuel cell hybrid system has been achieved by minimizing the energy cost (EC), the LPSP, and the excess energy produced in [33]. The Mayfly Optimization Algorithm (MOA) was implemented, and its outcomes were compared to those of the Sooty Tern Optimization Algorithm (STOA), the WOA, and the Sine Cosine Algorithm (SCA). The best results were obtained using the MOA algorithm. The Improved Artificial Ecosystem Optimization (IAEO) meta-heuristic was employed to optimize the sizing of a PV–Wind–Fuel cell system in order to reduce the cost of energy (COE) [34]. The IAEO algorithm’s results were compared to those of the Artificial Ecosystem Optimization (AEO), PSO, Salp Swarm Algorithm (SSA), and GWO algorithms. The best outcomes were generated using the IAEO algorithm. In [35], the authors used the NSGA-II algorithm to optimize the sizing of a renewable energy system consisting of wind turbines, fuel cells, and supercapacitors, with the objective of minimizing the total annual cost (TAC) and the LPSP. Similarly, in [36], The Jaya algorithm was used to analyze Wind–fuel cell and PV–Wind–FC configurations, with its findings being compared to PSO, the genetic algorithm (GA), and the backward search algorithm. The PV–FC combination was more cost-effective than the PV–wind–FC setup, according to the study’s findings. Similar research on the PV–wind–hydrogen storage configuration’s optimal sizing was performed in [37], with the total net present cost (TNPC) as the decision criterion and the loss of energy expected (LOEE) and loss of load expectation (LOLE) as the reliability constraints. The intelligent Floral Pollination Algorithm (FPA) was employed to find the best solutions, and the outcomes were contrasted with those of the TLBO and PSO algorithms. The FPA algorithm performed better than the PSO and TLBO algorithms, according to a comparison of the findings. Similar to previous studies, this one focused on the optimal sizing of a grid-connected PV–Wind–FC system subject to well-defined LPSP constraints [38]. The results of the algorithm, developed by combining the Firefly Algorithm and Harmony Search Optimization, were compared to those of the PSO. A PV/wind/FC system with a specified probability limit for load interruption was sized using a combination of two meta-heuristics, the GWO and the SCA [39]. The use of algorithms derived from the hybridization of two optimization techniques, as well as the use of multiple optimization techniques to address complex problems, produces better results.
This study concentrated on the optimal sizing of a hybrid power plant comprising PV and wind systems, as well as the integration of a storage system consisting of lithium batteries and hydrogen used by the fuel cells to generate electricity. The idea of combining two of the most promising storage systems was inspired by a highly innovative project that is currently in development [40,41]. Lithium batteries are primarily used for short-term storage, while hydrogen batteries are used for long-term storage. The impact of storage types on the decision criterion, i.e., the total project cost, was evaluated by comparing the following configurations: PV–Wind–Hydrogen–Lithium Battery, PV–Wind–Hydrogen, and PV–Wind–Lithium Battery, in order to select the best possible configuration. To ensure the reliability of the new hybrid power plant, the LPSP was implemented as a system constraint. Several optimization techniques were used, and the results were compared. These include nature-inspired meta-heuristics such as MFO [42], I-GWO [43], MVO [44], and AVOA [45]. The main contributions of this paper, compared to the existing studies, can be summarized as follows:
  • A hybrid solar PV/wind/Hydrogen/battery system was examined and then simulated in accordance with the actual system to replace the practical thermal HFO generators from the southwest Cameroon power production facility.
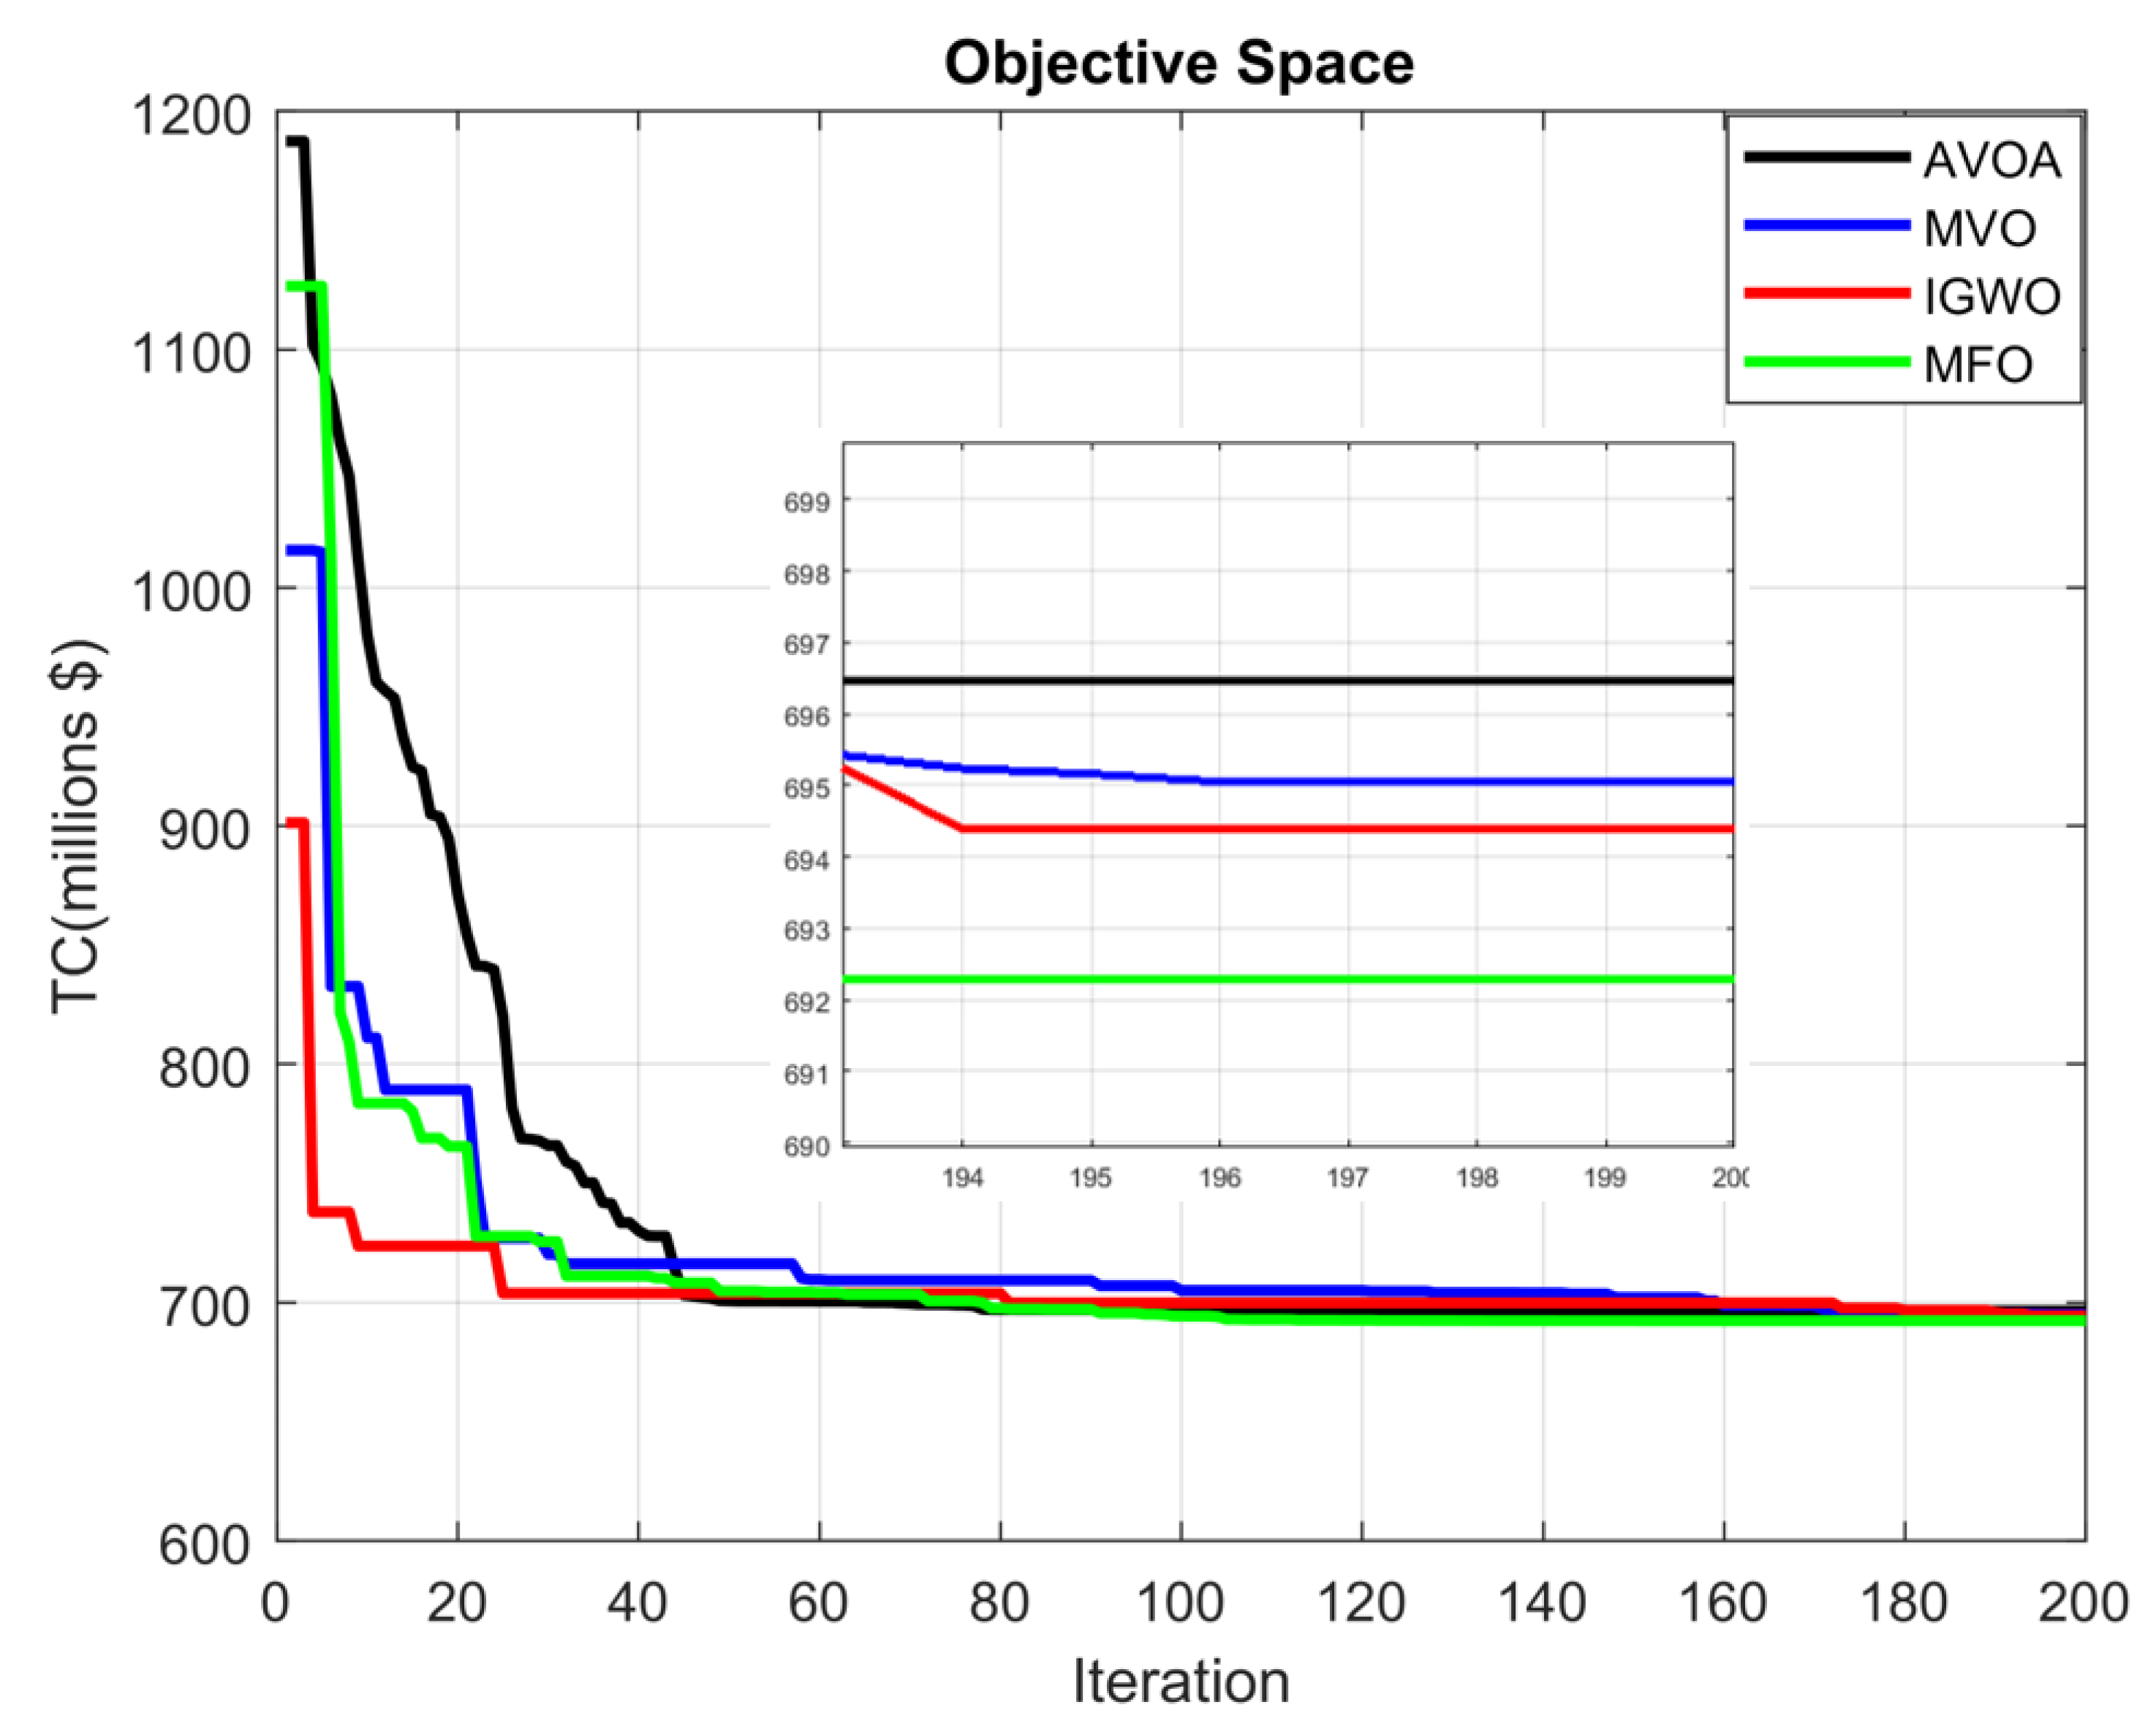
  • MFO, I-GWO, MVO, and AVOA were used to examine the appropriate sizing of the hybrid solar PV/wind/fuel cell/battery system for the replacement of the 85 MW LIMBE HFO thermal power plant, and their results were compared.
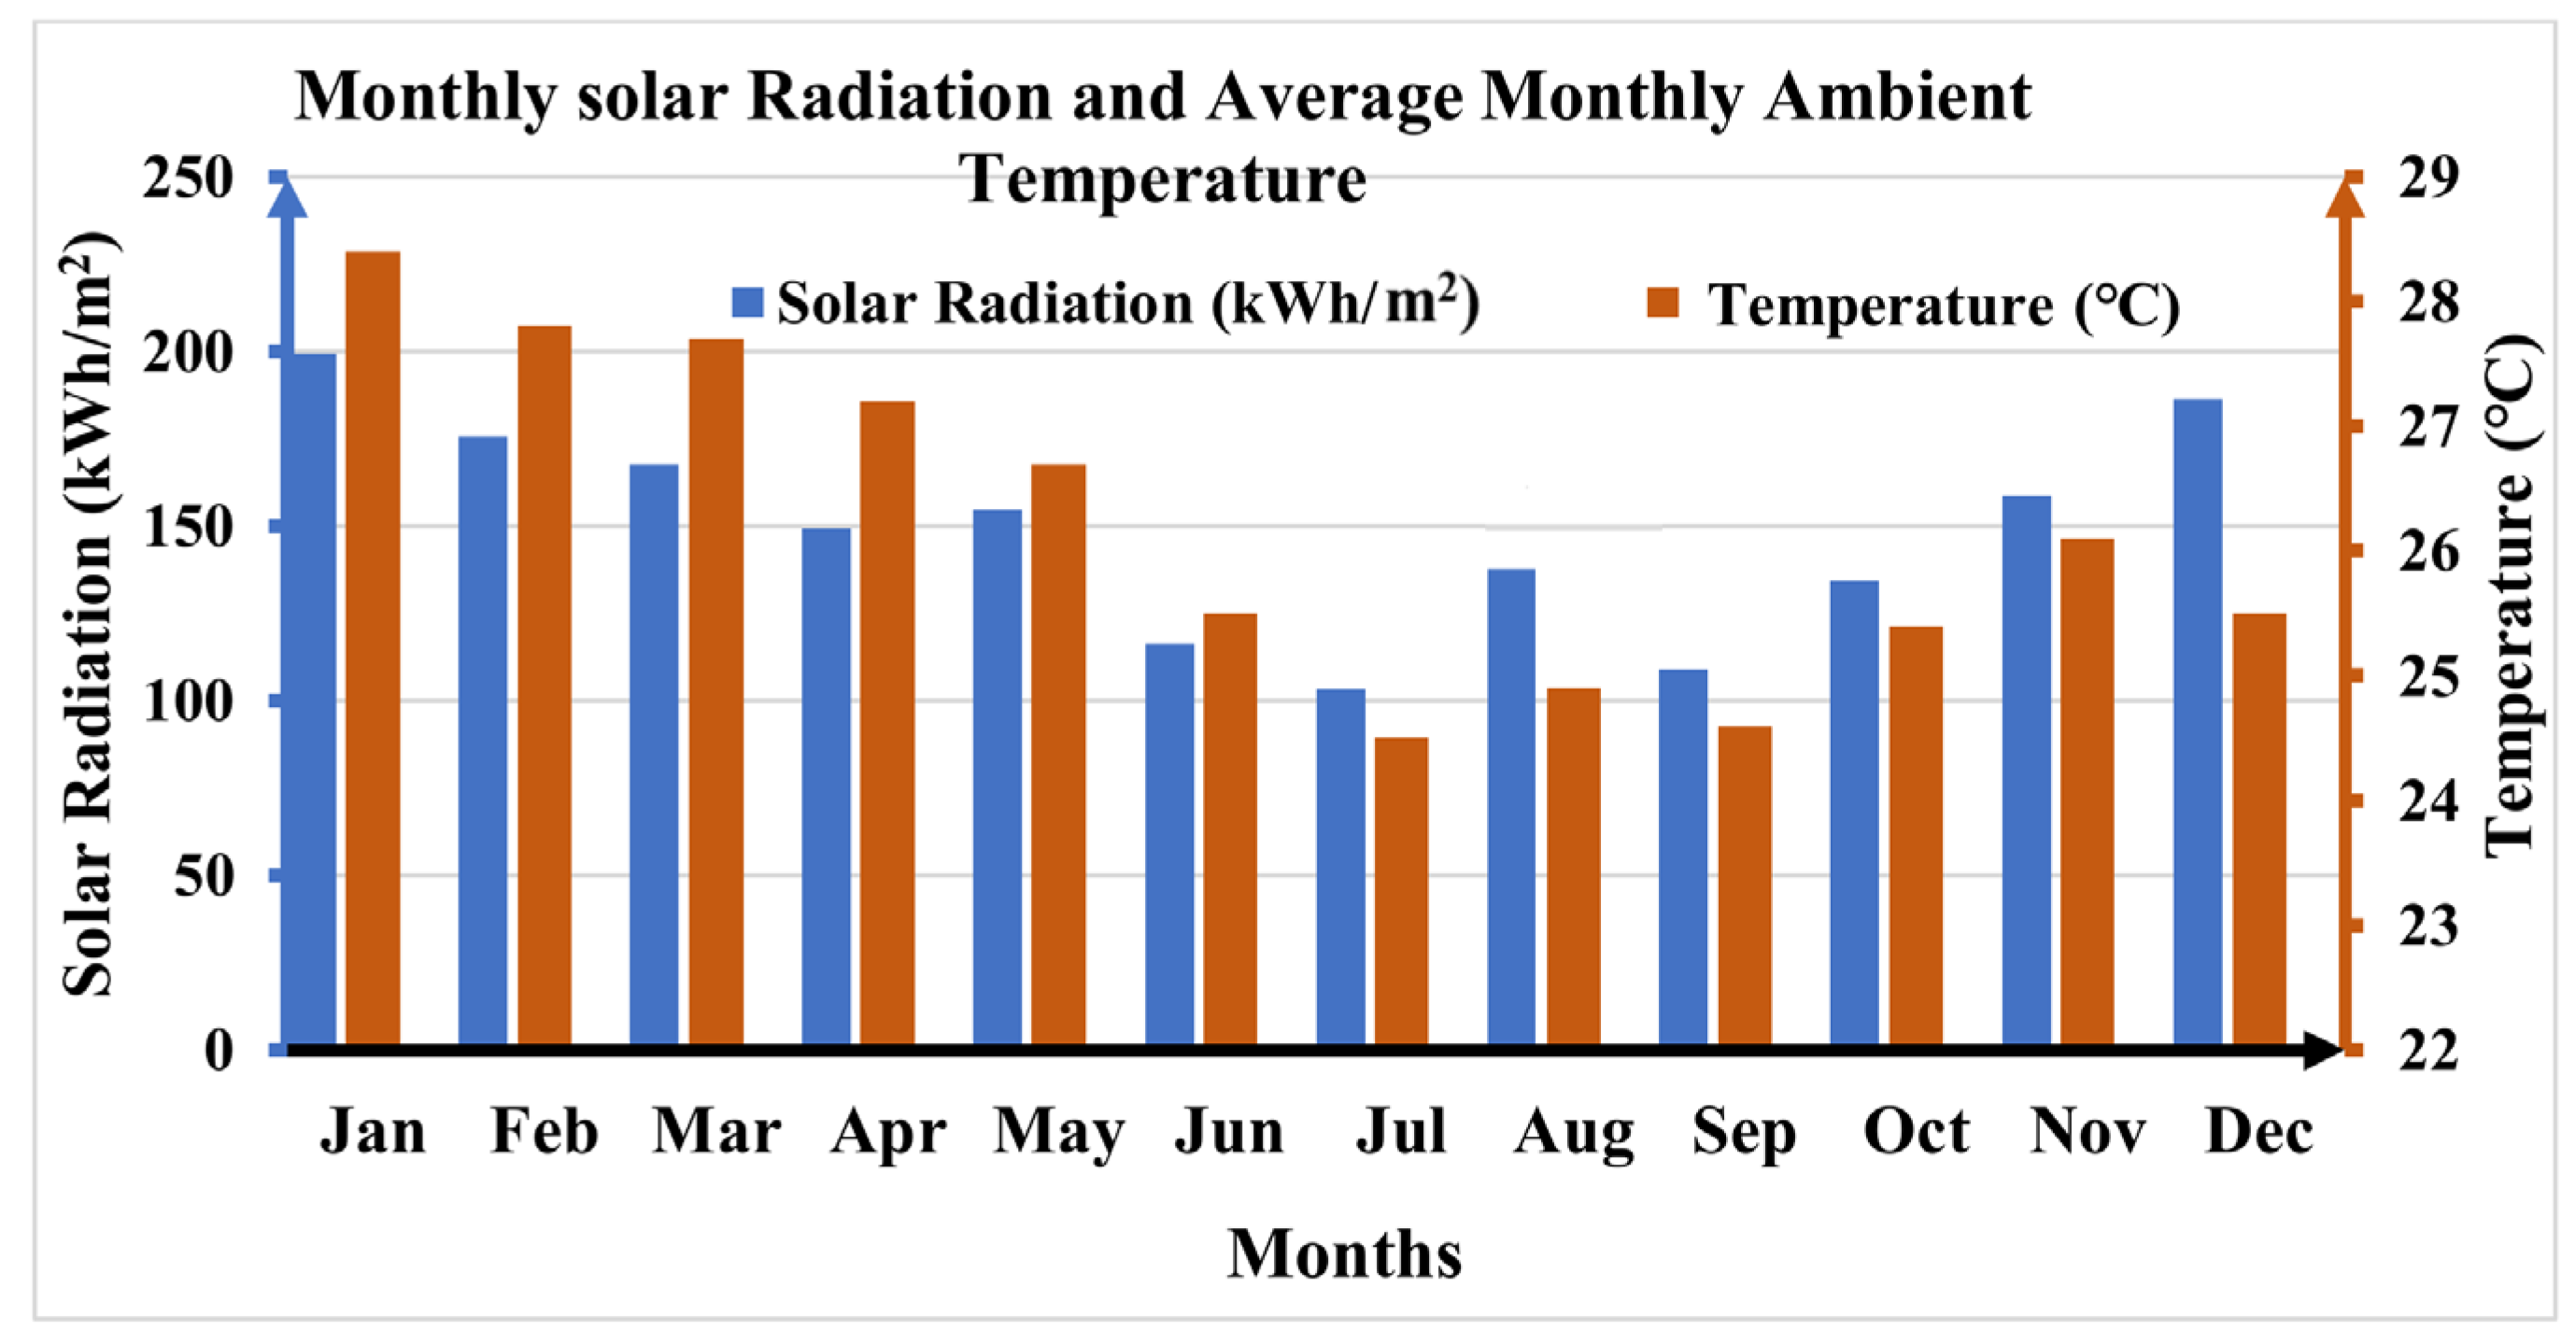
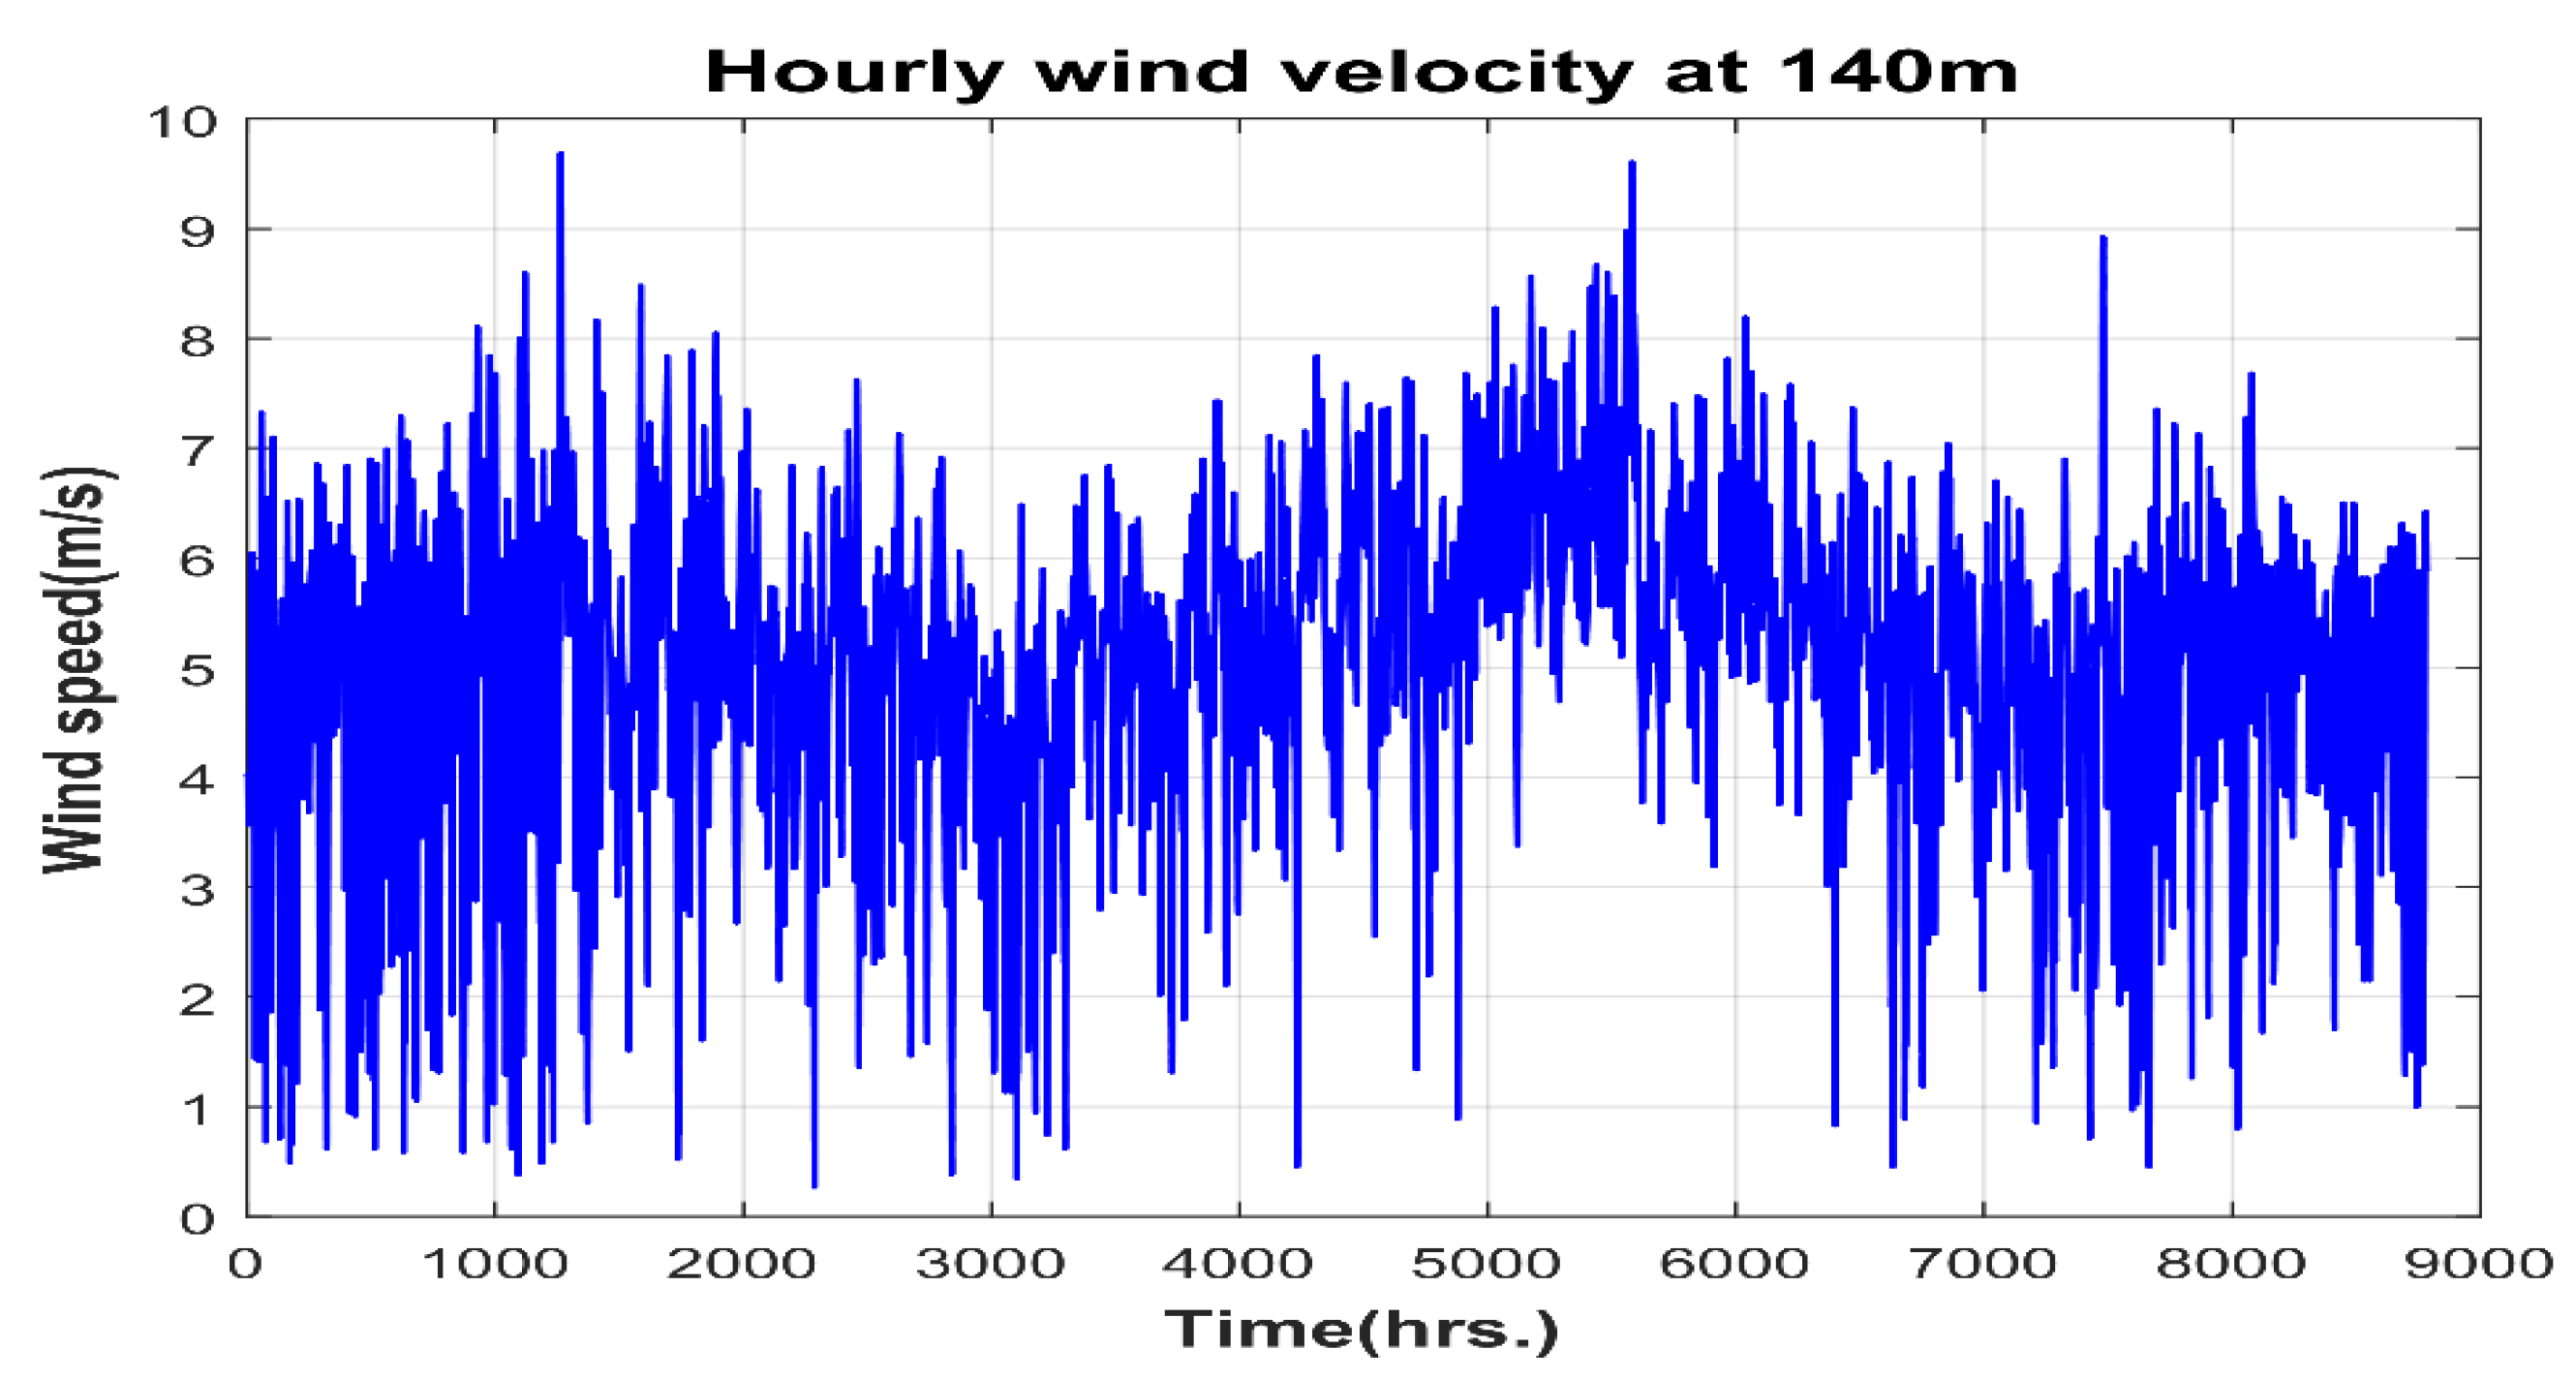
  • Utilizing actual metrological data for the temperature, wind speed, and solar irradiation in Limbe city, the hybrid system’s energy outputs were assessed.
  • In order to minimize the project total cost, a performance analysis of replacing an HFO thermal power plant with a hybrid system was carried out.
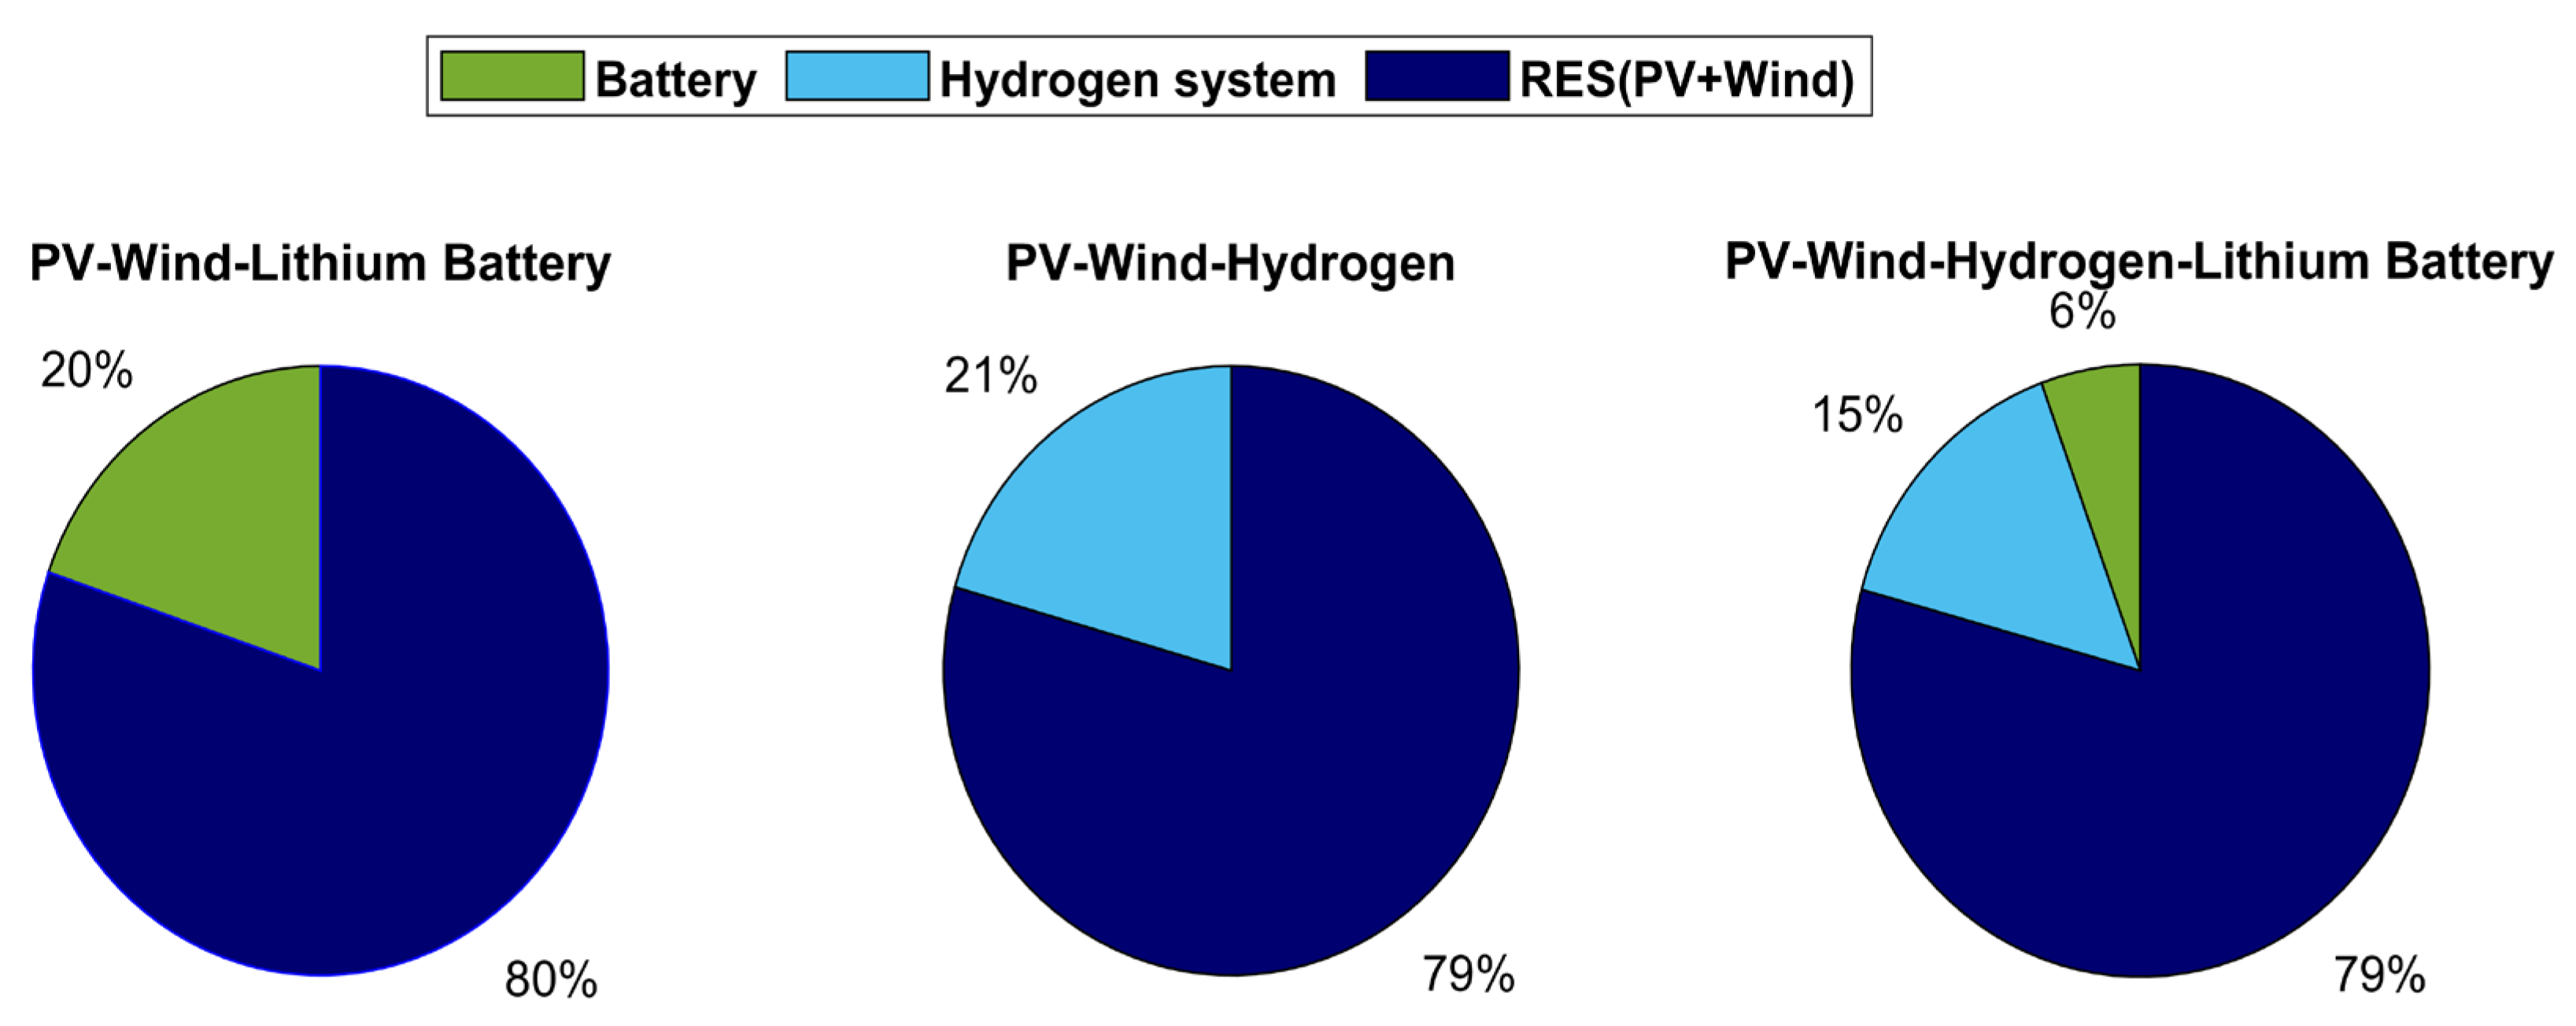
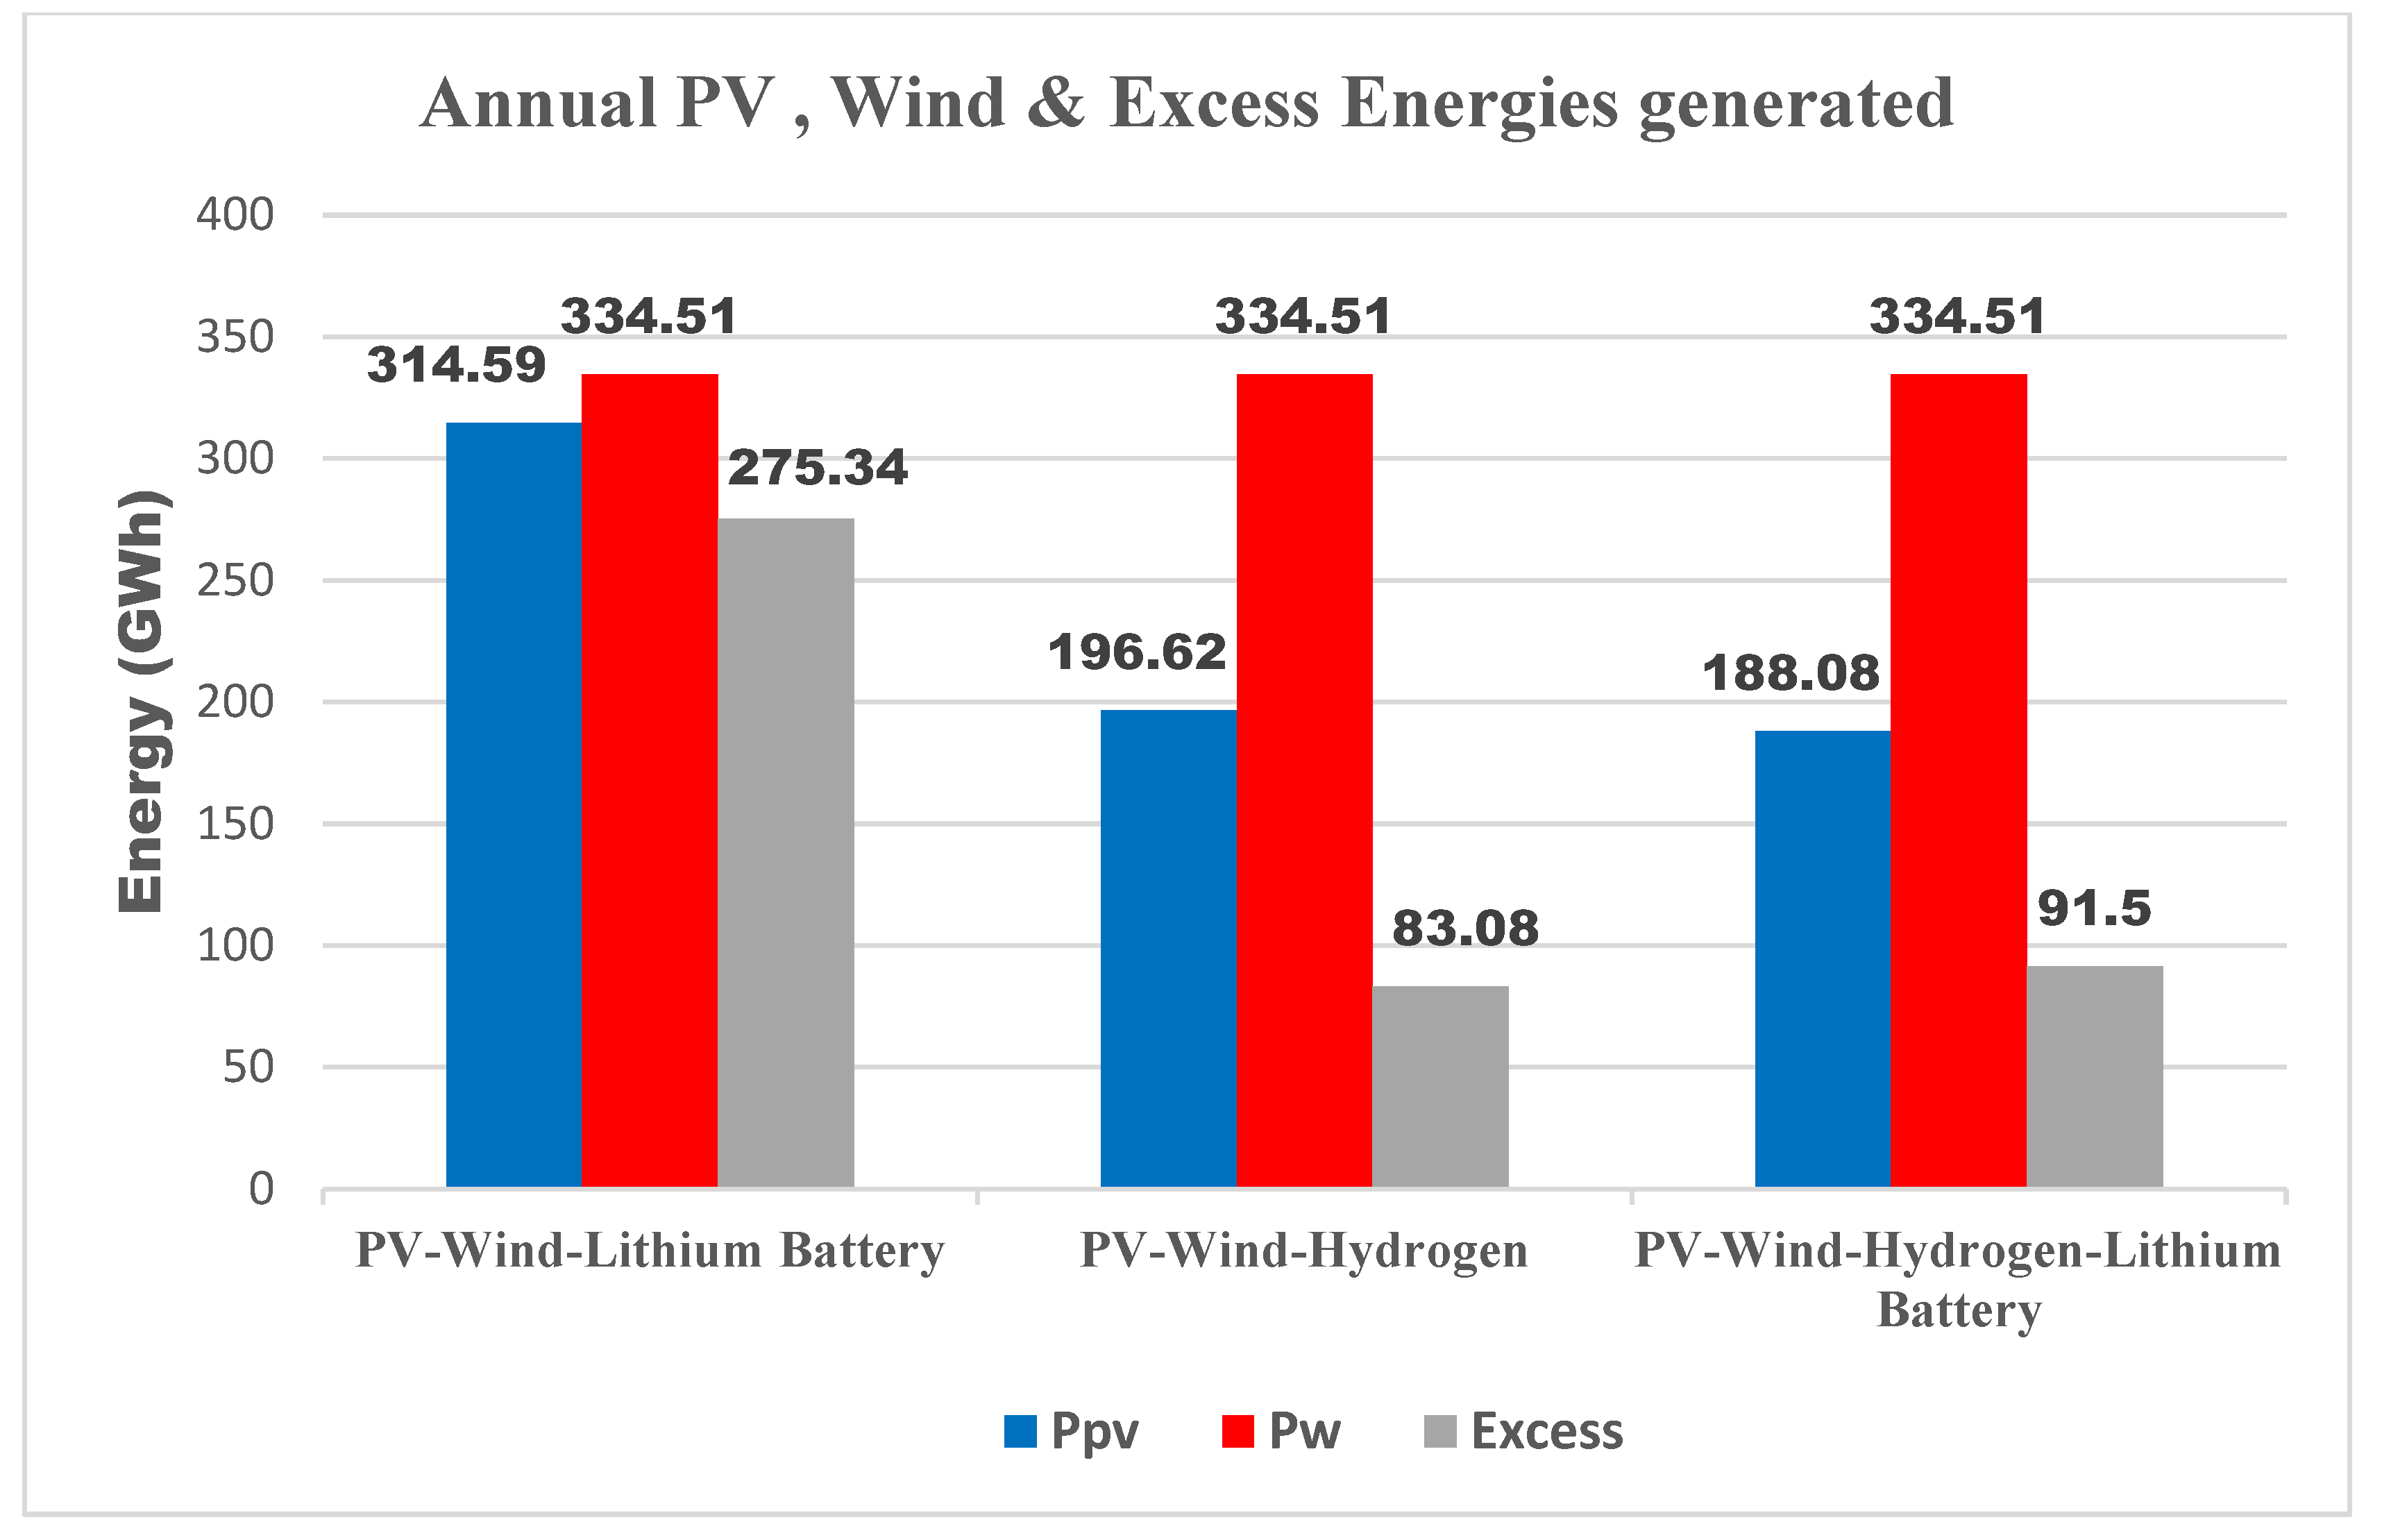
  • The best type of energy storage for the new hybrid system was determined by comparing the results of the three configurations: PV–Wind–Hydrogen, PV–Wind–Hydrogen, and PV–Wind–Lithium Battery.
The rest of the paper is organized as follows: Section 2: overview of the existing power systema; Section 3: the proposed hybrid system layout and description, as well as mathematical modeling of the hybrid systems; Section 4: evaluation parameter modelling, including technical and financial parameters; Section 5: the proposed problem formulation; Section 6: describes the meta-heuristic optimization techniques; Section 7: the energy management of the hybrid system; Section 8: the results and discussion; and Section 9 the conclusion, and then references are included.

2. Overview of the Existing Power System

The Limbe thermal power plant, which is powered by heavy fuel oil, has an output capacity of 85 MW. It is made up of five 17 MW generation units [46] and is part of the thermal power generation package managed by the parastatal company ENEO.

2.1. Connected Load Assessment

The Limbe thermal power plant is located in Cameroon’s southwest region, in the coastal town of Limbe. Figure 1 depicts the daily power generation profile of this heavy fuel oil power plant. Between 6 PM and 11 PM, the maximum peak is 72 MW, while the minimum peak is 0 MW between 0 AM and 5 AM.

2.2. Solar Resource Assessment

Cameroon has a very high solar potential, with an average solar irradiation of 5.8 kWh/day/m2 in the north and 4.9 kWh/day/m2 in the rest of the country [8]. Figure 2 depicts the monthly solar radiation and average monthly ambient temperature for Limbe at a 10° tilt angle [47].

2.3. Wind Resource Assessment

The coastal regions of Cameroon have a high potential for wind energy system installation. Limbe, a town on the Atlantic Ocean, has wind velocity characteristics that could allow for the installation of wind energy systems. The minimum wind speed measured in Limbe (latitude 4.02° N, longitude 9.21° E, and altitude 69 m) is 1.45 m/s, and the maximum speed is 4.62 m/s, according to the data presented in the work [48]. At an altitude of 36 m, the average power density is about 25.42 W/m2 and can reach 60 W/m2 [8,49]. As shown in Figure 3, the average monthly wind speed is represented at a 10 m height.

3. Proposed Hybrid System Layout and Description

The suggested hybrid system includes two renewable energy generation sources: a solar photovoltaic system and a wind power system, as well as two types of storage: lithium-ion batteries and the combination of an electrolyzer, a hydrogen tank, and a fuel cell. To accommodate for demand, the two storage systems are employed in conjunction. Figure 4 depicts the proposed system’s schematic diagram.
All the various technical and financial parameters of the PV modules, wind turbine, lithium-ion batteries, electrolyzer, fuel cells, and hydrogen tank, as well as the various economic parameters, are recoded in the Table A1 of Appendix A. The mathematical modelling of the proposed hybrid system is explained, as follows, in this section.

3.1. PV System

The power output of the solar photovoltaic field is determined by the number of solar panels ( N P V ) , the nominal power of each solar panel under standard test conditions ( P S T C ) , solar radiation ( G ( t ) ), cell temperature ( T C ( t ) ), and the various losses caused by the efficiency of the converters, cables, and so on ( F l o s s e s ) . Equation (1) gives the expression for calculating the power generated by the PV field over time [50,51].
P P V t = N P V × P S T C × G t G r e f × [ 1 + α p × ( T C t 25 )   ] × F l o s s e s
In this equation, α p is the temperature coefficient and G r e f is the irradiance corresponding to standard measurement conditions ( S T C ), which has a value of 1000 W/m2.
Equation (2) is used to calculate the temperature T C  of the cells.
T C t = T a t + N O C T 20 800 × G ( t )

3.2. Wind Turbine System

The wind field’s energy depends not only on the wind velocity at t, but also on the technical characteristics of the wind turbine model used. Equation (3) is employed to calculate the wind field’s output power [52,53].
P W T ( v ) = N W T × 0 ,   v < v c i   P r a t e d × v v c i v r v c i ,   v c i v v r   P r a t e d ,     v r v v c o   0 ,   v > v c o  
Using Equation (4) [37,54], the wind speed v at height H can be determined based on the known wind speed v 0 at height H 10 .
v H = v 0 × H H 10 α
Here, α represents the Hellmann exponent, which can be calculated with Equation (5) [55,56].
α = 0.37 0.088 · l n ( v 0 ) 1 0.088 · l n ( H 10 / 10 )

3.3. Storage System

The storage system comprises lithium batteries, as well as complete electrolyzer, fuel cell, and hydrogen tank systems. In cases of solicitation, the two storage systems are utilized in a complementary manner to satisfy demand.

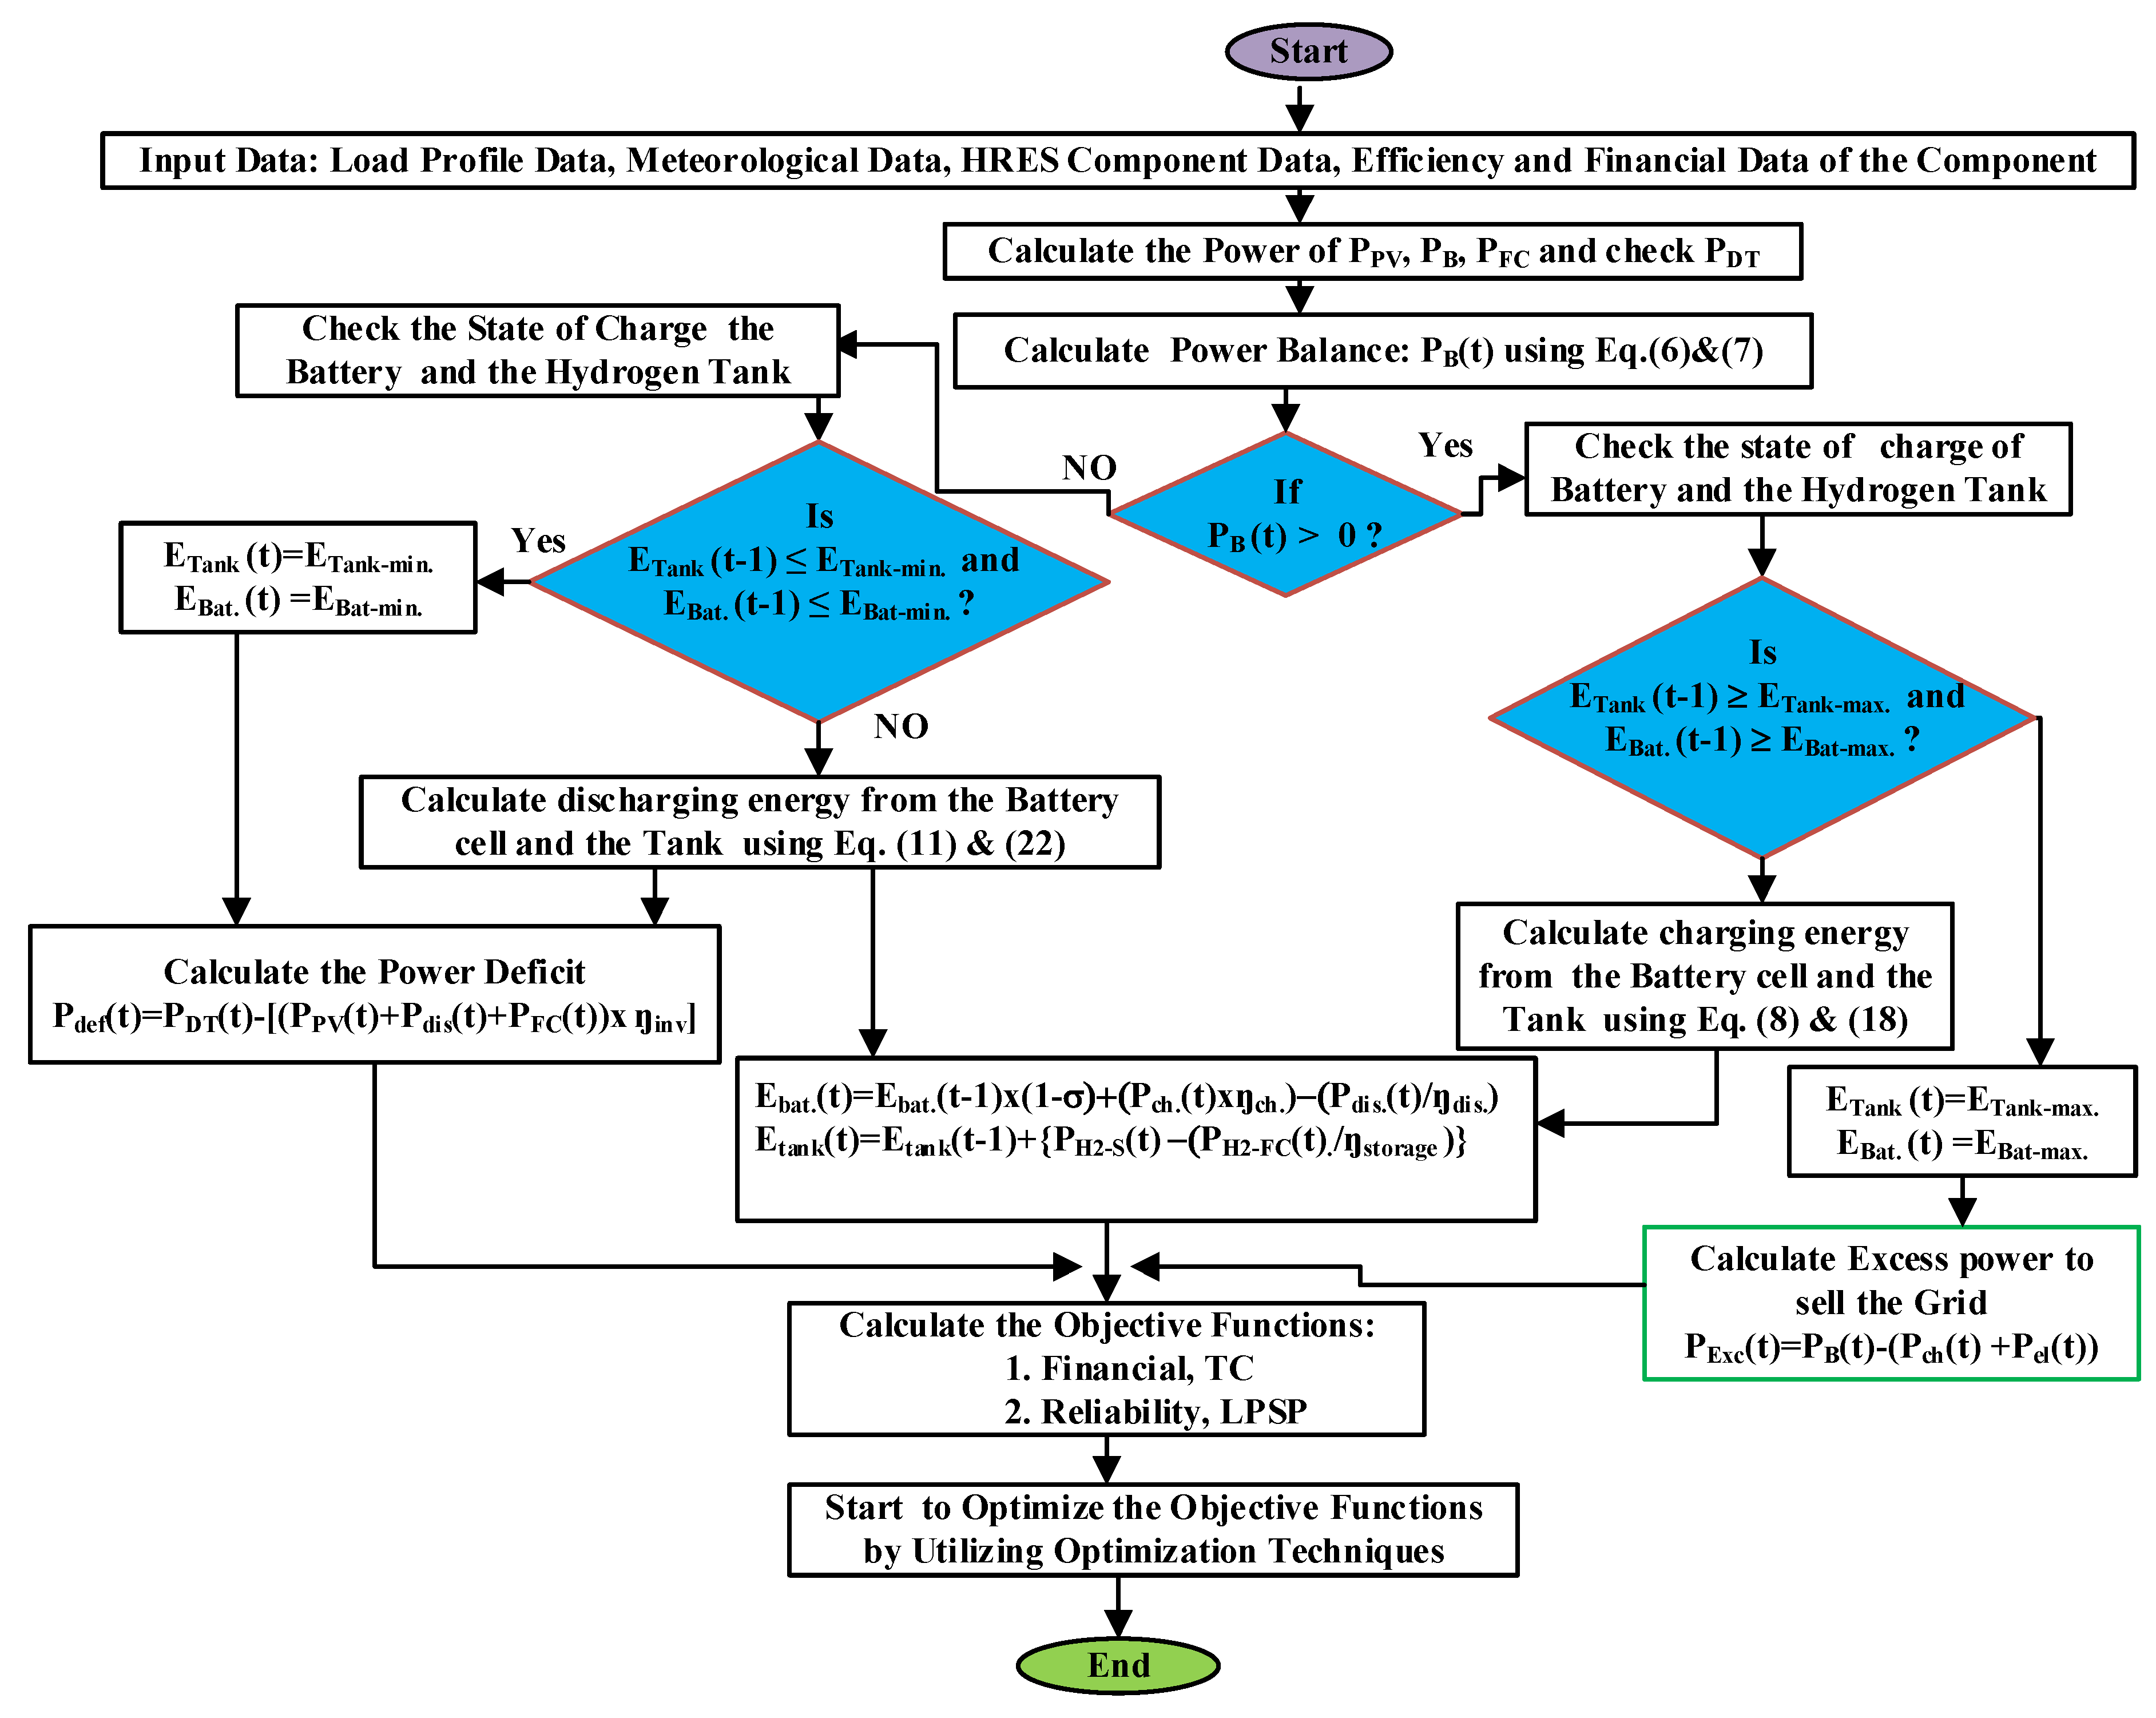
3.3.1. Energy Balance

P B is the difference between the PV and wind fields’ output power and the demand P D T . This quantity makes it possible to determine whether there is an excess or deficit of energy relative to the demand. This quantity’s expression in terms of DC current depends on the wind field’s production.
If P W T ( t ) P D T ( t ) , the excess energy from the wind field can be used to both charge the batteries and the hydrogen tank. Equation (6) determines the expression for P B . The assumption is that the inverter is bidirectional and that its efficiency in both directions is identical.
P B t = P P V t + η i n v × P W T t P D T t
If P W T ( t ) P D T ( t ) , then the wind field alone cannot meet the load demand.
In this instance, P B can be determined using Equation (7).
P B t = P P V t + 1 η i n v × P W T t P D T t

3.3.2. Lithium-Ion Battery

When P B t > 0 , the excess energy is used to charge the batteries. The amount of energy required to charge the batteries depends on the amount of energy present in the batteries prior to charging, the maximal capacity of the batteries, the charging efficiency of the batteries, and the excess energy available. Equation (8) represents its expression.
P c h t = m i n P B t ,   1 η c h b × E b a t m a x E b a t t 1  
Equation (9) is used to calculate the energy present in the batteries based on the model used in [57].
E b a t t = E b a t t 1 × 1 σ + η c h b × P c h t
If the demand exceeds the total amount of energy produced by the wind and PV fields ( P B t < 0 ) , the batteries enter discharge mode to provide the missing energy. The amount of energy supplied by the batteries is dependent on the amount of energy present in the batteries at a previous time and the energy demand of the loads. Equation (10) provides an expression for the energy supplied by the batteries.
P d i s t = m i n P B ( t ) , η d i s b × E b a t t 1 E b a t m i n
Equation (11) is based on the one used in [57] and translates the expression of the movement of the energy in the batteries operating in discharge mode.
E b a t t = E b a t t 1 × 1 σ 1 η d i s b × P d i s t
The energy stored in the batteries over time is subject to the following constraints:
E b a t m i n E b a t ( t ) E b a t m a x
The set depth of the discharge ( D O D ) determines the minimum energy level in the batteries.
E b a t m i n = ( 1 D O D ) × E b a t m a x
Taking into account the aging factor in the nominal capacity of lithium batteries, the nominal capacity of the storage system is calculated using the ratio described in Equation (14). When the batteries reach the end of their useful life and their capacity drops by 20% [58], the degradation factor due to aging is assumed to be 0.8.
E b a t m a x = 0.8 × E b a t n
Here, E b a t n represents the nominal capacity of the batteries.

3.3.3. Electrolyzer

Water electrolysis produces hydrogen through the decomposition of water caused by the passage of a direct current through it. There are several technologies that are used in the field of water electrolysis. Alkaline technology is one of the most mature and widely used technologies. The efficiency of this process may reach around 80%, and the hydrogen produced is nearly 99.989% pure [59]. The process of decomposing water using alkaline electrolyzers is depicted in Equation (15) [60].
C a t h o d e : 2 H 2 O + 2 e H 2 + 2 O H A n o d e : 2 O H 1 2 O 2 + H 2 O + 2 e   T o t a l : 2 H 2 O 2 H 2 + O 2    
When there is an excess of energy, hydrogen is produced. Equation (16) makes it possible to calculate the amount of hydrogen as a function of the renewable energy available [33,34]:
P H 2 t = P R e n A i ( t ) × η e l
The amount of renewable energy available ( P R e n A i t ) is determined by the amount of excess energy and the amount of energy used to charge the batteries.
P R e n A i t = P B t P c h ( t )
Taking into account the rated power of the electrolyzer P E l n and the charge level of the hydrogen tank, the following equation determines the actual amount of hydrogen produced ( P H 2 P ( t ) ) :
P H 2 P ( t ) = min E t a n k m a x E t a n k t 1 , min P R e n A i t , P E l n × η e l
The aging factor has an effect on the performance of the electrolysis process because of the voltage drop across the electrolyzer [58]. A compensation coefficient of 0.8 is used in this study to account for the performance degradation caused by component aging.

3.3.4. Hydrogen Storage Tank

The hydrogen stored as energy in the hydrogen tank is calculated using Equation (19) [33,34].
E t a n k t = E t a n k t 1 + P H 2 P t P H 2 F C ( t ) η s t o r a g e
The amount of hydrogen stored in the hydrogen tank is subject to the following constraints:
E t a n k m i n E t a n k t E t a n k m a x
The amount of hydrogen stored in kilograms can be obtained from Equation (21) [33,34].
M t a n k t = E t a n k ( t ) H H V h

3.3.5. Fuel Cell

As electrochemical generators, fuel cells generate electricity by oxidizing a reducing fuel at one electrode and reducing an oxidant at another. Due to their relatively low operating temperature (<100 °C), quick start-up time, remarkable efficiency, and long lifetime, PEMFCs are one of the most widely used fuel cell technologies [61]. This type of fuel cell only generates electricity, water, and heat [62]. The amount of energy produced by fuel cells is dependent on the amount of hydrogen consumed from the hydrogen tank and the efficiency of the fuel cell η F C [33,34].
P F C t = η F C × P H 2 F C ( t )
The aging factor affects the fuel cell performance, partly due to voltage drop [58]. In this work, a factor of 0.8 is considered as a compensation coefficient for the performance degradation due to component aging.

3.3.6. Inverters

The inverters must be able to convert the DC power produced by the photovoltaic array, batteries, and fuel cells into AC power that can be fed into the grid. Additionally, the inverters must be bidirectional so that excess energy from the wind system can be used to charge the batteries and hydrogen tank.
P i n v n P P V t + P d i s t + P F C t   P i n v n = k × max P P V t + P d i s t + P F C t  
where, k represents inverter sizing safety factor.

4. Evaluation Parameter Modelling

4.1. Reliability Model

The reliability criterion for measuring the energy deficit rate over a well-defined period of time was modeled. This criterion is the loss of power supply probability (LPSP).

Loss of Power Supply Probability

The loss of power supply probability is a criterion that estimates the rate of energy deficit relative to demand over a given time period. This reliability criterion has been used in a number of studies [63,64,65,66,67,68]. It is calculated using Equation (24).
L P S P = i : 1 8784 P D T t P W T ( t ) η i n v × ( P P V t + P F C t + P d i s ( t ) ) 1 : 1 8784 P D T

4.2. Economics Models

Several economic criteria were modeled to assess the financial cost and economic viability of the proposed new hybrid system. These are the project’s total cost (TC) and the levelized cost of energy (LCOE).

4.2.1. Total Cost of the Project

The total cost of the project includes the capital cost, maintenance and operation costs, component replacement costs, and salvage costs [55,69,70].
T C = C C a p i t a l + C r e p l a c e + C O & M C s a l v a g e
  • PV system
The total cost of the PV system only takes into account the capital cost, the maintenance and operation costs, and the salvage cost due to the lifetime of the PV panels being greater than or equal to 25 years.
T C P V = N P V × C c a p P V + N P V × C O & M P V × k O & M C s a l v a g e P V
k O & M is the value discount factor, which is determined by the real interest rate r and the duration of the project N [71,72].
k O & M = ( 1 + r ) N 1 r 1 + r N
The real interest rate is determined by the nominal interest rate i n and the rate of inflation f [71,72].
r = i n f 1 + f
The salvage cost of a PV system can be calculated using the following equation [73]:
C s a l v a g e P V = C r e p l a c e × R r e m R C o m p
Here, Rrem represents the component’s remaining lifetime at the end of the project’s lifetime, Rcomp represents the component’s lifetime, and Creplace represents the component’s replacement cost at the end of the project.
b.
Wind system
The total cost of the wind power system includes the capital cost, as well as the maintenance and operation costs, due to the wind turbines’ 20-year life span.
T C W T = N W T × C c a p W T + N W T × C O & M W T × k O & M
c.
Lithium Battery
The total cost of the batteries takes into account the capital cost, the replacement cost of the batteries, and the costs related to their maintenance and operation. It is defined as follows: the lifespan of the lithium battery considered here is 10 years. They are therefore replaced only once during the lifetime of the project.
T C B a t = E b a t n × ( C c a p B a t + k r × C r e p B a t + C O & M B a t × k O & M )  
k r represents the replacement cost discount factor. It depends on the real interest rate and the component’s life span. It is calculable using Equation (32) [74].
k r = 1 ( 1 + r ) n
d.
Electrolyzer
The total cost of the electrolyzer is a function of the capital cost and the maintenance and operation costs, since the life of the electrolyzer can reach 20 years [75]. It is determined using Equation (33).
T C E L = P E l n × ( C c a p E l + C O & M E l × k O & M )
e.
Hydrogen tank
The total cost of the hydrogen tank includes only the capital cost, the costs of maintenance and operation, and the salvage cost. The lifetime of the hydrogen storage tanks considered in this study is 25 years.
T C T a n k = E t a n k m a x × ( C c a p T a n k + C O & M T a n k × k O & M C s a l v a g e T a n k )
The salvage cost of the hydrogen reservoir can be calculated on the basis of Equation (29).
f.
Fuel cells
The total cost of the fuel cell includes the capital cost, fuel cell replacement costs, and maintenance and operation costs. The lifespan of the fuel cells considered here is 10 years. They are therefore replaced only once during the lifetime of the project. It is defined as follows:
T C F C = P F C n × ( C c a p F C + C r e p F C × k r + C O & M F C × k O & M )
g.
Inverters
The total cost of the inverters includes the capital cost, replacement cost, maintenance and operation costs, and salvage cost. The lifespan of the inverters considered here is 15 years. They are therefore replaced only once during the lifetime of the project.
T C i n v = P i n v n × ( C c a p i n v + C r e p i n v × k r + C O & M i n v × k O & M C s a l v a g e i n v )
The salvage cost of the inverters is calculated on the basis of Equation (29).

4.2.2. Levelized Cost of Energy (LCOE)

The levelized cost of energy criterion estimates the average cost of the energy production over the project’s life. The LCOE is calculated in $/kWh using the expression described in Equation (37) [76,77].
LCOE = TLCC i = 1 n E t 1 + r n
The total life cycle cost of the project (TLCC) is the total cost of the project modeled in this study and E t represents the total energy generated.

5. Proposed Problem Formulation

This study’s optimization problem is to minimize the total cost of the project over its lifetime. It is a problem of optimization with a single objective. The corresponding mathematical expression is given by Equation (38).
min T C = m i n   ( T C P V + T C W T + T C B a t + T C E l + T C F C + T C T a n k + T C P i n v )
The following constraints apply to this single-objective optimization problem:
N P V L N P V N P V U N W T L N W T N W T U E B a t L E b a t n E B a t U P E l L P E l n P E l U P F C L P F C n P F C U E t a n k L E t a n k m a x E t a n k U L P S P L P S P m a x
L P S P m a x represents the maximum permissible rate of energy deficit. Its value is 0.01%.

6. Optimization Algorithms

Proven meta-heuristics were used to solve this single-objective optimization problem. The benefits of using meta-heuristics to solve complex optimization problems over other techniques are primarily their simplicity and adaptability. Indeed, four meta-heuristics were used to solve this optimization problem, and their results were analyzed to determine the optimal solution. The implemented algorithms were MFO, IGWO, MVO, and AVOA. The use of four optimization techniques to solve this optimization problem ensured the quality of the optimal solution by comparing the results of the algorithms with each other. The goal of this study was not to assess the performance of the meta-heuristics, but rather to obtain optimal results for sizing the hybrid renewable energy plant based on established technical and economic criteria. Future research could look into how recent meta-heuristics perform in terms of renewable energy sizing.
  • Moth Flame Optimization
In the paper [42], the MFO meta-heuristic was introduced. It is a bio-inspired algorithm inspired by moths’ moon-based nighttime navigation system. Several studies have used it to solve optimization problems [78,79]. MFO is regarded as one of the most promising meta-heuristic algorithms, and it has been successfully utilized to solve optimization problems in an extensive variety of areas, including economic dispatching, engineering design, image processing, power and energy systems, and medical applications [80,81]. This algorithm’s success is based on its advantages over its competitors. The MFO algorithm enables very rapid convergence by shifting from exploration to exploitation at an early stage, increasing its effectiveness for applications, such as classification, where a quick solution is required [82]. It is an algorithm that can maintain its strength across a wide range of application domains. The MFO algorithm consists of three major steps [42,80]:
  • Creating the initial moth population
Each moth has the ability to fly in a one-dimensional, two-dimensional, three-dimensional, or hyper-dimensional space. The set M of moths can be determined as follows:
M = m 1,1 m 1,2 m 1 , d m 2,1 m 2,2 m 2 , d m n , 1 m n , 2 m n , d
Here, n represents the number of moths and d represents the size of the solution space.
All moth fitness values are recorded in a table like the one below:
O M = O M 1 O M 2 O M n
It is notable that the solutions here are flames and moths. The distinction between them is in the manner in which they are processed and updated with each iteration. Moths are true search agents that move around the search space, and flames represent the best moth position achieved thus far. In other words, the flames can be interpreted as flags or pins left by the moths while searching in the search space. As a result, each moth searches for a better solution around a flag (flame) and updates it. This mechanism guarantees that the moth will always find the best solution.
2.
Updating moth positions
For the convergence of solutions towards the global optimum of the optimization problem, three different functions are used. The following functions are defined:
M F O = ( I , P , T )
In this case, I represents the first random location of the moths ( I : ϕ M , O M ), P represents the moths’ movement in the search space ( P : M M ), and T represents the end of the search process ( T : M t r u e , f a l s e ). Equation (43), which represents the I function, is used to implement the random distribution.
M i , j = u b i l b j × r a n d ( ) + l b ( i )
where u b and l b denote the upper and lower bounds of the optimization variables. Moths use transverse orientation to fly through the search space. When using a submissive logarithmic spiral, three conditions must be met:
-
The moth must be the starting point of the spiral.
-
The position of the flame must be the spiral’s end point.
-
The range of the spiral’s fluctuation must not exceed the search space.
As a result, the logarithmic spiral is defined as follows:
S M i , F j = D i × e b t × cos 2 π t + F j
D i denotes the distance between the i-th moth and the j-th flame, b denotes a fixed value used to define the shape of the logarithmic spiral, and t denotes a random number between [−1, 1].
The spiral movement of the moth near the flame in the search space ensures a balance between exploitation and exploration. Furthermore, optimal solutions are preserved at each iteration to avoid falling into the traps of local optima, and the moths fly around the flames using OF and OM matrices.
3.
Updating the number of flames:
Updating the moth positions at n different locations in the search space can reduce the probability of capturing the most promising solutions. By reducing the number of flames, the following equation solves the problem:
f l a m e   n o = N l × N l T
where N denotes the maximum number of flames, l denotes the current number of iterations, and T denotes the total number of iterations.
  • The other meta-heuristics
The I-GWO algorithm is an enhancement of the Grey Wolf Optimizer algorithm [43]. The proposed enhancement addresses the GWO algorithm’s premature convergence, the imbalance between the exploitation and exploration, and the lack of population diversity. The I-GWO algorithm benefits from a new movement strategy known as the DLH (dimension-learning-based hunting) search strategy, which was derived from the individual hunting behavior of wolves in the wild. The authors who proposed this algorithm tested it on complex engineering problems. The I-GWO algorithm outperformed algorithms such as Henry Gas Solubility Optimization (HGSO), Krill Herd (KH), Exploration-Enhanced GWO (EEGWO), GWO, PSO, and WOA [43]. Even though this version of GWO is relatively new, it has already been used to solve difficult engineering problems [83].
The MVO algorithm was influenced by three cosmological phenomena: the white hole, the black hole, and the wormhole. It is also a nature-inspired algorithm, as proposed by [44].
The AVOA algorithm is relatively new and was inspired by the lifestyle of African vultures, specifically their navigation and food-seeking techniques [45]. It has been utilized to solve numerous optimization issues [84,85,86].

7. Energy Management of the Hybrid System

The energy flow management in the hybrid system, as shown in Figure 5, proceeds as follows:
Using Equations (6) and (7), the difference between the PV array output and demand can be computed.
If P B t = 0 , the PV system output only meets the demand.
If P B t > 0 , the output of the PV and Wind system exceeds the demand. Using Equations (8) and (9), the excess energy (PB) is used to charge the lithium-ion batteries. Using Equation (17), the remaining energy is used to power the electrolyzer, which produces hydrogen.
If P B t < 0 , the demand exceeds the capacity of the photovoltaic and wind power systems. The missing energy is supplied by the storage system. In the case of a lithium-battery–hydrogen storage system, the batteries discharge first to provide the missing energy (Equation (10)) before the fuel cells take over (Equation (22)). Batteries are used as a quick-response storage system, as well as a storage system that can supplement hydrogen when it is unable to meet demand. When the amount of hydrogen in both storage systems reaches the minimum allowed, the hybrid system can no longer meet this demand. The LPSP system is then assessed. In this study, the hydrogen storage system is not used to charge the batteries.

8. Results and Discussions

The meteorological data used in this study are from [87] and are shown in Figure 6 and Figure 7.
Table 1 and Figure 8 show the results obtained for the four algorithms.
According to Table 1 and Figure 8, the different results obtained for the different algorithms are quite close and respect the constraint of the fixed LPSP. Nevertheless, the MFO algorithm achieved the best result in terms of the total project life cycle cost. Indeed, the TC of the project obtained thanks to the MFO algorithm was 692,291,975.22 USD with an LPSP of 0.0999%, while it was 694,525,861.46 USD with an LPSP of 0.0994% for the I-GWO algorithm, 695,049,204.50 USD with an LPSP of 0.0999% for the MVO algorithm, and 696,664,074.77 USD with an LPSP of 0.0999% for the AVOA algorithm. In terms of proportion, the TC obtained with the MFO meta-heuristic was, respectively, lower by 0.32%, 0.40%, and 0.63% than the results obtained with the I-GWO, MVO, and AVOA algorithms. The differences in terms of the proportion between the results obtained with the four optimization techniques were quite small. This speaks to the performance of each algorithm and the reliability of the results. It is also notable to state that, after MFO, I-GWO delivered the second-best result in terms of the TC, followed by MVO. In terms of the convergence of the four algorithms’ results, the MFO convergence curve reached its optimum after 105 iterations. For the I-GWO, MVO, and AVOA algorithms, the optimum was reached after 194, 196, and 158 iterations, respectively. In terms of the total project cost and rapid convergence to the optimal solution for this specific optimization problem, the MFO meta-heuristic outperformed the I-GWO, MVO, and AVOA algorithms. It is also useful to highlight the minimal differences between the four optimization techniques’ optimal solutions. These findings corroborate one another. Thus, the goal of employing four algorithms was met.
As a result, this algorithm (MFO) will be used in the following to evaluate the impact of the storage type on the total project cost.

The Effect of Storage Type on Project Total Life Cycle Cost

The effect of the storage type combined with the PV and wind systems on the total life cycle cost of the project was assessed here. Indeed, the impact of the storage type on the total project life cycle cost was assessed by comparing the results obtained with hybrid storage (hydrogen and battery) to the results obtained with battery-only storage and hydrogen-only storage systems. The MFO algorithm was used to achieve the best results. These findings are shown in Table 2 and Figure 9.
According to Figure 9 and the results in Table 2, hybrid storage (lithium-ion batteries and hydrogen) had the lowest TC when compared to the other energy storage types considered. Indeed, the total life cycle cost for the PV–Wind–Hydrogen–Lithium Battery configuration was 692,291,975.22 USD, while the TC for the PV–Wind–Hydrogen configuration was 708,918,245.46 USD and the TC for the PV–Wind–Lithium Battery configuration was 816,123,339.58 USD. The total life cycle cost obtained for the PV–Wind–Hydrogen-Lithium Battery case was 2.40% and 18% lower than the TCs obtained for the PV–Wind–Hydrogen case and PV–Wind–Lithium Battery case, respectively. It is worth noting that previous research has shown that hydrogen is more economically appealing than lithium-ion batteries for large-scale applications. A more detailed examination of the results in Table 2 reveals that combining both types of storage reduced the total installed PV system capacity. As a result, the PV system capacity increased from 129.14 MW to 135 MW for the PV–Wind–Hydrogen case and 216 MW for the PV–Wind–Lithium Battery case. This remarkable difference in the PV system capacities for the various storage cases studied explains some of the results obtained. It should also be noted that, as the size of the PV system grew, so did the size of the inverters. Figure 10 depicts the proportion of each component in the TC to help understand the impact of the storage type on the total cost of the entire system.
Figure 10 shows that the PV system’s share of total project costs varied greatly depending on the scenario considered. It accounted for approximately 18% of the total costs in the PV–Wind–Hydrogen and PV–Wind–Hydrogen–Lithium Battery scenarios and 25% in the PV–Wind–Lithium Battery scenario. The storage systems also accounted for a sizable portion of the expenditures. Indeed, in the PV–Wind–Hydrogen and PV–Wind–Hydrogen–Lithium Battery scenarios, the storage system accounted for approximately 37% of the total project cost, while in the PV–Wind–Lithium Battery scenario, the storage system accounted for approximately 32% of the expenditure. This high proportion of storage system costs should be considered in light of their contribution to the energy supplied to the loads. According to the study scenarios, Figure 11 depicts the proportion (%) of energy supplied by the storage systems in relation to the total energy supplied to the loads.
According to Figure 11, regardless of the scenario considered, the storage systems supplied approximately 20% of the energy received by the loads, while accounting for more than a third of the costs associated with installing and operating renewable energy plants. This could account for the relatively high levelized cost of energy (LCOE) obtained for the various scenarios and shown in Figure 12.
According to Figure 12, the LCOE obtained for the load profile under consideration was 0.1459 USD/kWh for the PV–Wind–Hydrogen–Lithium Battery scenario, 0.1494 USD/kWh for the PV–Wind–Hydrogen scenario, and 0.1720 USD/kWh for the PV–Wind–Lithium Battery scenario. The PV–wind–hydrogen–lithium battery scenario thus offered the lowest energy production cost. The PV–wind–lithium battery scenario had the highest energy generation cost. On the other hand, when the surplus energy was considered to be potentially absorbable by the electrical grid, the PV–Wind–Lithium Battery scenario presented the highest energy cost (0.0958 USD/kWh). This was due to the higher capacity of the PV system in the PV–Wind–Lithium Battery scenario, but also to the charge/discharge efficiency of the batteries compared to the whole electrolyzer/fuel cell and hydrogen tank system. As shown in Figure 13, the energy surplus in the PV–Wind–Lithium Battery scenario was huge compared to the other two scenarios and reached 275.34 GWh/year against 91.5 GWh/year for the PV-Wind-Hydrogen-Lithium Battery scenario.
The wind power systems produced identical annual energies, which can be explained by them having the same installed capacity regardless of the scenario studied (Table 2). The difference in the PV system installed capacities for the study scenarios resulted in an annual energy surplus in the PV–Wind–Battery scenario, as previously stated.
The annual energy consumed and supplied by the storage systems is presented in Figure 14.
According to Figure 14, the amount of energy required to charge the storage systems varied greatly depending on the scenario under consideration. In the PV–Wind–Lithium battery scenario, the ratio of energy used to charge the batteries to the energy supplied by the batteries to the load was high, whereas in the PV–Wind–Hydrogen scenario, the ratio was low. This was due to the different storage systems’ round-trip efficiencies. The round-trip efficiency for the batteries in this study was approximately 81%, while the overall efficiency for the hydrogen system was approximately 46%. The energy consumed annually to charge the storage system in the PV–Wind–Hydrogen–Lithium Battery scenario was 147.62 GWh, which included 123.56 GWh for the hydrogen system and 24.06 GWh for the lithium batteries. The storage system provided 74.167 GWh of energy to the loads each year, with the fuel cells providing 54.277 GWh and the batteries providing 19.89 GWh. The combined round-trip efficiency of the two types of storage was 50.24%. This was more efficient than the entire hydrogen system.
Figure 15 and Figure 16 depict the energy production of the PV and wind power systems over a 24 h period, as well as the behavior of the storage systems under two different reliability scenarios.
Figure 15 clearly depicts the aforementioned findings. As the graph shows, the excess energy in the PV–Wind–Lithium Battery scenario was significantly greater than that in the other scenarios. Furthermore, the storage systems played a much smaller role in meeting demand than the PV and wind systems. The storage systems only came into play when the PV and wind systems were unable to meet demand at the time. Figure 16 depicts the evolution of the curves during an energy deficit.
Figure 16 demonstrates that, regardless of the scenario considered, energy deficits occurred when the wind and irradiation meteorological data were at levels that prevented the PV and wind systems from meeting both demand and charge storage systems. This graph also demonstrates the difficulty of integrating renewable energy systems on a large scale into the power grid. This necessitates managing the flow of energy on the grid, as well as having constant weather forecasts. Depending on the scenario, the annual energy deficit time varied. The PV–Wind–Hydrogen–Lithium Battery scenario had a duration of 29 h, with an annual energy deficit of 345.5 MWh. The energy deficit time for the PV–Wind–Hydrogen scenario was 30 h, and the annual energy deficit was 345.5 MWh. The annual energy deficit time for the PV–Wind–Lithium Battery scenario was 10 h, and the annual energy deficit was 345.5 MWh.
To summarize, each type of energy storage had advantages and disadvantages.
Lithium batteries had a round-trip efficiency of up to 90%, but they are not competitive with hydrogen for mega-scale applications. When this storage system was used, the excess energy produced was critical. The capacity of the electrical network to absorb this excess energy will determine the project’s profitability.
In comparison to lithium batteries, the hydrogen storage system, which included electrolyzers, fuel cells, and hydrogen tank, had a low round-trip efficiency. That is, the excess energy was reduced. However, for large applications, this storage system is more cost effective than lithium batteries. Furthermore, the small amount of excess energy makes it more appealing for less modern electrical networks, which are common in many sub-Saharan African countries.
The combination of the two storage systems enabled us to reap the benefits of each type of storage while improving the overall storage system’s round-trip efficiency. The project is far more competitive and the excess energy is far lower than when batteries are used as storage systems.

9. Conclusions

The purpose of this research was to determine the best size for a renewable energy production unit to replace an existing HFO thermal power plant in southwest Cameroon. Optimization techniques such as MFO, I-GWO, MVO, and AVOA were used to achieve this goal by reducing the total cost of the project over its lifetime. The proposed hybrid power plant’s reliability was measured using LPSP, and a limit value was set. The results, while satisfactory for all four algorithms, demonstrated the superiority of the MFO algorithm for this specific optimization problem. Indeed, the total cost obtained with the MFO meta-heuristic was 0.32%, 0.40%, and 0.63% lower than the results obtained with the I-GWO, MVO, and AVOA algorithms, respectively. The PV–Wind–Hydrogen–Lithium Battery configuration performed significantly better than the PV–Wind–Hydrogen scenarios when the financial impact of the storage type on the total project cost was examined. Thus, the total project cost obtained for the PV–Wind–Hydrogen–Lithium Battery configuration was 2.40% and 18% less than the total cost obtained for the PV–Wind–Hydrogen configuration and PV–Wind–Lithium Battery configuration, respectively. These findings support the decision to combine these two types of storage.

Author Contributions

Conceptualization, I.A., E.T., L.F., T.F.A. and B.K.; methodology, I.A., E.T., L.F., T.F.A., I.B. and B.K.; software, I.A., E.T., L.F. and B.K.; validation, I.A., E.T., L.F., T.F.A. and B.K.; formal analysis, I.A., E.T., L.F., A.A. and B.K.; investigation, I.A., E.T., L.F., T.F.A. and B.K.; resources, I.A., E.T., L.F., T.F.A., I.B., N.K., A.A. and B.K.; data curation, I.A., E.T., L.F., T.F.A. and B.K.; writing—original draft preparation, I.A., E.T., L.F., T.F.A., I.B., N.K., A.A. and B.K.; writing—review and editing, I.A., E.T., L.F., A.A. and B.K.; visualization, I.A., E.T., L.F., T.F.A. and B.K.; supervision, I.A., E.T., L.F., T.F.A. and B.K.; project administration, I.A., E.T., A.A. and B.K.; funding acquisition, I.A., E.T., L.F., T.F.A. and B.K. All authors have read and agreed to the published version of the manuscript.

Funding

This research was funded by the MIRET fellowship program through project No: 614658-PANAF-1-2019-1-KE-PANAF-MOBAF.

Institutional Review Board Statement

Not available.

Informed Consent Statement

Not available.

Data Availability Statement

Data will be available on request.

Conflicts of Interest

The authors declare no conflict of interest.

Nomenclature

C C a p i t a l Capital cost N P V U Upper limit of solar panels number
C c a p P V Capital cost of solar PV system N W T Number of wind turbine
C c a p i n v Inverters capital cost N W T L Lower limit number of WT
C c a p B a t Lithium battery capital cost N W T U Upper limit number of WT
C c a p W T Wind turbine capital costNOCTNominal operating cell temperature
C c a p F C Fuel cells capital cost P B Power balance
C c a p E l Electrolyzer capital cost P c h Energy consumed to charge the batteries
C c a p T a n k Hydrogen tank capital cost P d i s Energy supplied from the batteries to the load
C O & M Operation and maintenance cost P E l n Electrolyzer rating power rating
C O & M I n v O&M cost inverter system P E l L Lower limit of electrolyzer power rating
C O & M B a t Lithium battery O&M cost P E l U Upper limit of electrolyzer power rating
C O & M E l Electrolyzer O&M cost P F C Fuel cells power output power
C O & M F C Fuel cells O&M cost P F C n Fuel cells rating power
C O & M T a n k Hydrogen tank O&M cost P F C L Lower limit of fuel cells power rating
C O & M P V O&M cost of solar PV system P F C U Upper limit of fuel cells power rating
C O & M W T O&M cost of wind turbine P H 2 Amount of hydrogen generated
C r e p l a c e Replacement cost P H 2 P Amount of hydrogen generated and stored
C r e p B a t Replacement cost of battery P H 2 F C Energy consumed by fuel cell to generate power
C r e p F C Fuel cells replacement cost P i n v n Inverters rating power
C r e p I n v Inverter replacement cost P P V PV system power output
C s a l v a g e Salvage cost P r a t e d Rated power of wind turbineT
C s a l v a g e i n v Inverter salvage cost P S T C Nominal power of solar panel under standard test conditions
C s a l v a g e P V Solar PV salvage cost P W T Wind turbine power output
C s a l v a g e T a n k Hydrogen tank salvage cost r Real interest rate
D O D Depth of dischargeRremComponent’s remaining lifetime at the end of the project’s lifetime
E b a t Energy available at t in the batteriesRcompComponent’s lifetime
E b a t ( t 1 ) Energy available in the batteries at t-1 T C Total cost
E b a t n Nominal capacity of the batteries T L C C Total life cycle cost
E b a t m a x Maximal capacity of the batteries T C B a t Total cost of battery
E b a t m i n Batteries minimum permissible energy T C F C Total cost of fuel cell
E B a t L Lower limit of batteries capacity T C E l Total cost of electrolyzer system
E B a t U Upper limit of batteries capacity T C I n v Total cost of inverters
E T a n k Energy available at t in the tank T C P V Total cost of PV system
E T a n k ( t 1 ) Energy available in the tank at t-1 T C T a n k Total cost of hydrogen tank
E T a n k m i n Hydrogen minimum permissible energy T C W T Total cost of wind system
E T a n k m a x Nominal capacity hydrogen tank T a Ambient temperature
E T a n k L Lower limit of hydrogen tank capacity T C Solar PV panel cell temperature
E T a n k U Upper limit of hydrogen tank capacity W T Wind turbine
f Inflation rate v Wind velocity
F l o s s e s Degradation factor v c i Wind turbine’s speed on
G ( t ) Hourly solar radiation in W/m2 v c o Wind turbine’s speed off
G r e f Irradiance corresponding to standard measurement conditions (STC) v r Wind turbine’s speed rated
i n Nominal interest rate α Hellman exponent
k O & M Discount factor of O&M cost α P Temperature coefficient (%/°C)
k r Discount factor of replacement cost σ Battery self-discharge rate
L P S P Loss of power supply probability η p v Efficiency of the solar panel
n Component lifespan η r Reference efficiency of the solar panel
N Project lifetime η c h b Battery charging system efficiency
N I n v Number of inverters η d i s b Battery discharging efficiency
N P V Number of solar PV panel η e l Electrolyzer efficiency
N P V L Lower limit of solar panels number η F C Fuel cells efficiency

Appendix A

Table A1. Economical and technical characteristics of the various components.
Solar Panel
Model [88]LONGI LR4-72HPH-450
Power peak 450 W p
NOCT 45 ° C
Tilt angle 10 °
F l o s s e s 95 %
α P 0.35 %
Capital cost [89] 857 × 1.1 $ / k W
Operation and maintenance cost 1 %
Component’s replacement cost at the end of the project (salvage cost) 440 $ / k W
Life span 25 y e a r s
Wind turbine
ModelGW 150–3.0 MW (PMDD Smart Wind Turbine)
P r a t e d 3 M W
v c i / v r / v c o 2.5 / 9 / 18 m / s
Hub height 95 / 120 / 140 m
Capital cost [89] 1325 × 1.1 $ / k W
Operation and maintenance cost 3 % o f c a p i t a l c o s t
Life span + 20 y e a r s
Lithium-ion battery
Capital cost [90] 151 $ / k W
Replacement cost 151 $ / k W
Operation and maintenance cost 1 %
DOD 80 %
Charging efficiency 90 %
Discharging efficiency 90 %
Life span 10 y e a r s
Electrolyzer
Capital cost [75] 1000 $ / k W
Fixed operation and maintenance cost [91] 14.48 $ / k W
Variable operation and maintenance cost [91] 0.0005125 $ / k W h
Efficiency 77 %
Life span 20 y e a r s
Fuel cell
Capital cost [92] 600 $ / k W
Replacement cost 600 $ / k W
Fixed operation and maintenance cost [91] 13.43 $ / k W
Variable operation and maintenance cost [91] 0.0005125 $ / k W h
Efficiency 60 %
Life span 10 y e a r s
Hydrogen tank
Capital cost [93] 376.4 × 1.1 $ / k g
Operation and maintenance cost 2 %
Component’s replacement cost at the end of the project (salvage cost) 193.23 $ / k g
Life span 25 y e a r s
Inverter [92]
Capital cost 210 $ / k W
Replacement cost 210 $ / k W
Operation and maintenance cost 1 %
Component’s replacement cost at the end of the project (salvage cost) 98.01 $ / k W
Life span 15 y e a r s
Economic parameters
i n 7 %
f 3 %
Lifetime of the project 20 y e a r s
Algorithm parameters
Iteration 200
Population number 150

References

  1. Ritchie, H.; Roser, M.; Rosado, P. CO2 and Greenhouse Gas Emissions. Our World Data 2020. Available online: https://ourworldindata.org/emissions-by-sector (accessed on 17 May 2023).
  2. Shafiee, S.; Topal, E. When will fossil fuel reserves be diminished? Energy Policy 2009, 37, 181–189. [Google Scholar] [CrossRef]
  3. Khan, J.; Arsalan, M.H. Solar power technologies for sustainable electricity generation—A review. Renew. Sustain. Energy Rev. 2016, 55, 414–425. [Google Scholar] [CrossRef]
  4. Wind—Fuels & Technologies. Available online: https://www.iea.org/fuels-and-technologies/wind (accessed on 13 June 2023).
  5. Advantages and Challenges of Wind Energy. Available online: https://www.energy.gov/eere/wind/advantages-and-challenges-wind-energy (accessed on 13 June 2023).
  6. Eneo2020AnnualReport.pdf. Available online: https://www.eneocameroon.cm/index.php/en/eneo-annual-report-2020 (accessed on 17 May 2023).
  7. Amoussou, I.; Agajie, T.F.; Tanyi, E.; Khan, B. Technical and economic study of the replacement of LFO thermal power plant by hybrid PV-PHSS system in Northern Cameroon. Energy Rep. 2023, 9, 178–194. [Google Scholar] [CrossRef]
  8. Muh, E.; Amara, S.; Tabet, F. Sustainable energy policies in Cameroon: A holistic overview. Renew. Sustain. Energy Rev. 2018, 82, 3420–3429. [Google Scholar] [CrossRef]
  9. Estimating the Renewable Energy Potential in Africa: A GIS-Based Approach. Available online: https://www.irena.org/publications/2014/Aug/Estimating-the-Renewable-Energy-Potential-in-Africa-A-GIS-based-approach (accessed on 13 June 2023).
  10. Hoffstaedt, J.P.; Truijen, D.P.K.; Fahlbeck, J.; Gans, L.H.A.; Qudaih, M.; Laguna, A.J.; De Kooning, J.D.M.; Stockman, K.; Nilsson, H.; Storli, P.-T.; et al. Low-head pumped hydro storage: A review of applicable technologies for design, grid integration, control and modelling. Renew. Sustain. Energy Rev. 2022, 158, 112119. [Google Scholar] [CrossRef]
  11. Stocks, M.; Stocks, R.; Lu, B.; Cheng, C.; Blakers, A. Global Atlas of Closed-Loop Pumped Hydro Energy Storage. Joule 2021, 5, 270–284. [Google Scholar] [CrossRef]
  12. Ponnusamy, P.; Panthalingal, M.K.; Pullithadathil, B. Chapter 12—Technological risks and durability issues for the Proton Exchange Membrane Fuel Cell technology. In PEM Fuel Cells; Kaur, G., Ed.; Elsevier: Amsterdam, The Netherlands, 2022; pp. 279–314. ISBN 978-0-12-823708-3. [Google Scholar]
  13. Grid-Scale Storage–Analysis. Available online: https://www.iea.org/reports/grid-scale-storage (accessed on 13 June 2023).
  14. Conzen, J.; Lakshmipathy, S.; Kapahi, A.; Kraft, S.; DiDomizio, M. Lithium ion battery energy storage systems (BESS) hazards. J. Loss Prev. Process Ind. 2023, 81, 104932. [Google Scholar] [CrossRef]
  15. Hannan, M.A.; Wali, S.B.; Ker, P.J.; Rahman, M.S.A.; Mansor, M.; Ramachandaramurthy, V.K.; Muttaqi, K.M.; Mahlia, T.M.I.; Dong, Z.Y. Battery energy-storage system: A review of technologies, optimization objectives, constraints, approaches, and outstanding issues. J. Energy Storage 2021, 42, 103023. [Google Scholar] [CrossRef]
  16. Eltamaly, A.M.; Alotaibi, M.A.; Alolah, A.I.; Ahmed, M.A. A Novel Demand Response Strategy for Sizing of Hybrid Energy System With Smart Grid Concepts. IEEE Access 2021, 9, 20277–20294. [Google Scholar] [CrossRef]
  17. Eltamaly, A.M.; Alotaibi, M.A. Novel Fuzzy-Swarm Optimization for Sizing of Hybrid Energy Systems Applying Smart Grid Concepts. IEEE Access 2021, 9, 93629–93650. [Google Scholar] [CrossRef]
  18. Al Garni, H.Z.; Awasthi, A.; Ramli, M.A.M. Optimal design and analysis of grid-connected photovoltaic under different tracking systems using HOMER. Energy Convers. Manag. 2018, 155, 42–57. [Google Scholar] [CrossRef]
  19. Ghatak, A.; Alfred, R.B.; Singh, R.R. Optimization for Electric Vehicle Charging Station using Homer Grid. In Proceedings of the 2021 Innovations in Power and Advanced Computing Technologies (i-PACT), Kuala Lumpur, Malaysia, 27–29 November 2021; pp. 1–7. [Google Scholar]
  20. Riayatsyah, T.M.I.; Geumpana, T.A.; Fattah, I.M.R.; Rizal, S.; Mahlia, T.M.I. Techno-Economic Analysis and Optimisation of Campus Grid-Connected Hybrid Renewable Energy System Using HOMER Grid. Sustainability 2022, 14, 7735. [Google Scholar] [CrossRef]
  21. Gusain, C.; Mohan Tripathi, M.; Nangia, U. Study of Meta-heuristic Optimization Methodologies for Design of Hybrid Renewable Energy Systems. Therm. Sci. Eng. Prog. 2023, 39, 101711. [Google Scholar] [CrossRef]
  22. Bouaouda, A.; Sayouti, Y. Hybrid Meta-Heuristic Algorithms for Optimal Sizing of Hybrid Renewable Energy System: A Review of the State-of-the-Art. Arch. Comput. Methods Eng. 2022, 29, 4049–4083. [Google Scholar] [CrossRef]
  23. Al-Shamma’a, A.A.; Hussein Farh, H.M.; Noman, A.M.; Al-Shaalan, A.M.; Alkuhayli, A. Optimal Sizing of a Hybrid Renewable Photovoltaic-Wind System-Based Microgrid Using Harris Hawk Optimizer. Int. J. Photoenergy 2022, 2022, 4825411. [Google Scholar] [CrossRef]
  24. Wang, R.; Xiong, J.; He, M.; Gao, L.; Wang, L. Multi-objective optimal design of hybrid renewable energy system under multiple scenarios. Renew. Energy 2020, 151, 226–237. [Google Scholar] [CrossRef]
  25. Ming, M.; Wang, R.; Zha, Y.; Zhang, T. Multi-Objective Optimization of Hybrid Renewable Energy System Using an Enhanced Multi-Objective Evolutionary Algorithm. Energies 2017, 10, 674. [Google Scholar] [CrossRef] [Green Version]
  26. Diab, A.A.Z.; Sultan, H.M.; Mohamed, I.S.; Kuznetsov, O.N.; Do, T.D. Application of Different Optimization Algorithms for Optimal Sizing of PV/Wind/Diesel/Battery Storage Stand-Alone Hybrid Microgrid. IEEE Access 2019, 7, 119223–119245. [Google Scholar] [CrossRef]
  27. Kaur, R.; Krishnasamy, V.; Kandasamy, N.K. Optimal sizing of wind–PV-based DC microgrid for telecom power supply in remote areas. IET Renew. Power Gener. 2018, 12, 859–866. [Google Scholar] [CrossRef]
  28. Nemouchi, W.; Amrane, Y.; Nemouchi, H. Optimal Sizing Design of stand- Alone Hybrid System Using a Fuzzy PSO. In Artificial Intelligence and Heuristics for Smart Energy Efficiency in Smart Cities; Hatti, M., Ed.; Springer International Publishing: Cham, Switzerland, 2022; pp. 100–110. [Google Scholar]
  29. Yang, D.; Jiang, C.; Cai, G.; Huang, N. Optimal sizing of a wind/solar/battery/diesel hybrid microgrid based on typical scenarios considering meteorological variability. IET Renew. Power Gener. 2019, 13, 1446–1455. [Google Scholar] [CrossRef]
  30. Zhou, J.; Xu, Z. Optimal sizing design and integrated cost-benefit assessment of stand-alone microgrid system with different energy storage employing chameleon swarm algorithm: A rural case in Northeast China. Renew. Energy 2023, 202, 1110–1137. [Google Scholar] [CrossRef]
  31. Kaur, R.; Krishnasamy, V.; Kandasamy, N.K.; Kumar, S. Discrete Multiobjective Grey Wolf Algorithm Based Optimal Sizing and Sensitivity Analysis of PV-Wind-Battery System for Rural Telecom Towers. IEEE Syst. J. 2020, 14, 729–737. [Google Scholar] [CrossRef]
  32. Lei, G.; Song, H.; Rodriguez, D. Power generation cost minimization of the grid-connected hybrid renewable energy system through optimal sizing using the modified seagull optimization technique. Energy Rep. 2020, 6, 3365–3376. [Google Scholar] [CrossRef]
  33. El-Sattar, H.A.; Kamel, S.; Sultan, H.M.; Zawbaa, H.M.; Jurado, F. Optimal design of Photovoltaic, Biomass, Fuel Cell, Hydrogen Tank units and Electrolyzer hybrid system for a remote area in Egypt. Energy Rep. 2022, 8, 9506–9527. [Google Scholar] [CrossRef]
  34. Sultan, H.M.; Menesy, A.S.; Kamel, S.; Korashy, A.; Almohaimeed, S.A.; Abdel-Akher, M. An improved artificial ecosystem optimization algorithm for optimal configuration of a hybrid PV/WT/FC energy system. Alex. Eng. J. 2021, 60, 1001–1025. [Google Scholar] [CrossRef]
  35. Attemene, N.S.; Agbli, K.S.; Fofana, S.; Hissel, D. Optimal sizing of a wind, fuel cell, electrolyzer, battery and supercapacitor system for off-grid applications. Int. J. Hydrogen Energy 2020, 45, 5512–5525. [Google Scholar] [CrossRef]
  36. Khan, A.; Javaid, N. Optimal sizing of a stand-alone photovoltaic, wind turbine and fuel cell systems. Comput. Electr. Eng. 2020, 85, 106682. [Google Scholar] [CrossRef]
  37. Hadidian Moghaddam, M.J.; Kalam, A.; Nowdeh, S.A.; Ahmadi, A.; Babanezhad, M.; Saha, S. Optimal sizing and energy management of stand-alone hybrid photovoltaic/wind system based on hydrogen storage considering LOEE and LOLE reliability indices using flower pollination algorithm. Renew. Energy 2019, 135, 1412–1434. [Google Scholar] [CrossRef]
  38. Samy, M.M.; Mosaad, M.I.; Barakat, S. Optimal economic study of hybrid PV-wind-fuel cell system integrated to unreliable electric utility using hybrid search optimization technique. Int. J. Hydrogen Energy 2021, 46, 11217–11231. [Google Scholar] [CrossRef]
  39. Jahannoosh, M.; Nowdeh, S.A.; Naderipour, A.; Kamyab, H.; Davoudkhani, I.F.; Klemeš, J.J. New hybrid meta-heuristic algorithm for reliable and cost-effective designing of photovoltaic/wind/fuel cell energy system considering load interruption probability. J. Clean. Prod. 2021, 278, 123406. [Google Scholar] [CrossRef]
  40. France: EIB, with the Support of the European Commission, is Financing the Construction and Operation of a Photovoltaic (PV) Plant Combined with Innovative Storage Technologies in French Guiana. Available online: https://www.eib.org/en/press/all/2021-317-france-eib-with-the-support-of-the-european-commission-is-financing-the-construction-and-operation-of-a-photovoltaic-pv-plant-combined-with-innovative-storage-technologies-in-french-guiana (accessed on 10 July 2023).
  41. Patel, S. Pioneering 10-MW Baseload Hydrogen Power Plant Breaks Ground in French Guiana. Available online: https://www.powermag.com/pioneering-10-mw-baseload-hydrogen-power-plant-breaks-ground-in-french-guiana/ (accessed on 10 July 2023).
  42. Mirjalili, S. Moth-flame optimization algorithm: A novel nature-inspired heuristic paradigm. Knowl.-Based Syst. 2015, 89, 228–249. [Google Scholar] [CrossRef]
  43. Nadimi-Shahraki, M.H.; Taghian, S.; Mirjalili, S. An improved grey wolf optimizer for solving engineering problems. Expert Syst. Appl. 2021, 166, 113917. [Google Scholar] [CrossRef]
  44. Mirjalili, S.; Mirjalili, S.M.; Hatamlou, A. Multi-Verse Optimizer: A nature-inspired algorithm for global optimization. Neural Comput. Appl. 2016, 27, 495–513. [Google Scholar] [CrossRef]
  45. Abdollahzadeh, B.; Gharehchopogh, F.S.; Mirjalili, S. African vultures optimization algorithm: A new nature-inspired metaheuristic algorithm for global optimization problems. Comput. Ind. Eng. 2021, 158, 107408. [Google Scholar] [CrossRef]
  46. E, J. 1 Nouveau Message. Available online: https://eneocameroon.cm/ (accessed on 4 May 2023).
  47. JRC Photovoltaic Geographical Information System (PVGIS)—European Commission. Available online: https://re.jrc.ec.europa.eu/pvg_tools/en/ (accessed on 5 May 2023).
  48. Arreyndip, N.A.; Joseph, E. Small 500 kW onshore wind farm project in Kribi, Cameroon: Sizing and checkers layout optimization model. Energy Rep. 2018, 4, 528–535. [Google Scholar] [CrossRef]
  49. Arreyndip, N.A.; Joseph, E.; David, A. Wind energy potential assessment of Cameroon’s coastal regions for the installation of an onshore wind farm. Heliyon 2016, 2, e00187. [Google Scholar] [CrossRef] [Green Version]
  50. Bukar, A.L.; Tan, C.W.; Lau, K.Y. Optimal sizing of an autonomous photovoltaic/wind/battery/diesel generator microgrid using grasshopper optimization algorithm. Sol. Energy 2019, 188, 685–696. [Google Scholar] [CrossRef]
  51. Singh, S.; Chauhan, P.; Singh, N. Capacity optimization of grid connected solar/fuel cell energy system using hybrid ABC-PSO algorithm. Int. J. Hydrogen Energy 2020, 45, 10070–10088. [Google Scholar] [CrossRef]
  52. Yin, X.; Cheng, L.; Wang, X.; Lu, J.; Qin, H. Optimization for hydro-photovoltaic-wind power generation system based on modified version of multi-objective whale optimization algorithm. Energy Procedia 2019, 158, 6208–6216. [Google Scholar] [CrossRef]
  53. Akram, U.; Khalid, M.; Shafiq, S. An innovative hybrid wind-solar and battery-supercapacitor microgrid system—Development and optimization. IEEE Access 2017, 5, 25897–25912. [Google Scholar] [CrossRef]
  54. Yimen, N.; Tchotang, T.; Kanmogne, A.; Abdelkhalikh Idriss, I.; Musa, B.; Aliyu, A.; Okonkwo, E.C.; Abba, S.I.; Tata, D.; Meva’a, L.; et al. Optimal Sizing and Techno-Economic Analysis of Hybrid Renewable Energy Systems—A Case Study of a Photovoltaic/Wind/Battery/Diesel System in Fanisau, Northern Nigeria. Processes 2020, 8, 1381. [Google Scholar] [CrossRef]
  55. Amoussou, I.; Tanyi, E.; Ali, A.; Agajie, T.F.; Khan, B.; Ballester, J.B.; Nsanyuy, W.B. Optimal Modeling and Feasibility Analysis of Grid-Interfaced Solar PV/Wind/Pumped Hydro Energy Storage Based Hybrid System. Sustainability 2023, 15, 1222. [Google Scholar] [CrossRef]
  56. Xu, X.; Hu, W.; Cao, D.; Huang, Q.; Chen, C.; Chen, Z. Optimized sizing of a standalone PV-wind-hydropower station with pumped-storage installation hybrid energy system. Renew. Energy 2020, 147, 1418–1431. [Google Scholar] [CrossRef]
  57. Cai, W.; Li, X.; Maleki, A.; Pourfayaz, F.; Rosen, M.A.; Alhuyi Nazari, M.; Bui, D.T. Optimal sizing and location based on economic parameters for an off-grid application of a hybrid system with photovoltaic, battery and diesel technology. Energy 2020, 201, 117480. [Google Scholar] [CrossRef]
  58. Pu, Y.; Li, Q.; Zou, X.; Li, R.; Li, L.; Chen, W.; Liu, H. Optimal sizing for an integrated energy system considering degradation and seasonal hydrogen storage. Appl. Energy 2021, 302, 117542. [Google Scholar] [CrossRef]
  59. Navarro, R.M.; Guil, R.; Fierro, J.L.G. 2-Introduction to hydrogen production. In Compendium of Hydrogen Energy; Subramani, V., Basile, A., Veziroğlu, T.N., Eds.; Woodhead Publishing Series in Energy; Woodhead Publishing: Oxford, UK, 2015; pp. 21–61. ISBN 978-1-78242-361-4. [Google Scholar]
  60. Keçebaş, A.; Kayfeci, M.; Bayat, M. Chapter 9—Electrochemical hydrogen generation. In Solar Hydrogen Production; Calise, F., D’Accadia, M.D., Santarelli, M., Lanzini, A., Ferrero, D., Eds.; Academic Press: Cambridge, MA, USA, 2019; pp. 299–317. ISBN 978-0-12-814853-2. [Google Scholar]
  61. Bharti, A.; Natarajan, R. Chapter 7—Proton exchange membrane testing and diagnostics. In PEM Fuel Cells; Kaur, G., Ed.; Elsevier: Amsterdam, The Netherlands, 2022; pp. 137–171. ISBN 978-0-12-823708-3. [Google Scholar]
  62. Wang, Y.; Seo, B.; Wang, B.; Zamel, N.; Jiao, K.; Adroher, X.C. Fundamentals, materials, and machine learning of polymer electrolyte membrane fuel cell technology. Energy AI 2020, 1, 100014. [Google Scholar] [CrossRef]
  63. Kamarzaman, N.A.; Sulaiman, S.I.; Yassin, A.I.M.; Ibrahim, I.R.; Zainuddin, H. A honey badger algorithm for optimal sizing of an AC coupled hybrid stand-alone photovoltaic system. Energy Rep. 2022, 8, 511–520. [Google Scholar] [CrossRef]
  64. Mahmoudi, S.M.; Maleki, A.; Rezaei Ochbelagh, D. Investigating the role of the carbon tax and loss of power supply probability in sizing a hybrid energy system, economically and environmentally. Energy Convers. Manag. 2023, 280, 116793. [Google Scholar] [CrossRef]
  65. Gharibi, M.; Askarzadeh, A. Size and power exchange optimization of a grid-connected diesel generator-photovoltaic-fuel cell hybrid energy system considering reliability, cost and renewability. Int. J. Hydrogen Energy 2019, 44, 25428–25441. [Google Scholar] [CrossRef]
  66. Agajie, T.F.; Fopah-Lele, A.; Amoussou, I.; Ali, A.; Khan, B.; Tanyi, E. Optimal Design and Mathematical Modeling of Hybrid Solar PV–Biogas Generator with Energy Storage Power Generation System in Multi-Objective Function Cases. Sustainability 2023, 15, 8264. [Google Scholar] [CrossRef]
  67. Agajie, T.F.; Fopah-Lele, A.; Ali, A.; Amoussou, I.; Khan, B.; Elsisi, M.; Nsanyuy, W.B.; Mahela, O.P.; Álvarez, R.M.; Tanyi, E. Integration of Superconducting Magnetic Energy Storage for Fast-Response Storage in a Hybrid Solar PV-Biogas with Pumped-Hydro Energy Storage Power Plant. Sustainability 2023, 15, 10736. [Google Scholar] [CrossRef]
  68. Agajie, T.F.; Ali, A.; Fopah-Lele, A.; Amoussou, I.; Khan, B.; Velasco, C.L.R.; Tanyi, E. A Comprehensive Review on Techno-Economic Analysis and Optimal Sizing of Hybrid Renewable Energy Sources with Energy Storage Systems. Energies 2023, 16, 642. [Google Scholar] [CrossRef]
  69. De Azevedo Dias, C.L.; Branco, D.A.C.; Arouca, M.C.; Legey, L.F.L. Performance estimation of photovoltaic technologies in Brazil. Renew. Energy 2017, 114, 367–375. [Google Scholar] [CrossRef]
  70. Kazem, H.A.; Albadi, M.H.; Al-Waeli, A.H.; Al-Busaidi, A.H.; Chaichan, M.T. Techno-economic feasibility analysis of 1 MW photovoltaic grid connected system in Oman. Case Stud. Therm. Eng. 2017, 10, 131–141. [Google Scholar] [CrossRef]
  71. Arabi-Nowdeh, S.; Nasri, S.; Saftjani, P.B.; Naderipour, A.; Abdul-Malek, Z.; Kamyab, H.; Jafar-Nowdeh, A. Multi-criteria optimal design of hybrid clean energy system with battery storage considering off-and on-grid application. J. Clean. Prod. 2021, 290, 125808. [Google Scholar] [CrossRef]
  72. Gharavi, H.; Ardehali, M.M.; Ghanbari-Tichi, S. Imperial competitive algorithm optimization of fuzzy multi-objective design of a hybrid green power system with considerations for economics, reliability, and environmental emissions. Renew. Energy 2015, 78, 427–437. [Google Scholar] [CrossRef]
  73. Salvage Value. Available online: https://www.homerenergy.com/products/pro/docs/3.9/salvage_value.html (accessed on 13 June 2023).
  74. Al-Masri, H.M.; Al-Sharqi, A.A. Technical design and optimal energy management of a hybrid photovoltaic biogas energy system using multi-objective grey wolf optimisation. IET Renew. Power Gener. 2020, 14, 2765–2778. [Google Scholar] [CrossRef]
  75. Green Hydrogen Cost Reduction: Scaling Up Electrolysers to Meet the 1.5C Climate Goal. Available online: https://www.irena.org/-/media/Files/IRENA/Agency/Publication/2020/Dec/IRENA_Green_hydrogen_cost_2020.pdf (accessed on 17 May 2023).
  76. Bruck, M.; Sandborn, P.; Goudarzi, N. A Levelized Cost of Energy (LCOE) model for wind farms that include Power Purchase Agreements (PPAs). Renew. Energy 2018, 122, 131–139. [Google Scholar] [CrossRef]
  77. Bruck, M.; Sandborn, P. Pricing bundled renewable energy credits using a modified LCOE for power purchase agreements. Renew. Energy 2021, 170, 224–235. [Google Scholar] [CrossRef]
  78. Settoul, S.; Chenni, R.; Hasan, H.A.; Zellagui, M.; Kraimia, M.N. MFO Algorithm for Optimal Location and Sizing of Multiple Photovoltaic Distributed Generations Units for Loss Reduction in Distribution Systems. In Proceedings of the 2019 7th International Renewable and Sustainable Energy Conference (IRSEC), Agadir, Morocco, 27–30 November 2019; pp. 1–6. [Google Scholar]
  79. Sadoudi, S.; Boudour, M. Moth-Flame Optimization Algorithm for Solving Dynamic Economic Dispatch Considering Optimal Sizing of PV-ESS System. In ICREEC 2019; Belasri, A., Beldjilali, S.A., Eds.; Springer: Singapore, 2020; pp. 639–645. [Google Scholar]
  80. Shehab, M.; Abualigah, L.; Al Hamad, H.; Alabool, H.; Alshinwan, M.; Khasawneh, A.M. Moth–flame optimization algorithm: Variants and applications. Neural Comput. Appl. 2020, 32, 9859–9884. [Google Scholar] [CrossRef]
  81. Sahoo, S.K.; Saha, A.K.; Ezugwu, A.E.; Agushaka, J.O.; Abuhaija, B.; Alsoud, A.R.; Abualigah, L. Moth Flame Optimization: Theory, Modifications, Hybridizations, and Applications. Arch. Comput. Methods Eng. 2023, 30, 391–426. [Google Scholar] [CrossRef] [PubMed]
  82. Fausto, F.; Cuevas, E.; Valdivia, A.; González, A. A global optimization algorithm inspired in the behavior of selfish herds. Biosystems 2017, 160, 39–55. [Google Scholar] [CrossRef]
  83. Ramadan, A.-E.; Kamel, S.; Khurshaid, T.; Oh, S.-R.; Rhee, S.-B. Parameter Extraction of Three Diode Solar Photovoltaic Model Using Improved Grey Wolf Optimizer. Sustainability 2021, 13, 6963. [Google Scholar] [CrossRef]
  84. Ghazi, G.A.; Hasanien, H.M.; Al-Ammar, E.A.; Turky, R.A.; Ko, W.; Park, S.; Choi, H.-J. African Vulture Optimization Algorithm-Based PI Controllers for Performance Enhancement of Hybrid Renewable-Energy Systems. Sustainability 2022, 14, 8172. [Google Scholar] [CrossRef]
  85. Wang, Y.; Li, S.; Sun, H.; Huang, C.; Youssefi, N. The utilization of adaptive African vulture optimizer for optimal parameter identification of SOFC. Energy Rep. 2022, 8, 551–560. [Google Scholar] [CrossRef]
  86. Alanazi, M.; Fathy, A.; Yousri, D.; Rezk, H. Optimal reconfiguration of shaded PV based system using African vultures optimization approach. Alex. Eng. J. 2022, 61, 12159–12185. [Google Scholar] [CrossRef]
  87. HOME-SoDa. Available online: https://www.soda-pro.com/home (accessed on 4 May 2023).
  88. Longi 450W LR4-72HPH 450/MR Solar Panel. Available online: https://suministrosdelsol.com/en/photovoltaic-panels/1221-longi-450w-lr472hph-hc-solar-panel.html (accessed on 13 January 2023).
  89. Renewable Power Generation Costs in 2021. Available online: https://www.irena.org/publications/2022/Jul/Renewable-Power-Generation-Costs-in-2021 (accessed on 7 May 2023).
  90. Lithium-Ion Battery Pack Prices Rise for First Time to an Average of $151/kWh. BloombergNEF 2022. Available online: https://about.bnef.com/blog/lithium-ion-battery-pack-prices-rise-for-first-time-to-an-average-of-151-kwh/ (accessed on 17 May 2023).
  91. Mongird, K.; Viswanathan, V.; Alam, J.; Vartanian, C.; Sprenkle, V.; Baxter, R. 2020 grid energy storage technology cost and performance assessment. Energy 2020, 2020, 6–15. [Google Scholar]
  92. Kharel, S.; Shabani, B. Hydrogen as a Long-Term Large-Scale Energy Storage Solution to Support Renewables. Energies 2018, 11, 2825. [Google Scholar] [CrossRef] [Green Version]
  93. Elberry, A.M.; Thakur, J.; Santasalo-Aarnio, A.; Larmi, M. Large-scale compressed hydrogen storage as part of renewable electricity storage systems. Int. J. Hydrogen Energy 2021, 46, 15671–15690. [Google Scholar] [CrossRef]
Figure 1. Power generated by thermal power plants over a day.
Sustainability 15 11510 g001
Figure 2. Average monthly temperature and monthly solar radiation.
Sustainability 15 11510 g002
Figure 3. Average monthly wind speed of Limbe.
Sustainability 15 11510 g003
Figure 4. Schematic diagram of the proposed system.
Sustainability 15 11510 g004
Figure 5. Depicts the proposed new systems’ energy management flowchart.
Sustainability 15 11510 g005
Figure 6. Hourly data of ambient temperature and solar radiation for one year.
Sustainability 15 11510 g006
Figure 7. Wind speed data for the selected site for one year.
Sustainability 15 11510 g007
Figure 8. The convergence curves obtained for the various algorithms.
Sustainability 15 11510 g008
Figure 9. Convergence curves obtained for the storage types under consideration.
Sustainability 15 11510 g009
Figure 10. Share of each component in the project’s total cost.
Sustainability 15 11510 g010
Figure 11. Storage’s role in meeting total energy demand.
Sustainability 15 11510 g011
Figure 12. Levelized cost of energy for different scenarios.
Sustainability 15 11510 g012
Figure 13. Annual energy generated by renewable energy systems.
Sustainability 15 11510 g013
Figure 14. Energy consumed/supplied by storage systems.
Sustainability 15 11510 g014
Figure 15. Results output for one day without deficit.
Sustainability 15 11510 g015
Figure 16. Results output for one day with deficit.
Sustainability 15 11510 g016
Table 1. Results obtained for the different algorithms.
FactorsMFOI-GWOMVOAVOA
L P S P   ( % ) 0.09990.09940.09998850.0999
T C   ( $ ) 692,291,975.224694,525,861.46695,049,204.50696,664,074.77
P P V   ( M W ) 129.14129.05129.16131.45
P W T   ( M W ) 135135135132
E b a t n   ( M W h ) 106.8085.3847995.13
P E l n   ( M W ) 63.2066.5169.2367.55
P F C n   ( M W ) 81.9183.4682.5483.69
M t a n k   ( k g ) 105,802110,518.77110,330112,996.20
P I n v n   ( M W ) 130.74130.65130.77133.08
Table 2. Results of the MFO algorithm for the various types of storage considered.
FactorsLithium BatteryHydrogenLithium Battery-Hydrogen
L P S P   ( % ) 0.09990.09990.0999
T C   ( $ ) 816,123,339.58708,918,245.46692,291,975.22
P P V   ( M W ) 216135129.14
P W T   ( M W ) 135135135
E b a t n   ( M W h ) 974.0530106.80
P E l n   ( M W ) 079.5963.20
P F C n   ( M W ) 088.2981.91
M t a n k   ( k g ) 0120,417.59105,802
P I n v n   ( M W ) 218.68136.68130.74
Disclaimer/Publisher’s Note: The statements, opinions and data contained in all publications are solely those of the individual author(s) and contributor(s) and not of MDPI and/or the editor(s). MDPI and/or the editor(s) disclaim responsibility for any injury to people or property resulting from any ideas, methods, instructions or products referred to in the content.

