Article

The High-Value Product, Bio-Waste, and Eco-Friendly Energy as the Tripod of the Microalgae Biorefinery: Connecting the Dots

by
Rosangela Rodrigues Dias
,
Mariany Costa Deprá
,
Cristiano Ragagnin de Menezes
,
Leila Queiroz Zepka
and
Eduardo Jacob-Lopes
*
Bioprocess Intensification Group, Federal University of Santa Maria (UFSM), Roraima Avenue 1000, Santa Maria 97105-900, RS, Brazil
*
Author to whom correspondence should be addressed.
Sustainability 2023, 15(15), 11494; https://doi.org/10.3390/su151511494
Submission received: 2 June 2023 / Revised: 15 July 2023 / Accepted: 21 July 2023 / Published: 25 July 2023

Abstract

:
A bio-based circular economy is fundamental to catalyzing the transition to a new economic model that thrives well within the planet’s ecological limits. The microalgae biorefinery, which consists of converting biomass into multiple products, operates in light of the principles of a circular economy. Therefore, as the pivot of a new economic paradigm that aims to promote ecological robustness, the main scope and motivation of this article are to use life cycle assessment to scrutinize the environmental sustainability of a microalgae-based biorefinery system. We assume β-carotene as the flagship of the microalgae industry and evaluate the sustainability metrics and indicators of two residual products: bulk oil and defatted biomass. The role of the use of renewable energy in the unit operations of the biorefinery was also evaluated. The results of this study show that waste products contribute an almost insignificant fraction of the ecological footprint and the cost and energy demand of the microalgae-based biorefinery. It is also confirmed from the results that the transition from coal-based energy to renewable is the most realistic path to production with significantly lower emissions. In sum, the consolidation of the microalgae biorefinery seems to be just around the corner, and our highlights can help make this a successful route.

1. Introduction

Our current economic system has surpassed many of the earth’s capacity limits [1,2]. It failed to value nature and, now, lives under the threat of increasing losses. The prognosis is that there is no future for business as usual. And turning the tide requires connecting the dots between investors, companies, governmental and non-governmental organizations, and local communities to promote a new paradigm of producing goods and services—putting nature back at the center of our economy [3].
With this bias, with the fossil and linear economy approaching its expiration date, the biobased circular economy has gained prominence and could be the catalyst for a prosperous future. In a circular bioeconomy, natural capital is renewable, recovered, and reused as much as possible, creating new products and replacing conventional high-carbon materials. Biowaste is not discarded; they create secondary products that, after use, can flow back into the biosphere, closing biogeochemical cycles. The value is maximized and waste is minimized in this conceptual framework [4].
From this perspective, microalgae biotechnology—under a biorefinery model—emerges as a promising approach to achieving a cost-effective, bio-based circular economy that thrives well within the confines of the planet [5]. In a historical context, since the dawn of humanity, species such as Arthrospira platensis and Chlorella vulgaris have been used by society as a food bioresource—a priori, due to their high protein content. Later, in the face of the energy crisis, species such as Crypthecodinium cohnii, Ankistrodesmus sp, Botrycoccus braunii, Nitzschia laevis, and Nannochloropsis oculata became pioneers in prospecting the production of fatty acids as feedstock for bioenergy production and also food supplementation. Subsequently, with the increase in awareness and health promotion, research focused on natural product exploitation, with the spotlight being directed to pigments such as beta-carotene and astaxanthin biosynthesized by the microalgae Dunaliella salina and Haematococcus pluvialis, respectively [6,7].
However, although scientific advances have invested in and reinforced promising findings, commercial microalgae cultivation is technically recent, less than 70 years old. The challenges of manipulating and producing microorganisms with such versatile and complex metabolisms result in a universe of bottlenecks to be overcome. Indeed, microalgae are most commonly cultivated commercially in open systems such as raceway ponds under photoautotrophic and/or mixotrophic regimes. However, these systems are susceptible to contamination and low cell productivity, putting the mass production of microalgal bioproducts to the test. The use of closed systems, such as photobioreactors, or biofermenters—under heterotrophic culture regimes—even if they benefit from the technological subsystems of microbial biosynthesis already developed, require high energy for processing, beyond the intrinsic requirements of the strains of microalgae, making it difficult to obtain a large-scale sustainable standard project to work with [8,9].
Thereby, in view of the highlights of the scientific journey for the commercialization of microalgae, it was possible to learn that, despite the path full of bumps and twists, new insights and important opportunities to improve this technology have emerged [10]. The experiences on laboratory and commercial scales have shown that the biorefinery concept applied to microalgae is a hopeful route to more economically and environmentally sustainable productions. In the state of the art, as is known, a world reference of sustainable microalgae-based biorefinery has not been established. This is because the research and development of biotechnological routes related to algal biorefineries has focused on the use of low-value commodities (biomass and biofuels) as the biorefinery core. However, this primary use of microalgae has not shown successful results unless the yield of high-value compounds is addressed together [11]. In this vein, following the cascade principle, that is, giving priority to the production of a high-value product before a low-value one, it may be possible to successfully move towards a microalgae-based circular bioeconomy using the biorefinery approach. This can make microalgae-based biological processes less dystopian. Furthermore, it is important to highlight that the use of ecologically correct energy in unit operations seems to be, at the same time, the definitive key to overcoming the environmental deficit of microalgae processes and products [12].
In light of this, our paradigm shift proposes high-value fine chemicals use, such as β-carotene, as the value center of a microalgae biorefinery, emphasizing biowaste recovery and integration with eco-friendly energy. Like this, a microalgae-based biorefinery realigned with nature was assembled and used as a robust justification to be replicated on an industrial scale by microalgae producers. The research questions addressed in this article provide a holistic assessment of the environmental profile of a microalgae-based biorefinery system that, following the cascade principle with the use of renewable energy and the circular economy approach, seeks to overcome environmental and economic restrictions of the current linear economic model that struggles to create revenue. The role of this article for sustainability is to promote a bio-based circular economy that takes off and consolidates in what appears to be the beginning of a new age—the Age of Sustainability.

2. Material and Methods

2.1. Life Cycle Assessment (LCA)

The life cycle assessment (LCA) was performed according to the ISO 14040 series [13]. The LCA, as detailed below, is composed of four phases: goal and scope definition (i), inventory analysis (ii), impact assessment (iii), and interpretation of results (iv).

2.1.1. Goal and Scope Definition

The objective of applying the LCA was to evaluate the metrics and indicators of environmental sustainability of a biorefinery system based on Dunaliella salina with a main focus on β-carotene and valorization waste biomass. The species Dunaliella salina was considered in this study because it is considered one of the best candidates for β-carotene production (~14% dry weight), beyond being the main strain used in the commercial production of natural carotene. In addition, its biomass composition also shows high content values of protein, lipid, and glycerol. Thus, the centesimal composition as the basis of this study considered the values on a dry basis found in the literature, being the fraction of β-carotene of 10%, proteins of 35%, fatty acids of 20%, and glycerol of 15%, disregarding other potential bioproducts such as the fraction of carbohydrates, vitamins, and minerals also present in the residual biomass [14,15]. In addition, bio-waste was selected due to its high potential for application in the microalgae global market, with bulk oil being the main feedstock for bioenergy segments such as biodiesel, as well as a food supplement considering the fatty acids polyunsaturated fraction. Likewise, defatted biomass has been required as a bioresource of protein supplementation for animal and human feed, beyond the application in bioenergy, such as bioethanol production (see Supplementary Material Table S1).
The LCA was also applied to assess the environmental footprint of the biorefinery from Dunaliella salina powered by coal-based energy versus photovoltaic energy from amorphous silicon solar cells (a-Si) and onshore wind energy. The study uses theoretical and experimental data collected from the scientific literature [6,16,17,18].
The system boundaries were defined from the cradle-to-gate life cycle and comprise a microalgae plant with a production of 9.38 tons/year of dry biomass, fractionated into 1 ton/year of β-carotene pigment (main product), 1.51 tons/year of bulk oil (secondary product), and 2.34 tons/year of defatted biomass (tertiary product). Only the environmental impacts of electricity consumption were included in the analysis because they represent the majority, if not almost the entire fraction of the ecological footprint of microalgae products [6].

Step 1: β-Carotene Production

The unit operations proposed in Step 1 are in accordance with the production process consolidated by classic references in the literature (Figure 1) [6,19]. The growth conditions considered in raceway ponds were a pH of 7.5, an average temperature of 26 °C, a light intensity of 50 µmol/m2/s−1, and a photoperiod of 12:12 h [20]. Also, it is important to mention that the culture medium of Dunaliella salina is predominantly hypersaline; therefore, the contamination risk rates are low.

Step 2: Bulk Oil Production

The unit operations proposed in Step 2 are in accordance with dos Santos et al. [17] (Figure 2). The residual biomass from the β-carotene extraction process is then submitted to the lipid extraction process. This lipid extraction, based on hexane, was defined as the method for large-scale applications [21]. Subsequently, the biomass blend with the extractor solvent is centrifuged, going through the solvent recovery and evaporation/stripper step. The evaporation/stripper is the most economical method on an industrial scale for reducing volatiles in heat-sensitive materials and viscous products. Finally, the oil-rich extract is directed to the desolventizer, obtaining the bulk oil.

Step 3: Defatted Biomass Production

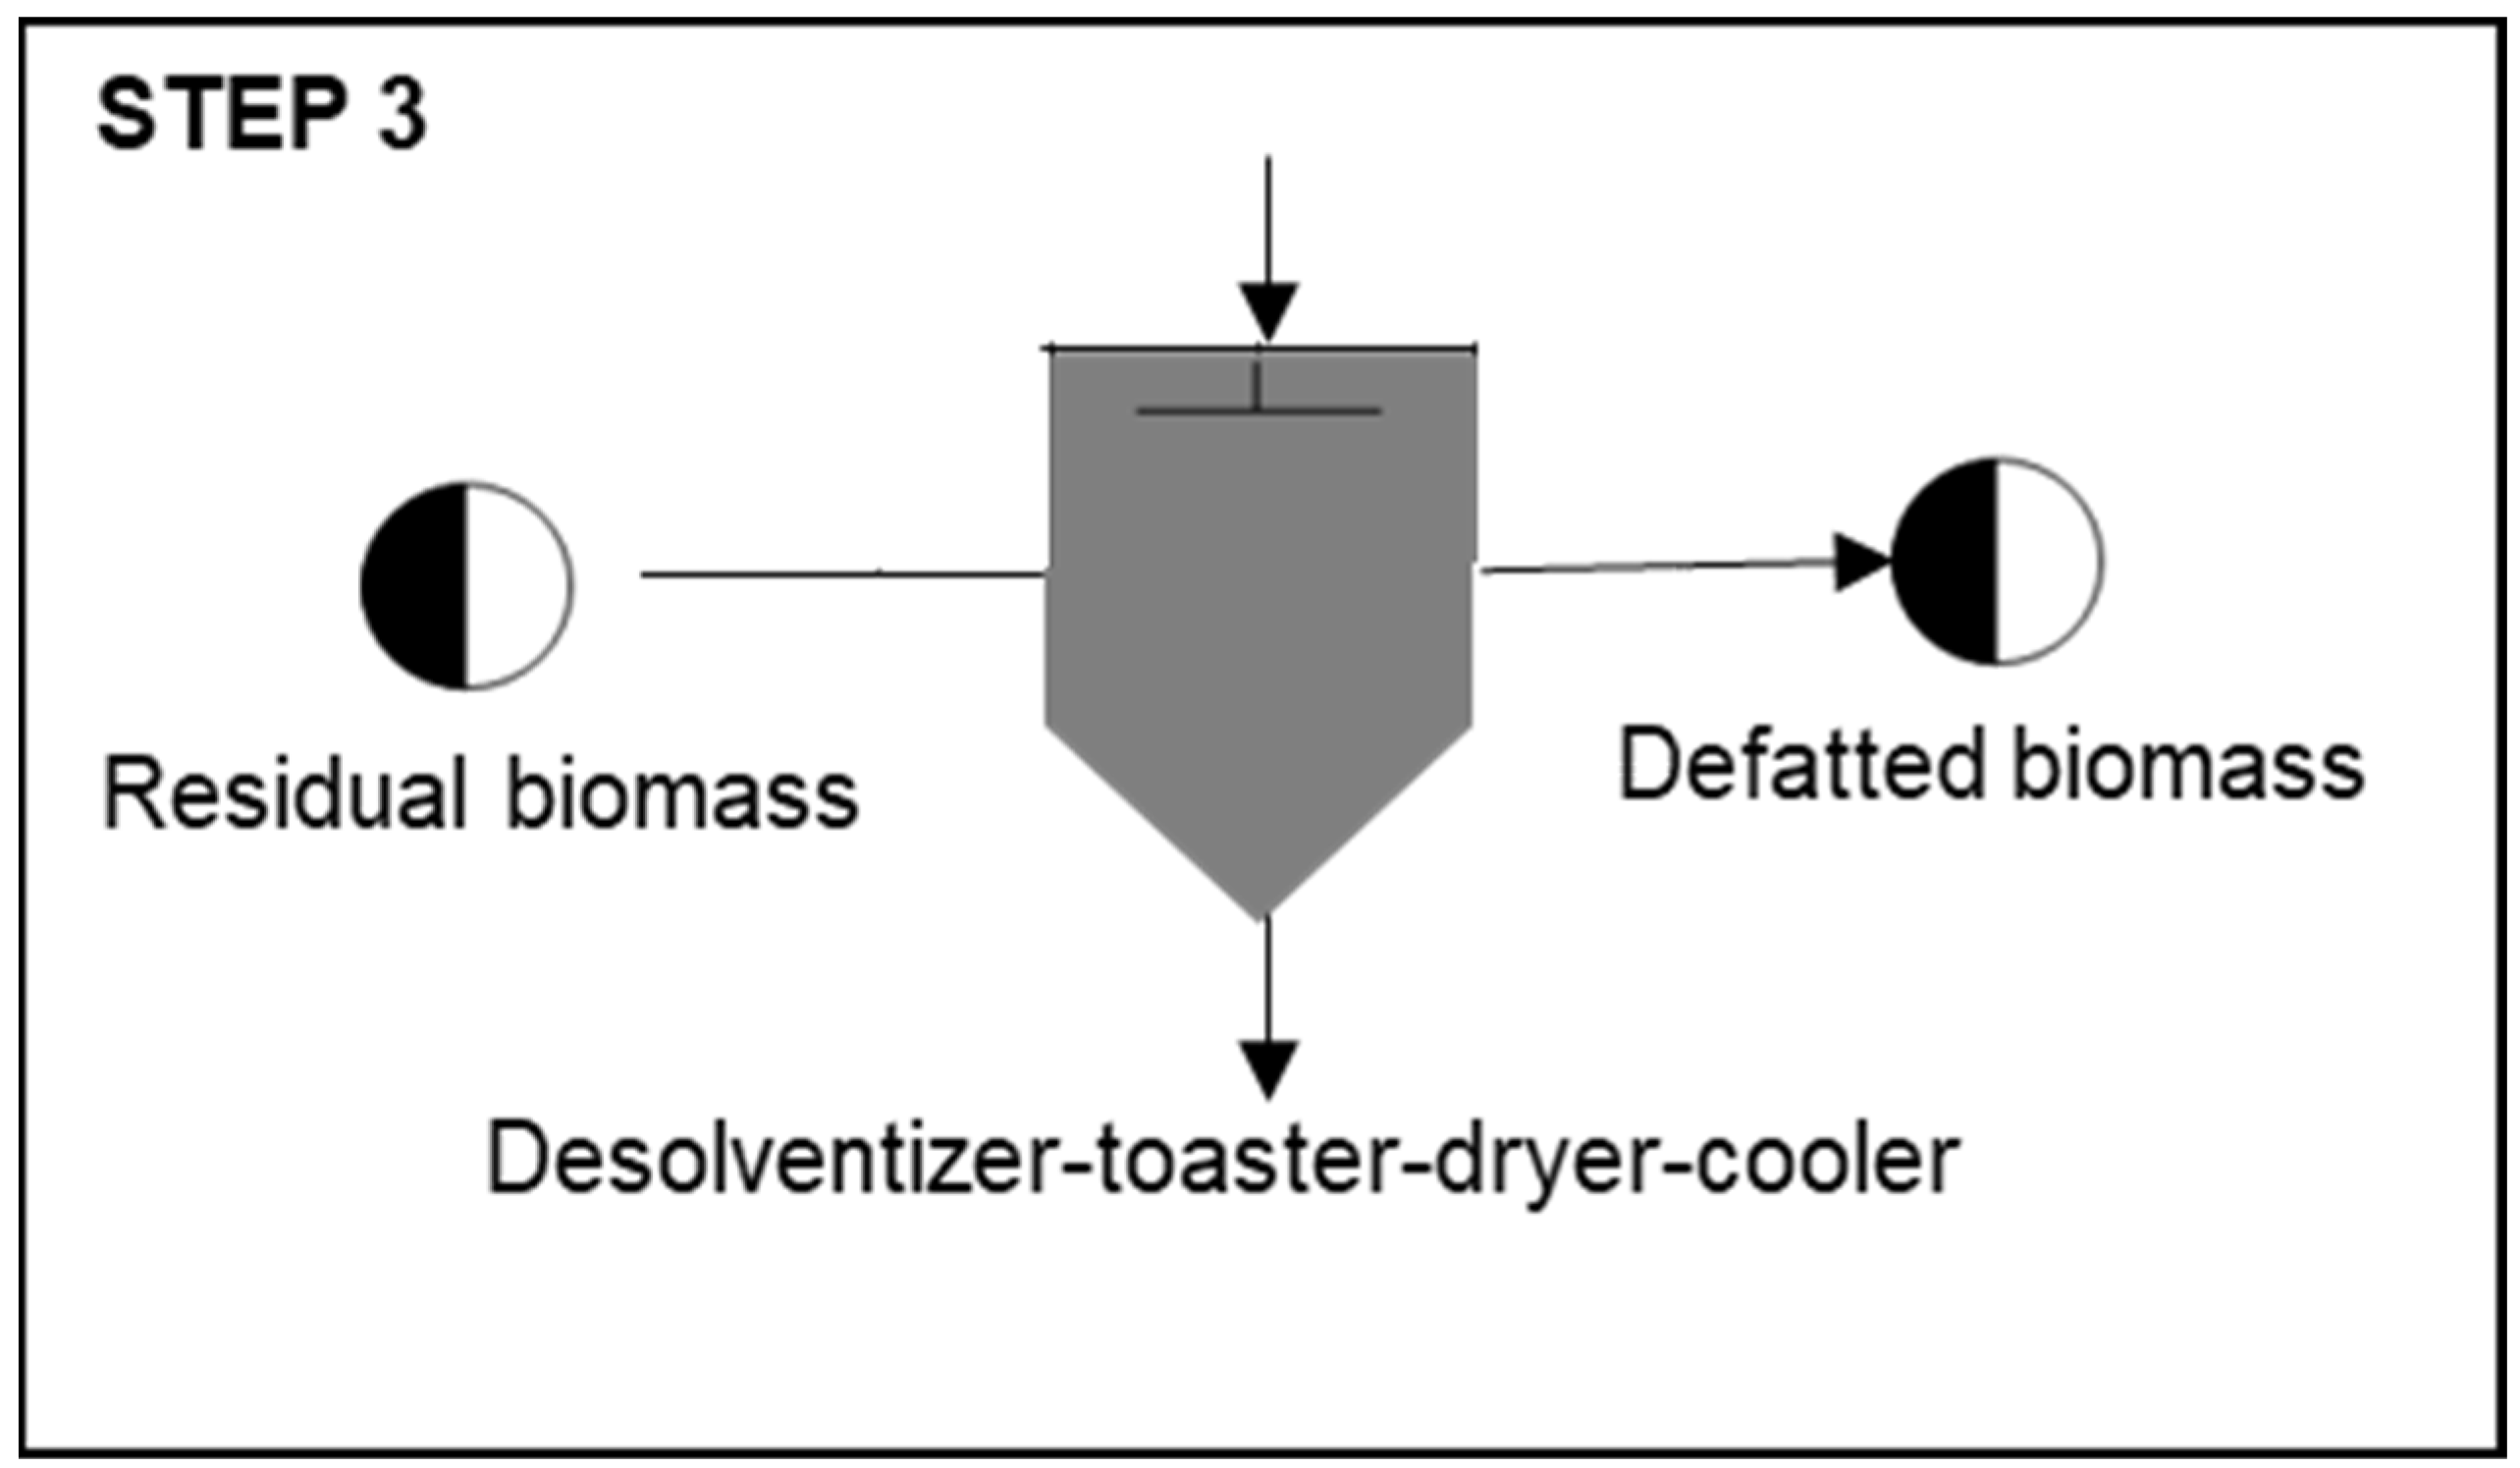
The unit operation for defatted biomass production is proposed in Step 3, according to dos Santos et al. [17] (Figure 3). This unique step consists of removing the residual solvent, in this case, the hexane, from the flours produced in the oil extraction process. Along with solvent removal, the solid protein flour obtained also goes through a roasting process that improves its nutritional characteristics. The industrial equipment is called a desolventizer-toaster-dryer-cooler (DTDC).

2.1.2. Life Cycle Inventory (LCI)

Life cycle inventory (LCI) data were obtained from the literature [22,23,24,25,26,27]. The input and output flow for each step of the process scope are shown in Table 1.

2.1.3. Life Cycle Impact Analysis (LCIA)

Potential environmental impacts were calculated according to the ReCiPe midpoint method (hierarchical approach) [28] and consistently applied accordingly with Jacob-Lopes et al. [29]. The midpoint impact categories considered were global warming (GWP), stratospheric ozone depletion (SOD), ionizing radiation (IR), ozone formation–human health (OFHH), fine particulate matter formation (FPMF), ozone formation–terrestrial ecosystems (OFTE), terrestrial acidification (TA), freshwater eutrophication (FEU), terrestrial ecotoxicity (TE), freshwater ecotoxicity (FEC), marine ecotoxicity (ME), human carcinogenic toxicity (HCT), human non-carcinogenic toxicity (HNCT), mineral resource scarcity (MRS), fossil resource scarcity (FRS), land use (LU), and water consumption (WC). The characterization factors are shown in the Supplementary Material (Table S2).

Global Warming (GWP)

The determination of global warming potential was evaluated by greenhouse gas emissions, according to Equation (1):
G W P = G W P i × m i
where GWP is the global warming potential, i is the time horizon (year), GWPi is the characterization factor for the substance i (CO2-eq), and mi is the mass of the emission substance i (kg), expressed in kg CO2-eq.

Stratospheric Ozone Depletion (SOD)

The quantification of stratospheric ozone depletion potential that corresponds to stratospheric ozone degradation due to emissions of substances that deplete the ozone layer, such as long-lasting gases containing chlorine and bromine, was estimated using Equation (2):
S O D = S O D i × m i
where SOD is the stratospheric ozone depletion potential, SODi is the characterization factor for the substance i (CFC-11-eq), and mi is the mass of the emission substance i (kg), expressed in kg CFC-11-eq.

Ionizing Radiation (IR)

The ionizing radiation potential was calculated based on radioactive discharges using Equation (3):
I R = I R i × m i
where IR is the ionizing radiation potential, IRi is the characterization factor for the substance i (Co-60-eq), and mi is the mass of the emission substance i (kBq), expressed in kBq Co-60-eq.

Ozone Formation–Human Health (OFHH)

The ozone formation–human health potential was estimated using Equation (4):
O F H H = O F H H i × m i
where OFHH is the ozone formation–terrestrial ecosystems potential, OFHHi is the characterization factor for the substance i (NOx-eq), and mi is the mass of the emission substance i (kg), expressed in kg NOx-eq.

Fine Particulate Matter Formation (FPMF)

The fine particulate matter formation potential was calculated according to Equation (5):
F P M F = F P M F i × m i
where FPMF is the fine particulate matter formation potential, FPMFi is the characterization factor for the substance i (PM2.5-eq), and mi is the mass of the emission substance i (kg), expressed in kg PM2.5-eq.

Ozone Formation–Terrestrial Ecosystems (OFTE)

The ozone formation–terrestrial ecosystems potential was estimated using Equation (6):
O F T E = O F T E i × m i
where OFTE is the ozone formation–terrestrial ecosystems potential, OFTEi is the characterization factor for the substance i (NOx-eq), and mi is the mass of the emission substance i (kg), expressed in kg NOx-eq.

Terrestrial Acidification (TA)

The terrestrial acidification potential which refers to the presence of acidifying substances such as NOx, NH3, and SOx on the terrestrial surface was calculated using Equation (7):
T A = T A i × m i
where TA is the terrestrial acidification potential, TAi is the characterization factor for the substance i (SO2-eq), and mi is the mass of the emission substance i (kg), expressed in kg SO2-eq.

Freshwater Eutrophication (FEU)

The freshwater eutrophication potential was calculated using Equation (8):
F E U = F E U i × m i
where FEU is the terrestrial acidification potential, FEUi is the characterization factor for the substance i (P-eq), and mi is the mass of the emission substance i (kg), expressed in kg P-eq.

Terrestrial Ecotoxicity (TE)

Toxic impacts affecting the terrestrial surface that are harmful to different species and that alter ecosystem structure and function were calculated using Equation (9):
T E = T E i × m i
where TE is the terrestrial acidification potential, TEi is the characterization factor for the substance i (1,4-DCB-eq), and mi is the mass of the emission substance i (kg), expressed in kg 1,4-DCB-eq.

Freshwater Ecotoxicity (FEC)

Toxic impacts affecting freshwater that are harmful to different species and that alter ecosystem structure and function were calculated according to Equation (10):
F E C = F E C i × m i
where FEC is the freshwater ecotoxicity potential, FECi is the characterization factor for the substance i (1,4-DCB-eq), and mi is the mass of the emission substance i (kg), expressed in kg 1,4-DCB-eq.

Marine Ecotoxicity (ME)

Toxic impacts affecting marine waters that are harmful to different species and that alter ecosystem structure and function were calculated using Equation (11):
M E = M E i × m i
where ME is the marine ecotoxicity potential, MEi is the characterization factor for the substance i (1,4-DCB-eq), and mi is the mass of the emission substance i (kg), expressed in kg 1,4-DCB-eq.

Human Carcinogenic Toxicity (HCT)

Toxic impacts affecting human health by absorption of toxic substances by inhalation of air, ingestion of food or water, or penetration through the skin insofar as they are related to cancer were measured using Equation (12):
H C T = H C T i × m i
where HCT is the human carcinogenic toxicity potential, HCTi is the characterization factor for the substance i (1,4-DCB-eq), and mi is the mass of the emission substance i (kg), expressed in kg 1,4-DCB-eq.

Human Non-Carcinogenic Toxicity (HNCT)

Toxic impacts affecting human health by absorption of toxic substances by inhalation of air, ingestion of food or water, or penetration through the skin unrelated to cancer were measured using Equation (13):
H N C T = H N C T i × m i
where HNCT is the human non-carcinogenic toxicity potential, HNCTi is the characterization factor for the substance i (1,4-DCB-eq), and mi is the mass of the emission substance i (kg), expressed in kg 1,4-DCB-eq.

Mineral Resource Scarcity (MRS)

The mineral resource scarcity potential that references the consumption of materials extracted from nature, such as metals and rocks, was calculated using Equation (14):
M R S = M R S i × m i
where MRS is the mineral resource scarcity potential, MRSi is the characterization factor for the substance i (Cu-eq), and mi is the mass of the emission substance i (kg), expressed in kg Cu-eq.

Fossil Resource Scarcity (FRS)

The fossil resource scarcity potential that refers to the use of fuels from petroleum, coal or non-renewable natural gas was calculated according to Equation (15):
F R S = F R S i × m i
where FRS is the fossil resource scarcity potential, FRSi is the characterization factor for the substance i (oil-eq), and mi is the mass of the emission substance i (kg), expressed in kg oil-eq.

Land Use (LU)

The land use impact that considers the effects of land use, the extent of the surface involved and the duration of its occupation was estimated using Equation (16):
L U = C F × E i
where LU is the land use impact, CF is the characterization factor, and Ei is the emission inventory, being expressed in m2a crop-eq.

Water Consumption (WC)

Water consumption was used to measure the amount of water resources consumed. The detailed calculation model is provided by Equation (17):
W C = C F × E i
where WC is the water consumption, CF is the characterization factor, and Ei is the emission inventory, being expressed in m3.

2.1.4. Interpretation of Results

The LCI and LCIA results of the life cycle assessment of the products from the Dunaliella salina biorefinery are considered together so that the information is interpreted and converged in the form of conclusions and recommendations. The results are discussed according to the values characterized by midpoint impact categories, in order to enhance possible comparisons with other studies found in the literature. The values characterized for the environmental impacts of each microalgae bioproduct considered in this study can be consulted in the Supplementary Material (Table S3).

3. Results and Discussion

3.1. Environmental Sustainability Analysis of the Microalgae Biorefinery

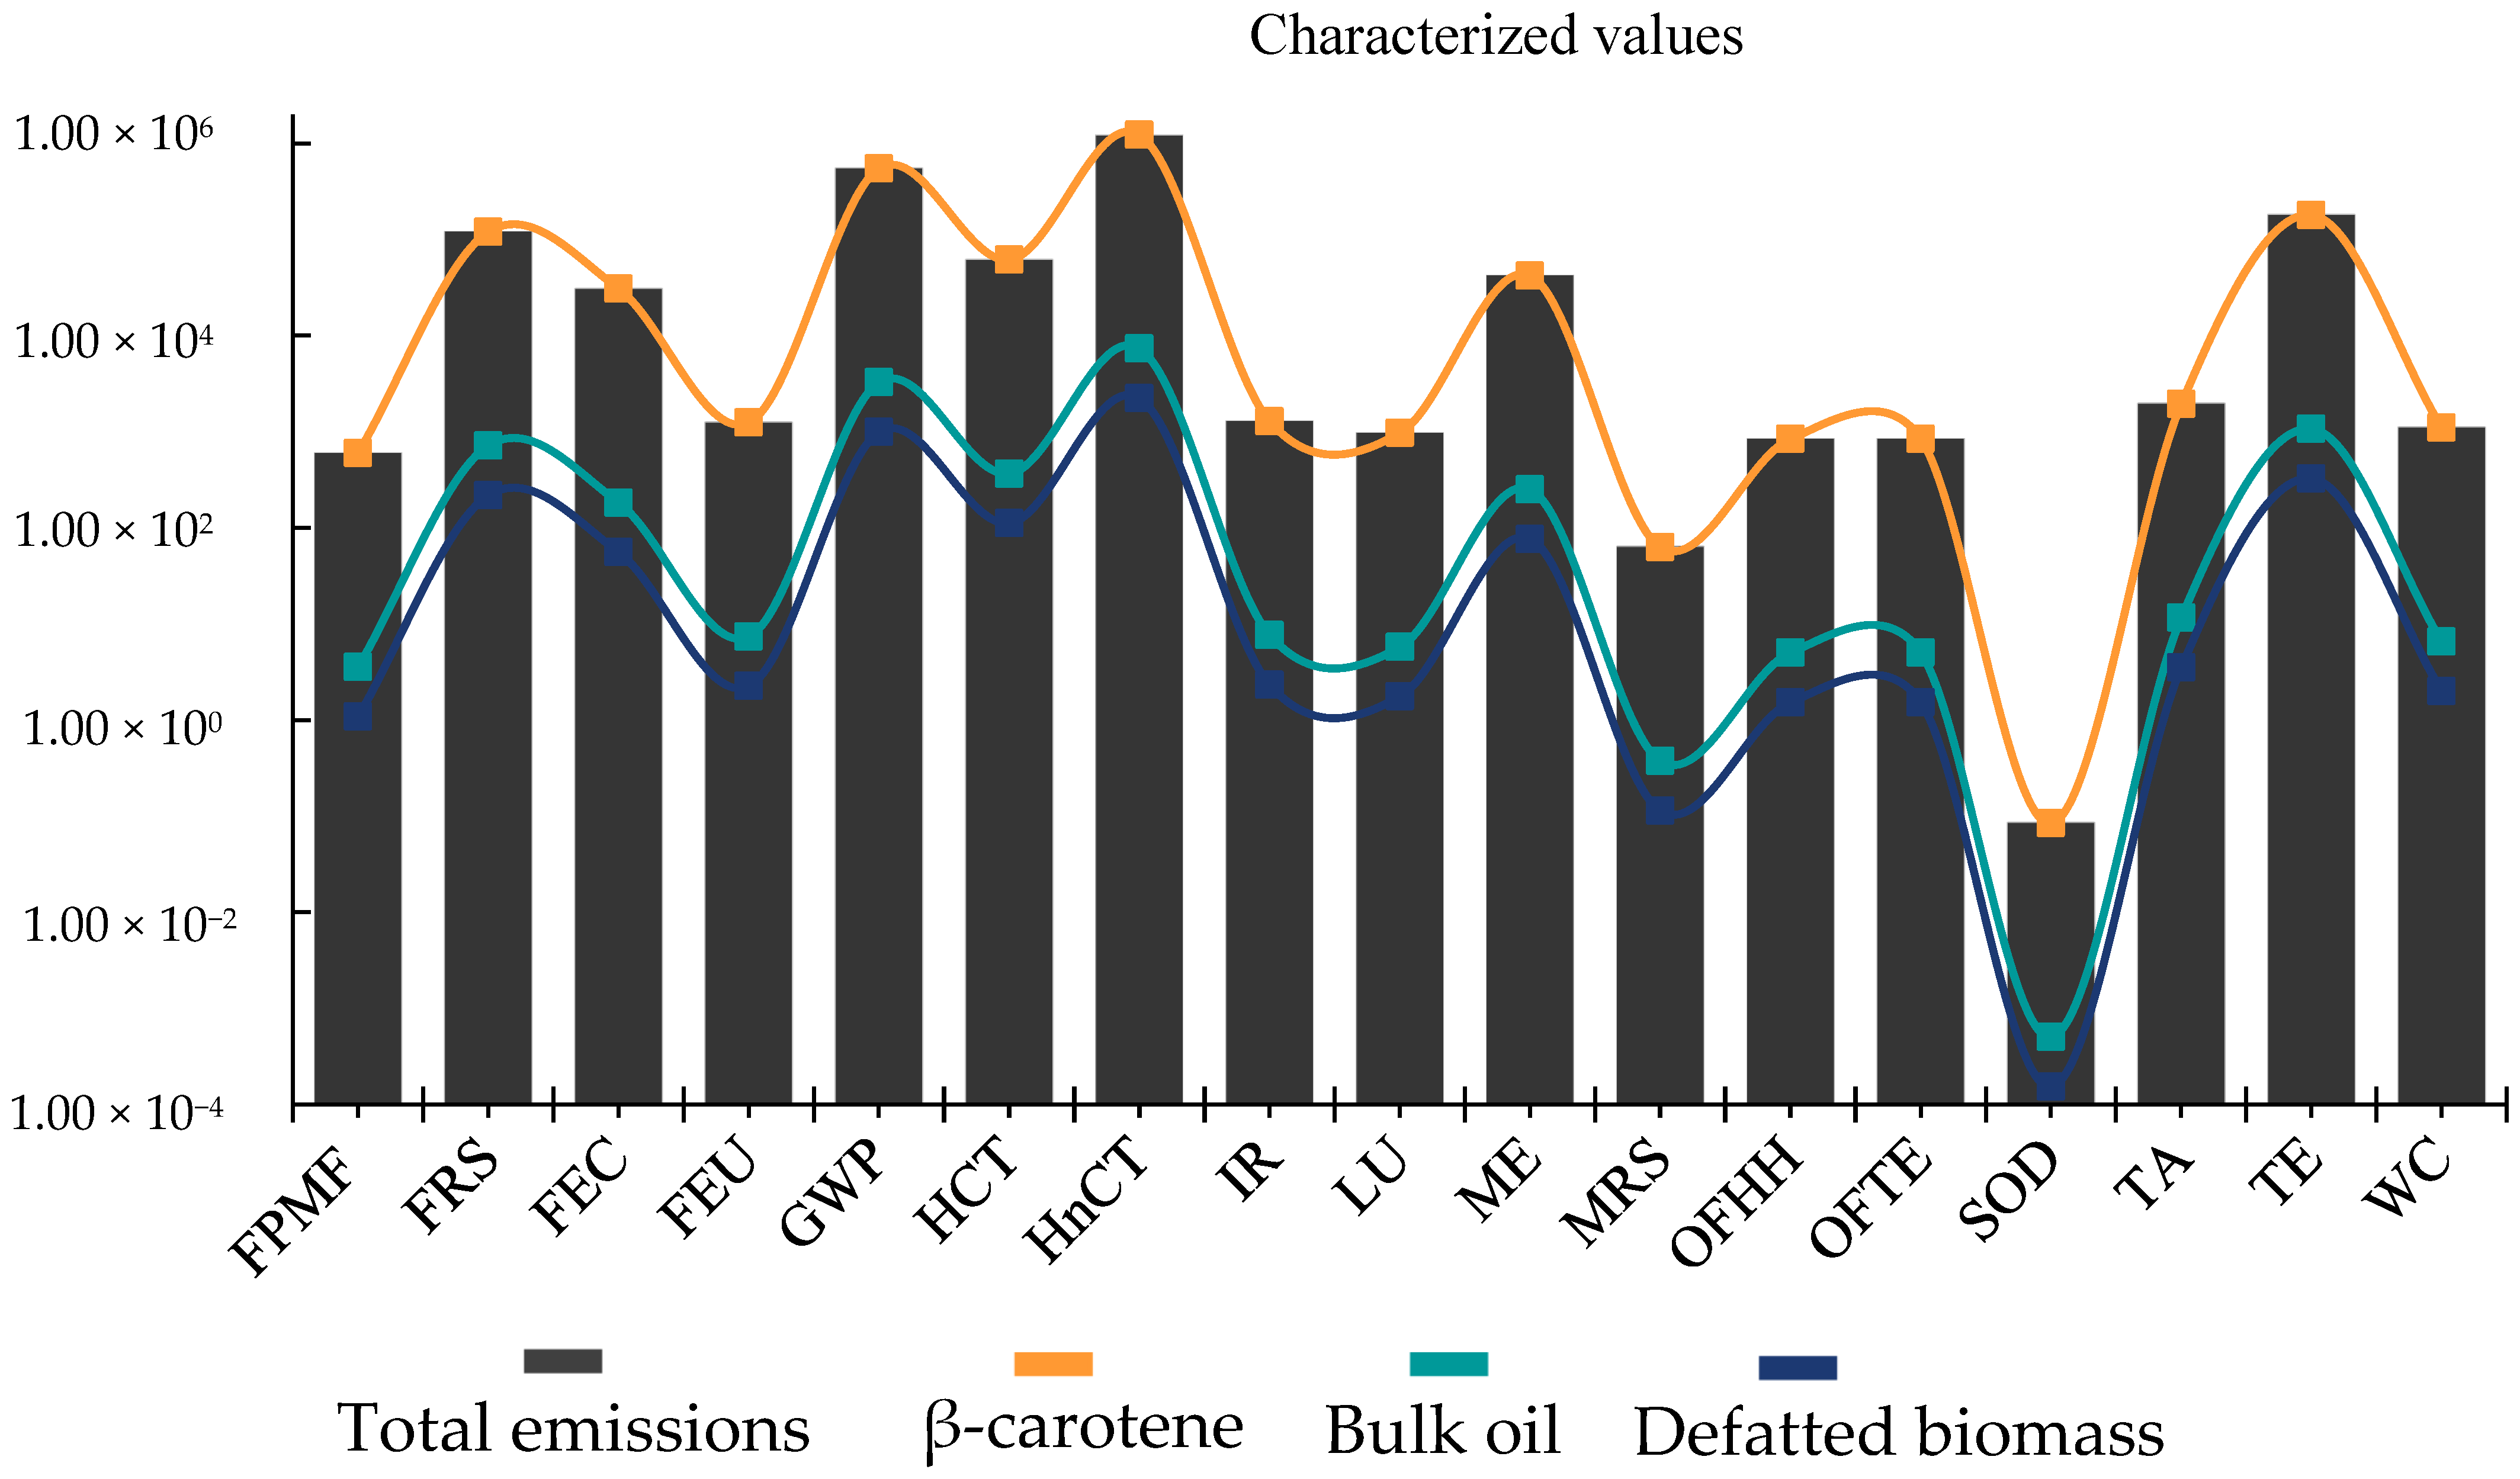
Biorefinery is a strategy that facilitates the circular bioeconomy, which assumes great relevance by maximizing revenue and minimizing waste. This biorefinery concept applied to microalgae biomass is an opportunity to improve the use of biomass that, following the cascade principle, has prioritized the production of high-value products before low-value ones. In the state of the art, although many studies have reported the use of microalgae biomass within a biorefinery structure, few have pored over the holistic assessment of the environmental profile. Therefore, here, we evaluate the metrics of seventeen environmental sustainability indicators for the biorefinery of Dunaliella salina (Figure 4). The characterized values of the environmental impacts can also be consulted in Supplementary Material (Table S2).
The production of 1 ton of β-carotene, 1.51 tons of bulk oil, and 2.34 tons of defatted biomass of the Dunaliella salina species in the raceway pond showed total emissions of around 6.04 × 10² kg PM2.5-eq for FPMF, 1.21 × 10⁵ kg oil-eq for FRS, 3.09 × 10⁴ kg 1,4-DCB-eq for FEC, 1.25 × 10³ kg P-eq for FEU, 5.53 × 10⁵ kg CO2-eq for GWP, 6.20 × 10⁴ kg 1,4-DBC-eq for HCT, 1.24 × 10⁶ kg 1,4-DBC-eq for HnCT, 1.30 × 10³ kBq Co-60-eq for IR, 9.78 × 10² m2a crop-eq for LU, 4.25 × 10⁴ kg 1,4-DBC-eq for ME, 6.35 × 101 kg Cu-eq for MRS, 8.50 × 10² kg NOx-eq for OFHH, 8.50 × 10² kg NOx-eq for OFTE, 8.55 × 10⁻² kg CFC11-eq for SOD, 1.97 × 10³ kg SO2-eq for TA, 1.82 × 10⁵ kg 1,4-DCB-eq for TE, 1.11 × 10³ m3 for WC. As can be seen, the midpoint impact categories of HnCT, followed by the category of FRS, TE, and GWP are the most influential midpoints. SOD followed by the MRS category exhibited, in contrast, the lowest impact among all midpoints in the lifecycle of the biorefinery of Dunaliella salina. Also, as can be seen, the environmental profile of the biorefinery of Dunaliella salina showed significant variations in impact magnitude, which ranged from 6.35 × 101 kg Cu-eq for MRS to 1.24 × 10⁶ kg 1,4-DBC-eq for HnCT.
According to the results, the contributions of the cultivation step, harvesting, drying, pigment extraction, bulk oil, and defatted biomass to the midpoint impact categories were about 94.73%, 0.37%, 2.66%, 1.47%, 0.59%, and 0.18%, respectively. As for the cultivation step, which contributes most of the environmental impact in the life cycle of the biorefinery of Dunaliella salina, when comparing the inventory of the energy demand of cultivation in raceway pond and tubular photobioreactor, it should be noted that cultivation in raceway pond consumes much less energy, thus contributing to the mitigation of pollutant emissions [8].
Comparatively, studies evaluating the environmental profile of producing 1 ton of Arthrospira platensis tablets showed impacts of 7.71 × 10⁵ kg CO2-eq for GWP, 1.32 × 10⁻³ kg CFC11-eq for SOD, 9.63 × 101 kg SO2-eq for TA and 2.16 × 101 kg P-eq for FEU [30]. When verifying these results, it is possible to state that in terms of GWP, our study presented a 30% reduction in emissions; however, the other categories had higher emissions. In contrast, when analyzing a scenario of trade-offs, the revenue value of biomass presents just 8000 USD/ton, while β-carotene is valued at 790,000 USD/ton. Considering the environmental impacts and revenues of a single product, biomass represents only 1% of return and, therefore, to balance the viability of the process, it would be necessary to produce 99 process cycles to break even the profits. In this way, the impacts of this biotechnological route and the process costs would increase, making the process unfeasible.
When assessing the environmental profile of a high-added-value product such as photosynthetic pigments, studies report that for the GWP, SOD, TA, and FEU categories the environmental burdens were 2.8 × 10⁶ and 1.17 × 10⁶, 6.28 × 10⁴ and 2.64 × 10⁴, 1.49 × 10⁴ and 6.23 × 10³, and 5.34 × 10³ and 2.24 × 10³ for astaxanthin and phycocyanin from Haematococcus pluvialis and Arthrospira platensis, respectively [6]. These values are higher for the GWP and SOD impact categories, but the TA and FEU categories are slightly similar to the results found in this study. This difference can be attributed to a greater requirement of process steps required for pigment production, such as astaxanthin, which requires the system to present two cultivation stages: tubular photobioreactors and raceway ponds, making the process more emissive. However, even if astaxanthin sales prices (~2500 USD/kg) are higher than β-carotene, the environmental pillar balance should be achieved to make the process sustainable.
In addition, as shown, the residual products: bulk oil and defatted biomass do not contribute significantly to emissions in the life cycle of the biorefinery of Dunaliella salina. It is also to be inferred that they do not contribute significantly to the cost and energy demand, thus confirming the paradigm of doing more with less, both in environmental and economic terms. Furthermore, it is worth emphasizing that if these products were produced individually without valorization of waste biomass, they would generate a greater environmental and economic impact.
Additionally, when compared to conventional sources, it is worth mentioning that the oil recovery step of Dunaliella salina is about 10 times more electricity intensive than the soybean oil recovery. Evidently, this represents a huge environmental burden when it comes to overcoming the death valley of the production of bulk oil for fuel purposes, for example. The electricity footprint of microalgae-based processes nearly dooms the mission; but, if considering the expense with fuel in the soy oil recovery, the magnitude of the environmental impact is equivalent. This assertion is legitimized by the data presented by Chen et al. [31].
Furthermore, it is interesting to note that soybean oil recovery is not electricity-intensive but is fuel intensive. Fuel consumption in the oil recovery process from Dunaliella salina is, in turn, null. In this sense, when considering the soybean oil recovery inventory, we see that it is not better in pollutant emissions. And when we include the energy expenditure of soybean farming in the oil recovery inventory, the lifecycle emissions are about 1.5 times more significant compared to oil recovery from Dunaliella salina. This excludes the energy demand of the unit operations proposed in step 1 (β-carotene production).
Finally, although the microalgae biorefinery concept is powerful, it can be concluded that, despite the microalgae are a unique feedstock, there are technological knots that need to be untied to create a “utopian” system, and not trying to improve the degree of environmental sustainability will make the biorefinery concept applied to microalgae more and more dystopian. The eco-smart substitution of coal-based electricity in microalgae biorefineries can help overcome the environmental deficit presented by projects that are not satisfactory with the environmental impact objectives. Furthermore, it is not news that the ongoing energy transition takes center stage, and not adhering to it could mean falling into a dead end.

3.2. Transposing the Environmental Deficit in Microalgae Biorefinery

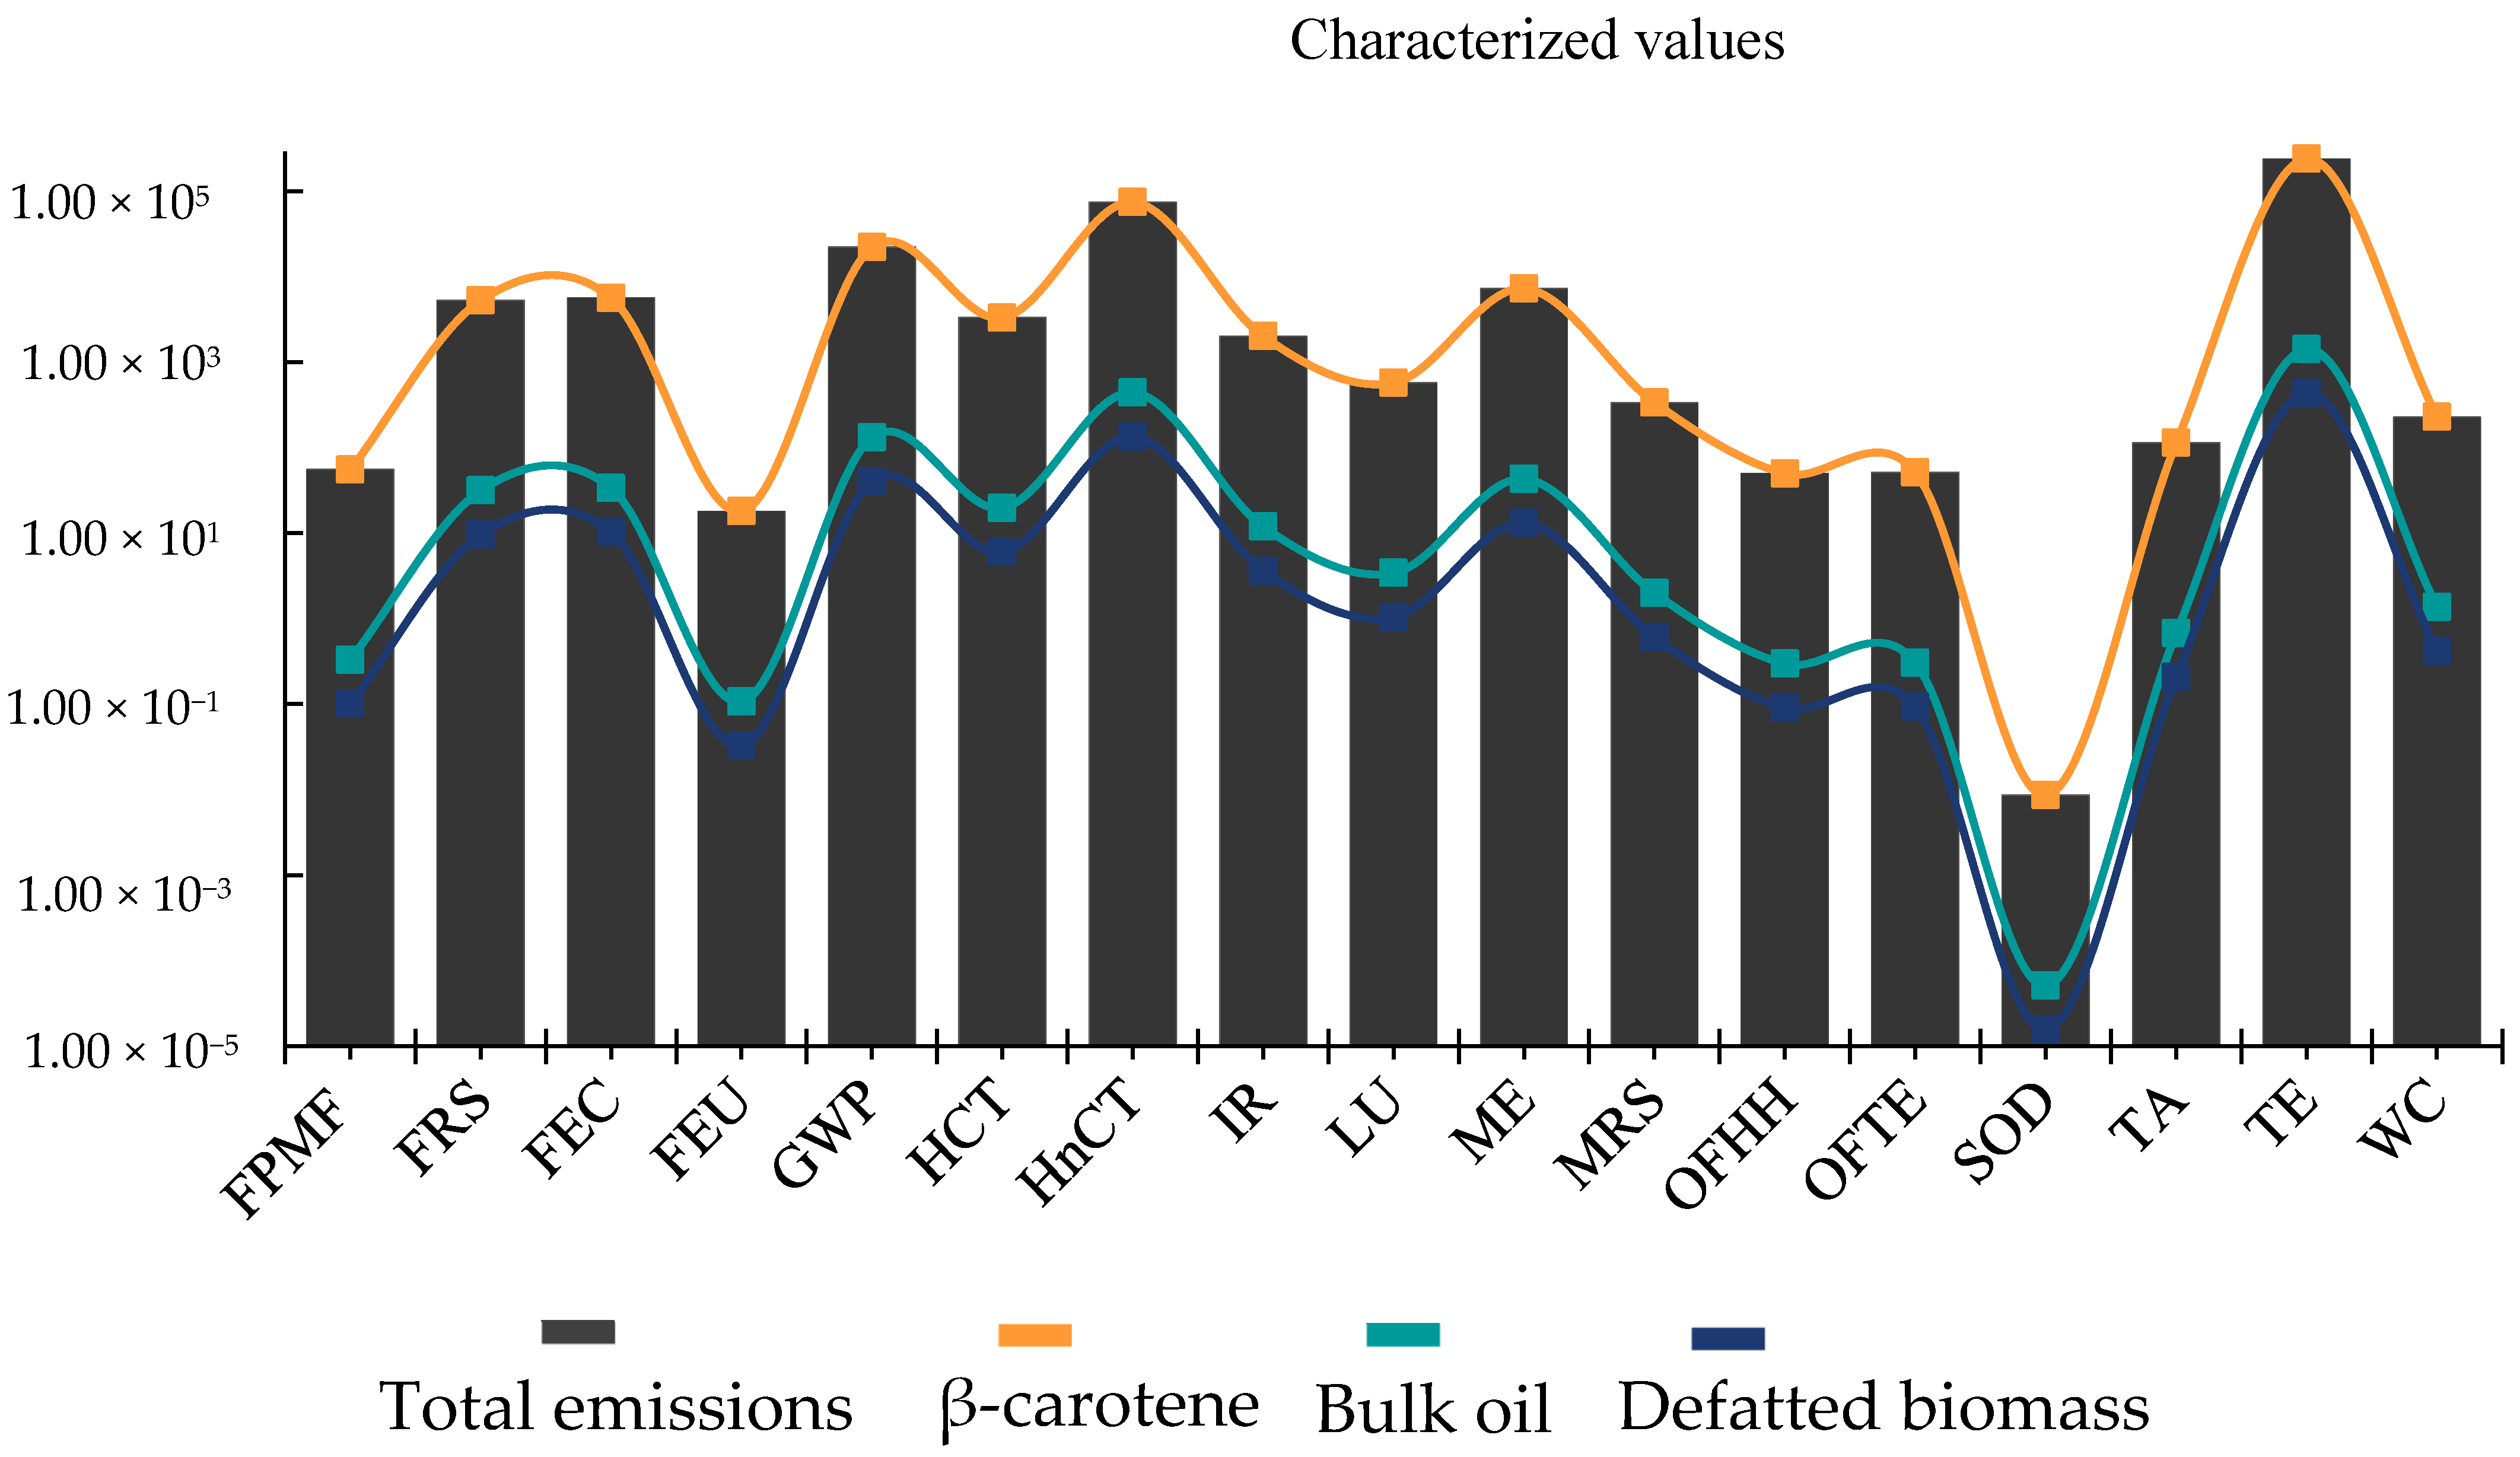
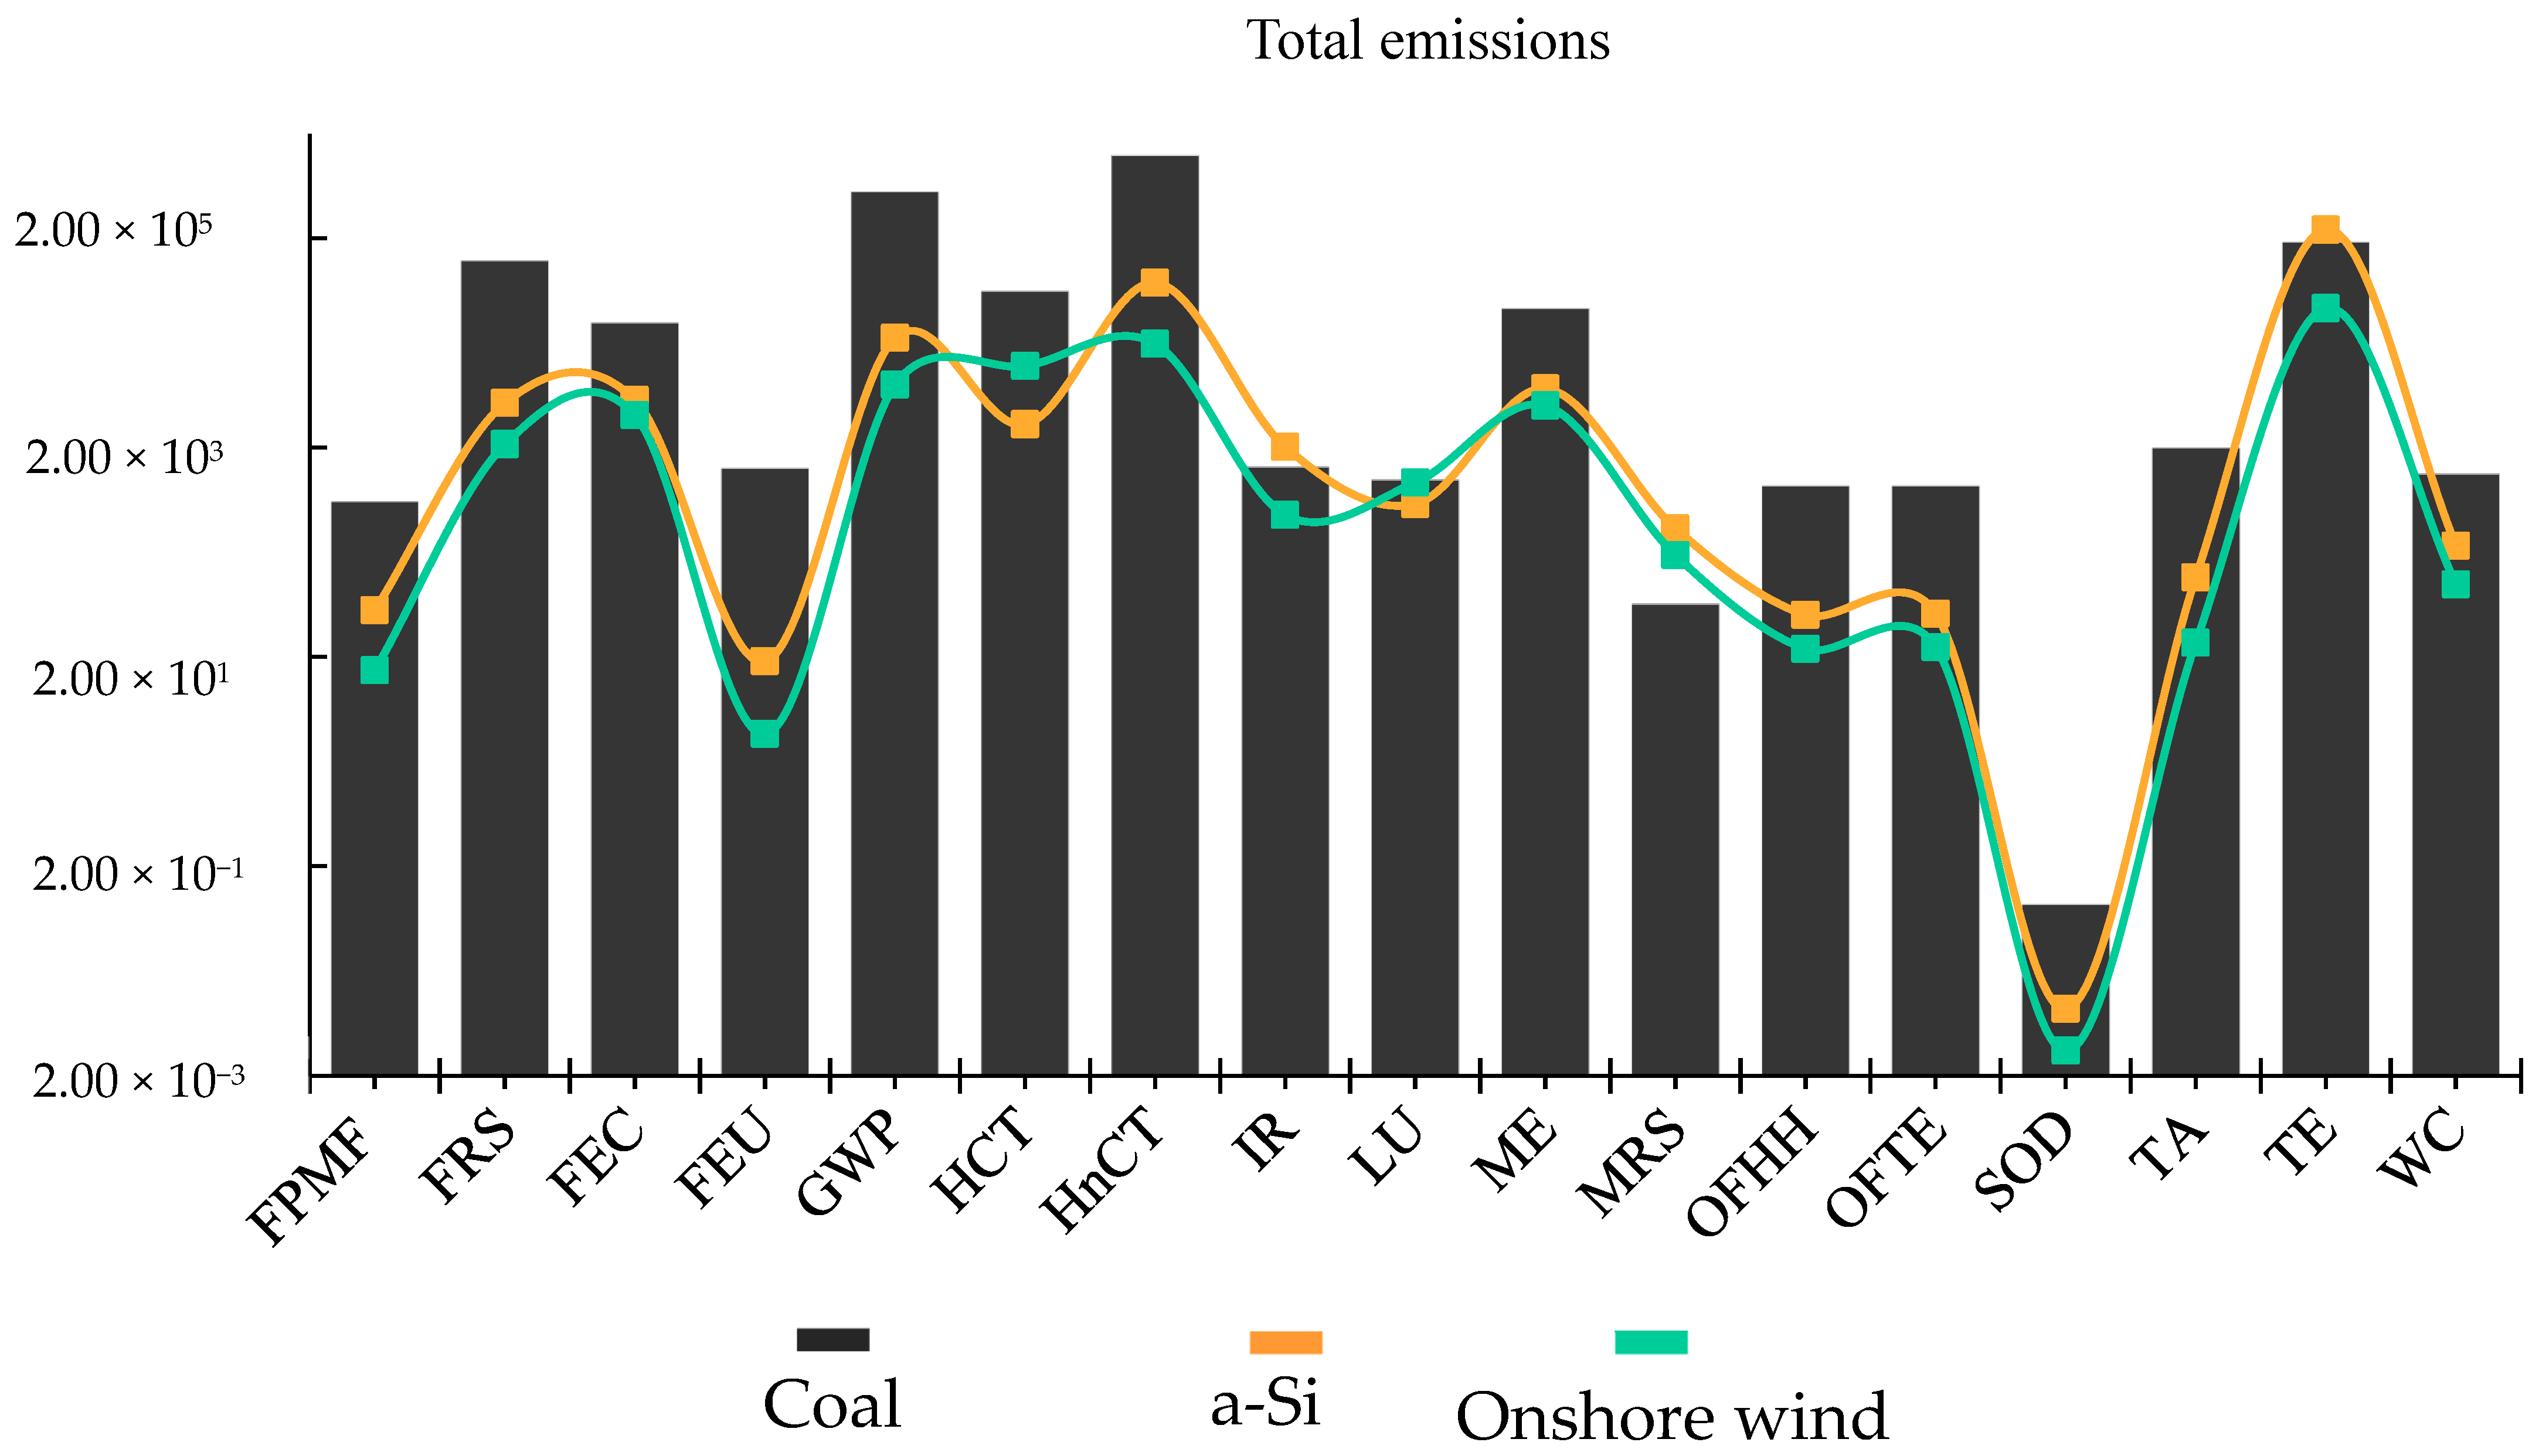
The transition from coal-based electricity to clean and renewable sources is not a zero-sum game for the environment. It is actually the “golden thread” that can allow climate conditions to remain hospitable. Therefore, measuring the impact of the transition from high-emission electricity to low-emission sources in biorefineries based on microalgae is part of the puzzle to make them environmentally benign. Figure 5 and Figure 6 show the values characterized for the environmental impact associated with the biorefinery of Dunaliella salina, which has its unit operations powered by photovoltaic and wind energy, respectively. Figure 7 is a comparison of the total environmental impact of the biorefinery of Dunaliella salina when powered by coal-based, photovoltaic, and wind electricity.
As can be seen in Figure 5 and Figure 7, the replacement from coal-based electricity to photovoltaics contributes to reducing lifecycle emissions from the biorefinery of Dunaliella salina in 14 of the 17 midpoint impact categories. In the categories of FPMF, FRS, FEC, FEU, GWP, HCT, HnCT, OFHH, OFTE, SOsD, TA, ME, and WC the environmental impacts are one to two orders of magnitude smaller. The environmental impact associated with LU, TE, and IR, in turn, are in the same order of magnitude, and only for MRS the magnitude of the impact is greater, and, therefore, their differences are not within the uncertainty of the predicted impact.
In contrast, the use of wind electricity in the unit operations of the microalgae biorefinery when compared to the use of coal-based and photovoltaic electricity carries the lowest environmental impact in 16 and 15 of the 17 midpoint categories, respectively. Considering the use of wind energy, the impacts associated with HCT and LU are of the same magnitude as for the use of fossil energy; however, the impact in the HCT category is an order of magnitude greater than for the use of photovoltaic energy. And in the MRS category, although it is within the same order of magnitude as the use of photovoltaic energy, it is an order of magnitude greater than the use of fossil energy. In sum, as can be seen in Figure 7, under an overview of the results, the electricity source that most contribute to reducing the environmental burden in microalgae-based biorefineries is wind, followed by photovoltaics. Additionally, from these results, it is clear that replacing the electrical matrix in a microalgae biorefinery is a sure-shot target. It also cannot be neglected that renewable energy is becoming as cheap as fossil energy and it is possible that they will take control of electricity generation in the world [32].
Finally, it is important to mention that many microalgae-based products languish in the research and development phase because there is a path full of problematic obstacles. However, even with their early potential weakened after setbacks, many microalgae products remain a tempting biobased solution, with some stakeholders still chasing them. The biorefinery following the principles of a circular bioeconomy has supported the long road ahead of low-value microalgae products. But, unless companies, researchers, industry, and government demonstrate their ingenuity and collaboration, microalgae biotechnology will continue to be a game played by those who can afford it and tolerate the high risks.

4. Conclusions

Our study highlighted that the valorization of bio-wastes from a biotechnological high-value route, such as the production of β-carotene, resulted in secondary bioproducts with a small if not almost negligible, collection of ecological footprint, cost, and energy demand, under the guise of a microalgae-based biorefinery. In addition, among our findings, the switching from coal-based electricity to renewable energy contributed to reducing lifecycle emissions from the biorefinery from Dunaliella salina. In addition, it was possible to verify that the source of electricity that most contribute to reducing the environmental load in microalgae-based biorefineries is wind power. Thus, we underscore that the transition from coal-based to renewable electricity is the backbone for conducting climate-neutral operations. The answers found in this study allow us to understand that the concept of biorefinery applied to microalgae capacitate circular production systems, and that the use of eco-friendly energy makes them more emission-efficient.

Supplementary Materials

The following supporting information can be downloaded at: https://www.mdpi.com/article/10.3390/su151511494/s1, Table S1: Overview of potential applications and market estimation of microalgae-based bioproducts [33]; Table S2: Characterization factors of the environmental impacts for onshore wind, photovoltaic from amorphous silicon solar cells (a-Si), and coal-based fossil energy [16,18]; Table S3: Characterized values of the environmental impact associated with the biorefinery from Dunaliella salina.

Author Contributions

R.R.D.: Conceptualization, Methodology, Data curation, Writing—original draft. M.C.D.: Methodology, Data curation. C.R.d.M.: Funding acquisition. L.Q.Z.: Supervision, Funding acquisition. E.J.-L.: Conceptualization, Project administration, Writing—review and editing. All authors have read and agreed to the published version of the manuscript.

Funding

This research was supported by the National Council for Scientific and Technological Development—Brazil (CNPq), and the Coordination for the Improvement of Higher Education Personnel—Brazil (CAPES)—Finance Code 001.

Institutional Review Board Statement

Not applicable.

Informed Consent Statement

Not applicable.

Data Availability Statement

The datasets used and analyzed during the current study are available from the corresponding author upon reasonable request.

Acknowledgments

The authors would like to thank the National Council for Scientific and Technological Development—Brazil (CNPq), and the Coordination for the Improvement of Higher Education Personnel—Brazil (CAPES).

Conflicts of Interest

The authors declare that they have no known competing financial interests or personal relationships that could have appeared to influence the work reported in this paper.

References

  1. Steffen, W.; Richardson, K.; Rockström, J.; Cornell, S.E.; Fetzer, I.; Bennett, E.M.; Biggs, R.; Carpenter, S.R.; De Vries, W.; De Wit, C.A.; et al. Planetary boundaries: Guiding human development on a changing planet. Science 2015, 347, 1259855. [Google Scholar] [CrossRef] [PubMed] [Green Version]
  2. Persson, L.; Carney Almroth, B.M.; Collins, C.D.; Cornell, S.; de Wit, C.A.; Diamond, M.L.; Fantke, P.; Hassellöv, M.; MacLeod, M.; Ryberg, M.W.; et al. Outside the safe operating space of the planetary boundary for novel entities. Environ. Sci. Technol. 2022, 56, 1510–1521. [Google Scholar] [CrossRef] [PubMed]
  3. Palahi, M.; Adams, J. Why the world needs a ‘circular bioeconomy’—For jobs, biodiversity and prosperity. In World Economic Forum; World Economic Forum: Cologny, Switzerland, 2020. [Google Scholar]
  4. Tan, E.C.; Lamers, P. Circular bioeconomy concepts—A perspective. Front. Sustain. 2021, 2, 701509. [Google Scholar] [CrossRef]
  5. Premaratne, M.; Nishshanka, G.K.S.H.; Anthonio, R.A.D.P.; Liyanaarachchi, V.C.; Thevarajah, B.; Nimarshana, P.H.V.; Malik, A.; Ariyadasa, T.U. Resource recovery from waste streams for production of microalgae biomass: A sustainable approach towards high-value biorefineries. Bioresour. Technol. Rep. 2022, 18, 101070. [Google Scholar] [CrossRef]
  6. Deprá, M.C.; Severo, I.A.; dos Santos, A.M.; Zepka, L.Q.; Jacob-Lopes, E. Environmental impacts on commercial microalgae-based products: Sustainability metrics and indicators. Algal Res. 2020, 51, 102056. [Google Scholar] [CrossRef]
  7. Calijuri, M.L.; Silva, T.A.; Magalhães, I.B.; de Paula Pereira, A.S.A.; Marangon, B.B.; de Assis, L.R.; Lorentz, J.F. Bioproducts from microalgae biomass: Technology, sustainability, challenges and opportunities. Chemosphere 2022, 305, 135508. [Google Scholar] [CrossRef]
  8. Liyanaarachchi, V.C.; Premaratne, M.; Ariyadasa, T.U.; Nimarshana, P.H.V.; Malik, A. Two-stage cultivation of microalgae for production of high-value compounds and biofuels: A review. Algal Res. 2021, 57, 102353. [Google Scholar] [CrossRef]
  9. Ruiz, J.; Wijffels, R.H.; Dominguez, M.; Barbosa, M.J. Heterotrophic vs. autotrophic production of microalgae: Bringing some light into the everlasting cost controversy. Algal Res. 2022, 64, 102698. [Google Scholar] [CrossRef]
  10. Borowitzka, M.A. Energy from microalgae: A short history. In Algae for Biofuels and Energy; Springer: Berlin/Heidelberg, Germany, 2012; pp. 1–15. [Google Scholar]
  11. Ubando, A.T.; Felix, C.B.; Chen, W.H. Biorefineries in circular bioeconomy: A comprehensive review. Bioresour. Technol. 2020, 299, 122585. [Google Scholar] [CrossRef]
  12. Dias, R.R.; Deprá, M.C.; Zepka, L.Q.; Jacob-Lopes, E. Roadmap to net-zero carbon emissions in commercial microalgae-based products: Environmental sustainability and carbon offset costs. J. Appl. Phycol. 2022, 34, 1255–1268. [Google Scholar] [CrossRef]
  13. ISO-14040; Environmental Management–Life Cycle Assessment–Principles and Framework. International Organization for Standardization: Geneva, Switzerland, 2006.
  14. Xi, Y.; Bian, J.; Luo, G.; Kong, F.; Chi, Z. Enhanced β-carotene production in Dunaliella salina under relative high flashing light. Algal Res. 2022, 67, 102857. [Google Scholar] [CrossRef]
  15. de Souza Celente, G.; Rizzetti, T.M.; Sui, Y.; de Souza Schneider, R.D.C. Potential use of microalga Dunaliella salina for bioproducts with industrial relevance. Biomass Bioenergy 2022, 167, 106647. [Google Scholar] [CrossRef]
  16. Milousi, M.; Souliotis, M.; Arampatzis, G.; Papaefthimiou, S. Evaluating the environmental performance of solar energy systems through a combined life cycle assessment and cost analysis. Sustainability 2019, 11, 2539. [Google Scholar] [CrossRef] [Green Version]
  17. dos Santos, A.M.; Deprá, M.C.; dos Santos, A.M.; Cichoski, A.J.; Zepka, L.Q.; Jacob-Lopes, E. Sustainability metrics on microalgae-based wastewater treatment system. Desalin. Water Treat. 2020, 185, 51–61. [Google Scholar] [CrossRef]
  18. Hosseini, S.M.; Kanagaraj, N.; Sadeghi, S.; Yousefi, H. Midpoint and endpoint impacts of electricity generation by renewable and nonrenewable technologies: A case study of Alberta, Canada. Renew. Energy 2022, 197, 22–39. [Google Scholar] [CrossRef]
  19. Maroneze, M.M.; Dias, R.R.; Severo, I.A.; Queiroz, M.I. Microalgae-Based Processes for Pigments Production. In Pigments from Microalgae Handbook; Springer: Berlin/Heidelberg, Germany, 2020; pp. 241–264. [Google Scholar]
  20. Deprá, M.C.; dos Santos, A.M.; Jacob-Lopes, E. Sustainability metrics in the microalgae-based pigments production: A life cycle assessment approach. In Pigments from Microalgae Handbook; Springer: Berlin/Heidelberg, Germany, 2020; pp. 363–390. [Google Scholar]
  21. Peralta-Ruiz, Y.; González-Delgado, A.D.; Kafarov, V. Evaluation of alternatives for microalgae oil extraction based on exergy analysis. Appl. Energy 2013, 101, 226–236. [Google Scholar] [CrossRef]
  22. Lardon, L.; Hélias, A.; Sialve, B.; Steyer, J.P.; Bernard, O. Life-cycle assessment of biodiesel production from microalgae. Environ. Sci. Technol. 2009, 43, 6475–6481. [Google Scholar] [CrossRef] [Green Version]
  23. Martinez-Guerra, E.; Gude, V.G. Energy aspects of microalgal biodiesel production. Aims Energy 2016, 4, 347–362. [Google Scholar] [CrossRef]
  24. Corrêa, P.S.; Morais Júnior, W.G.; Martins, A.A.; Caetano, N.S.; Mata, T.M. Microalgae biomolecules: Extraction, separation and purification methods. Processes 2020, 9, 10. [Google Scholar] [CrossRef]
  25. Patel, S.; Kannan, D.C. A method of wet algal lipid recovery for biofuel production. Algal Res. 2021, 55, 102237. [Google Scholar] [CrossRef]
  26. Valdovinos-García, E.M.; Bravo-Sánchez, M.G.; Olán-Acosta, M.D.L.Á.; Barajas-Fernández, J.; Guzmán-López, A.; Petriz-Prieto, M.A. Technoeconomic Evaluation of Microalgae Oil Production: Effect of Cell Disruption Method. Fermentation 2022, 8, 301. [Google Scholar] [CrossRef]
  27. Chalermthai, B.; Giwa, A.; Moheimani, N.; Taher, H. Techno-economic strategies for improving economic viability of β-carotene extraction using natural oil and supercritical solvent: A comparative assessment. Algal Res. 2022, 68, 102875. [Google Scholar] [CrossRef]
  28. Huijbregts, M.A.; Steinmann, Z.J.; Elshout, P.M.; Stam, G.; Verones, F.; Vieira, M.; Zijp, M.; Hollander, A.; Van Zelm, R. ReCiPe2016: A harmonised life cycle impact assessment method at midpoint and endpoint level. Int. J. Life Cycle Assess. 2017, 22, 138–147. [Google Scholar] [CrossRef]
  29. Jacob-Lopes, E.; Zepka, L.Q.; Deprá, M.C. Sustainability Indicators and Metrics of Environmental Impact: Industrial and Agricultural Life Cycle Assessment, 1st ed.; Elsevier: Amsterdam, The Netherlands, 2021. [Google Scholar]
  30. Ye, C.; Mu, D.; Horowitz, N.; Xue, Z.; Chen, J.; Xue, M.; Zhou, W. Life cycle assessment of industrial scale production of spirulina tablets. Algal Res. 2018, 34, 154–163. [Google Scholar] [CrossRef]
  31. Chen, R.; Qin, Z.; Han, J.; Wang, M.; Taheripour, F.; Tyner, W.; O’Connor, D.; Duffield, J. Life cycle energy and greenhouse gas emission effects of biodiesel in the United States with induced land use change impacts. Bioresour. Technol. 2018, 251, 249–258. [Google Scholar] [CrossRef]
  32. Roser, M. Why Did Renewables Become So Cheap So Fast? and What Can We Do to Use This Global Opportunity for Green Growth; Our World in Data: Oxford, UK, 2020. [Google Scholar]
  33. Mordor Intelligence. Algae Products Market Size & Share Analysis—Growth Trends & Forecasts (2023–2028). 2023. Available online: https://www.mordorintelligence.com/ (accessed on 1 July 2023).
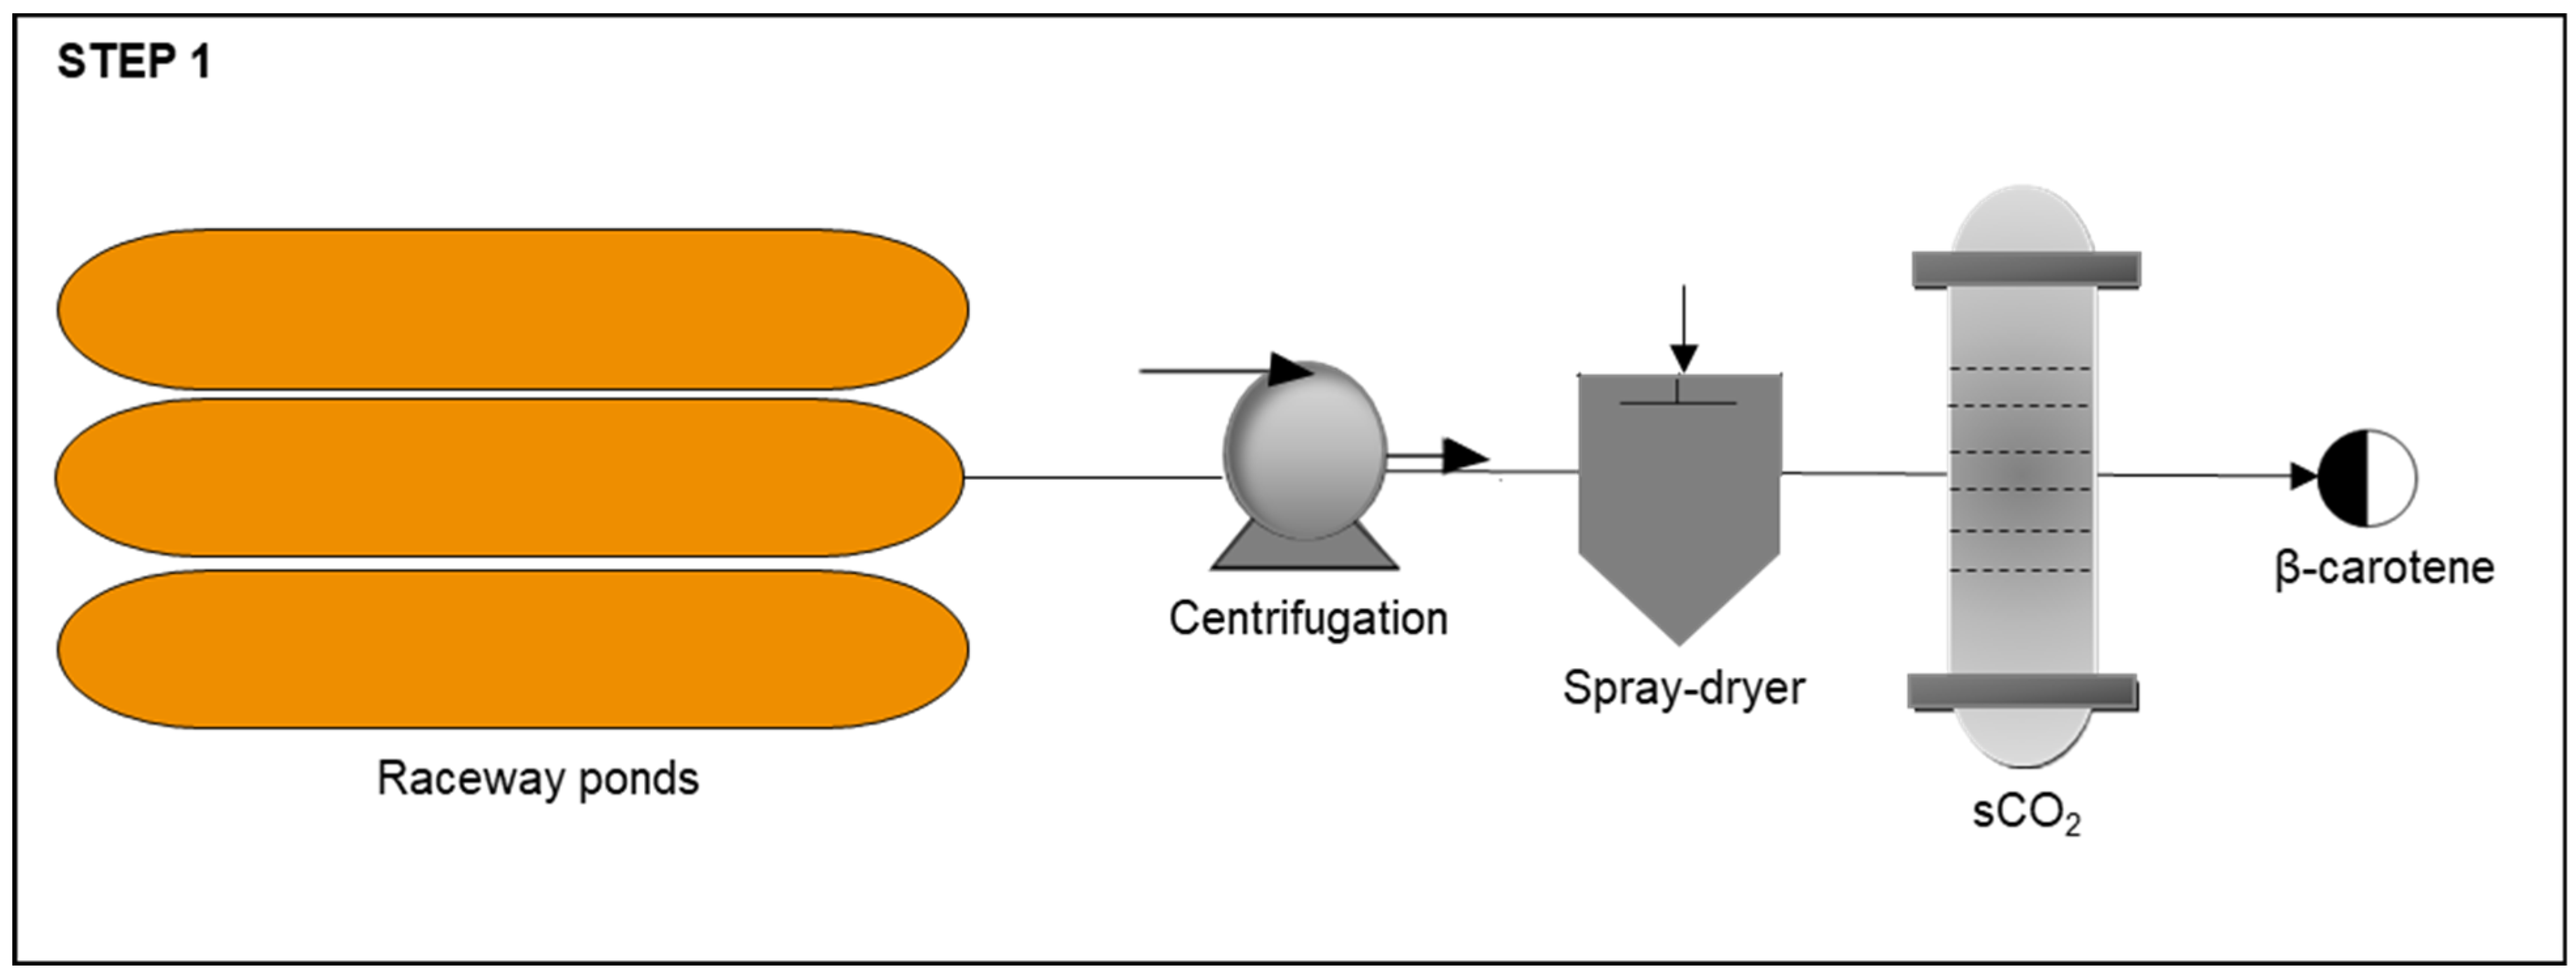
Figure 1. Process flow diagram of the commercial production of β-carotene from Dunaliella salina.
Sustainability 15 11494 g001
Figure 2. Flow diagram of the bulk oil production process from Dunaliella salina.
Sustainability 15 11494 g002
Figure 3. Flow diagram of the defatted biomass production process from Dunaliella salina.
Sustainability 15 11494 g003
Figure 4. Characterized values of the environmental impact associated with the biorefinery from Dunaliella salina. Note: Bioprocesses powered by coal-based energy.
Sustainability 15 11494 g004
Figure 5. Characterized values of the environmental impact associated with the biorefinery from Dunaliella salina. Note: Bioprocesses powered by photovoltaic energy from amorphous silicon solar cells (a-Si).
Sustainability 15 11494 g005
Figure 6. Characterized values of the environmental impact associated with the biorefinery from Dunaliella salina. Note: Bioprocesses powered by onshore wind energy.
Sustainability 15 11494 g006
Figure 7. Characterized values of the total environmental impact associated with the biorefinery from Dunaliella salina. Note: Bioprocesses driven by different sources of electrical energy.
Sustainability 15 11494 g007
Table 1. Elementary flows for each step of the process scope.
ProcessUnitBase Case
Cultivation
Raceway pondm363.16
Electric energy for paddle wheelkWh270,122.68
Electric energy for water pumpingkWh50,022.72
Electric energy for CO2 injectionkWh165,074.97
Water evaporationm38.21
Biomass productivityton/m3/year0.15
Output
Algae liquidton50.03
Harvest
Input
Energy consumption centrifugationkWh1894.80
Drying
Input
Wet biomasston12.50
Spray-dryerkWh13,632.25
Output
Dry biomasston9.38
Pigment extraction
Input
Dry biomasston9.38
sCO2kWh7504.0
Output
β-carotene pigmentton1.0
Bulk oil production
Input
Residual biomasston8.38
ExtractorkWh594.51
Energy consumption centrifugationkWh875.24
Solvent recuperationkWh1037.72
Evaporation/StripperkWh194.13
DesolventizerkWh328.21
Output
Bulk oilton1.51
Defatted biomass production
Residual biomasston6.71
Desolventizer-toaster-dryer-coolerkWh922.73
Defatted biomasston2.34
Total electric energy requirementkWh/year512,203.96
Acronyms: sCO2, Supercritical CO2 extraction.
Disclaimer/Publisher’s Note: The statements, opinions and data contained in all publications are solely those of the individual author(s) and contributor(s) and not of MDPI and/or the editor(s). MDPI and/or the editor(s) disclaim responsibility for any injury to people or property resulting from any ideas, methods, instructions or products referred to in the content.