Article

The Design and Performance Prediction Model of an Integrated Scheme of a Membrane Bioreactor and Anaerobic Digester for the Treatment of Domestic Wastewater and Biowaste

Unit of Environmental Science & Technology, School of Chemical Engineering, National Technical University of Athens, Zographou Campus, 9 Iroon Polytechniou Str., GR-15780 Athens, Greece
*
Author to whom correspondence should be addressed.
Sustainability 2023, 15(14), 11455; https://doi.org/10.3390/su151411455
Submission received: 27 June 2023 / Revised: 21 July 2023 / Accepted: 22 July 2023 / Published: 24 July 2023
(This article belongs to the Special Issue Environmental Analysis of Water Pollution and Water Treatment)

Abstract

:
An innovative and integrated scheme that encompasses two well-established waste treatment technologies, the aerobic biological degradation of organic matter bioprocess via membranes and anaerobic digestion, was demonstrated as a zero-waste approach that may effectively treat wastewater and biowaste in an integrated and symbiotic manner. Aiming to create a tool for the design, monitoring, and control of the scheme, prediction models were developed, validated, and implemented for the process simulation of the integrated scheme. The minimization of selected objective functions led to the estimation of the models’ parameters. The activated sludge model no. 1 (ASM1) was adopted for the simulation of the aerobic membrane bioreactor. The kinetic parameters were calibrated using volatile suspended solids and total nitrogen as the objective functions permitting the model to simulate the bioprocess satisfactorily (Nash–Sutcliffe efficiency > 0.86) and to calculate the concentration of the active biomass. The predominance of heterotrophic bacteria (4300 to 9770 mg COD/L) over autotrophic biomass (508 to 1422 mg COD/L) was showcased. For the anaerobic process unit, a simplified anaerobic digestion model 1 ADM1-R4 was used, and the first-order hydrolysis constants (kch 0.41 d−1, kpr 0.25 d−1, kli 0.09 d−1) and microbial decay rate (kdec 0.02 d−1) were evaluated, enabling an accurate prediction of biogas production rates. A full-scale implementation of the integrated scheme was conducted for a decentralized waste treatment plant in a small community. Preliminary design calculations were performed in order to estimate the values related to certain process and technical parameters. The performance of this full-scale plant was simulated by the developed model, presenting clear benefits for practical applications in waste treatment plants.

1. Introduction

Within the UN’s Sustainable Development Goals, environmental sustainability via waste treatment is a high priority. Additional pressure for sustainable waste and wastewater management via holistic and balanced approaches is posed by the increase in the Earth’s population, by intensive urbanization and global warming effects. Therefore, the adoption of integrated treatment schemes that meet environmental, safety, and cost standards at the same time are being sought. For his reason, integrated waste treatment schemes are more than essential [1].
The combination of aerobic and anaerobic bioprocesses is an auspicious approach. In this context, a holistic approach for the co-treatment of domestic wastewater and solid biowaste has been demonstrated on a pilot scale, including an aerobic membrane bioreactor (MBR) and an anaerobic digester (AD) combining the advantages of aerobic and anaerobic conditions in an integrated approach. Therefore, rapid aerobic biomass formation followed by anaerobic high-yield and zero-growth production is realized. This way, bioprocesses operating with an substantial overall yield and productivity can be obtained [2]. Moreover, such an integrated system that includes an MBR unit may benefit from the high quality and be free of suspended solids effluent. Via this integration, there are no residues to be treated further since the excess aerobic sludge is anaerobically co-digested and the liquid fraction of digestate is aerobically degraded. This “zero”-waste concept managed to showcase a high treatment efficiency, recovering energy, and materials. More specifically, it is suitable for small-to-medium-scale regions where an integrated solution for the treatment of biowaste and wastewater is required in order to fulfil (a) the landfill directive requirements for the diversion of biodegradable waste from landfills, (b) the water framework directive for the achievement of good-quality water resources, and (c) the renewable energy directive for the promotion of attaining electricity from renewable energy sources. This innovative system constitutes a promising solution for insular and/or isolated communities or units (e.g., hotels) since it provides an enhanced method for wastewater, sewage sludge, and biowaste treatment leading to (a) sustainable energy production by biogas combustion, to cover local electricity and thermal demands; (b) clean water supply for agricultural purposes; and (c) stabilized solid organic matter, which can be exploited as a potential fuel source or as organic fertilizer for land application. The replicability and upscaling of the proposed technologies highlight the need for the development of tools able to simulate the performance of the systems and optimize their efficiency. In this context, such models are necessary not only to simulate the performance of the processes, but also to assess the potential and the boundaries of the technological scheme. These models can bridge the gap between technological innovation and full-scale exploitation while supporting adopters and decision makers.
The most well-known mathematical representation of the bioprocesses for removing organic matter and ammonia is the activated sludge model 1 (ASM1), which was released by the IAWQ Task Group and has found numerous applications in the design, monitoring, and operation of wastewater treatment plants. The aim of this model is to mathematically describe the bioprocesses occurring in wastewater treatment schemes: the hydrolysis of organic compounds, aerobic growth and decay of autotrophs and heterotrophs, anoxic growth of heterotrophs, and ammonification of organic nitrogen. This well-established model was modified for aerobic membrane reactors by Baek et al. [3] and adopted in this study.
Similarly, for anaerobic digestion, the anaerobic digestion model 1 (ADM1) is proposed [4]. This model includes the main degradation paths and the respective kinetics, as well as the involved physico-chemical equilibria. ADM1 is applied to numerous substrates and anaerobic process configurations, and is successfully validated [5,6]. Nevertheless, model-based state observers and control techniques are scarcely utilized, despite the fact that the mathematical simulation and monitoring of AD processes have long been studied and used [7]. A common issue that arises is the lack of experimental data for the calibration of the model [8]. This reveals the need for less complicated simulation structures that can be easily used in industrial AD applications. One well-established simplified model is ADM1-R4 that combines the biodegradation of substrates and subsequent production of biogas in first-order sum reactions. The latter is adopted in the present study.
More specifically, in this study, a mathematical model simulating the performance of the integrated scheme, including an aerobic membrane-based process and anaerobic digestion, is developed based on raw experimental data collected from an integrated MBR-AD pilot system installed in the facilities of Ergates industrial area (Nicosia, Cyprus). These raw data have been previously published by the authors [9,10]. This tool identifies the main physico-chemical and biological processes for both aerobic and anaerobic bioprocess, determines the kinetic parameters for the biochemical processes, and evaluates the efficiency of the model developed via a comparison of the experimental results of the pilot plant with the values that are simulated from the model over a wide range of operating conditions. A full-scale implementation of the integrated scheme is conducted for a decentralized waste treatment plant in a small community. Preliminary design calculations are performed in order to the estimate values related to certain process and technical parameters. The performance of this full-scale plant is simulated by the developed model.

2. Materials and Methods

2.1. Integrated System

The design and operation of the integrated MBR-AD system was described in detail in previous studies [9,10]. The pilot plant was located within the facilities of Ergates industrial area (Nicosia, Cyprus). Briefly, it consisted of 4 process units (Figure 1):
  • An MBR treating the effluent of a primary settling tank of domestic wastewater from the wastewater treatment plant of Anthoupolis in Nicosia, Cyprus (primary effluent) and the liquid fraction of the digestate of an AD unit (liquid digestate).
  • An AD unit treating biodegradable organic waste and sewage sludge from the MBR.
  • A biogas treatment line for its purification and valorization via a cogeneration heat and power engine.
  • A digestate treatment system, where its separation into liquid and solid fractions occurred. The solid digestate was led to a solar dryer, whereas the liquid one was recirculated to both bioprocesses as dilution water.
MBR of a 6 m3 volume was composed of 3 compartments: anoxic, aerobic, and sedimentation, each one of a 2 m3 volume (working volume 1.5 m3). The polyethersulfone membrane module (siClaro FM 06) was submerged into the aerobic compartment. The pore size of the membranes was 0.1 μm with a 6.25 m2 surface area. The excess sludge was removed after sedimentation and fed to the anerobic unit (unit II). The AD unit included a 5.4 m3 anaerobic completely stirred reactor (CSTR) with a temperature control.
The integrated system operated continuously for a long period (nearly 400 d) seeking to test the system’s performance. Table 1 presents the MBR operational conditions where different substrates, solid retention times (SRTs) and hydraulic retention times (HRTs), were tested. In all stages, the oxygen concentration was controlled to 2 mg/L. The term “stage” was used for the MBR and the term “phase” for the AD unit.
The MBR was tested under different HRT and SRT conditions to achieve the greatest removal of nitrogen and organic matter from the primary effluent and the liquid fraction of the digestate that were fed into it. In the 1st and 2nd stages, the volumetric nitrogen loading rate (NLR) was kept low at 0.04 kgN/m3d. The introduction of liquid digestate increased the NLR to 0.05–0.06 kgN/m3d. The decrease in HRT in the 4th stage further increased the NLR to 0.11 kgN/m3d. The MBR system was operated for SRTs of 20, 30, and 40 days, with the main difference between the 4 SRTs being the amount of excess sludge removed from the bioreactor. The system solids’ residence times under consideration are typical for MBR systems. Through a literature review, SRTs longer than 60 days (60–100 days) were also considered and observed in several pilot MBR systems [11]. However, the application of such long SRTs was not considered to be of practical importance, mainly due to the diffusion problems of DO in bioflocs.
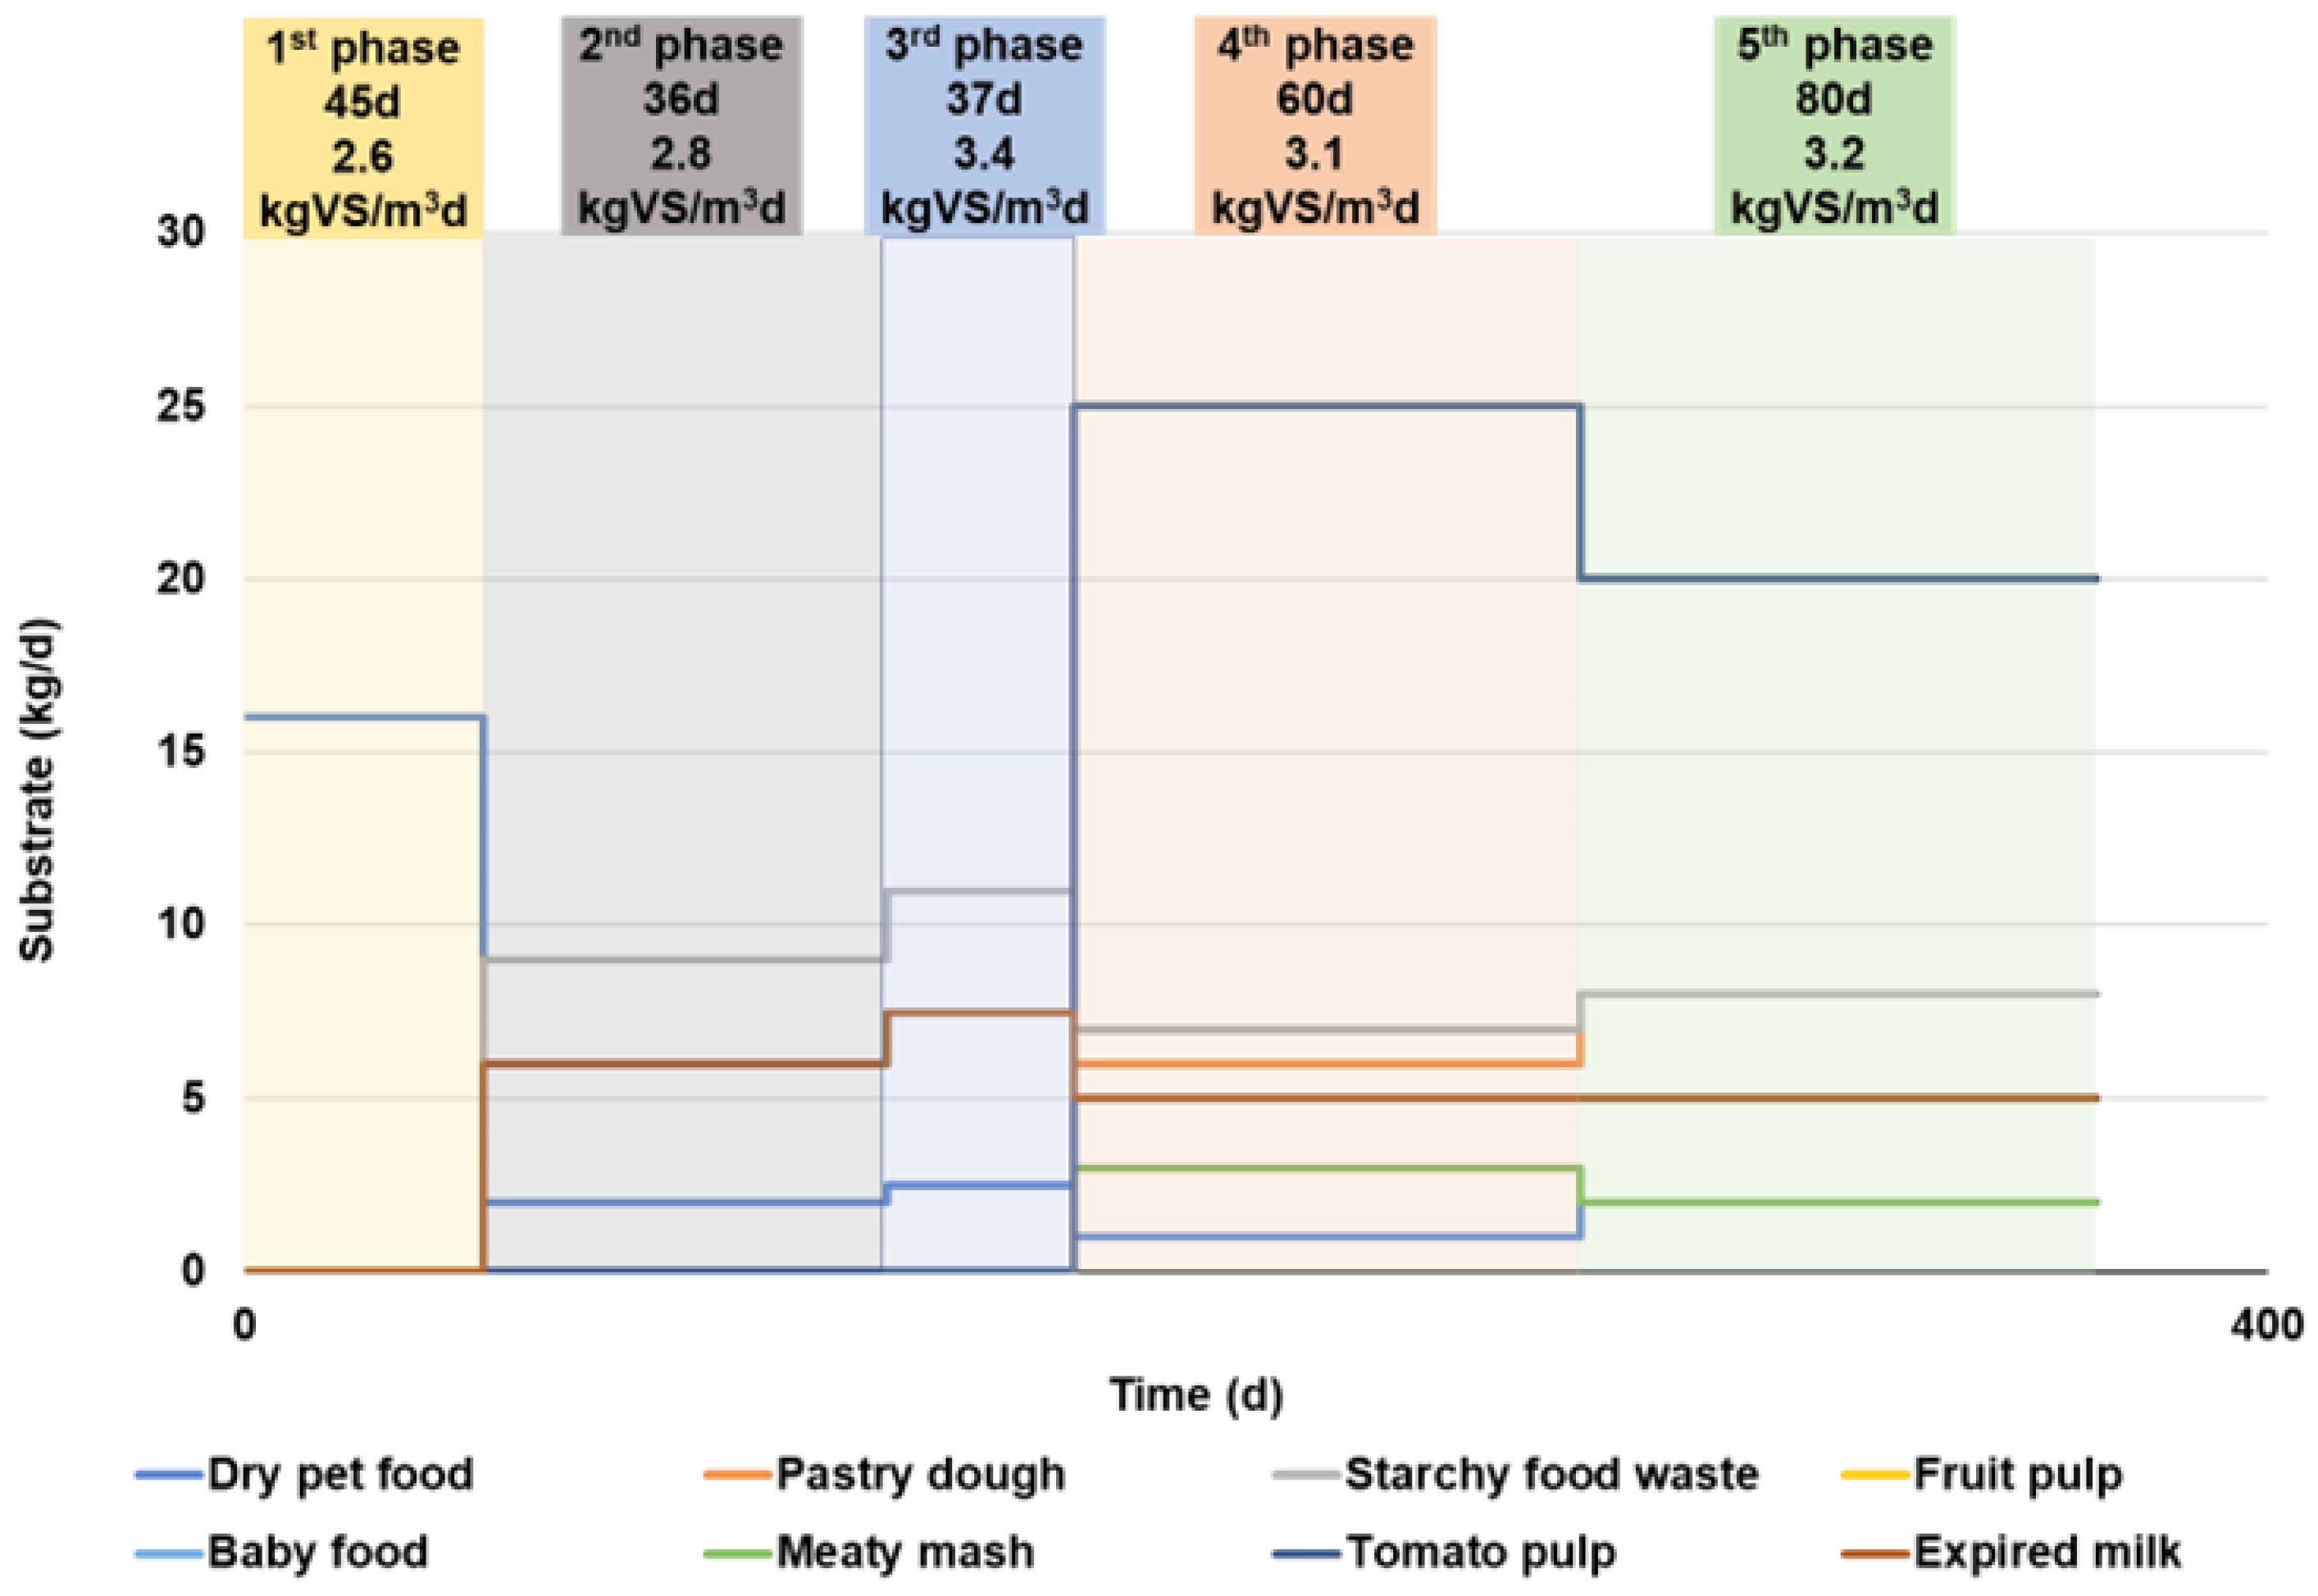
The AD module (unit II) operated in mesophilic conditions (39 °C) at an HRT of 36 d. Different biodegradable organic wastes were fed into the AD. The organic loading rate (OLR) ranged from 2.6 to 3.4 kg VSS/m3d. The total solids (TSs) content was set at 9.5–12.9% after the proper dilution of the influent raw material. The feeding schedule and OLR of each experimental phase of the anaerobic digester is presented in Figure 2.
The operation of the AD unit started after the MBR operation. As evidenced by Table 1 and Figure 2, these experimental phases did not coincide exactly with the MBR stages. This is why the term “stage” was used for the MBR and the term “phase” for the AD unit. In each experimental phase, the feedstock composition was changed in order to examine the biogas production for each mixture of feedstocks.
Sampling was performed twice a week from the influent and effluent of the MBR and AD systems and analyzed in terms of the total and volatile suspended solids (TSSs and VSSs), COD (chemical oxygen demand), ammonium (NH4-N), nitrate (NO3-N), total nitrogen (TN), and pH. Each biodegradable organic waste that was introduced into the anaerobic reactor was characterized in terms of TS, volatile solids (VSs), nitrogen, total organic carbon (TOC), carbohydrates, proteins, and lipids. Additionally, the biogas production and composition were measured daily. The full record of the performance data was presented by Solomou et al. [10] and served as the input data for the calibration and validation of the developed models.

2.2. Model Structure

2.2.1. Aerobic Membrane Reactor

This section introduces the model that enabled the simulation of the aerobic MBR bioreactor. As mentioned above, in this work, ASM1 was used. The Petersen matrix (Table 2) presented all the relevant involved components (columns) and processes (rows) allowing the build-up of mass balance equations.
Conventional aerobic CSTR modeling was adjusted to a membrane bioreactor assuming complete solid/liquid separation. It was assumed that organic carbon removal and nitrification were the only bioprocesses that occurred in the MBR. It was also assumed that hydrodynamic phenomena were negligible [13,14]. Thus, the reactor was considered as CSTR with sludge removal. Therefore, the SRT was controlled by the flow rate of excess sludge (Qw).
The mass balance ordinary differential equations of the CSTR aerobic MBR reactor (unit I, Figure 1) were set up based on the Peterson matrix (Table 2).
For each process component (Si), the mass balance equation is shown in the following equation:
V dS i dt = Q in S i , in Q e S i , e Q w S i , w + V j = 1 9 p j v ij
where the term j = 1 9 p j v ij   is the sum of the specific kinetic rates for each process j multiplied by vij, as presented in the Peterson matrix (Table 2).
For the set-up of the model, the following were assumed:
  • The concentration of active biomass (XBH, XBA) and particulate substrate from cell decay (XP) in the influent and effluent of the MBR were neglected.
  • Given that nitrite nitrogen (SNO) was not detected in steady-state conditions, it was assumed that the bioconversion of ammonia to nitrate occurred in a single step.
As described above, the performance data of the MBR system in terms of TSS, VSS, COD, TN, NH4-N, NO3-N, and NO2-N for the influent and effluents were used for the set-up of the mass balances. Soluble substrate (Ss) was considered equal to the soluble COD experimental measurements. The concentration of VSS was considered to simulate the sum of active biomass (XBH, XBA) and particulate matter (Xp). The sum of nitrate and nitrite concentrations and ammoniacal nitrogen concentration simulated the parameters SNO and SNH, respectively.

2.2.2. Anaerobic Digester

In order to mathematically simulate the anaerobic digestion process included in the pilot plant, a model variation of ADM1 [15] was used. ADM1-R4, which we was used, was a simplified model that was described in detail by Weinrich and Nelles [5]. More specifically, in ADM1-R4, the carbohydrate, protein, and lipid degradation, as first-order reactions, served as the basis for the description of the AD process. A single group of bacteria (Xbac) was considered to biodegrade all components. Thus, the kinetic parameters included in the model were limited to three hydrolysis constants (kch, kpr, and kli) and the anaerobic decay coefficient (kdec). Since ADM1-R4 lacks any growth-limiting or inhibitory elements, it is unable to describe inhibitions in depth. All inhibitory effects were incorporated in the first-order hydrolysis constants. The model structure is presented in Table 3. The mass balances in the CSTR anaerobic digester (unit II, Figure 1) were constructed according to the respective matrix (Table 3) similar to the aerobic process simulation.
In accordance with the physicochemical characterization of the utilized substrates and feeding schedule (Figure 2), the input model variables were estimated for each operational phase (Table 4).

2.3. Objective Function—Optimisation Parameter

In order to determine the kinetic parameters of the bioprocesses’ models, as an optimization method, the objective function was selected. The sum of residuals between the measured data and the respective simulation values was estimated in a target value Jobj. By applying common optimization methods, the models’ parameters were adjusted aiming to achieve the best model fit. In the modeling of the bioprocesses, the objective function is typically expressed as the mean squared error (MSE) between the experimental data and respective simulation values [16,17].
J obj = MSE = 1 n i = 1 n y i y i ^ 2
For aerobic process modeling, objective functions of VSS and total nitrogen were used. For the anaerobic process simulation, the measurements of daily biogas production were incorporated in the calculation of the respective objective function.

2.4. Model Efficiency

The simulation results were assessed by the original Nash–Sutcliffe efficiency (NSE) based on the square error, as described in Equation (3) [16]. This is a normalized statistic that determines the relative magnitude of the residual variance (“noise”) compared to the measured data variance (“information”).
NSE = 1 i = 1 n y i y i ^ 2 i = 1 n y i y i ¯ 2

3. Results

3.1. Aerobic Process

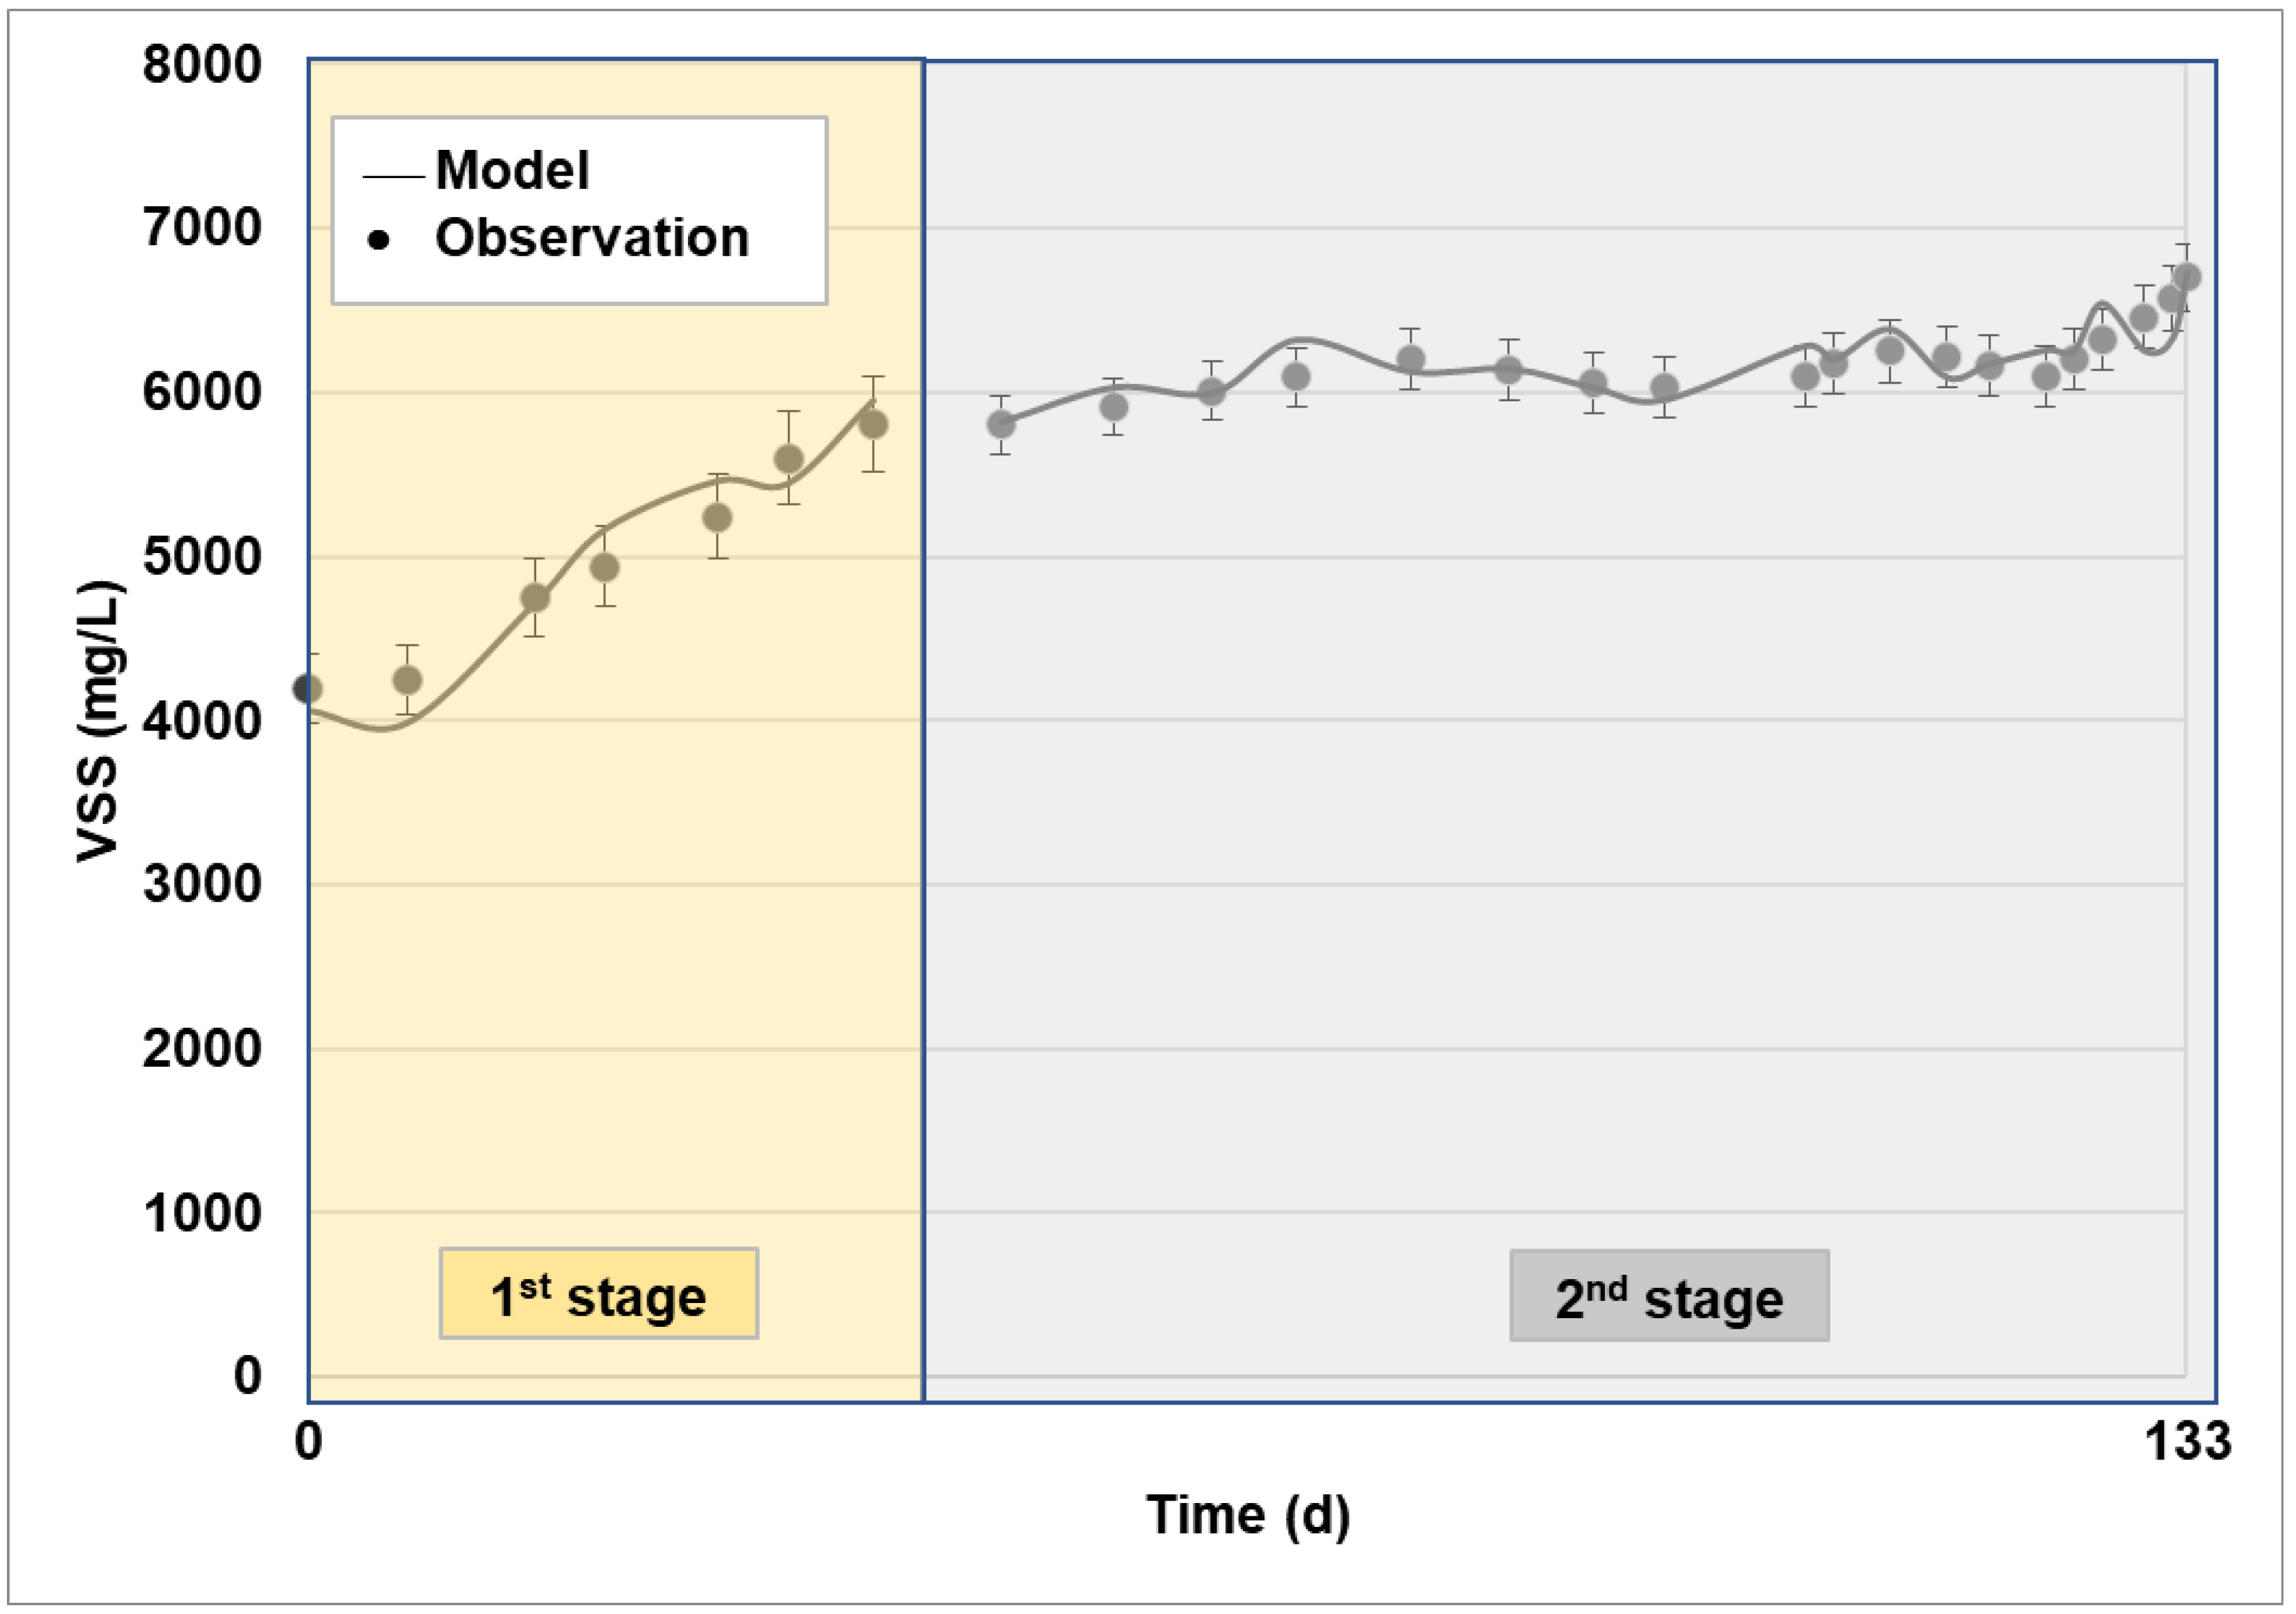
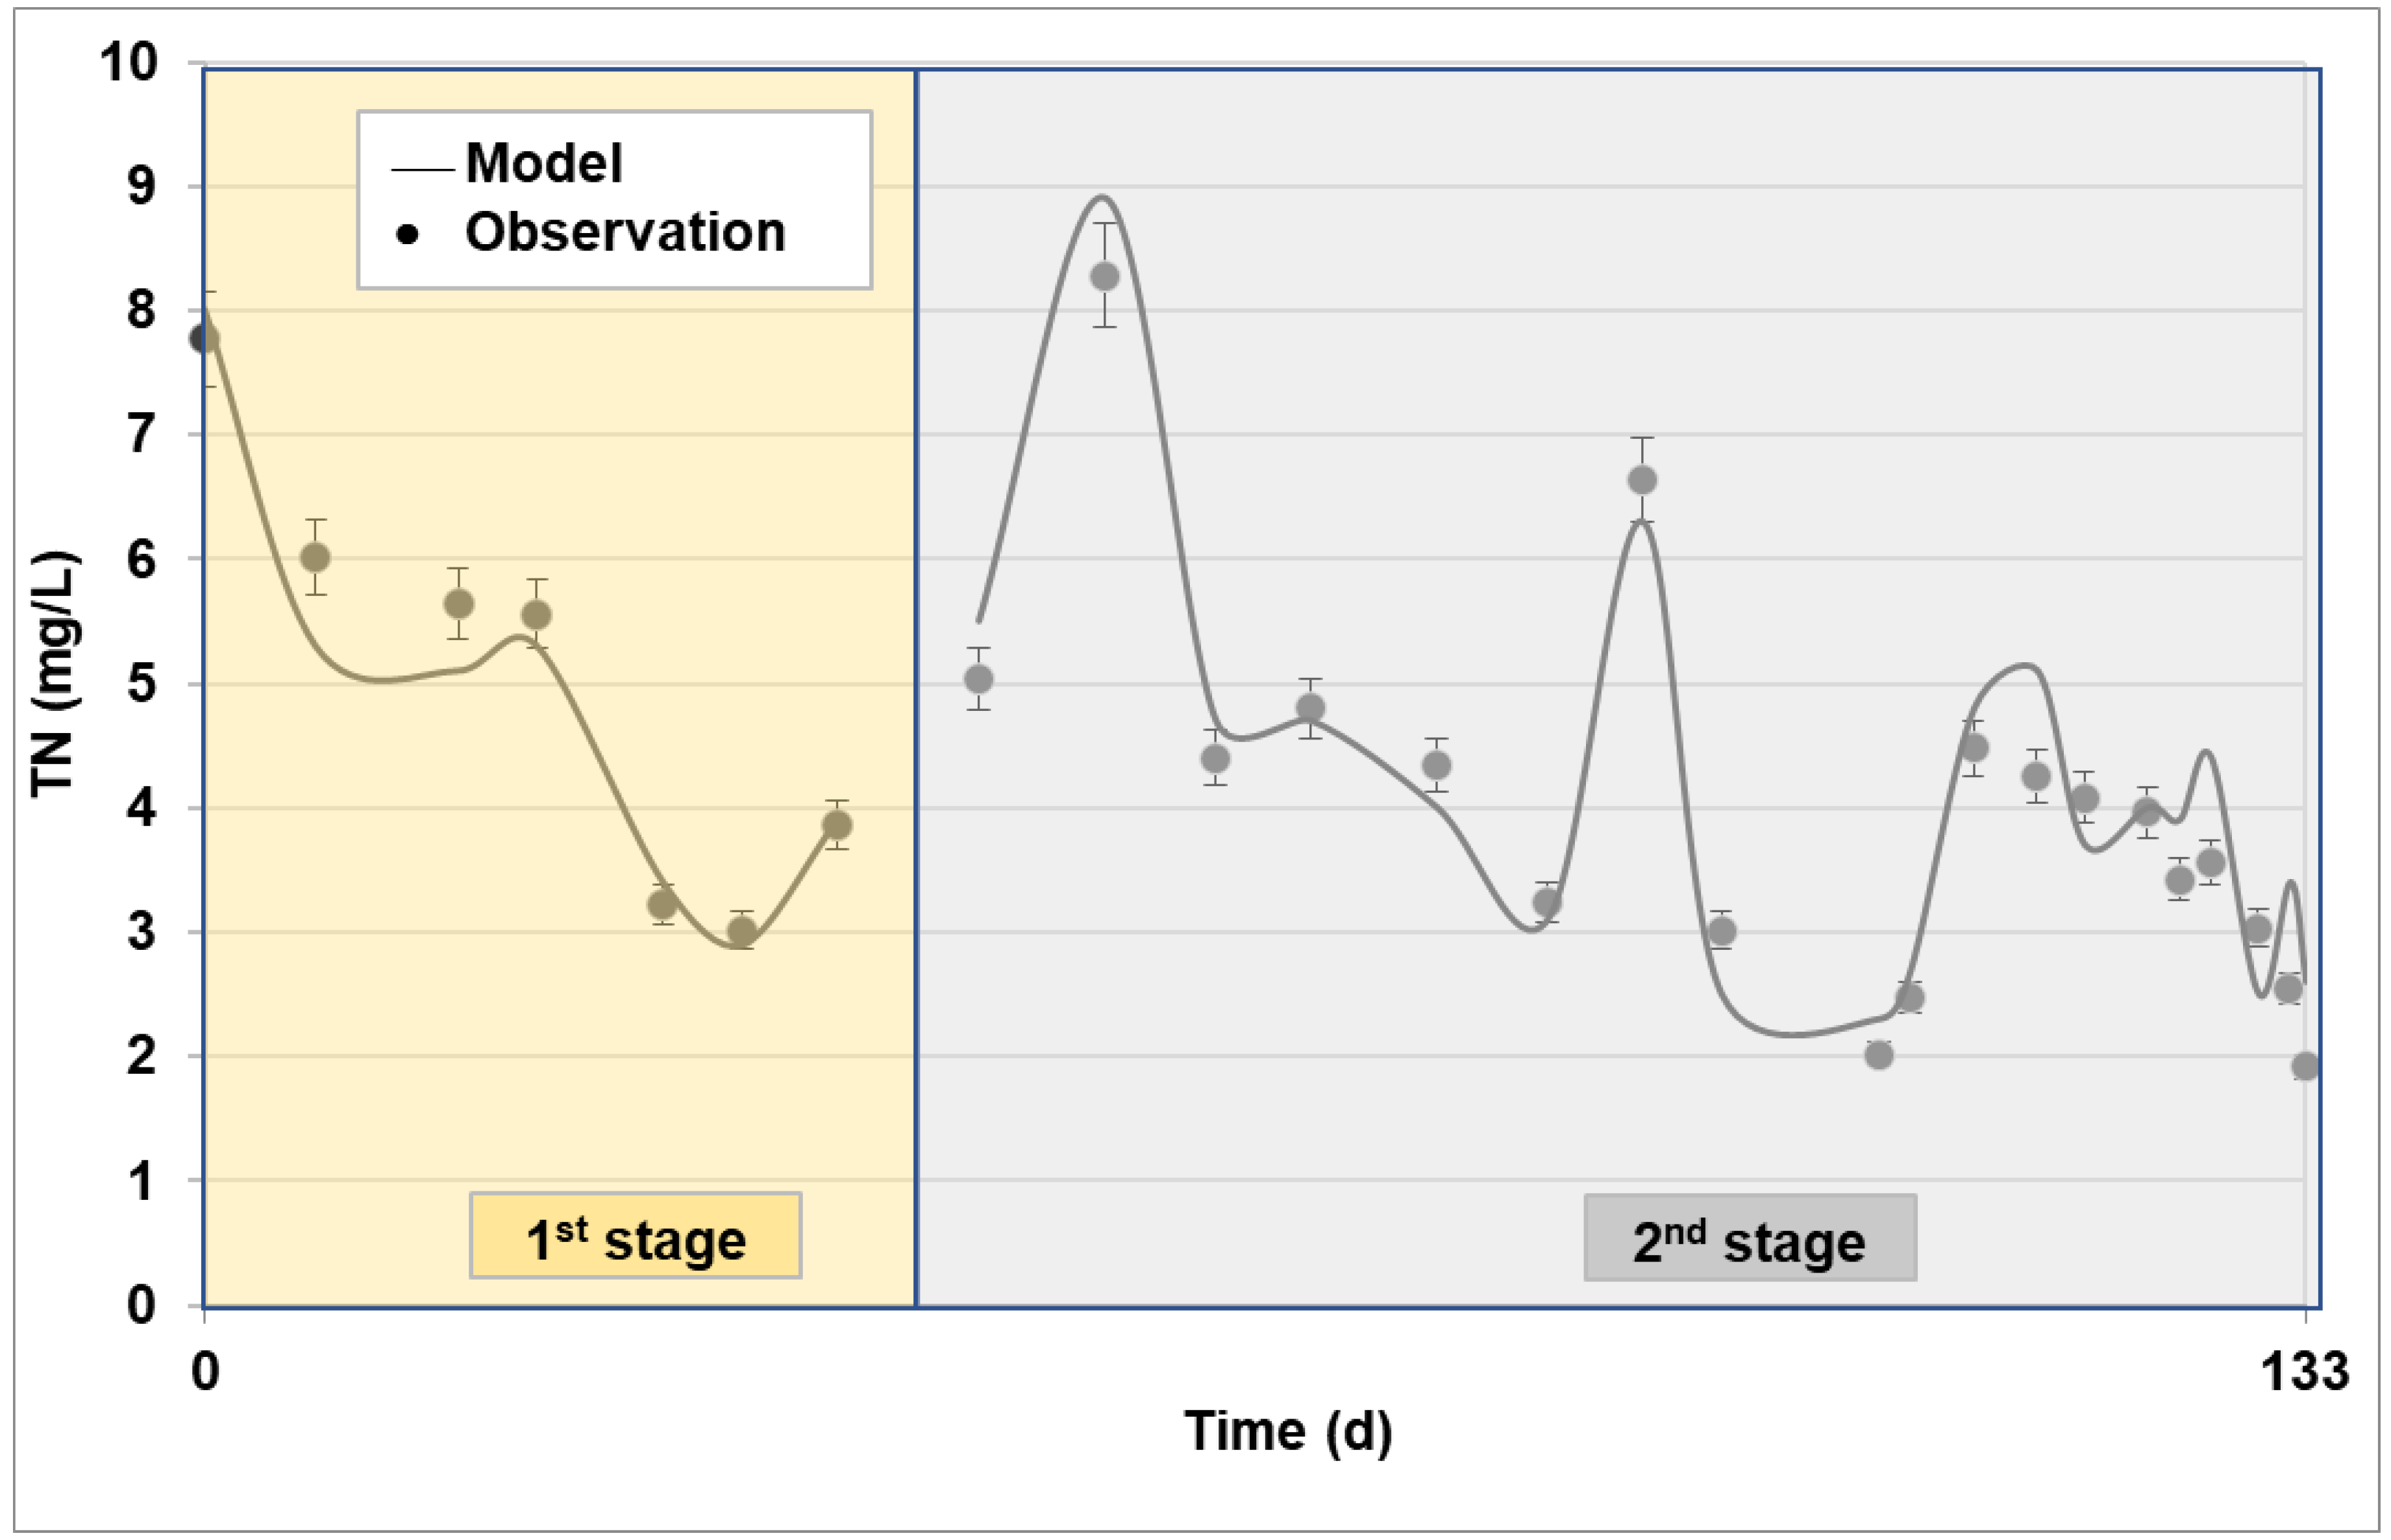
The influent and performance data for the first and second stages were used to calibrate the kinetic parameters using VSS and total nitrogen (TN) as the objective functions. The predicted and measured VSS and TN concentrations are presented in Figure 3 and Figure 4, illustrating that the selected objective functions ensured a satisfactory model fit of the VSS (NSE = 0.93) and TN (NSE = 0.91) concentrations in both stages. It is worth noting that the change in SRT in the system had a catalytic effect on both the properties of the sludge and the clogging of the membranes. Increasing the SRT for constant HRT contributed to increasing the TSSs and VSSs. During the operation of the system, four (4) significant foaming episodes occurred, namely, on days 123, 256, 263, and 271, resulting in significant sludge loss. In this case, the system was allowed to recover the sludge and return to the best permanent operating conditions.
Table 5 presents the calibrated values of kinetic parameters that were compared with the typical values of the literature for aerobic processes, as well as the values suggested by Baek et al. (2009) for aerobic MBR modeling. Most values are in accordance with literature, with small deviations. The calibrated maximum specific growth rates for both autotrophs (μA) and heterotrophs (μH) were higher than the literature values, implying the elevated population of active biomass as calculated and depicted in Figure 5.
In Figure 5, the concentration of the heterotrophic biomass ranges from 4300 to 9770 mg COD/L, following the respective pattern of VSS concentration. The concentration of autotrophic biomass was much lower, ranging from 508 to 1422 mg COD/L. The predominance of heterotrophic bacteria is evident, as is the case in the activated sludge systems. A sharp increase in heterotrophic bacteria can be observed in the initiation of the second operational stage, which could be attributed to the increase in SRT from 20 to 30 d. On the other hand, the population of autotrophic bacteria presented a very limited increase, which underlines the high nitrification potential of MBR processes under various operating conditions.
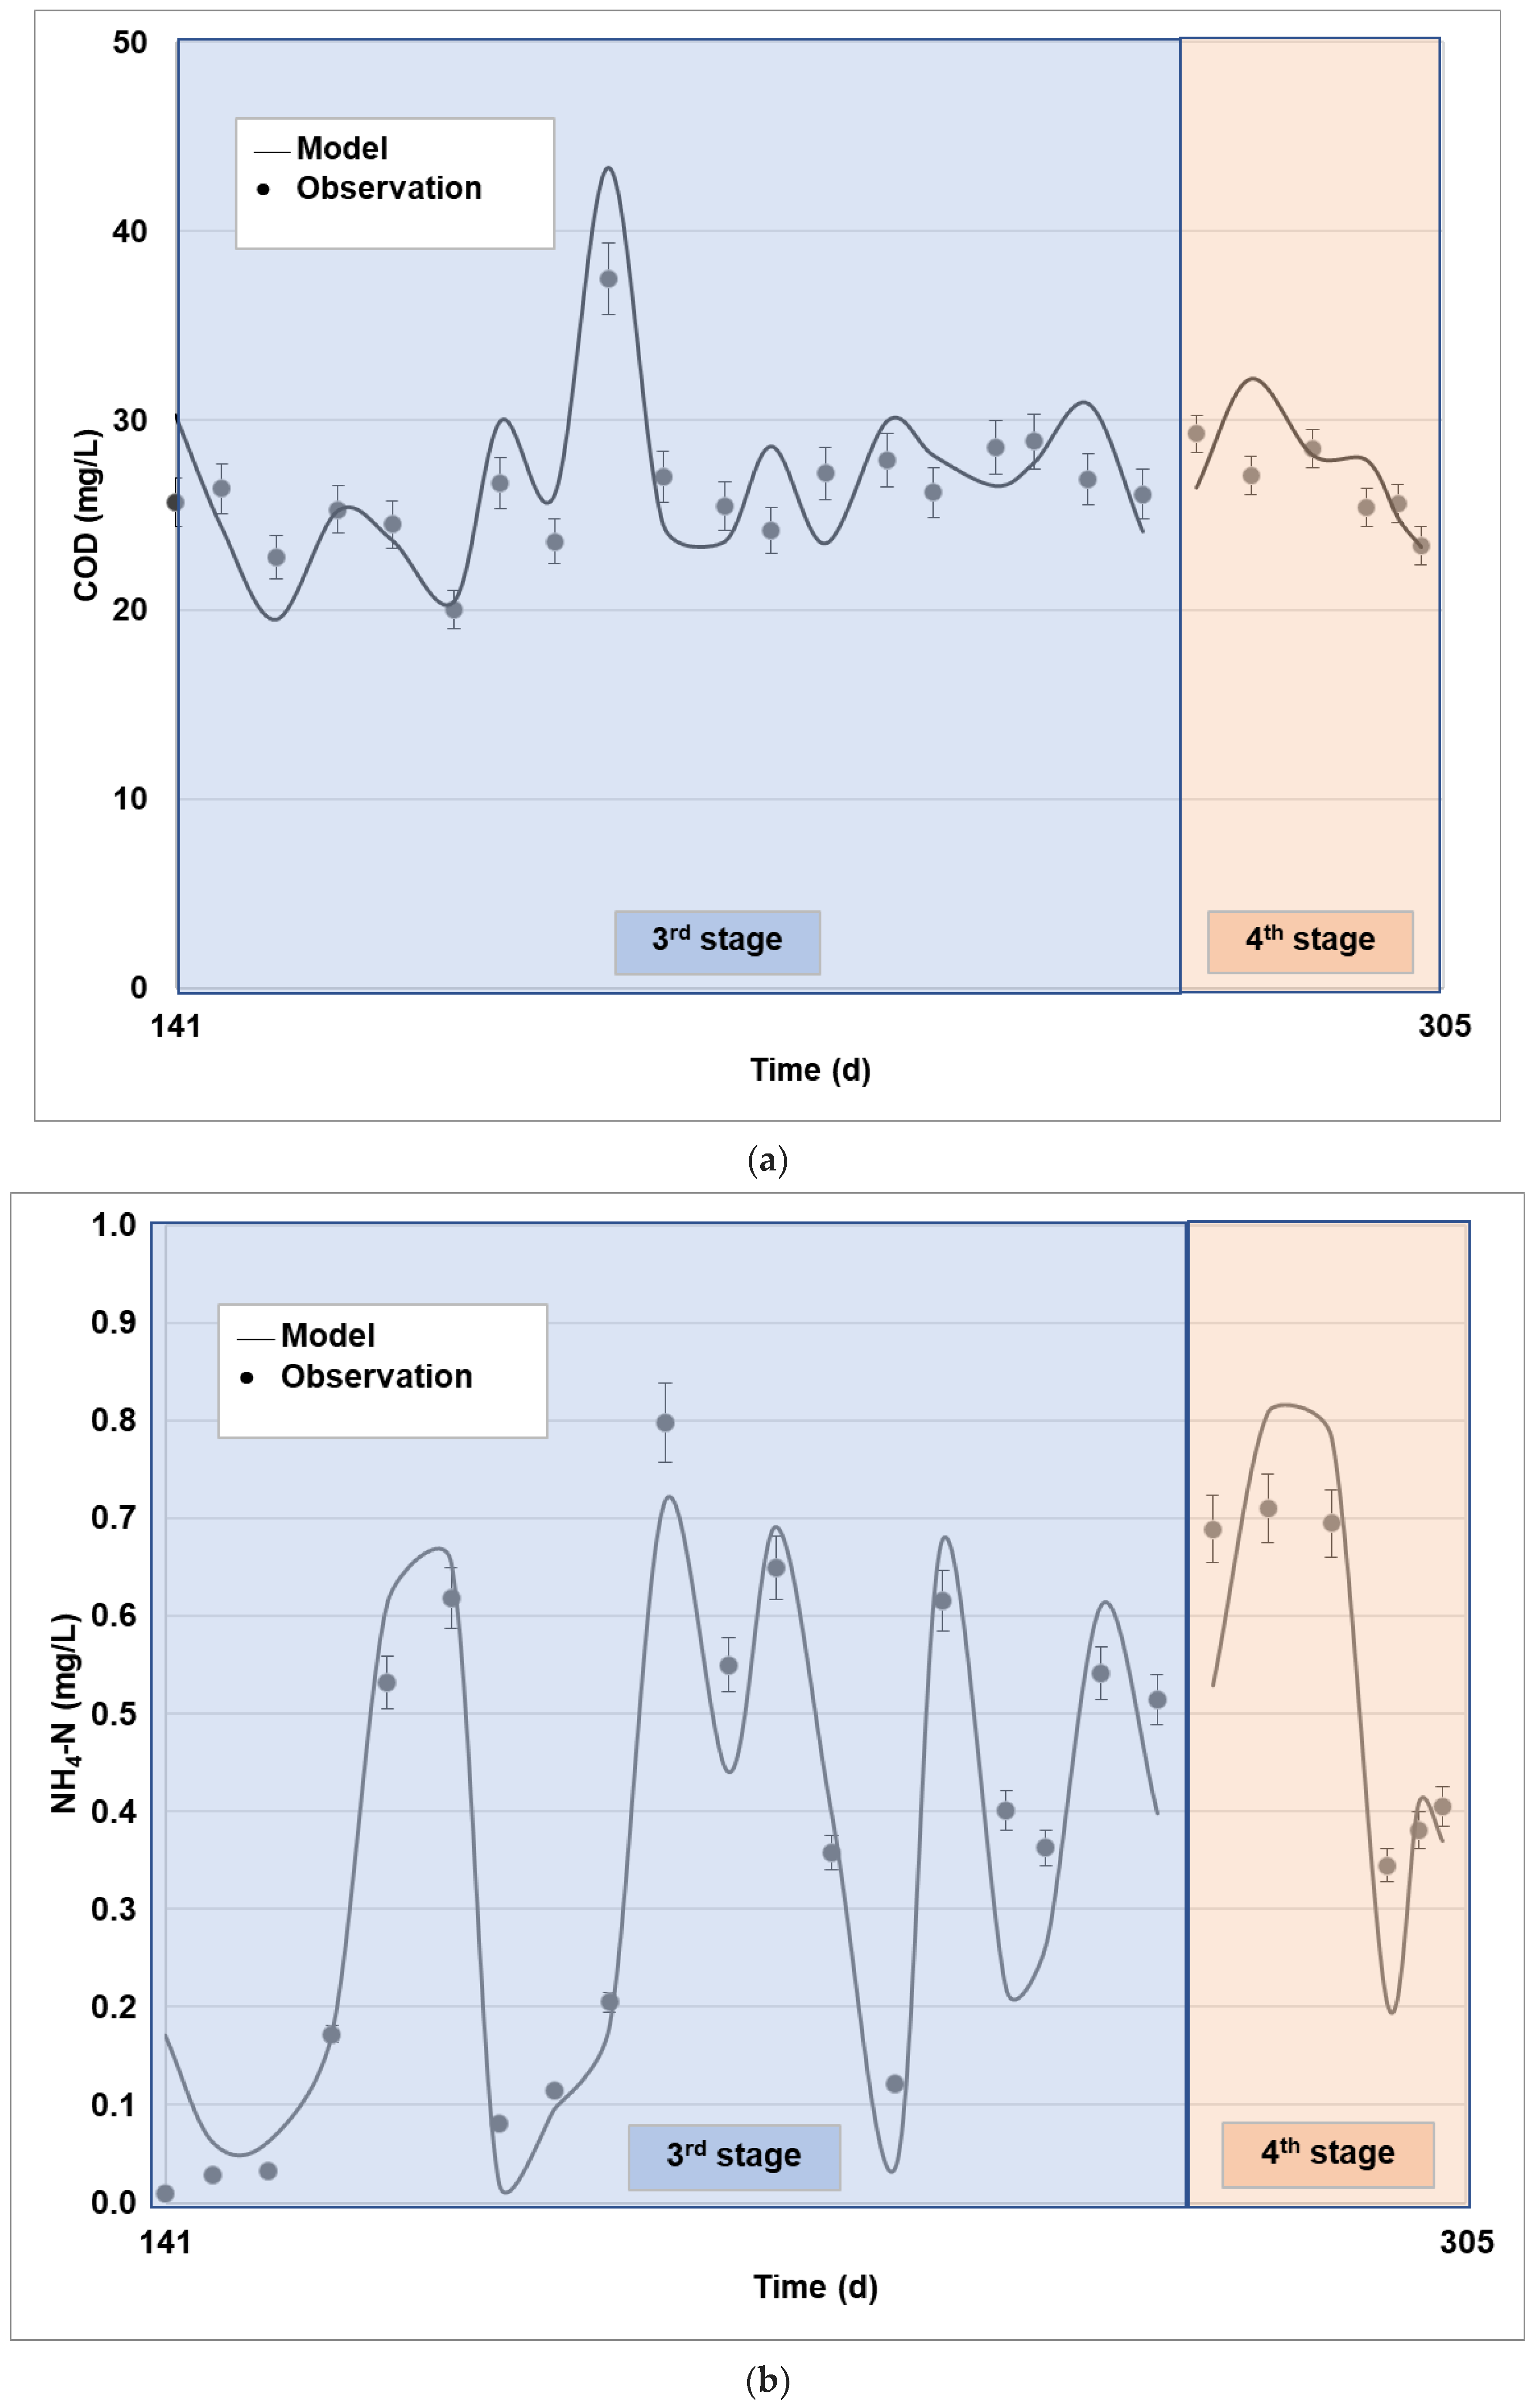
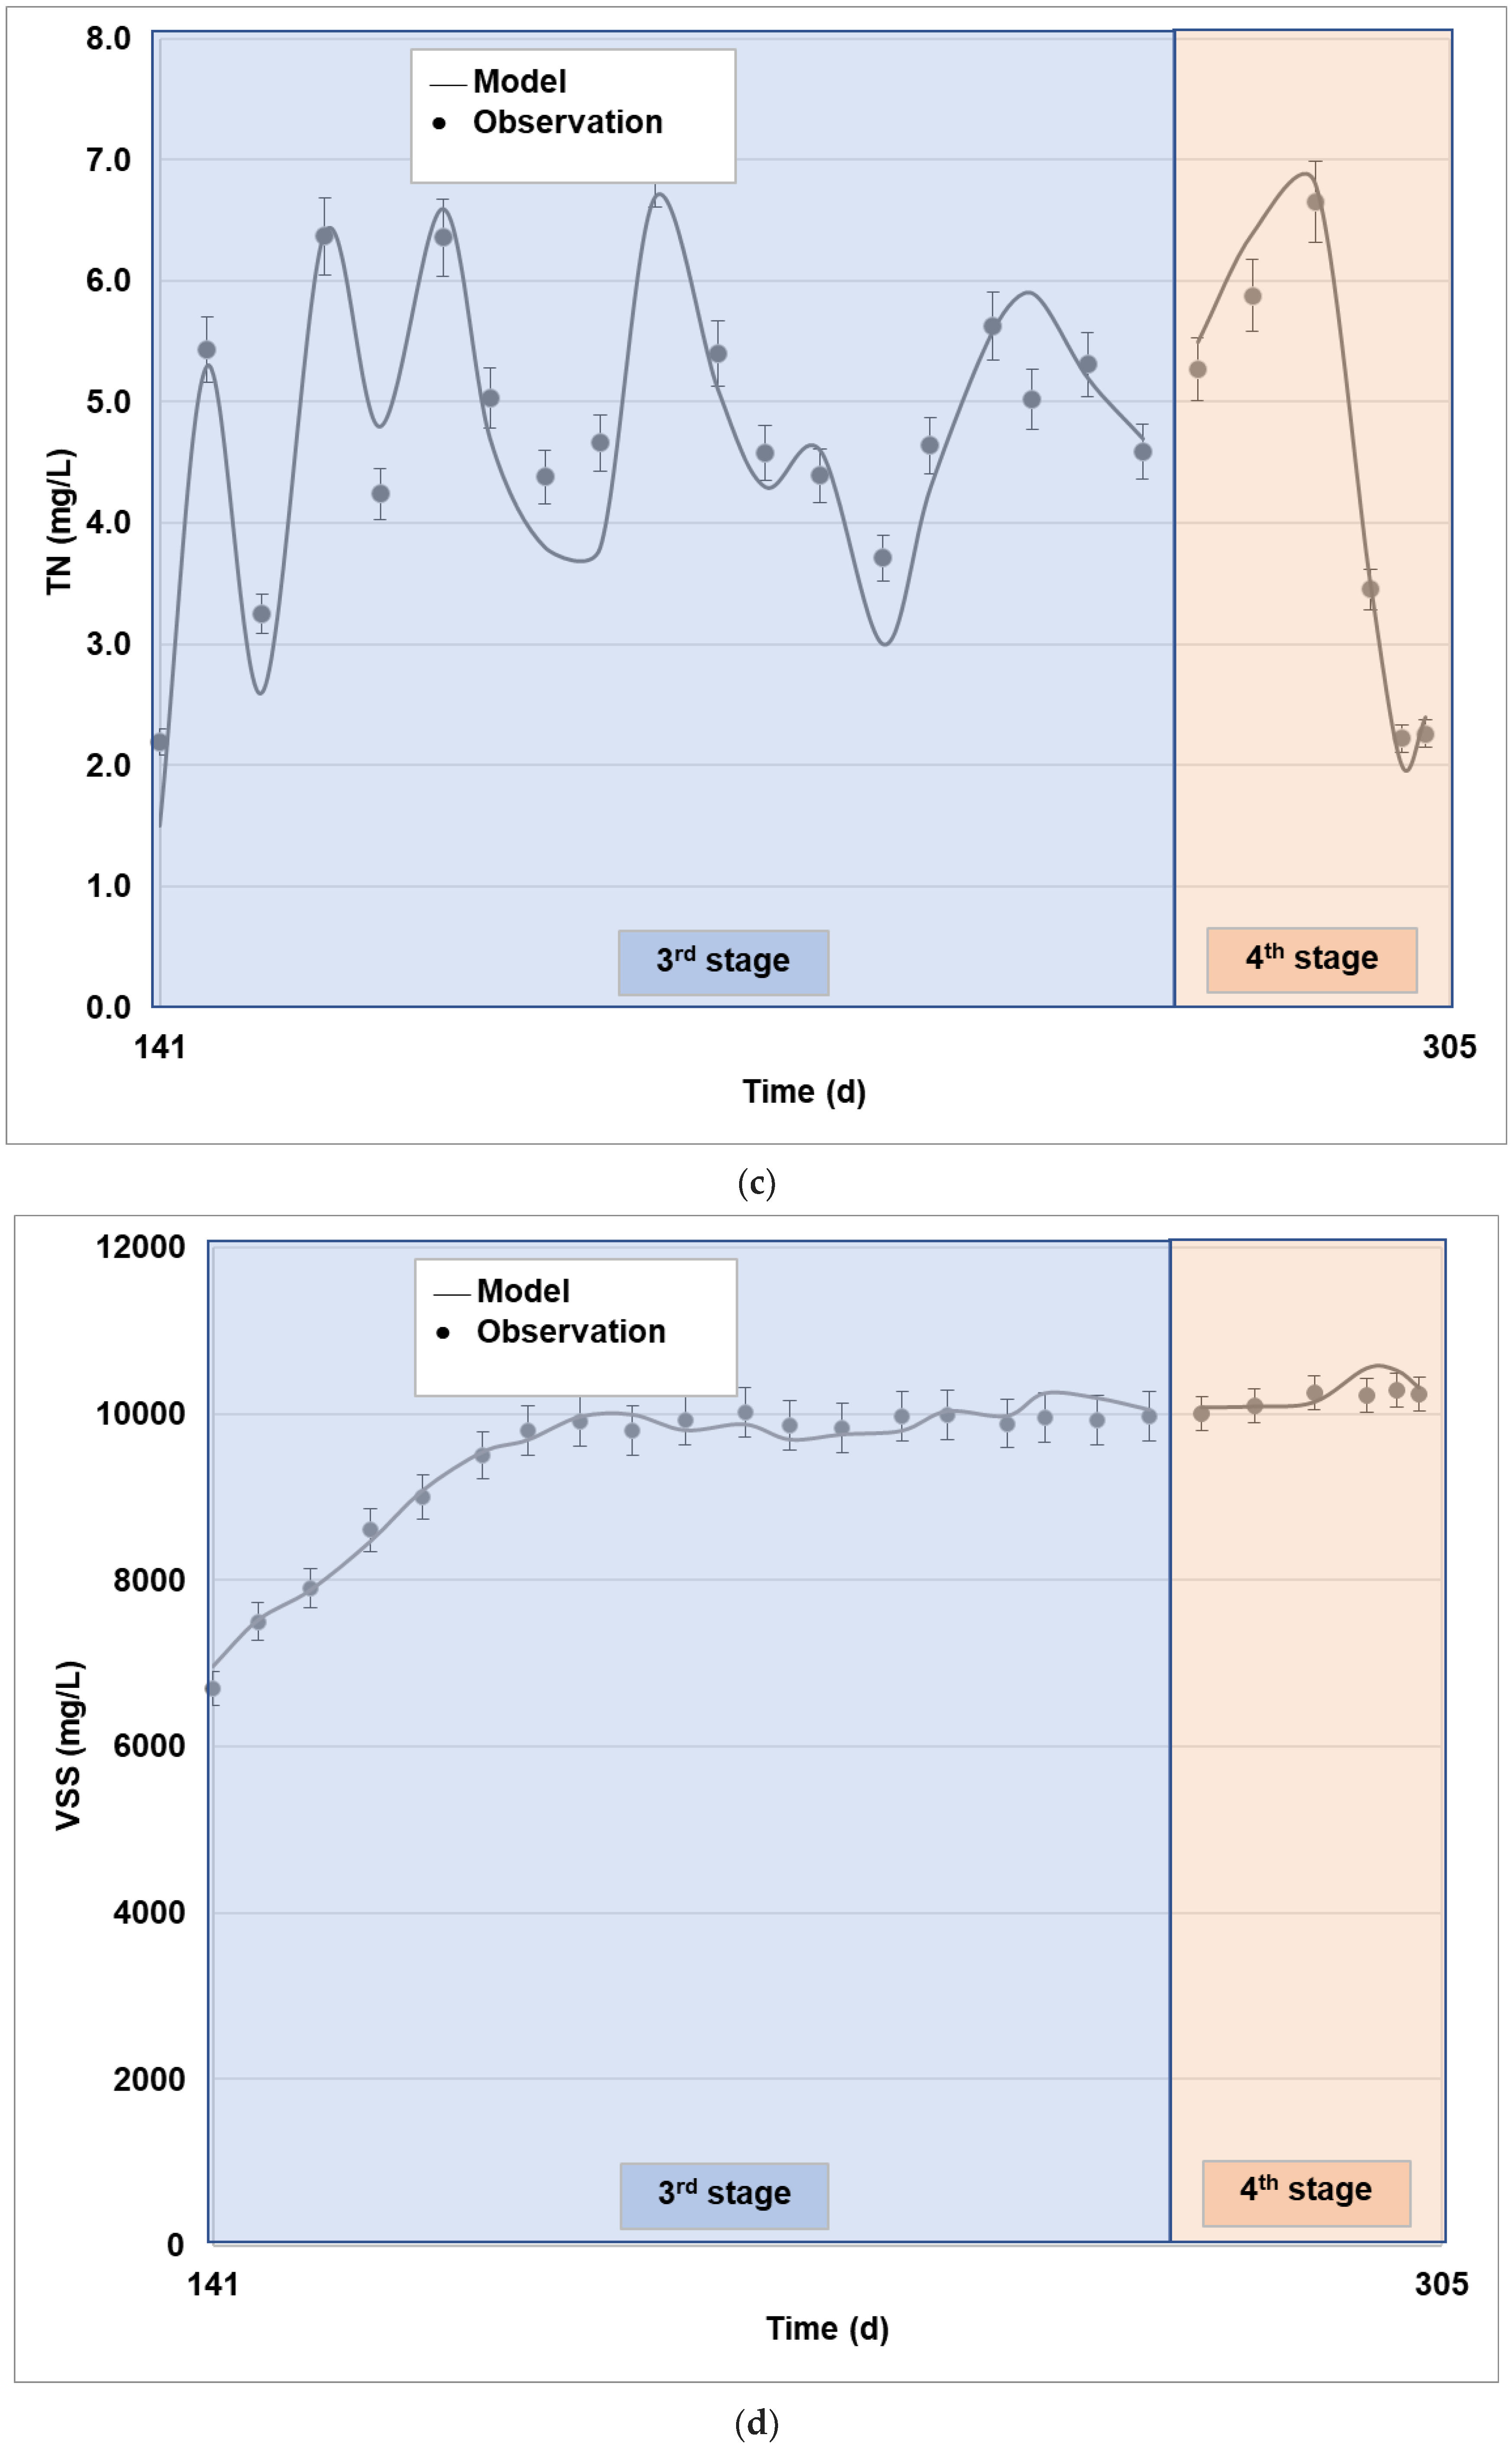
Moreover, the constructed model was utilized to simulate the system’s performance for the third and fourth stages in terms of the parameters’ effluent COD, NH4-N, TN, and VSS. Figure 6 presents the simulated and real values.
The COD concentration in the final effluent MBR (permeate) was successfully simulated (NSE = 0.87) taking into consideration the experimental data (Figure 6a). The same applied for ammonia (NSE = 0.89) and total nitrogen (NSE = 0.86) (Figure 6b,c, respectively), implying the nitrification was satisfactorily described by the developed model and the kinetic parameters estimated. The slightly higher differences between the simulated and experimental data for TN concentrations can be attributed to the assumption that the nitrification performed by autotrophic bacteria is a single-step process. Furthermore, the measured and predicted concentrations of VSS agreed well (NSE = 0.92) throughout the third and fourth experimental stages of MBR. The model managed to predict the gradual increase in VSS due to the increase in the organic load in the fourth stage.

3.2. Anaerobic Process

Based on the experimental data and the optimization process presented above, the first-order hydrolysis constants (kch, kpr, and kli) were estimated. During this optimization, numerical constraints were taken into consideration. More specifically, kch, kpr, and kli were limited within the range 0.001 and 10 d−1 [15,18]. The performance data of the first and second stages were used to calibrate the kinetic parameters, which are presented Table 6. The values of the rest of the constants were adopted based on Weinrich and Nelles [5]. The calibrated values were compared with the typical values in the literature for anaerobic digestion for both ADM1 and ADM1-R4. Most values were in accordance with the literature with small deviations for the case of high-rate mesophilic anaerobic digestion. However, the elevated carbohydrates’ constant can be attributed to the chemical pretreatment of the influent substrate.
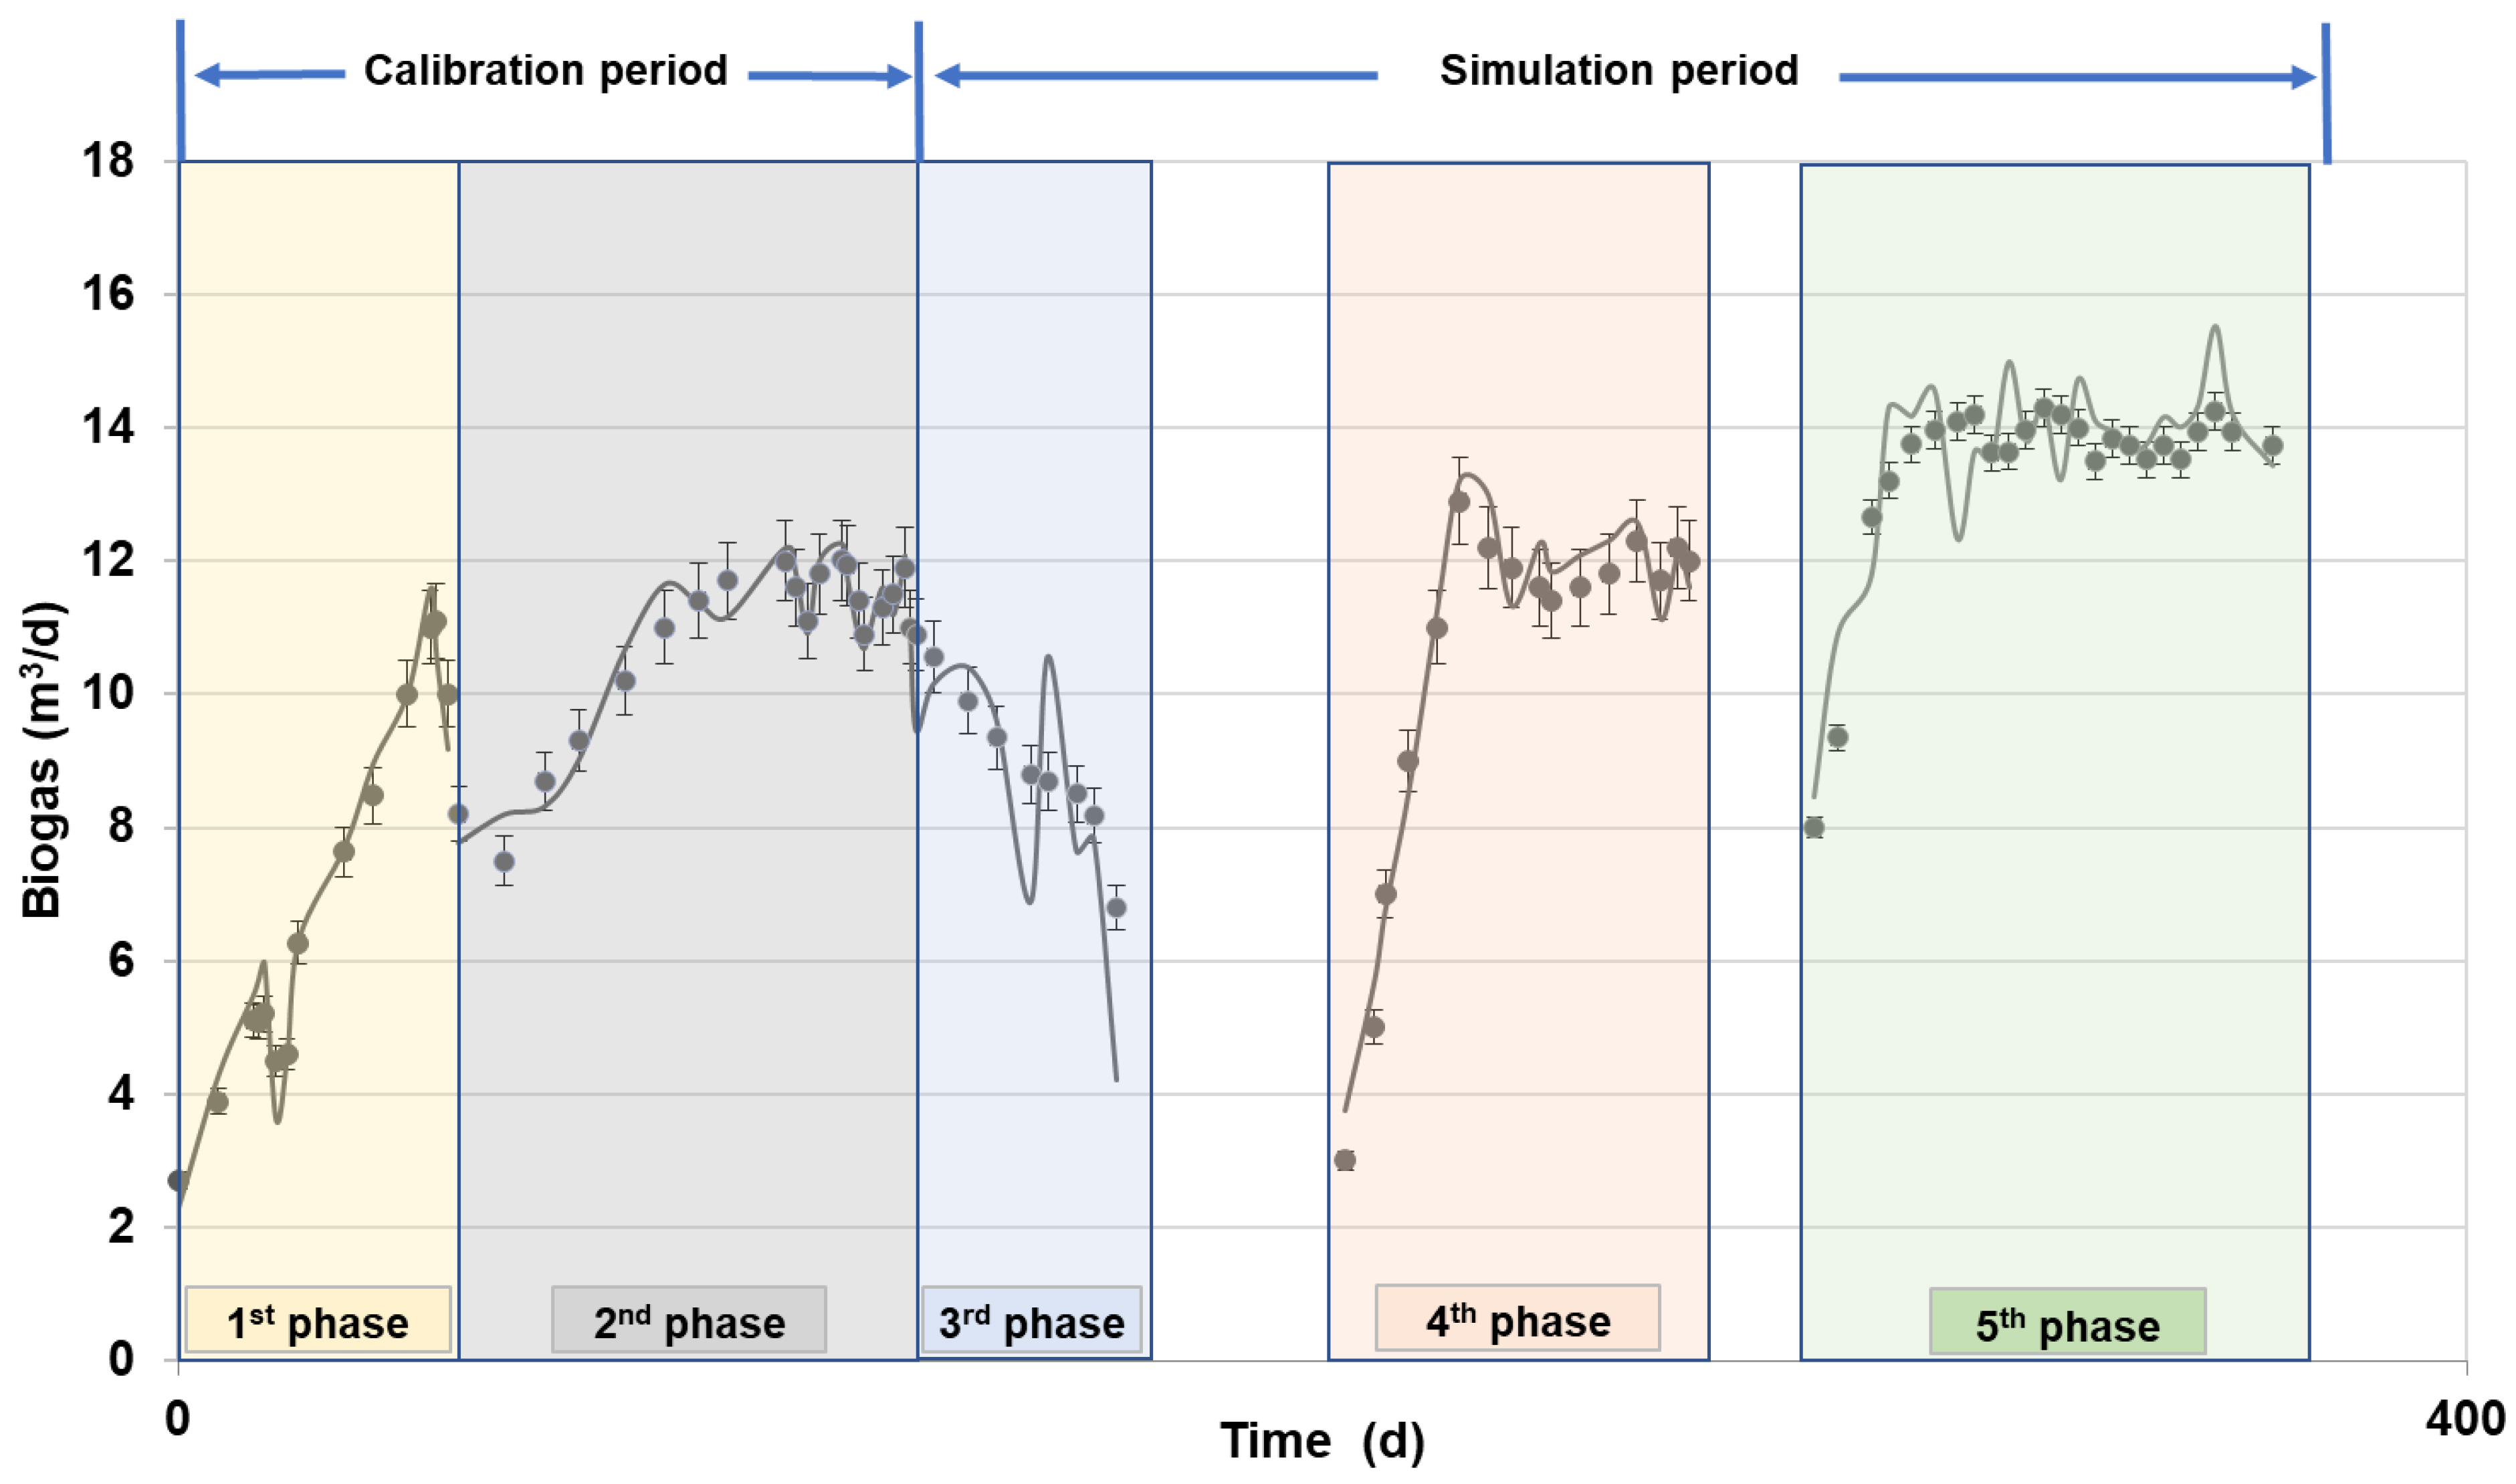
Moreover, the constructed model was utilized to predict the system’s performance in terms of biogas production for the third, fourth, and fifth phases. Figure 7 presents the experimental values for all phases, as well as the calibrated (first and second phases) and simulated (third to fifth phases) values. It is evident that the third phase that led to increased volatile fatty acid concentrations, souring of the bioreactor (pH = 5.9), and thus failure, was poorly simulated. This fact can be attributed to the ADM1-R4 constraints, since this model did not include dissociation equilibria, the inhibition of bacterial growth at low pH levels, elevated ammonia concentration, or low nitrogen concentration. On the other hand, the fourth and fifth phases were adequately simulated achieving very satisfactory NSE values (>0.92).
Nevertheless, the simulated biogas composition for all treatment phases was almost constant, estimating a 51.2 ± 0.7% methane content. According to the experimental results, the methane content of the produced biogas is presented in Table 7. It seems that the methane content was persistently underestimated by the simplified ADM1-R4 model, as was also reported by Weinrich et al. [16]. The latter can be attributed to the fact that the carbonates’ equilibria were not included in ADM1-R4. Thus, biogas composition was merely determined by the stoichiometry of the included equations and by the substrates’ composition, considering the saturation of the liquid phase.

4. Design of Full-Scale Implementation

The developed models described in the previous sections simulated the system-level performances of both aerobic MBR and anaerobic CSTR digesters. The models were calibrated by the experimental data of the integrated pilot plant operation and were assessed for their prediction potential under various operating conditions. These results were employed for the design of a full-scale integrated treatment scheme.
In view of the full exploitation of the developed MBR-AD treatment scheme, it was crucial to develop a roadmap for a full-scale implementation. The goal of the present section was to present some guidelines on the methodology to be adopted in order to implement the integrated pilot plant system as a decentralized municipal waste treatment plant. The full-scale system will be designed for a small community of 10,000 residents, aiming to treat wastewater as well as source-separated biowaste. The municipal wastewater-quality characteristics were assumed according to [19], equal to 482 mg/L BOD, 12.5 mg/L TN, 1.4 mg/L TP, 964 mg/L COD, and 482 mg/L TSS, with a flow rate of 83 L/d/resident.
As for the characteristics of biowaste, it was assumed that around 0.23 kg/d/resident [20] of biowaste would be collected, comprising 9% lipids, 14% proteins, and 35% carbohydrates on a dry basis [21].
The integrated full-scale plant will include the following units:
  • MBR feeding tank: for the collection of waste water to be treated by the MBR unit.
  • MBR unit: for the biological treatment of the municipal wastewater using emerged membrane modules.
  • AD feeding and mixing tank: for the collection and homogenization of sewage sludge from MBR and biowaste.
  • Anaerobic digester: for the anaerobic digestion of the mixture (TS~10%).
  • Biogas production unit.
  • CHP unit.
In view of designing the MBR system, HRT and SRT values of 1 and 20 d, respectively, were assumed based on the performance of the pilot plant. Thus, an effective volume of the aerobic MBR was estimated equal to 950 m3 by taking into account a safety factor of 15%. The MBR tank is the basic unit where the biological treatment of the wastewater occurs. The unified construction should include three compartments. Wastewater will be introduced into the first compartment (anoxic phase), with an operating volume of 200 m3, which would be used for dissolved oxidation expansion and partial denitrification. Then, by overflowing, wastewater will enter the second compartment (oxidation phase: membrane module), with an operating volume of 400 m3, which will stand as the core unit of the MBR treatment. In this compartment, both the biological oxidation of the wastewater and membrane filtration will occur. Dissolved oxygen will be introduced mainly though the membrane module by a set of blowers. Air will be passed through the flat plate module and serve as back wash for the prevention of sludge buildup. The third compartment will serve as a sludge settling tank, where sludge recirculation will be performed in order to achieve the targeted SRT and excess sludge will be removed.
Regarding the anaerobic digester, we considered an HRT of 36 d. The equalization and homogenization tank of a 120 m3 working volume will be fed with sewage sludge from the MBR (41 m3/d with 12,000 mg/L VSS) and source-separated biowaste (23,000 kg/d). In this case, the effective volume of the anaerobic bioreactor will be 2800 or 3200 m3 with a 15% safety factor and a calculated organic loading rate of 2.16 kgVS/m3/d. Assuming a cylindrical vessel with a height to diameter ratio of 3:2, it was estimated that a reactor with a diameter of 10.9 m and a height of 34.8 m would be installed. It is advisable to install two treatment lines, including two bioreactors.
Via the implementation of the developed models, the performance of the full-scale plant under steady-state conditions was predicted. From the simulation of the aerobic process, it was predicted that a high COD and nitrogen removal rate could be achieved with a VSS concentration of 12,400 ± 118 mg/L in the bioreactor. The effluent flow rate will be 788 m3/d with COD and TN concentrations of 58 ± 2 and 12.5 ± 1.7 mg/L, respectively.
From the simulation of the anaerobic system, it was estimated that the daily biogas production would be 4300 m3/d with a 56% methane content. Thus, if a combined heat and power engine with 75% efficiency was included in the system, more than 18 MWh of power and 6 MWh of thermal energy could be produced. According to the model, 1750 kg/d solid digestate on a dry basis could be produced. The liquid fraction of the digestate will be recirculated in the homogenization tank of the AD process unit as dilution water.

5. Conclusions

The study explored anaerobic digestion technology (AD) integrated with membrane technology as an attractive option for the integrated management of organic waste and wastewater. Having as a main objective the demonstration of a sustainable bioconversion technological scheme that can simultaneously meet the requirements for waste management, this study focused on the innovative integration of anaerobic digestion and membrane bioreactor systems for the treatment of domestic wastewater and biowaste. In this context, a pilot study was constructed and operated under various conditions for nearly 2 years. The pilot plant operation demonstrated the technical feasibility of an innovative integrated system that would be able to produce biogas suitable for combustion (used as renewable electric and thermal energies), a stabilized solid fertilizer, and high-quality water that can be used either within the process or as irrigation water in agriculture. Mathematical models were developed by using the performance of the data of the pilot plant operation aiming to stand as a powerful tool for the design of full-scale plants and simulate their performance.
The mathematical model of the aerobic bioprocess provided a useful insight into the MBR performances, especially the quality characteristics of the permeate and the estimation of the active biomass in terms of autotrophic and heterotrophic bacteria concentrations in the MBR. The mathematical model proved that the membrane-based aerobic bioprocess effectively degraded soluble organic matter. The high removal efficiencies of organic matter and nitrogen were achieved over a wide range of operating conditions.
A model-based evaluation of anaerobic digestion by the ADM1 simplification model (ADM1-R4) revealed satisfactory simulation results with high accuracy (>0.86). The accurate estimation of the model parameters allowed for a precise prediction of biogas. Thus, the proposed simplified model can be used as a powerful simulator for bioprocess design, monitoring and controlling a full-scale plant operation. This was the case for the full-scale implementation.
The developed models both for aerobic and anaerobic bioprocesses tailored to the integrated systems can stand as powerful tools for the design and future monitoring of a full-scale implementation. This full-scale integrated scheme that combined the two well-established technologies in an integrated stand-alone and energy autonomous system followed a symbiotic zero-waste approach, in that the waste products of one technology constituted feedstock material for the other. Considering the simulation performance data and the beneficial environmental impacts associated with the full-scale demonstration of the system, it is evident that the MBR-AD approach constitutes a sustainable option for small communities.

Author Contributions

Conceptualization, M.L.; methodology, D.M.; formal analysis, S.M. and E.M.B.; investigation, N.S.; resources, M.L.; data curation, N.S.; writing—original draft preparation, S.M. and E.M.B.; writing—review and editing, S.M. and E.M.B.; supervision, M.L.; project administration, M.L. All authors have read and agreed to the published version of the manuscript.

Funding

This research received no external funding.

Institutional Review Board Statement

Not applicable.

Informed Consent Statement

Not applicable.

Data Availability Statement

Not applicable.

Conflicts of Interest

The authors declare no conflict of interest.

Abbreviations

SymbolDescription
ADAnaerobic digestion
ADM1Anaerobic digestion model 1
ASM1Activated sludge model
bADecay coefficient for autotrophic biomass
bHDecay coefficient for heterotrophic biomass
CODChemical oxygen demand
CSTRContinuously stirred tank reactor
fpFraction of biomass leading to particulate products
HRTHydraulic retention time
iXBMass of nitrogen per mass of COD in biomass
ixpMass of nitrogen per mass of COD in products from biomass
JobjObjective function
kaAmmonification rate
kchFirst-order hydrolysis constants for carbohydrates
kdecAnaerobic microbial decay rate
kHMaximum specific hydrolysis rate for slowly biodegradable COD
KH,ch4Henry’s law equilibrium constant for methane
KH,co2Henry’s law equilibrium constant for carbon dioxide
KLaGas–liquid transfer coefficient
kliFirst-order hydrolysis constants for lipids
KNHAmmonium half-saturation coefficient for nitrifying heterotrophic biomass
KNONitrate half-saturation coefficient for denitrifying heterotrophic biomass
KOHOxygen half-saturation coefficient for heterotrophic biomass
kpPipe friction coefficient
kprFirst-order hydrolysis constants for proteins
KsHalf-saturation coefficient for heterotrophic biomass
KXHalf-saturation coefficient for hydrolysis of slowly biodegradable substrate
KOAOxygen half-saturation coefficient for autotrophic biomass
MBRMembrane aerobic bioprocess
MSEMean squared error
ngCorrection factor for μH under anoxic conditions
nHCorrection factor for hydrolysis under anoxic conditions
NH4-NAmmonium nitrogen, charge +1
NSENash–Sutcliffe efficiency
NO3-NNitrate nitrogen, charge-1
OLROrganic loading rate
patmAtmospheric pressure
pch4Methane gas phase partial pressure
pco2Carbon dioxide gas phase partial pressure
pgasPressure of biogas
ph2oPartial pressure of water vapours
pjKinetic rate for process j
QeFlow rate of effluent wastewater
QinFlow rate of influent wastewater
QwFlow rate of excess sludge
RUniversal gas constant
Sch4Liquid methane concentration
Sch4,gasConcentration of methane gas in headspace
Sco2,gasConcentration of carbon dioxide gas in headspace
SISoluble inert COD concentration in wastewater
SICConcentration of inorganic carbon
SINConcentration of inorganic nitrogen
SNDSoluble biodegradable organic nitrogen concentration in wastewater
SNHSoluble “ammonia” nitrogen concentration in wastewater
SNOSoluble nitrate nitrogen (charge-1) concentration in wastewater
SOConcentration of dissolved oxygen
SRTSolid retention time
SSConcentration of readily biodegradable COD in wastewater
TTemperature
TNTotal nitrogen
TOCTotal organic carbon
TPTotal phosphorous concentration
TSsTotal solids
TSSsTotal suspended solids
VgasHead space volume
VliqLiquid volume
VSSsVolatile suspended solids
XBAActive autotrophic biomass
XbacGroup of bacteria
XBHActive heterotrophic biomass
XchConcentration of particulate carbohydrates
XIInert suspended organic matter concentration in wastewater
XliConcentration of particulate lipids
XNDSlowly biodegradable organic nitrogen concentration in wastewater
XPParticulate products from cell decay
XprConcentration of particulate proteins
XSSlowly biodegradable organic matter concentration in wastewater
YA Yield for autotrophic biomass
YHYield for heterotrophic biomass
μHMaximum specific growth rate for heterotrophic biomass
μAMaximum specific growth rate for autotrophic biomass

References

  1. Adam, M.R.; Othman, M.H.D.; Kurniawan, T.A.; Puteh, M.H.; Ismail, A.F.; Khongnakorn, W.; Rahman, M.A.; Jaafar, J. Advances in adsorptive membrane technology for water treatment and resource recovery applications: A critical review. J. Environ. Chem. Eng. 2022, 10, 107633. [Google Scholar] [CrossRef]
  2. Lange, J.; Takors, R.; Blombach, B. Zero-growth bioprocesses: A challenge for microbial production strains and bioprocess engineering. Eng. Life Sci. 2017, 17, 27–35. [Google Scholar] [CrossRef] [PubMed]
  3. Baek, S.H.; Jeon, S.K.K.; Pagilla, K. Mathematical modeling of aerobic membrane bioreactor (MBR) using activated sludge model no. 1 (ASM1). J. Ind. Eng. Chem. 2009, 15, 835–840. [Google Scholar] [CrossRef]
  4. Shin, C.; Tilmans, S.H.; Chen, F.; Criddle, C.S. Anaerobic membrane bioreactor model for design and prediction of domestic wastewater treatment process performance. Chem. Eng. J. 2021, 426, 131912. [Google Scholar] [CrossRef]
  5. Weinrich, S.; Nelles, M. Systematic simplification of the Anaerobic Digestion Model No. 1 (ADM1)—Model development and stoichiometric analysis. Bioresour. Technol. 2021, 333, 125124. [Google Scholar] [CrossRef] [PubMed]
  6. Batstone, D.J.; Puyol, D.; Flores-Alsina, X.; Rodríguez, J. Mathematical modelling of anaerobic digestion processes: Applications and future needs. Rev. Environ. Sci. Biotechnol. 2015, 14, 595–613. [Google Scholar] [CrossRef]
  7. Jimenez, J.; Latrille, E.; Harmand, J.; Robles, A.; Ferrer, J.; Gaida, D.; Wolf, C.; Mairet, F.; Bernard, O.; Alcaraz-Gonzalez, V.; et al. Instrumentation and control of anaerobic digestion processes: A review and some research challenges. Rev. Environ. Sci. Bio/Technol. 2015, 14, 615–648. [Google Scholar] [CrossRef]
  8. Gaida, D.; Wolf, C.; Bongards, M. Feed control of anaerobic digestion processes for renewable energy production: A review. Renew. Sustain. Energy Rev. 2017, 68, 869–875. [Google Scholar] [CrossRef]
  9. Loizidou, M.; Malamis, D.; Stamatoglou, A.; Solomou, N. Integrated system for the treatment of municipal wastewater and biodegradable solid waste. In Proceedings of the Fourth International Symposium on Energy from Biomass and Waste, Venice, Italy, 12–15 November 2012; pp. 1–9. [Google Scholar]
  10. Solomou, N.; Stamatoglou, A.; Malamis, S.; Katsou, E.; Costa, C.N.; Loizidou, M. An integrated solution to wastewater and biodegradable organic waste management by applying anaerobic digestion and membrane bioreactor processes. Water Pract. Technol. 2014, 9, 464–474. [Google Scholar] [CrossRef]
  11. Sari Erkan, H.; Bakaraki Turan, N.; Önkal Engin, G. Membrane Bioreactors for Wastewater Treatment. Compr. Anal. Chem. 2018, 81, 151–200. [Google Scholar] [CrossRef]
  12. Henze, M.; Gujer, W.; Mino, T.; van Loosedrecht, M. Activated Sludge Model No.1; IAWPRC: London, UK, 1987. [Google Scholar]
  13. Lahdhiri, A.; Lesage, G.; Hannachi, A.; Heran, M. Steady-state methodology for activated sludge model 1 (ASM1) state variable calculation in MBR. Water 2020, 12, 3220. [Google Scholar] [CrossRef]
  14. Batstone, D.J.; Keller, J.; Angelidaki, I.; Kalyuzhnyi, S.V.; Pavlostathis, S.G.; Rozzi, A.; Sanders, W.T.M.; Siegrist, H.; Vavilin, V.A. Anaerobic digestion model no. 1 (ADM1), IWA task group for mathematical modelling of anaerobic digestion processes. Water Res. 2002, 41, 4085–4096. [Google Scholar]
  15. Batstone, D.J.; Keller, J.; Angelidaki, I.; Kalyuzhnyi, S.V.; Pavlostathis, S.G.; Rozzi, A.; Sanders, W.T.; Siegrist, H.; Vavilin, V.A. The IWA Anaerobic Digestion Model No 1 (ADM1). Water Sci. Technol. 2002, 45, 65–73. [Google Scholar] [CrossRef] [PubMed] [Green Version]
  16. Weinrich, S.; Mauky, E.; Schmidt, T.; Krebs, C.; Liebetrau, J.; Nelles, M. Systematic simplification of the Anaerobic Digestion Model No. 1 (ADM1)—Laboratory experiments and model application. Bioresour. Technol. 2021, 333, 125104. [Google Scholar] [CrossRef] [PubMed]
  17. Donoso-Bravo, A.; Mailier, J.; Martin, C.; Rodrìguez, J.; Aceves-Lara, C.A.; Wouwer, A.V. Model selection, identification and validation in anaerobic digestion: A review. Water Res. 2011, 45, 5347–5364. [Google Scholar] [CrossRef] [PubMed]
  18. Pavlostathis, S.G.; Giraldo-Gomez, E. Kinetics of Anaerobic Treatment: A Critical Review. Crit. Rev. Environ. Control 1991, 21, 411–490. [Google Scholar] [CrossRef]
  19. Dubois, V.; Falipou, E.; Boutin, C. Quantification and qualification of the urban domestic pollution discharged per household and per resident. Water Sci. Technol. 2022, 85, 1484–1499. [Google Scholar] [CrossRef] [PubMed]
  20. Eurostat Statistics Explained Translate Food Waste and Food Waste Prevention—Estimates. Eurostat. Available online: https://ec.europa.eu/eurostat/statistics-explained/index.php?title=Food_waste_and_food_waste_prevention_-_estimates (accessed on 12 March 2023).
  21. Barampouti, E.M.; Mai, S.; Malamis, D.; Moustakas, K.; Loizidou, M. Liquid biofuels from the organic fraction of municipal solid waste: A review. Renew. Sustain. Energy Rev. 2019, 110, 298–314. [Google Scholar] [CrossRef]
Figure 1. Simplified flow chart of the integrated MBR–AD system.
Sustainability 15 11455 g001
Figure 2. Feeding schedule and OLR of each experimental phase during the anaerobic digestion process.
Sustainability 15 11455 g002
Figure 3. Measurements and simulated values of VSS concentration derived from the calibration of the model.
Sustainability 15 11455 g003
Figure 4. Measurements and simulated values of TN concentration derived from the calibration of the model.
Sustainability 15 11455 g004
Figure 5. Active biomass concentration: heterotrophic XBH and autotrophic XBA as predicted from the model.
Sustainability 15 11455 g005
Figure 6. Measured and predicted values of (a) COD, (b) NH4-N, (c) TN, (d) VSS.
Sustainability 15 11455 g006aSustainability 15 11455 g006b
Figure 7. Experimental values of biogas production for all phases, as well as the calibrated (1st and 2nd phases) and simulated (3rd to 5th phases) values.
Sustainability 15 11455 g007
Table 1. Operational conditions of the aerobic MBR system.
Parameter1st Stage2nd Stage3rd Stage4th Stage
Operating period (d)458913134
Type of feedstockPrimary effluentPrimary effluent and liquid digestatePrimary effluent and liquid digestatePrimary effluent and liquid digestate
Qin (m3/d)1.51.51.53.0
SRT (d)20304040
HRT (h)24242412
Table 2. Petersen matrix of aerobic bioprocesses in accordance with ASM1 [3,12].
Component ij Process1 (SI)2 (Ss)3 (XI)4 (XS)5 (XBH)6 (XBA)7 (XP)8 (SQ)9 (SNO)10 (SNH)11 (SND)12 (XND)Process Rate (pj)
1. Aerobic growth of heterotrophs 1 Y H 1 1 Y H Y H iXB iXB fpiXP μ H S S K S + S S S O K OH + S O X B H
2. Anoxic growth of heterotrophs 1 Y H 1 1 Y H 2.86 Y H iXB μ H S S K S + S S S O K OH + S O S NO K NO + S NO X B H
3. Aerobic growth of autotrophs 1 4.57 Y A Y A 1 Y A iXB  1 Y A μ A S NH K NH + S NH S O K OA + S O X BA
4. Decay of heterotrophs 1 fp 1 fp iXB fpiXPbHXBH
5. Decay of autotrophs 1 fp 1fp bAXBA
6. Ammonification of soluble organic nitrogen 1 1 kaSNDXBH
7. Hydrolysis of entrapped organics 1 1 k H X S / X BH K X X S / X BH S O K OH + S O + n H K OH K OH + S O S NO K NO + S NO X B H
8. Hydrolysis of entrapped organic nitrogen 1 1 ρ 7 Χ ND X S
9. Sludge removal XI XS XBH XBA XP −XND 1 s l u d g e   a g e
Table 3. Model structure of the simplified ADM1-R4 model.
Component i →1234567891011
j Process ↓Sch4SICSinSh2oXchXprXliXbacSch4,gasSco2,gas Process Rate pj
1 Fermentation Xch0.24820.6809−0.0207−0.0456 1 0.1372 kch Xch
2 Fermentation Xpr0.32210.79540.1689−0.4588 1 0.1723 kpr Xpr
3 Fermentation Xli0.63930.5817−0.0344−0.4152 10.2286 kli Xli
4 Decay Xbac0.32470.76410.1246−0.38220.180.770.05 1 kdec Xbac
5 Phase transition Sch4 1 V l i q V g a s KLa (Sch4 16KH,ch4 pch4)
6 Phase transition Sic 1 V l i q V g a s KLa (SIC 44KH,co2 pco2)
Algebraic equations
p ch 4 = S ch 4 , gas RT 16 p co 2 = S co 2 , gas RT 44 p gas = p ch 4 + p co 2 + p h 2 o q gas = k p p gas p atm p gas p atm
Table 4. Physicochemical characterization of the utilized substrates in all experimental phases.
Phase
1st2nd3rd4th5th
TS (%)9.6910.1812.4910.2911.62
VS (%TS)90.6194.0594.0393.0893.25
Ash (%TS)9.395.955.976.926.75
Carbohydrates (%TS)4.1065.5265.4360.2260.61
Proteins (%TS)2.4112.3512.3813.5113.32
Lipids (%TS)1.9222.1022.0718.1419.85
NH4-N (mg/L)0.570.270.140.290.52
Table 5. Literature and calibrated values of kinetic parameters of the model describing the aerobic MBR reactor.
ParametersTypical Values
at 20 °C [12]
Values Suggested by Baek et al. [3]Calibrated Values
bA0.050.0480.05
bH0.220.220.20
fP0.080.080.08
iXB0.0860.0880.088
ixp0.060.060.06
ka0.080.0820.075
kH333.4
KNH10.941.03
KNO0.50.450.55
KOA0.40.10.4
KOH0.20.190.25
KS2020.318
KX0.030.040.04
YA0.240.280.17
YH0.670.690.71
ng0.90.90.9
nH0.40.40.4
μA0.80.670.83
μH66.97.2
Table 6. Literature and calibrated values of kinetic constants of the anaerobic process simulation.
Kinetic
Parameters
Calibrated ValuesADM1 Mesophilic High Rate [14]ADM1
Mesophilic
Solids [14]
ADM1 Thermophilic Solids [14]ADM1-R4 [5]
kch (d−1)0.410.2510100.25
kpr (d−1)0.250.210100.2
kli (d−1)0.090.110100.1
kdec (d−1)0.020.020.020.040.02
KLa (d−1)180200200200200
Table 7. Methane content of produced biogas during anaerobic digester operation.
Experimental Phases
1st2nd3rd4th5th
Methane content (%v/v)5658565959
Disclaimer/Publisher’s Note: The statements, opinions and data contained in all publications are solely those of the individual author(s) and contributor(s) and not of MDPI and/or the editor(s). MDPI and/or the editor(s) disclaim responsibility for any injury to people or property resulting from any ideas, methods, instructions or products referred to in the content.