1. Introduction
The energy crisis and the international conflicts have led to considerable repercussions in several sectors, foregrounding issues such as energy transition and energy saving. As is known, reductions in operational energy needs in the building sector are an extremely topical priority [
1]. Among other reasons, hospitals are energy-intensive because they operate all day long for the whole year to ensure optimal service for patients, and they require three times more energy than other public buildings [
2]. For instance, Shi et al. [
3] estimated an average energy consumption of 180 kWh/(m
2·year) in the cold region of China. All told, as stated by de Oliveira et al. [
4], energy management can favor the alignment of the health sector with sustainability goals. However, as recognized by Wang et al. [
5], the main obstacles to the energy efficiency improvement of this sector are poor economic incentives and a lack of appropriate technology and enforceable laws and regulations.
Basically, electricity is used to power different medical equipment; for heating, ventilation, and air-conditioning systems (HVAC); for lighting [
6]; for the operation of security systems; and for the acquisition of electronic data. Furthermore, the demand for thermal energy is mainly associated with the production of domestic hot water and all related services, such as sterilization, laundry, and kitchens.
Each structure may include various forms of medical equipment that affect energy consumption differently. Indeed, operating theatres and energy-intensive X-ray and tomography equipment require more energy than ward rooms and day clinics [
7]. As noted by Szklo et al. [
8], the timing and type of medical services and the efficiency of medical equipment influence the overall building energy quality. Nevertheless, García-Sanz-Calcedo et al. [
9] found that the number of annual discharges, the number of emergency operations, and the number of admissions are closely related to energy consumption. As pointed out by Gonzalez et al. [
10], there is also a dependency on the whole building surface, the number of beds, and the number of hospital employees. According to Hwang et al. [
11], in a study of four hospitals in Seoul with different sizes and construction ages, the building area and the main configurations of equipment and its usage ratio, strongly influence energy requirements. Moreover, as found by Zini et al. [
12], for a typical Italian climate, HVAC consumption is mainly driven by the external air temperature in order to satisfy strict safety and comfort standards. A data-driven predictive control method [
13] for the smart management of HVAC systems can help increase efficiency, reducing energy costs. The typical HVAC system is based on a combination of several electric heat pumps and air treatment units [
14]; however, other systems can be found [
15], such as variant refrigerant flow (VRF), combined heat and power systems (CHP), waste heat recovery exchangers, and steam-heat-recovery technology. As reported by Fiefeld et al. [
16] in the UK, HVAC systems account for 44% of the total energy used in hospitals, and many efficiency measures could be applied. For instance, in Malaysia [
17], many healthcare facilities have replaced their chillers with magnetic-bearing chiller compressors.
On the other hand, the role of the building envelope is also very important [
18] for the passive control of indoor conditions; indeed, reducing heat losses during the winter, as well as solar gains during the summer, allows for the optimization of the building’s total energy performance. In this regard, Cesari et al. [
19] analyzed the role of windows in several rooms with different orientations at a hospital located in Bologna (Italy); they showed that the adoption of appropriate glazing can reduce energy demands, but it could, at the same time, lead to an increase in lighting services. However, as stated by Ascione et al. [
20], the refurbishment of the building envelope is always convenient when the aim is the improvement of indoor comfort and reducing energy needs and costs.
Moreover, Billanes et al. [
21] suggested using renewable energy sources. In this regard, Peirow et at. [
22], for a hospital located in Tehran with more than 250 beds, found an optimal solution in the installation of a photovoltaic system with a peak power level of 350 kW, a wind turbine of around 25 kW and to manage the uncertainty of the renewable sources a diesel generator (600 kW) and a battery with a capacity of 100 kWh. Likewise, Kassem et al. [
23], for a hospital located in Lefkosa, found that an optimal PV configuration (180° azimuth angle and −35° tilt angle) leads to good economic feasibility, with a payback period of nearly three years. Kahwash et al. [
24], in accordance with the National Health Service’s (UK) goals to become a net-zero healthcare provider, studied the installation of a hybrid renewable energy system. The results showed savings of approximately 2000 tons of CO
2 over 25 years. Buonomano et al. [
25] proposed, regarding the energy retrofitting of a university hospital in Naples, the adoption of a solar heating and cooling system based on a field of photovoltaic/thermal-concentrating collectors coupled with a single-stage LiBr-H
2O absorption chiller and thermal storage tanks. For the climate of Finland, according to the calculations of Kantola et al. [
26] for Espoo Hospital, the most affordable solutions are biogas energy, wood-chip heating, and ground-source heating. Moreover, Moon et al. [
27] studied the use of a ground-source heat pump system for a hospital located in Busan, Republic of Korea.
Finally, it is also interesting to remark that, during emergencies, hospitals may require large amounts of oxygen. Thus, Izadi et al. [
28], for a case study in Tehran (Iran), designed a system with a PV of around 976 kW with 179 kW fuel cells and a 171.2 kW electrolyzer; this satisfies the energy demand in 76% of cases, and, at the same time, ensures an annual production rate of 67,833 oxygen capsules.
The available research points out several aspects that must be taken into account in the energy refurbishment of hospitals. First of all, the analysis of the facts requires the diversification of energy vectors for each use, with accurate inspections and measures in order to identify specific efficiency measures and evaluate their impact on the considered aspects (HVACs, equipment, lighting, air quality, and so on). However, there is a lack of methods for leading market operators, hospital managers, and designers in this type of analysis. Moreover, the collected information can bring to the definition of the numerical model of the building–HVAC system, but in this case, the validation or calibration procedure does not recur often. What kind of benchmark values can be used? What kind of tolerance can be assumed in the comparison of simulated consumption and energy billing values? Briefly, the literature recognizes great potentialities in terms of energy saving, but there is not a complete method that can lead to refurbishment designs. On the other hand, the selection and evaluation of efficiency measures must take into account different objectives: energy and cost reduction, the improvement of indoor thermal comfort, high levels of air quality, the lighting power required for medical activities, and pollution limitations.
Herein, the main novelty of the study is discussed. A complete multistage method for designing energy efficiency measures for hospitals in a Mediterranean climate is proposed and applied to a case study. It consists of a detailed energy audit via in situ surveys; performance measures of the building envelope and HVAC systems; indoor environmental measures and a detailed analysis of all energy vectors. The aim is to make a detailed study of the energy balance of each hospital use and a comparison with reference values. Then, several indices are proposed for the economic, environmental, and energetic evaluation of energy efficiency measures.
2. Energy Diagnosis and Refurbishment of High-Intensive Building: Method
The first step of the proposed approach is an energy audit. In order to simulate reliable energy performance, the numerical model of the building–HVAC system can be defined using data acquired from in situ surveys, interviews with managers and occupants, and in-field measurements based on a tailored approach [
29]. This process must represent the actual energy consumption and indoor conditions of the hospital under investigation.
For this reason, the characterization of the building envelope must be performed to obtain the geometrical and thermophysical characteristics of all elements. In this case, it is considerable the measurement of thermal transmittance according to ISO 9869 [
30]. Moreover, for each representative element, it is necessary to identify and characterize the shape and/or structure of individual thermal bridges. This can be achieved using infrared thermography according to the EN 13187 standard [
31].
The peculiarity of hospitals is represented by their large number of thermal zones with different required environmental controls; thus, the required energy should be based on a schematic representation of all thermal zones grouped according to their activities and type of HVAC system. The main data on the installed equipment (number, power, and so on) and their typical usage schedules, occupation rates, and timing with respect to systems must be determined, as well as data on any installed emitters, including information regarding generation subsystems by which they are served.
Considering the role that indoor quality can play in the efficiency of medical activities and the healing process, a monitoring plan must be implemented to evaluate internal environmental variables useful for characterizing thermo-hygrometric comfort and air quality. According to the UNI EN ISO 7730 standard [
32], the main parameters to monitor are air temperature, relative humidity, airspeed, and global temperature. These values allow to calculate the PMV (Predicted Mean Vote) and the PPD (Predicted Percentage Dissatisfied). Another fundamental parameter to be monitored is the indoor CO
2 concentration, which can be related to the class of air quality for buildings with and without controlled mechanical ventilation [
33].
An HVAC audit also requires that the entire system be broken down into its different subsystems: emission, regulation, distribution, storage, and generation. This procedure helps determine losses and the efficiency of each subsystem, as well as its impact on the total energy performance. To this aim, several measures using sub-meters can help build a detailed energy balance.
All acquired data can be used to define the model of the building; start the calibration process; and, thus, the comparison of the simulation output with the experimental data, assessing deviations in the results and the degree of uncertainty. As part of the energy audit, the collection of historical energy consumption values requires the identification of the main energy sources and the analysis of supply contracts over a statistically significant period, usually 3 years.
Then, the calibration of the numerical model can be performed using the congruence factor (FC), defined as the ratio between the average consumption of bills from the last three years and those estimated via the calculation program. Based on the percentage deviation, the model is characterized by
− High Congruity: deviation does not exceed 5%;
− Medium Congruity: deviation is not more than 10%,
− Low Congruity: deviation is not more than 15%;
− Non-Compliance: deviation is greater than 15%.
The second step of the proposed approach involves the evaluation of the energy and environmental quality of the building and the analysis of possible efficiency measures. This phase starts with the analysis of indoor environmental quality by detecting discomfort phenomena or wrong management strategies.
In buildings served by a mechanical ventilation system for heating and/or cooling, a method for identifying the acceptability range to be used for comfort assessment has been developed according to the standards of EN 16798. These standards classify rooms for comfort purposes into four categories: Category I (high level of expectation) requires a PPD lower than 6% and a PMV in an interval of ±0.2. Similarly, for the classification according to air quality, the design CO2 concentration above the outdoor concentration for Category I is 550 ppm.
A further fundamental aspect is the evaluation of energy performance indicators and their comparison with sector benchmarks. Indeed, benchmarking energy consumption with other companies in the sector is a powerful tool for assessing performance and improving energy efficiency by analyzing trends in energy consumption and energy costs.
Starting with these evaluations, it is possible to design efficiency measures that can be evaluated for multi-objective purposes: the minimization of energy and environmental indices and costs (mainly the operating one). Achievable savings in terms of primary energy and avoided emissions can be calculated based on the difference between the proposed refurbishment and the state of fact. The economic analysis is aimed at evaluating the actual convenience of the proposed interventions, which must guarantee, thanks to energy savings, an economic return on the investment within an acceptable timeframe. The economic analysis can be based on the UNI EN 15459-1 standard [
34]. In particular, the simple payback period (SPB), the net present value (NPV), the internal rate of return (IRR), and the initial investment (I0) can be considered.
3. Case Study Energy Audit
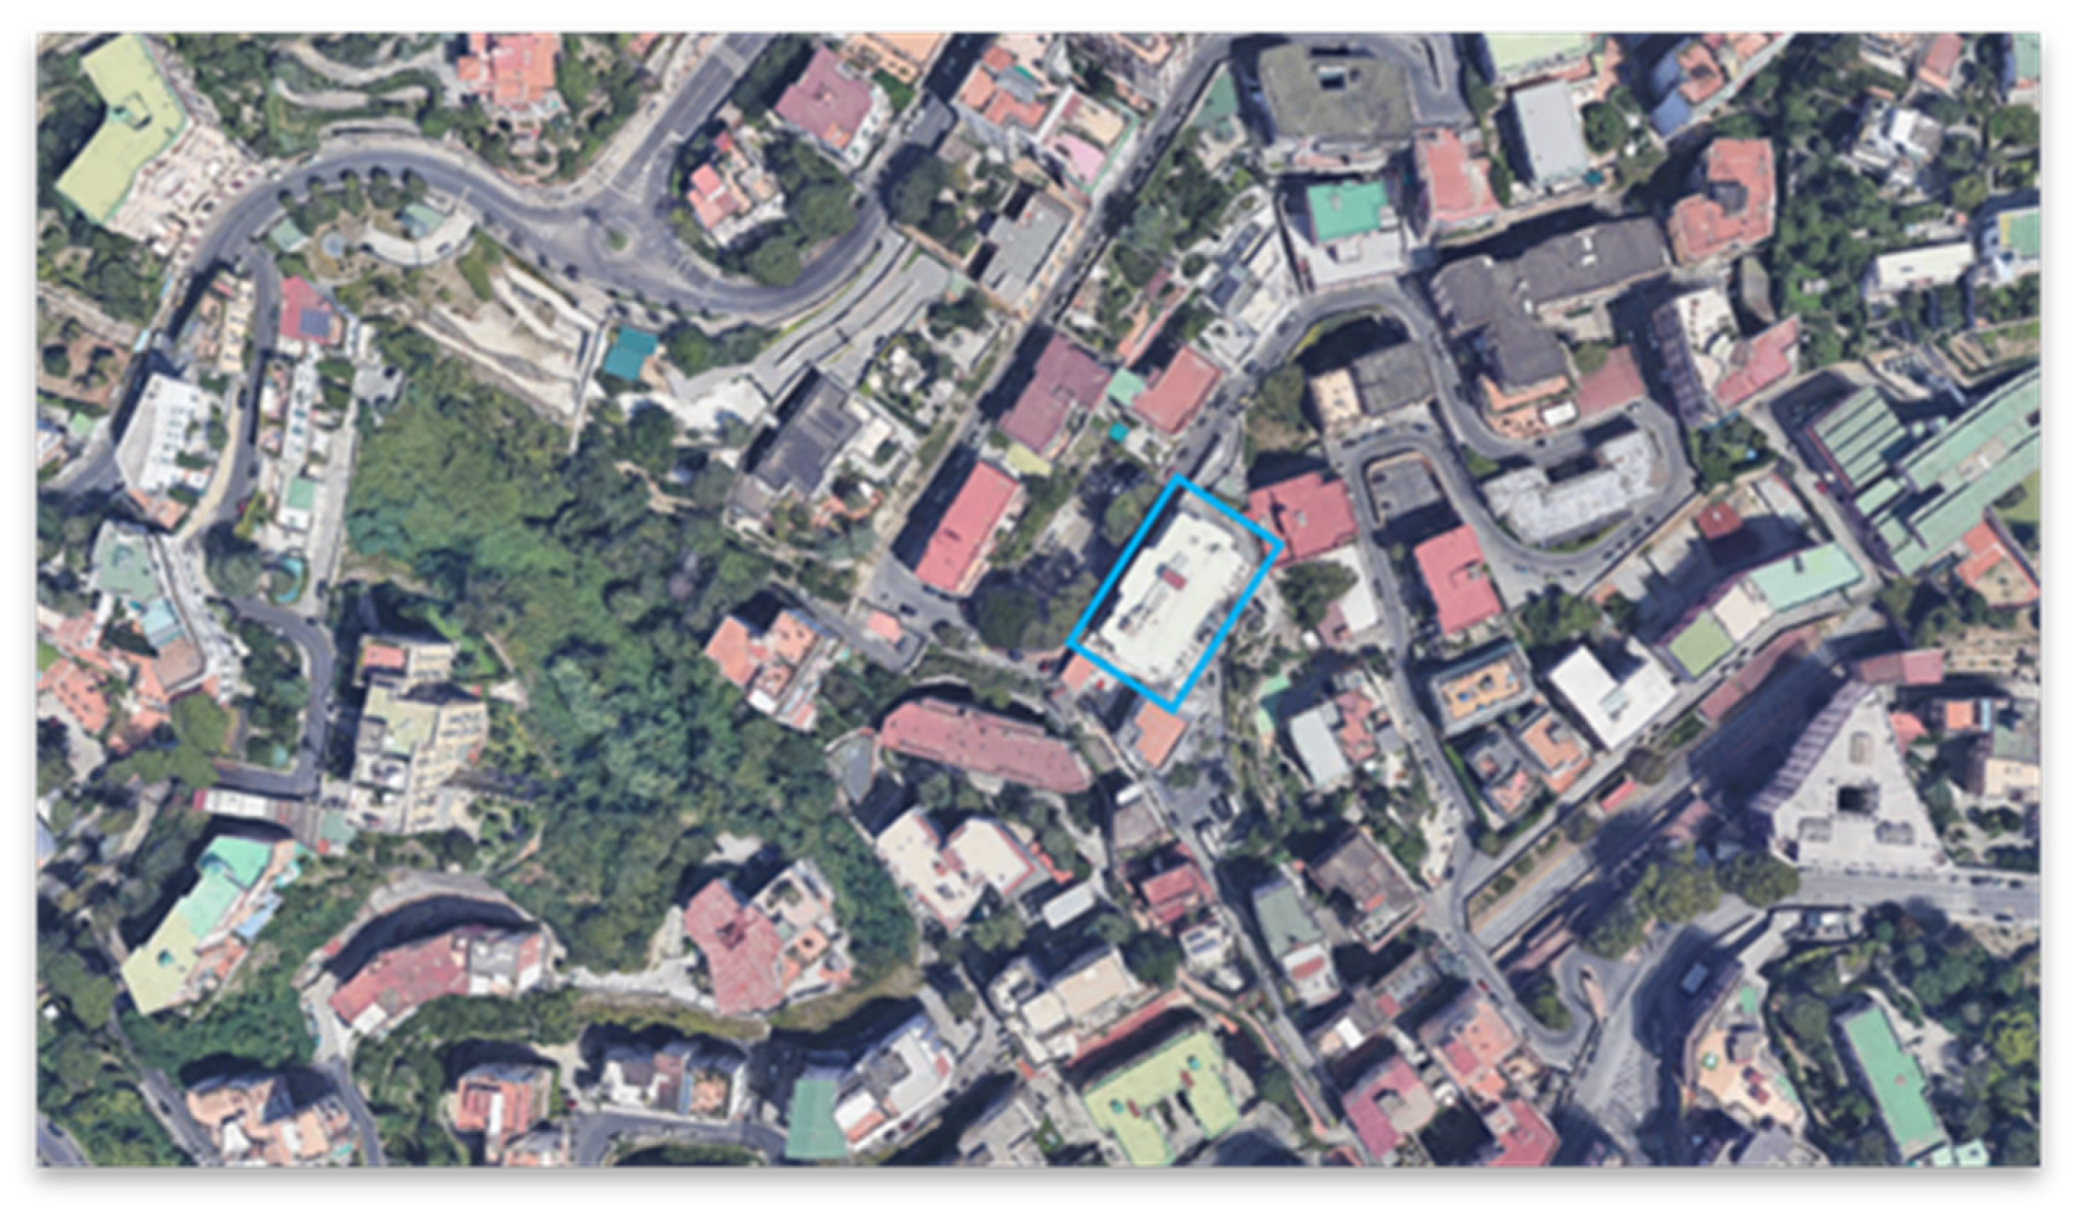
The case study is “Clinica Ruesch” (in Italian), a private hospital in the center of Naples (Southern Italy) in a green, quiet, and very beautiful location (
Figure 1). The climate is Mediterranean, with mild, rainy winters and hot, sunny summers. The daily average temperature ranges from 9 °C in January to 26 °C in August. According to the classification of UNI 10349—part 2 [
35], Naples is inside climatic zone C (1034 heating degree days), and design values such as outdoor temperature and outdoor relative humidity are, respectively, 2.00 °C and 48.8% for winter and 32.4 °C and 45.0% for summer.
Clinica Ruesh hosts 60 beds arranged in 31 rooms, and it is distributed over six levels with two semi-basement floors for a total covered surface area of around 6000 m2. The building has a net floor area of 2922 m2, a net air-conditioned volume of 9577 m3, a window-to-wall ratio of 5.4%, and a surface-to-volume ratio (S/V) of 0.36.
3.1. Building Envelope
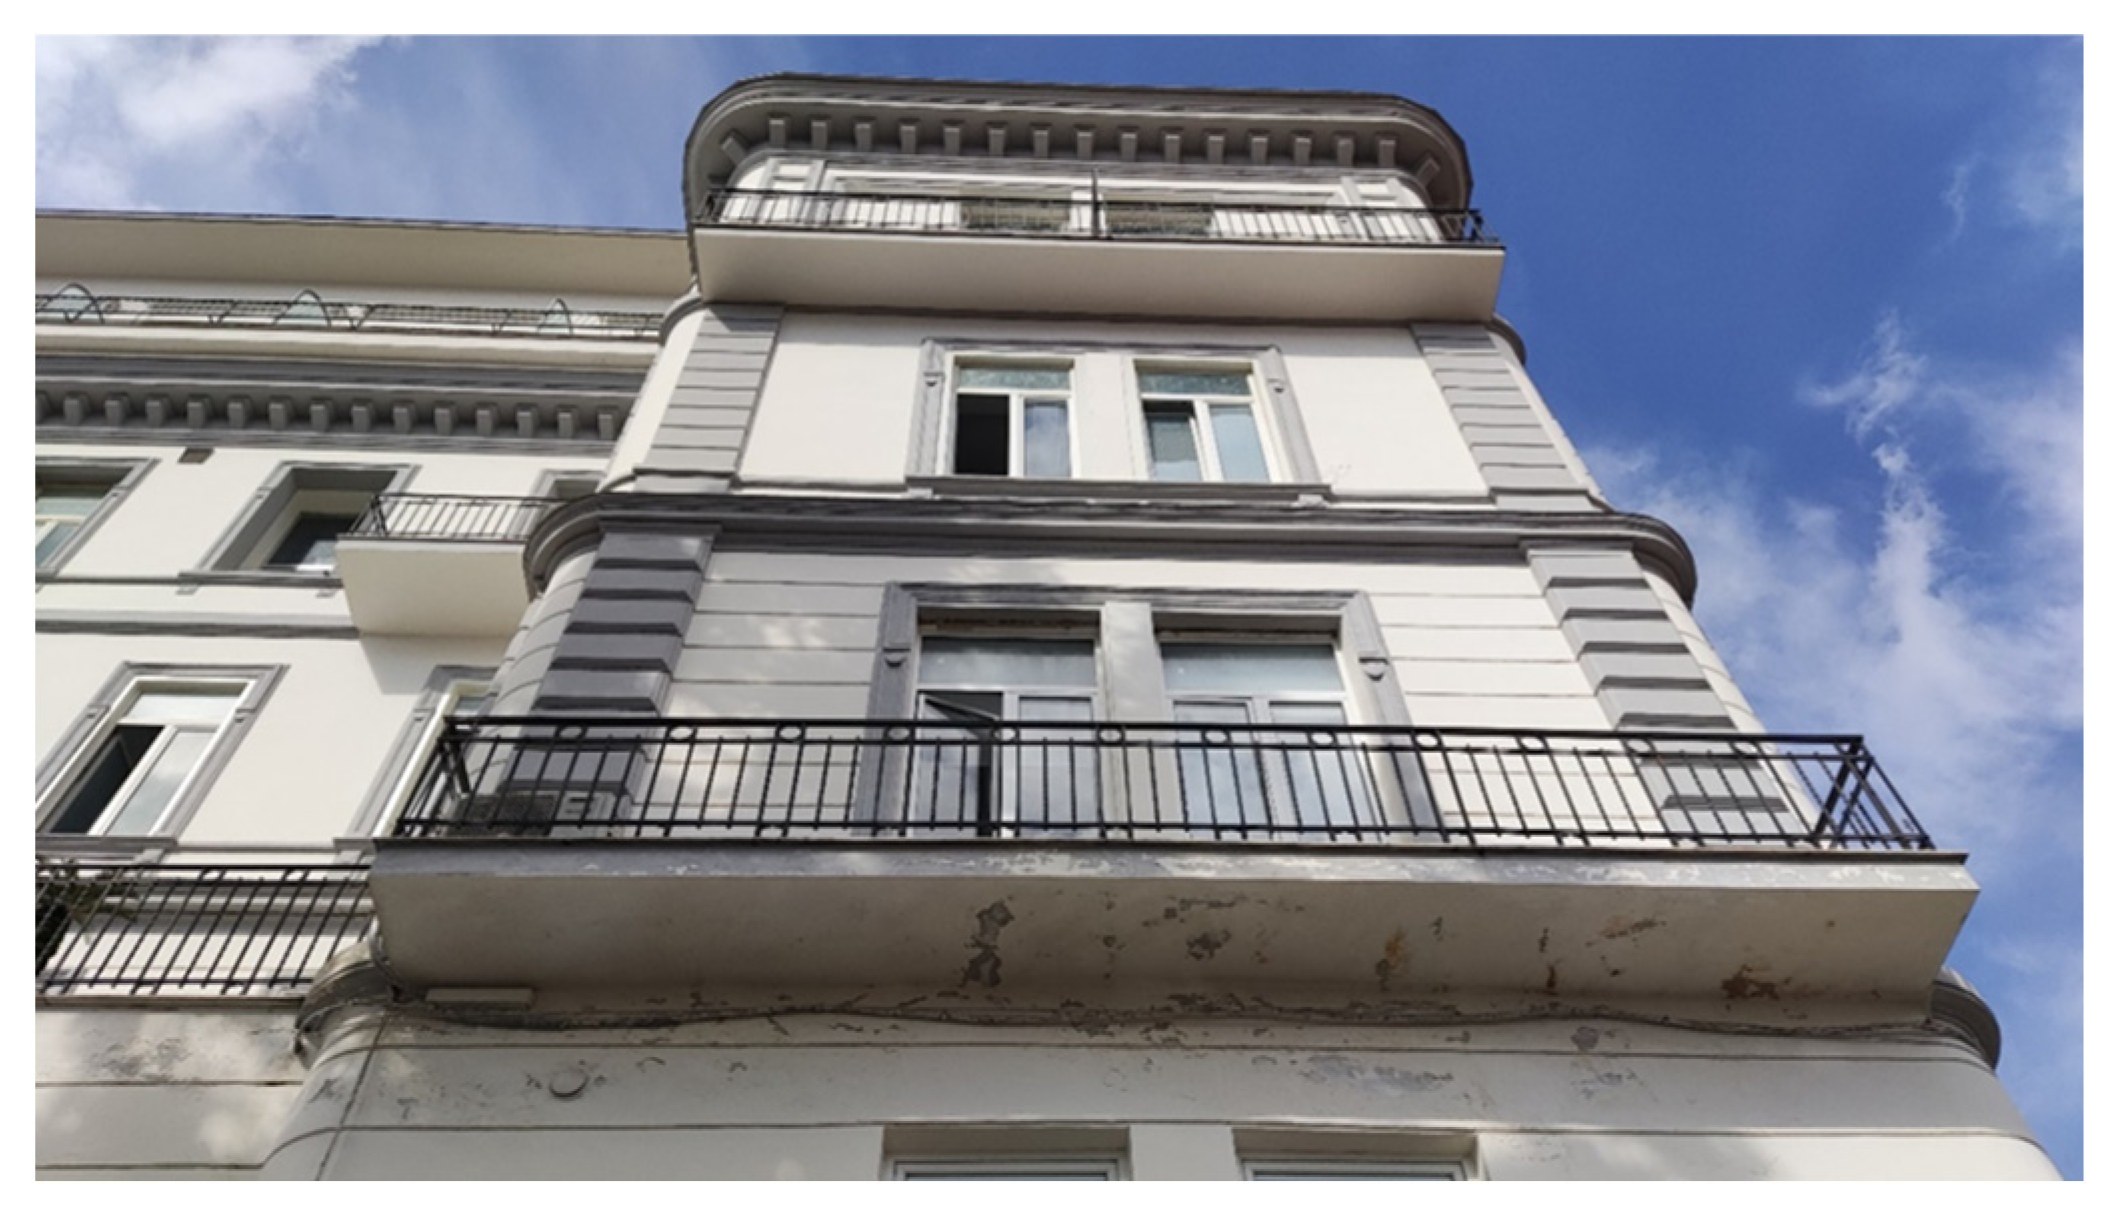
In this section, an overview of the characteristics of the opaque and glazed envelope (
Figure 2) is presented based on technical office interviews and design documents.
Regarding vertical opaque envelope, two types of solutions were identified: tuff walls and concrete walls, with or without thermal insulation. Except for the third floor, tuff walls characterize the façades facing south, east, and west. The underground walls are made of concrete; meanwhile, the north façades are mainly characterized by an insulated concrete stratigraphy, as are all the façades of the third floor. The application of 6 cm of expanded polystyrene (EPS) on the external side is the result of a partial retrofit intervention completed in 2022.
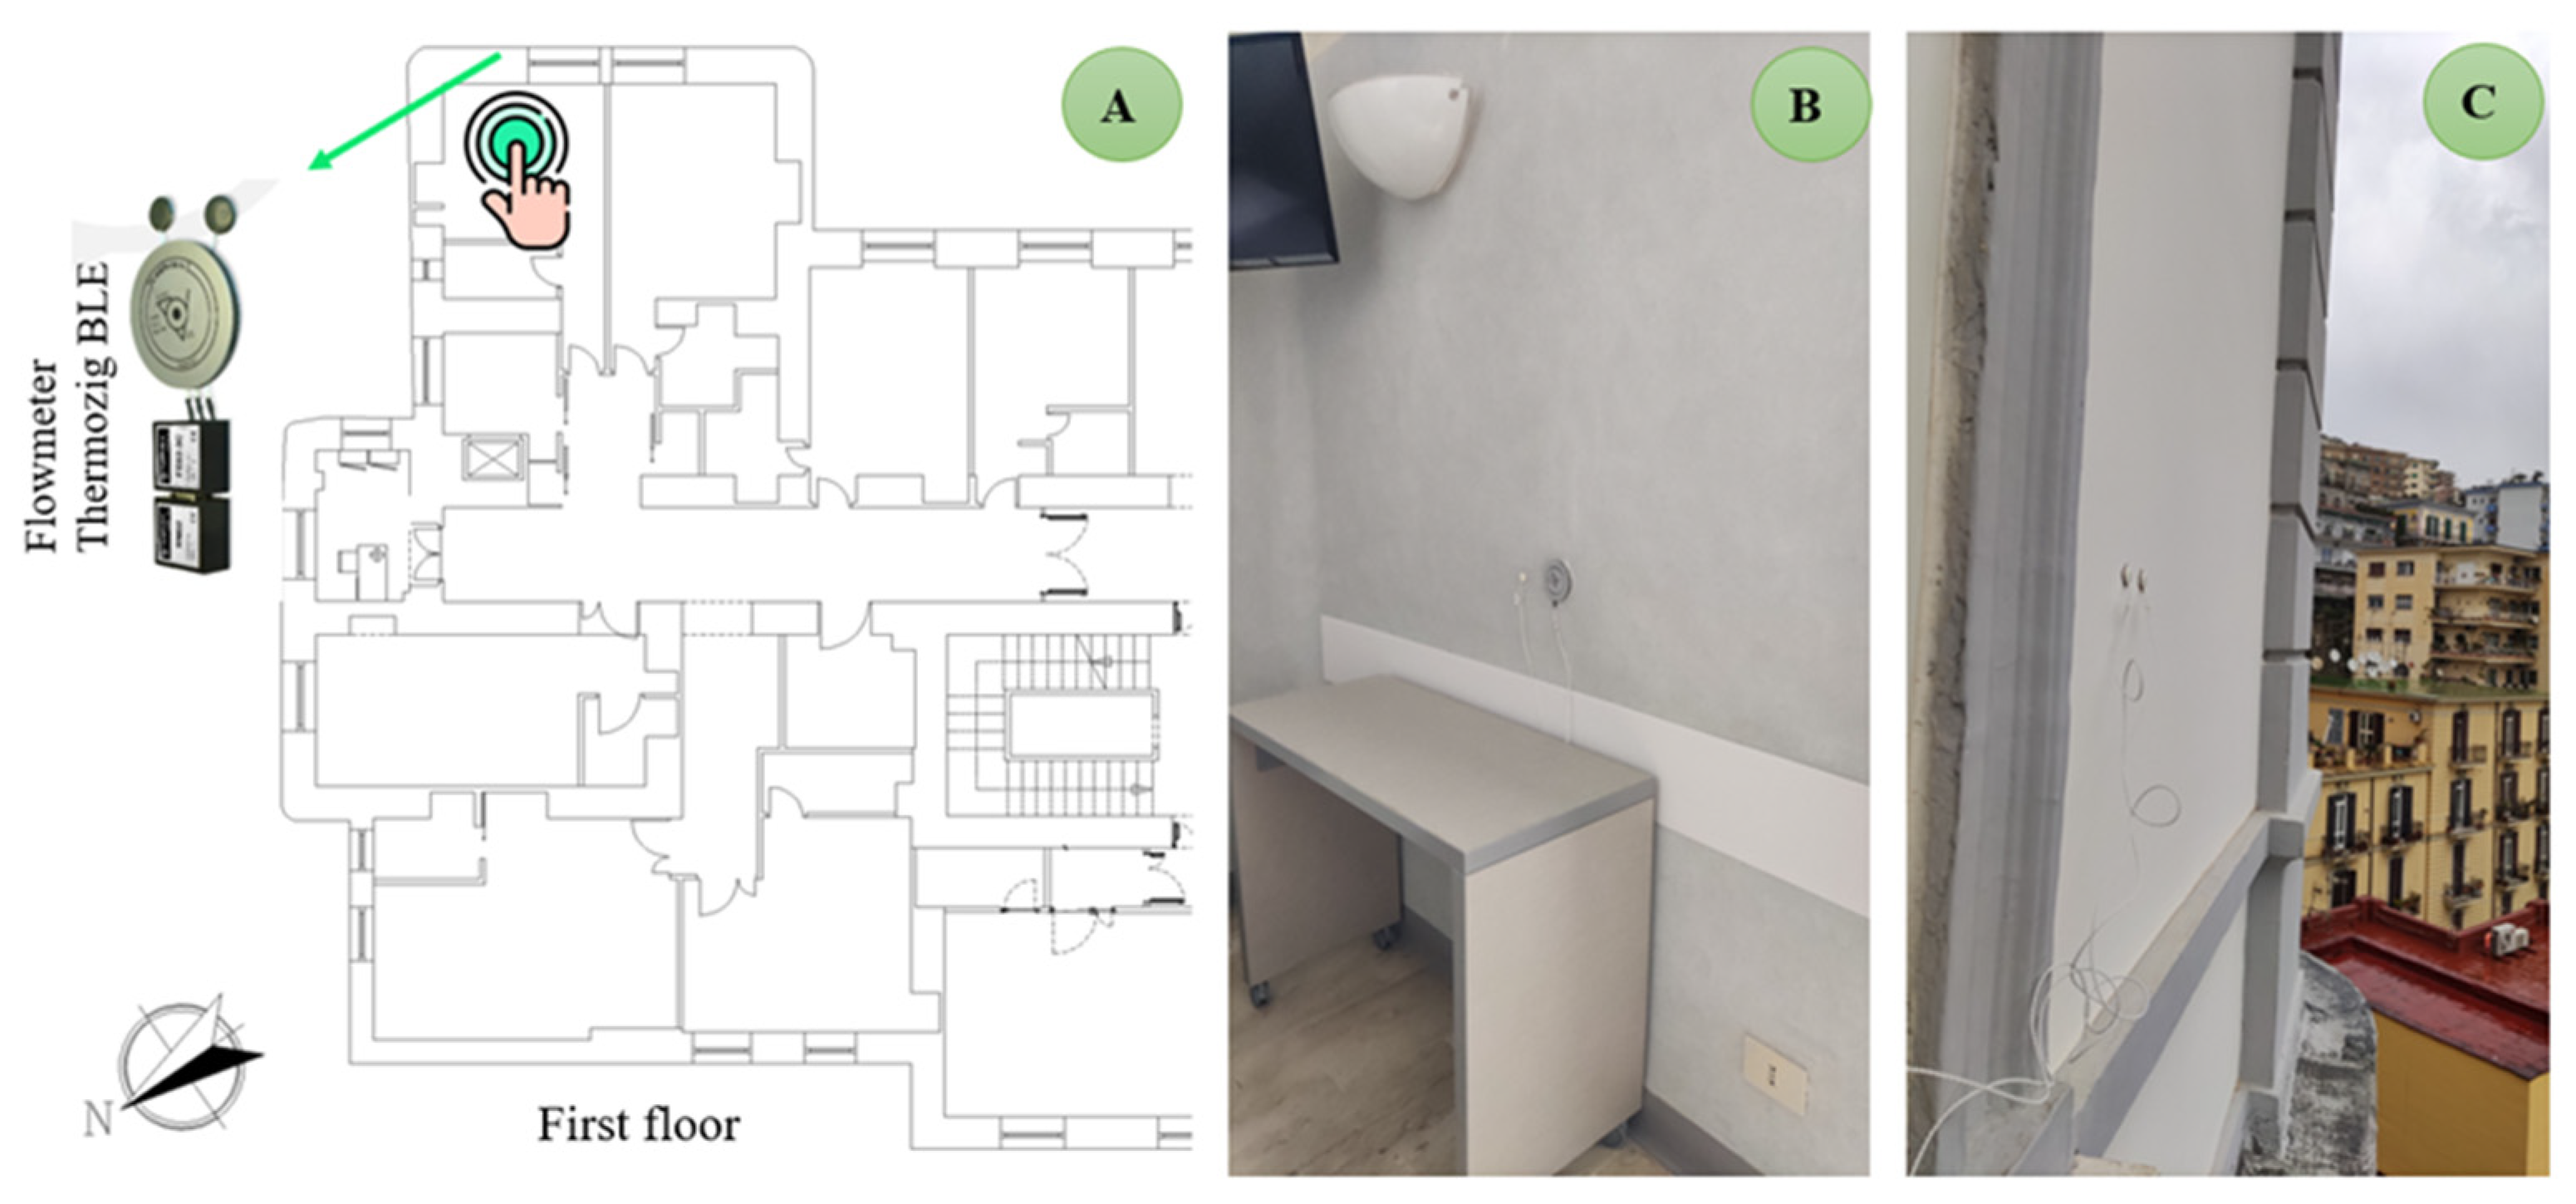
The tuff walls account for around 51% of the vertical opaque envelope. Since it was representative of the main building’s façades, an in situ measurement of thermal transmittance was performed using a Thermozig BLE wireless thermal flowmeter. The measurement was performed for a wall with a total thickness of 80 cm, covered both internally and externally with plaster. The minimum distance of the sensors from the thermal bridges was 90 cm, and the height from the floor was 1.0 m.
Figure 3 shows the positions of the sensors.
The measurement period was approximately 7 days (from 11:53 a.m. on 6 March 2023 to 10:23 a.m. on 13 March 2023), with an acquisition period of 30 min. During the campaign, the average internal temperature was 22 °C, and the average internal–external difference was 8.0 °C, which is compatible with the requirements of the standard. The average flux through the element was 4.48 W/m
2. The calculated U-value was 0.54 W/m
2 K. Starting with this measure, a reverse procedure was performed to obtain the theoretical thermal conductivity value of the tuff that was used in the construction of elements with other thicknesses.
Table 1 shows the thickness (t) and thermophysical characteristics—that is, the thermal conductivity (λ), surface mass (M), specific heat (c), and thermal resistance (R)—of the wall that underwent transmittance measurements.
Table 2 shows the properties of the layers that make up the insulated outer concrete wall, with a prevalence of 39%. For an average thickness of 53 cm, the calculated U-value of the concrete block is 0.278 W/m
2 K, according to [
36].
Considering the same properties proposed in
Table 2, for the uninsulated concrete wall, and assuming the thickness of the concrete blocks to be 65 cm, the calculated U-value is 0.455 W/m
2 K.
In terms of the horizontal opaque envelope, the floor against the ground is reinforced concrete with a U-value of 1.266 W/m2 K. The remaining floors and roofs are made of a hollow-core slab. Each floor is characterized by a false ceiling with a variable cavity for each thermal zone of the hospital in order to guarantee the passage of the distribution lines of all air systems. The U-value varies from 1.104 to 1.442 W/m2 K.
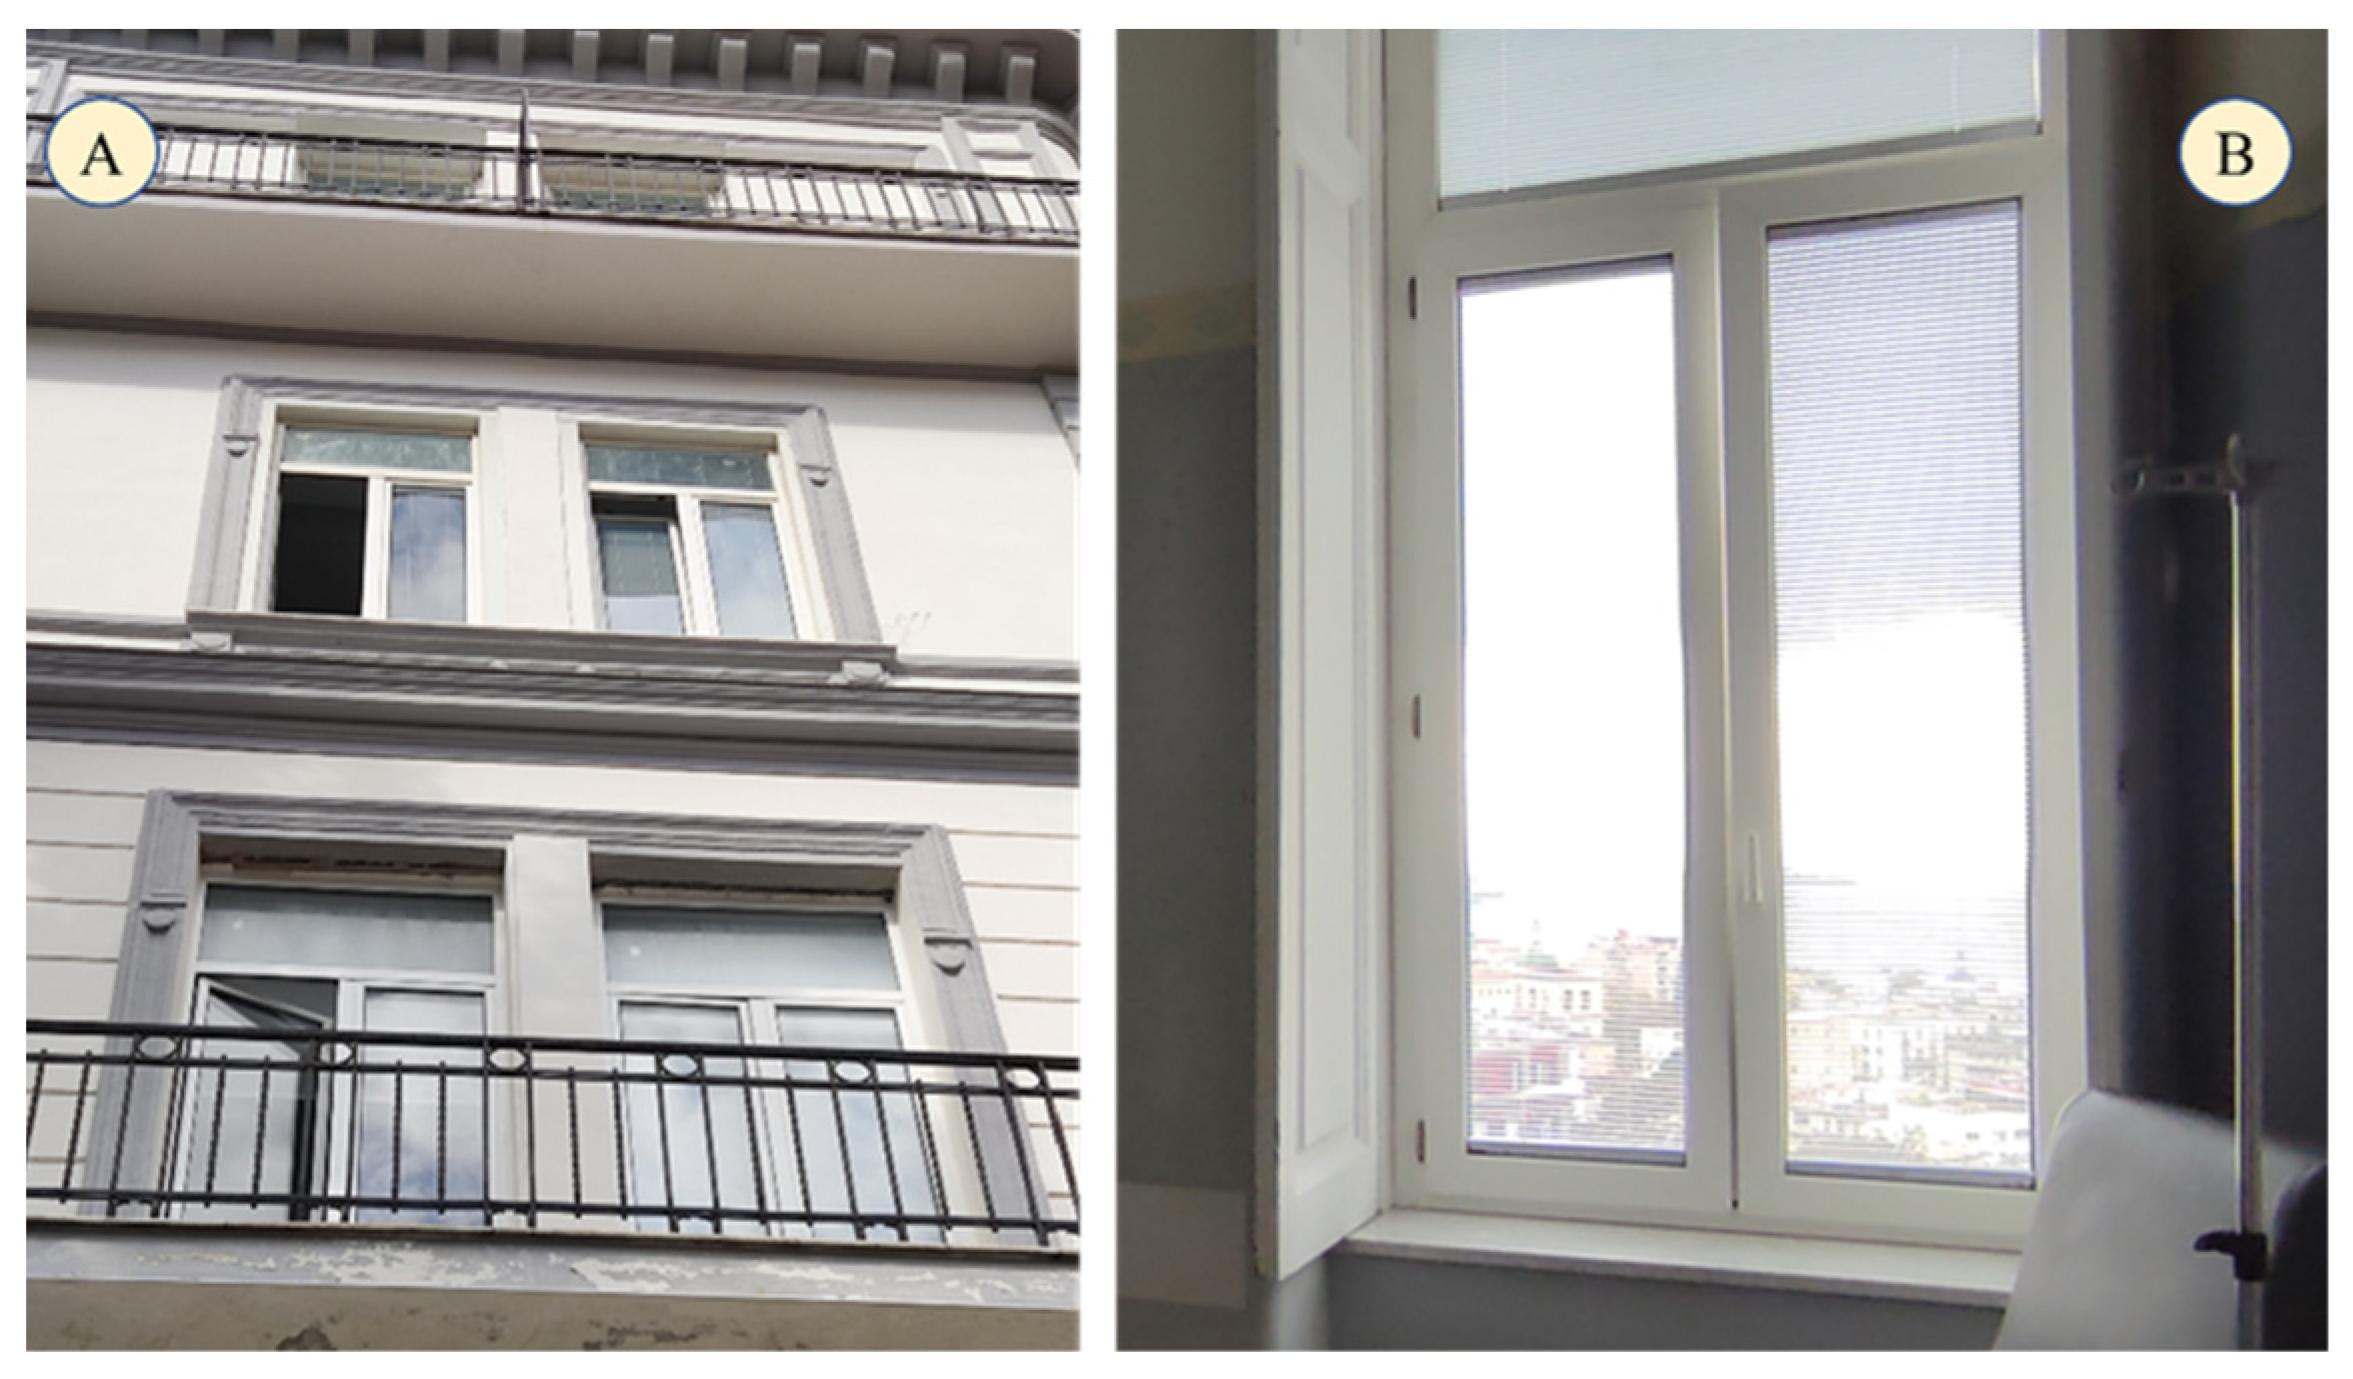
Figure 4 shows the windows of the hospital, made of PVC frames and double-clear glass (4 mm) with 12 mm air-filled spacers.
Table 3 reports the window surface area (S
w) for each level and exposure; the total glazed surface area (S
g,tot) for each level; and the average thermal transmittance of the window (U
w,mean).
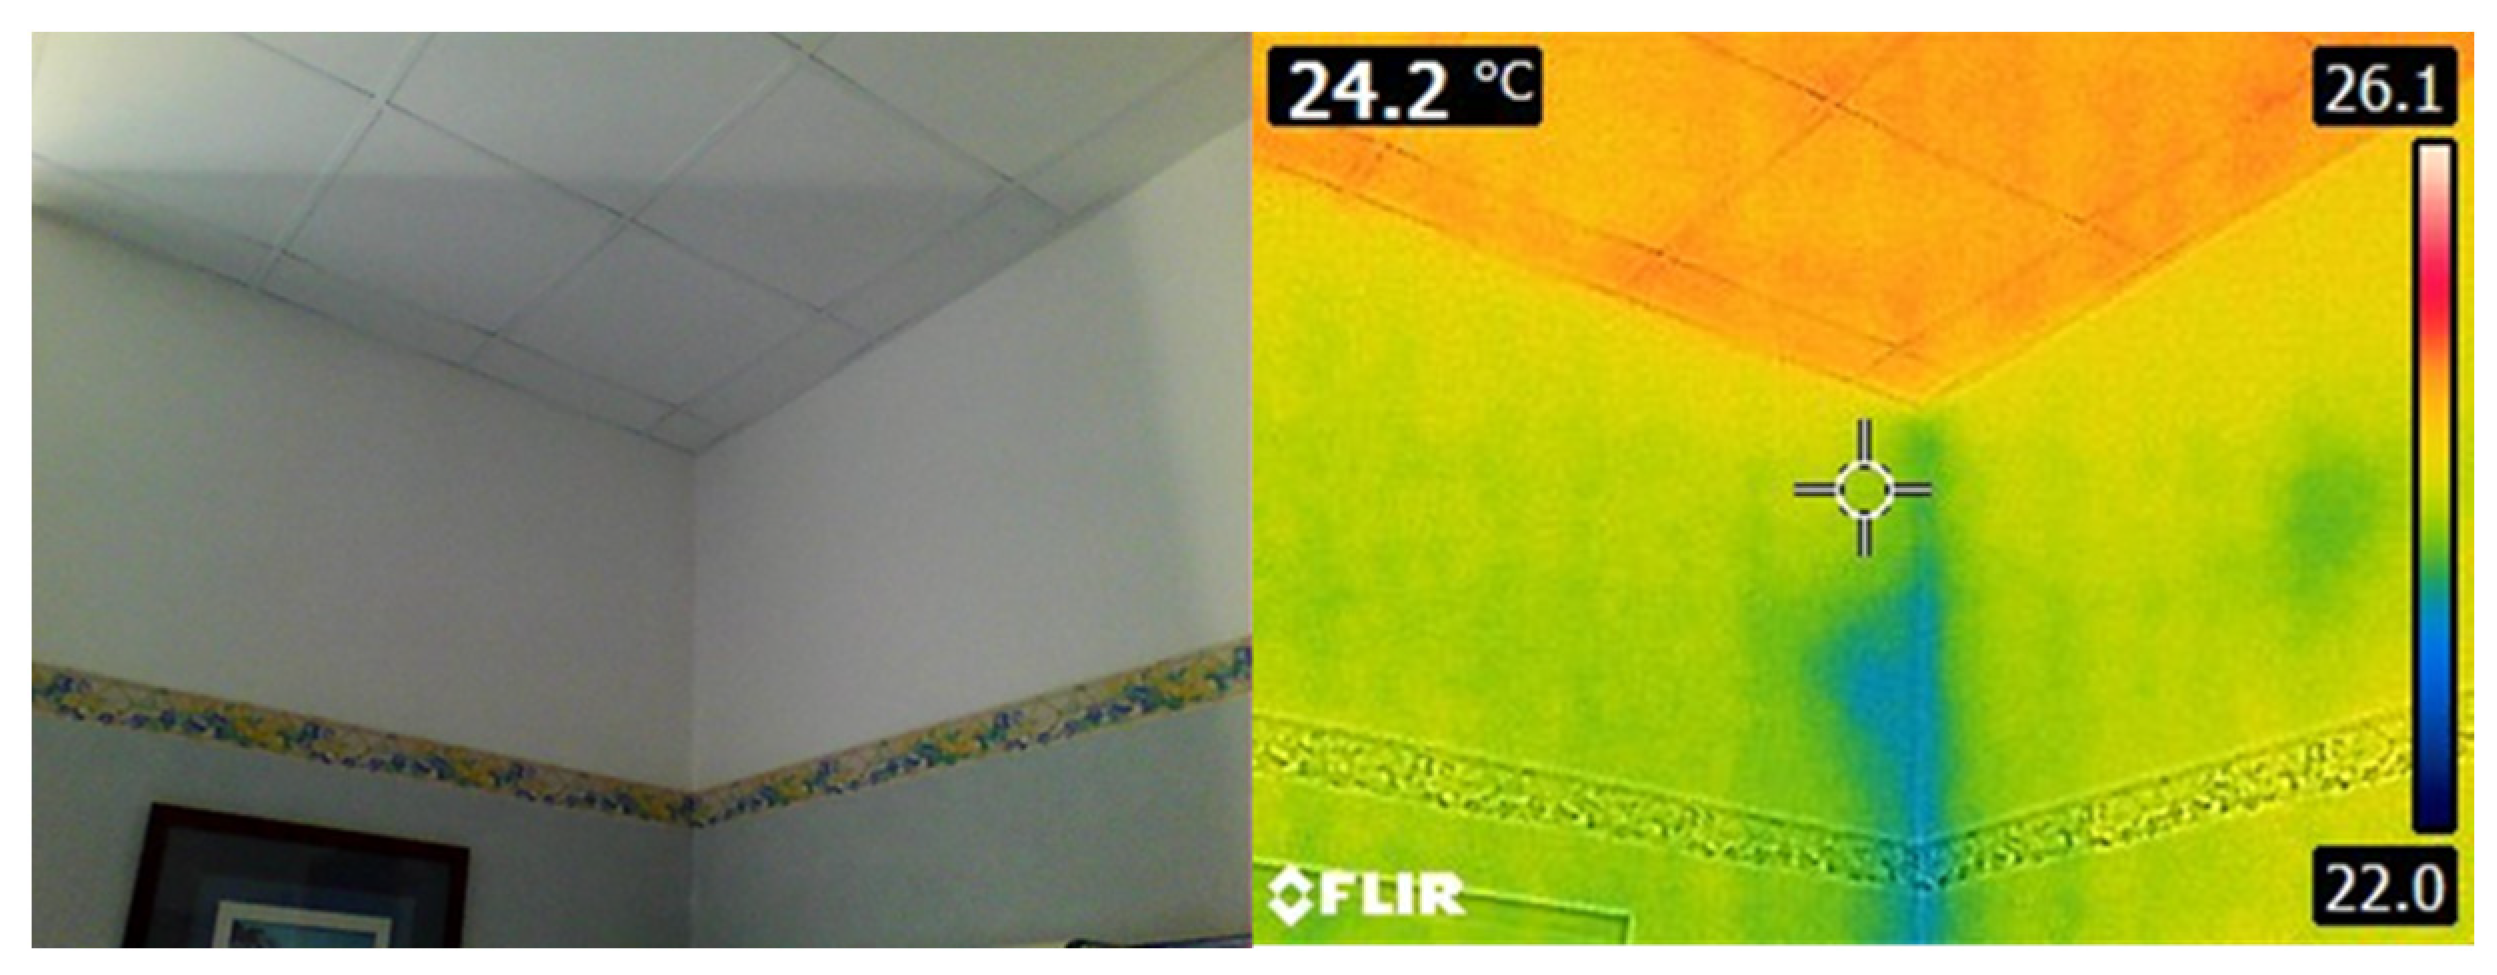
Several infrared investigations were carried out using a FLIR E8 model thermal imaging camera to detect critical envelope behaviors. The inspections were made during two winter days: 12 December and 3 March.
Figure 5 shows the infrared image for a ward room on the first floor facing southeast. In the corner between two walls, there is the typical geometrical thermal bridge with a lower surface temperature than the current wall. This was the most diffused type of local phenomenon found for the opaque envelope. Indeed, the most significant problem concerns the glazed envelope, characterized by higher heat losses and a thermal bridge created by discontinuity in the material. These phenomena cause both energy losses and problems because of asymmetry in the radiant surface temperature, with consequent localized discomfort.
3.2. Air-Conditioning and Lighting System Layout
3.2.1. HVAC System
Several types of HVAC systems serve the hospital. The main system (MHCS) consists of two identical multifunctional reversible heat pumps (CLIVET-WSAN-XSC 115D); these produce hot or cold water, available to most zones on all floors, by supplying hydronic terminals and/or dedicated air treatment units (ATU). The secondary heating and cooling system (SHCS) is an AERMEC NRP0500E4 heat pump unit. This is a polyvalent unit, equipped with axial fans and scroll compressors. The main performance data obtained from the data sheets are shown in
Table 4, where the nominal coefficient of performance (COP) and the energy efficiency ratio (EER) are also reported.
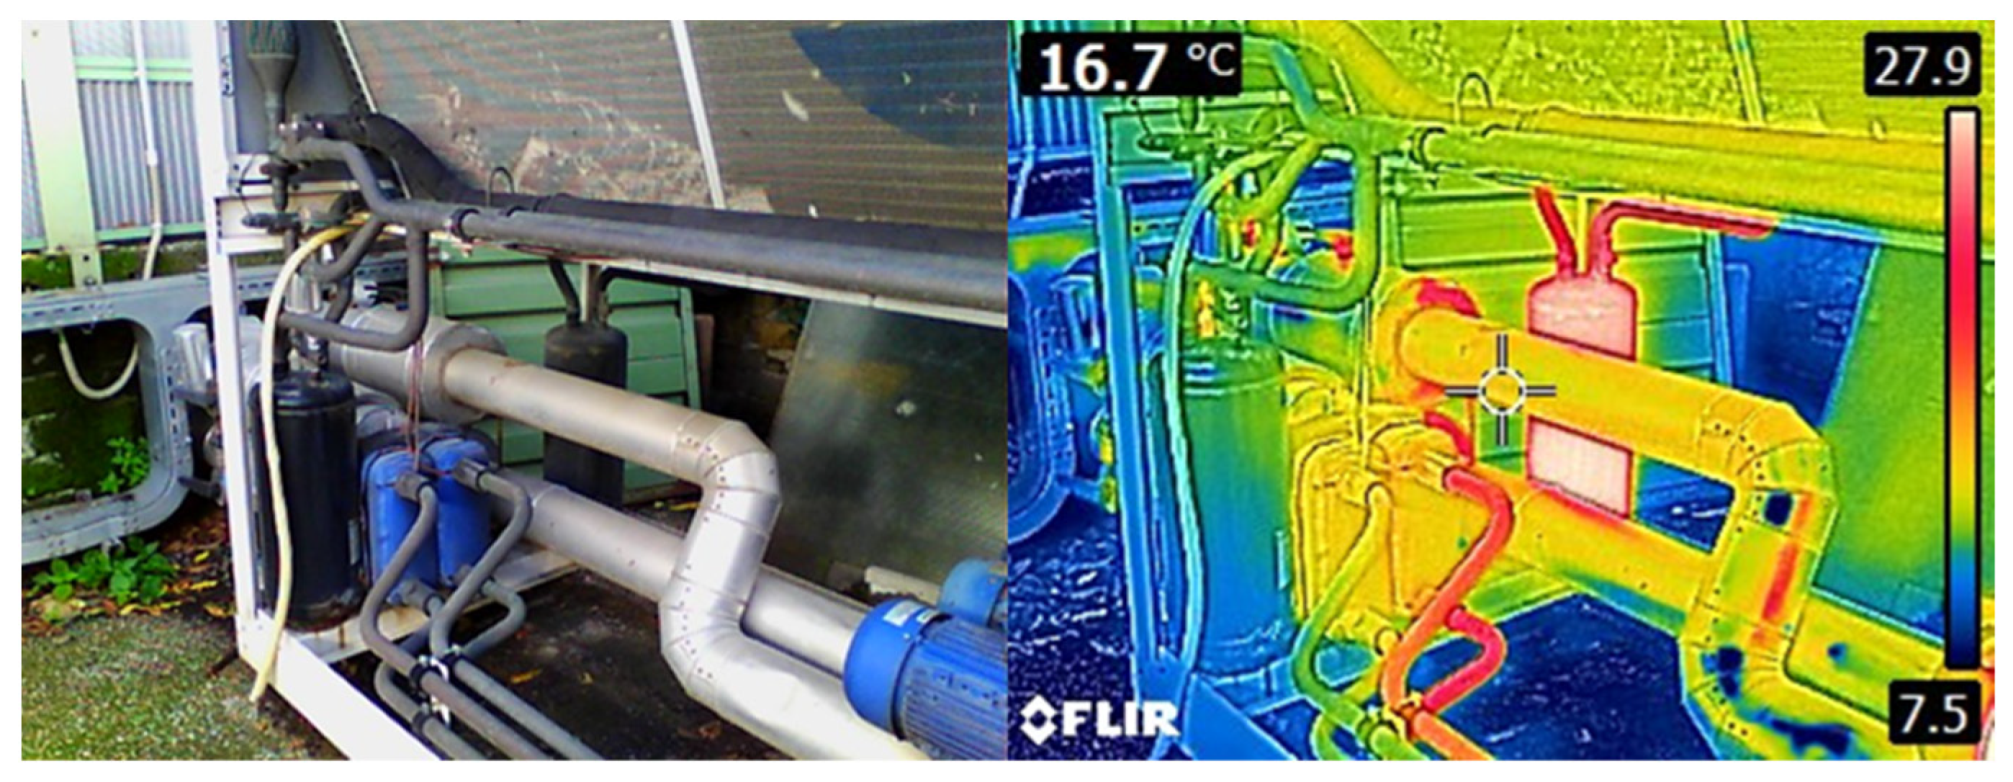
The infrared inspection detected some potential criticalities. For instance,
Figure 6 shows that some elements and pipes of the MHCS have higher surface temperatures than the other components, and thus, these should be insulated.
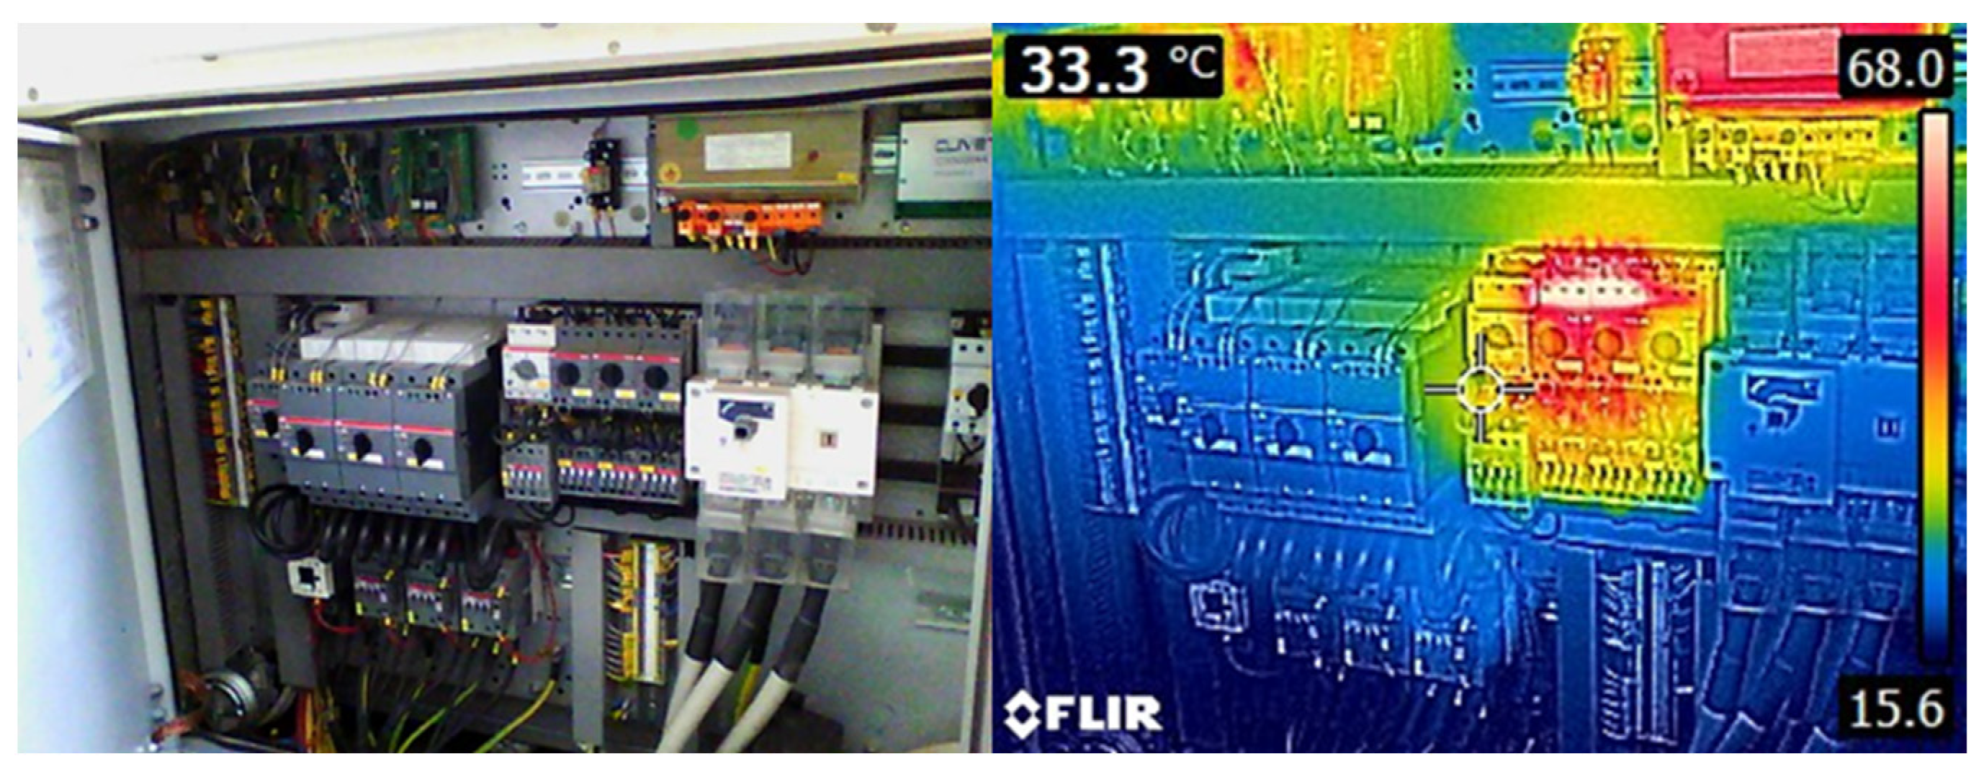
Figure 7 shows an infrared image of the electrical connections of the MHCS. Extremely high surface temperatures (between 60 °C and 70 °C) were detected. According to standard CEI EN 61439-1 [
37], these temperatures are permissible only in cases of switches installed in panel boards if they are connected to conductors with insulation sheaths (limit 70 °C) or if they are connected to bare conductors (limit, 85 °C).
There are several direct expansion systems (DX), mainly located on the second basement floor. In detail, there are different types of mono-split (Hel 3.5 kW, Cel 3.2 kW) and dual-split systems (Hel 6.5 kW, Cel 6.1 kW), and in some cases, as with the kitchen on level −2, these work in parallel with the MHCS.
Moreover, some zones, such as the room dedicated to magnetic resonance (level −2), are served by dedicated direct-expansion variable refrigerant flow (VRF) systems with heat recovery. These work with R410A gas and have a condensation control system consisting of one outdoor unit, two indoor units, and one high- or low-head-channeled indoor unit (horizontal installation). The main technical data are reported in
Table 4 for model MVAMHR2241T.
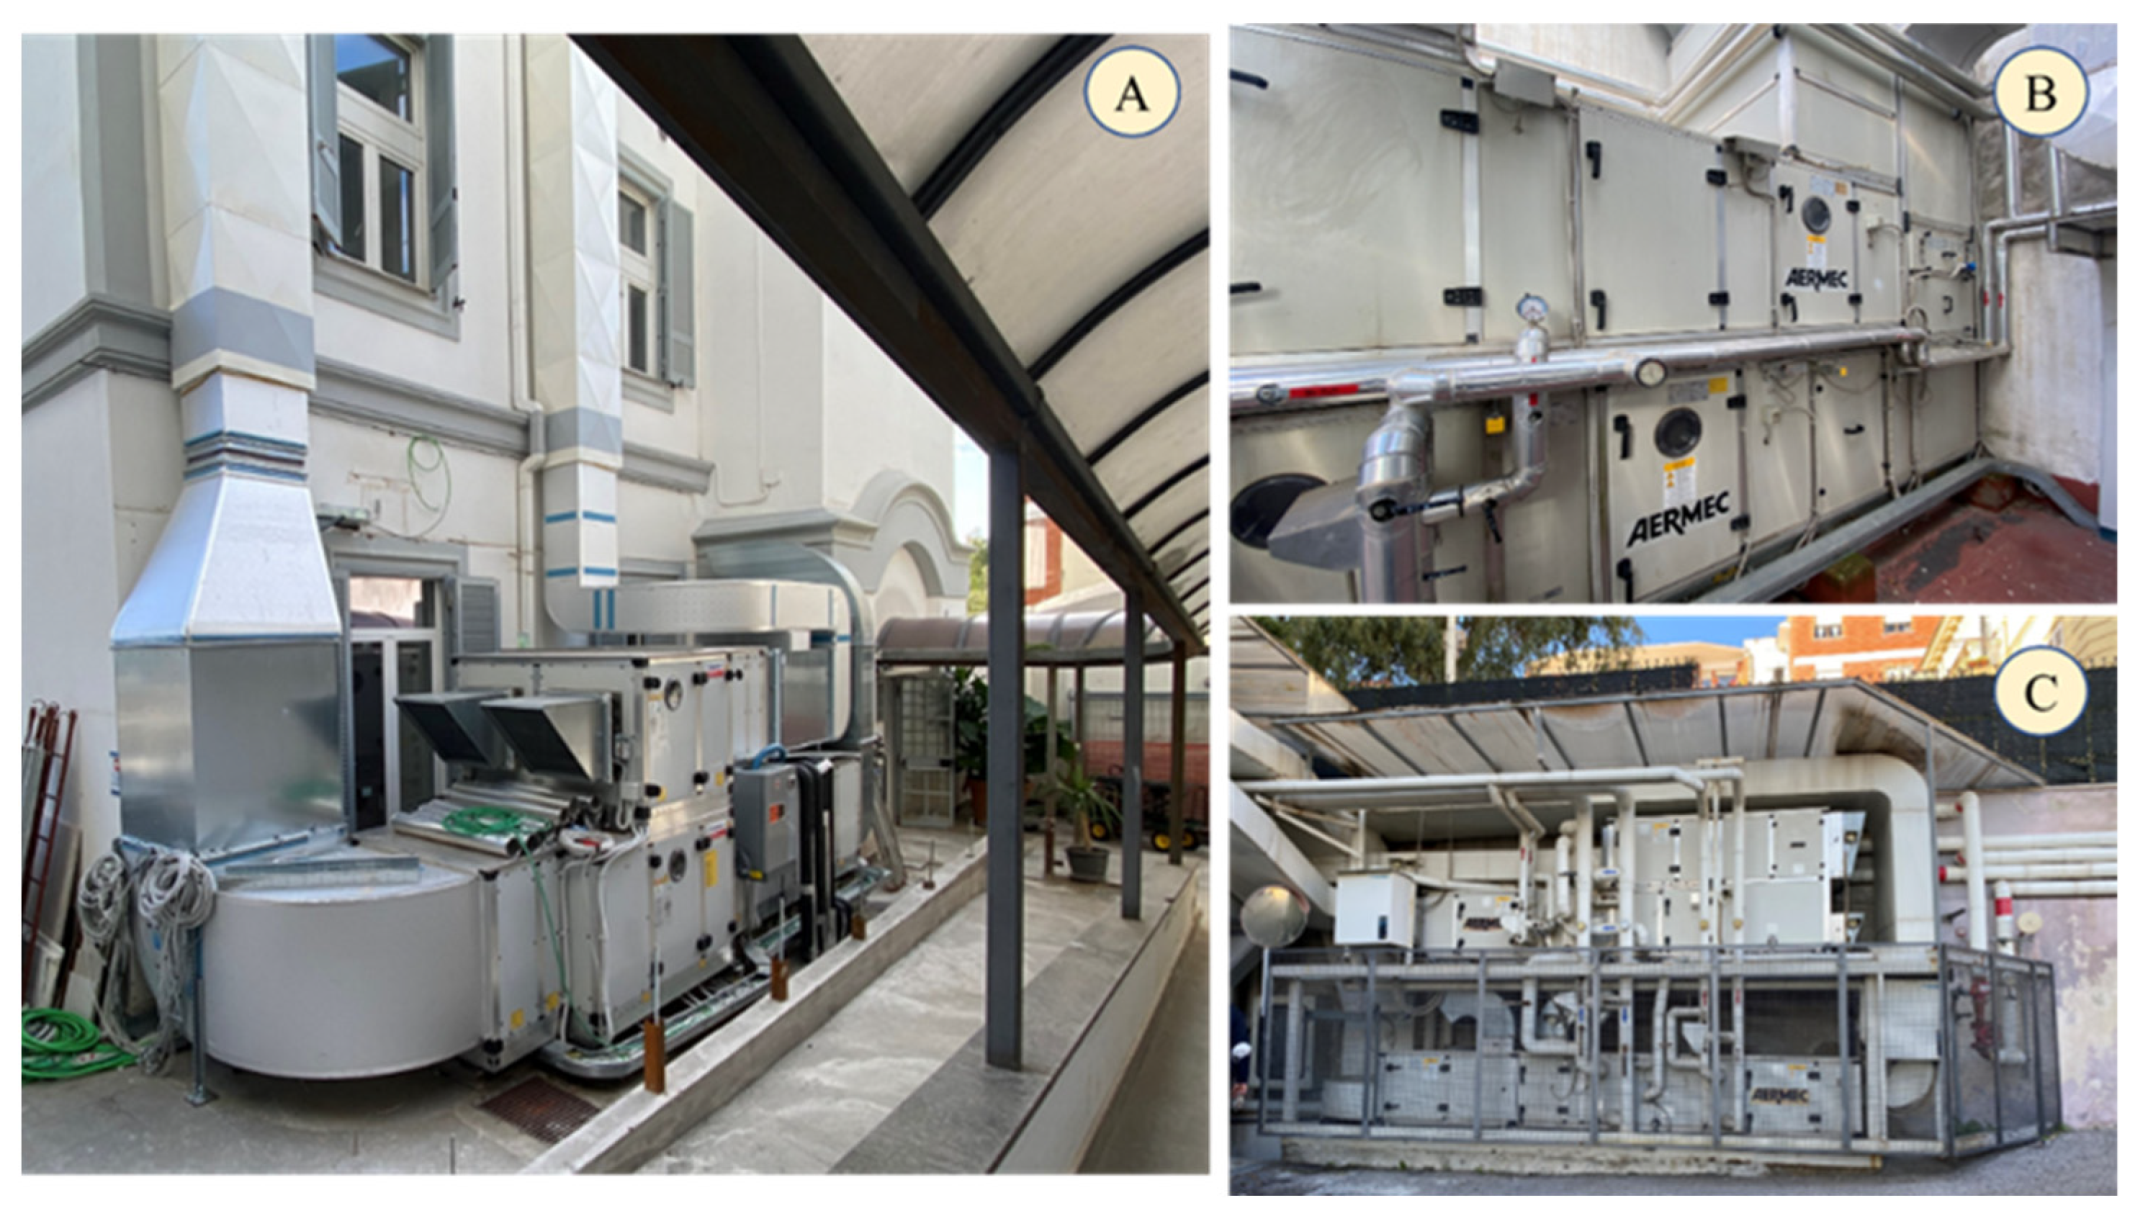
The clinic is also served by many air treatment units;
Figure 8 shows the main ones, including the ATU dedicated to radiology (
Figure 8A), with a nominal air-flow rate of 4350 m
3/h, the unit of the delivery room (
Figure 8B) and of the nursery (
Figure 8C), with nominal air-flow rates, respectively, of 33 m
3/h and 3500 m
3/h.
Finally, for the production of domestic hot water, there are two gas-fired boilers with a capacity of 500 L and a nominal heating power of 47 kW.
Table 5 summarizes the systems installed for the main thermal zones determined during the energy audit. These indications are very important for the definition of the numerical model for reliable simulations.
3.2.2. Renewable Energy System
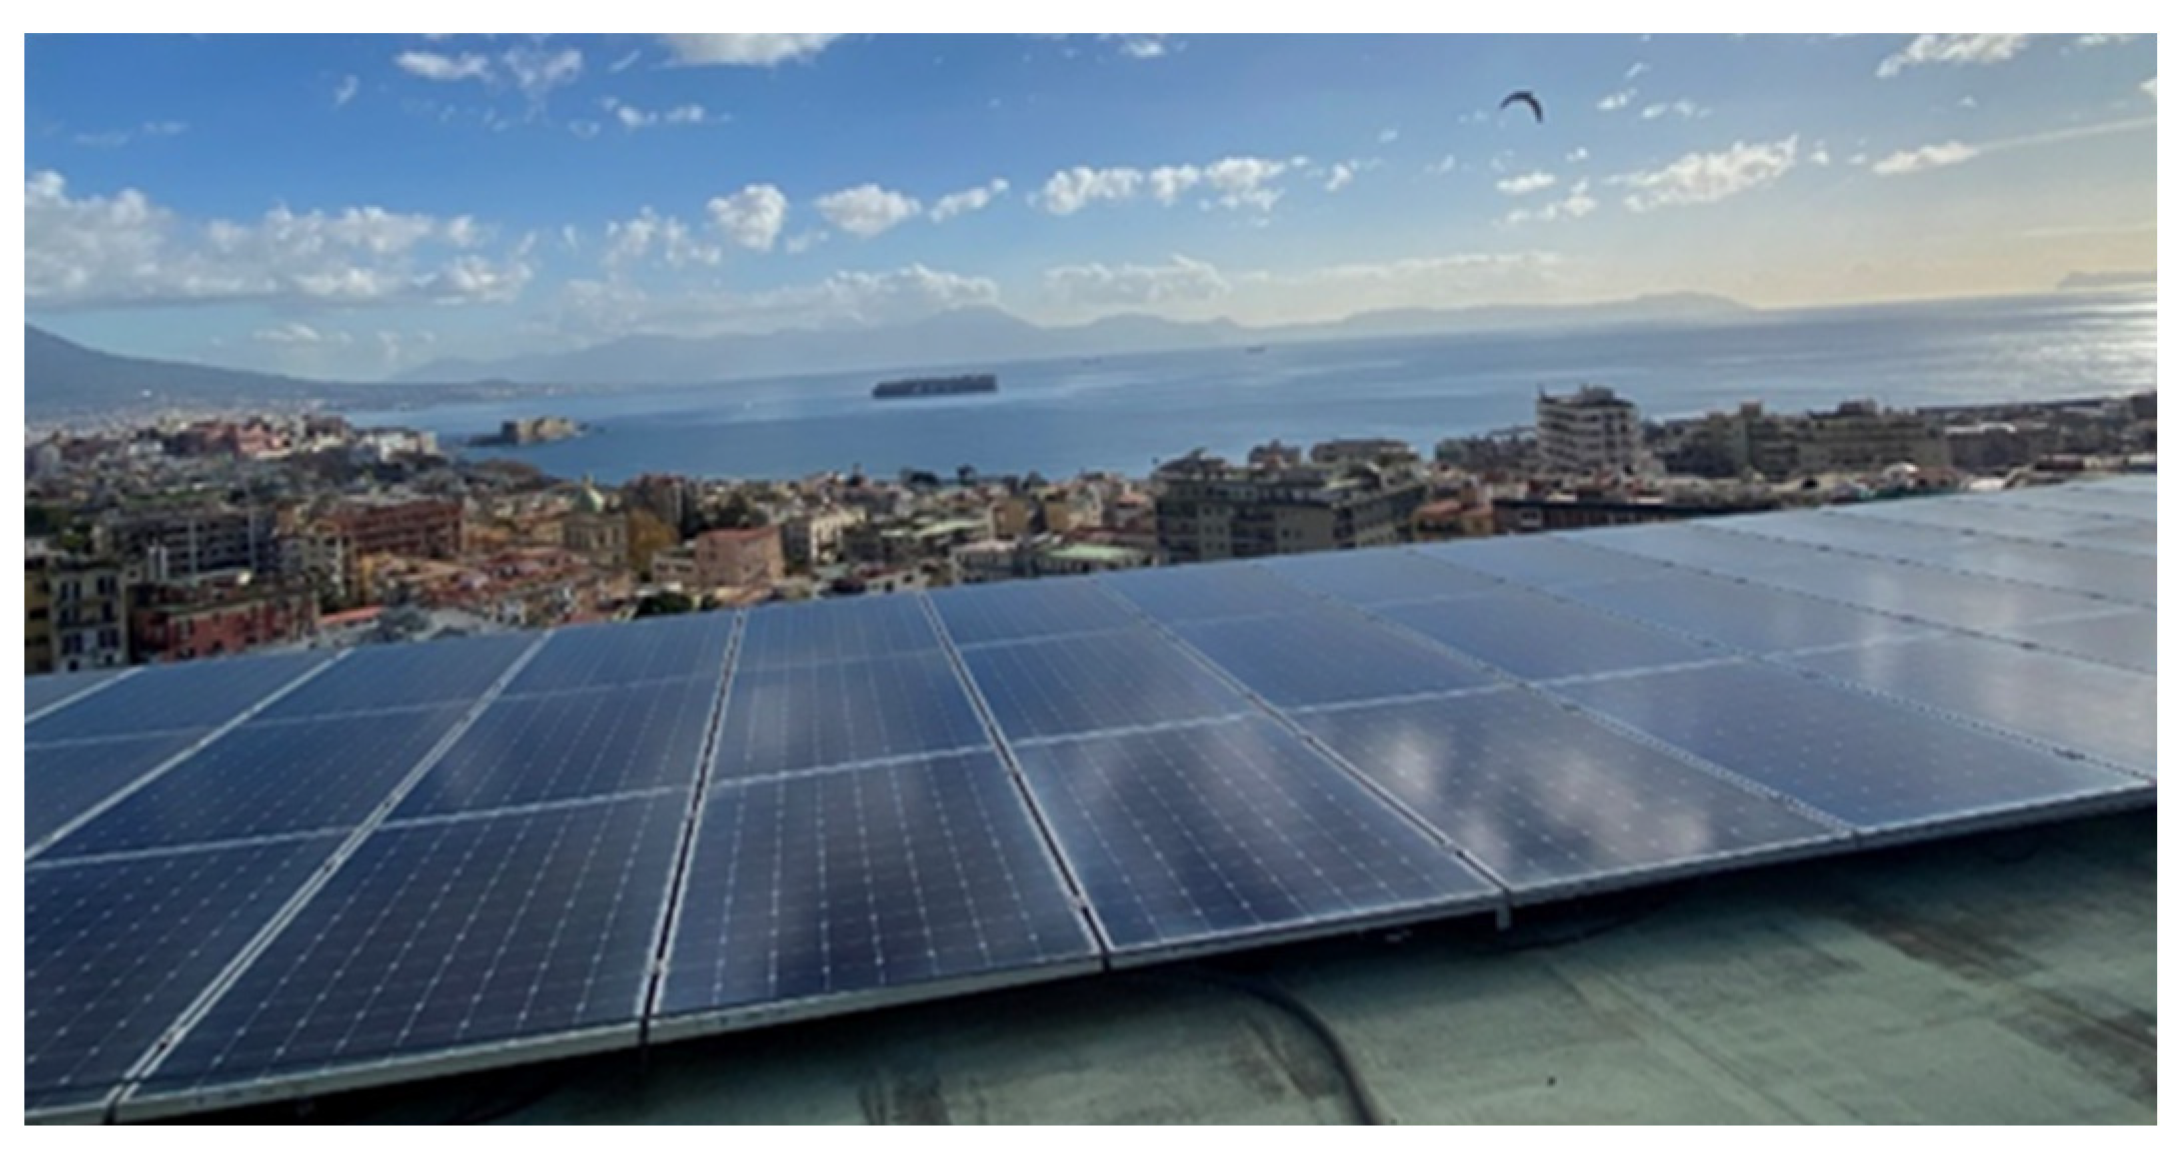
A grid-connected photovoltaic system (
Figure 9) with a peak power of 89.2 kW was installed on the roof; it consists of 223 modules (394.26 m
2) with a three-phase low-voltage connection type. The design data considered the annual solar irradiation on a horizontal plane equal to 5598.70 MJ/m
2, for which the balance of system (B.O.S.) is 88.34%. The annual output was estimated by the manufacturer to be 126,307.14 kWh.
However, this system, which has been in activity since 2020, is being decommissioned, because of a negative assessment carried out by the Archaeological Superintendence. Indeed, the building is located in a historical area, and the installed system was considered too invasive in terms of visual impact. For this reason, even if considered in the analysis of the state of fact, during the refurbishment process, it would be necessary to evaluate the applicability of a different photovoltaic system in order to comply with the non-invasive criteria set forth by the authority.
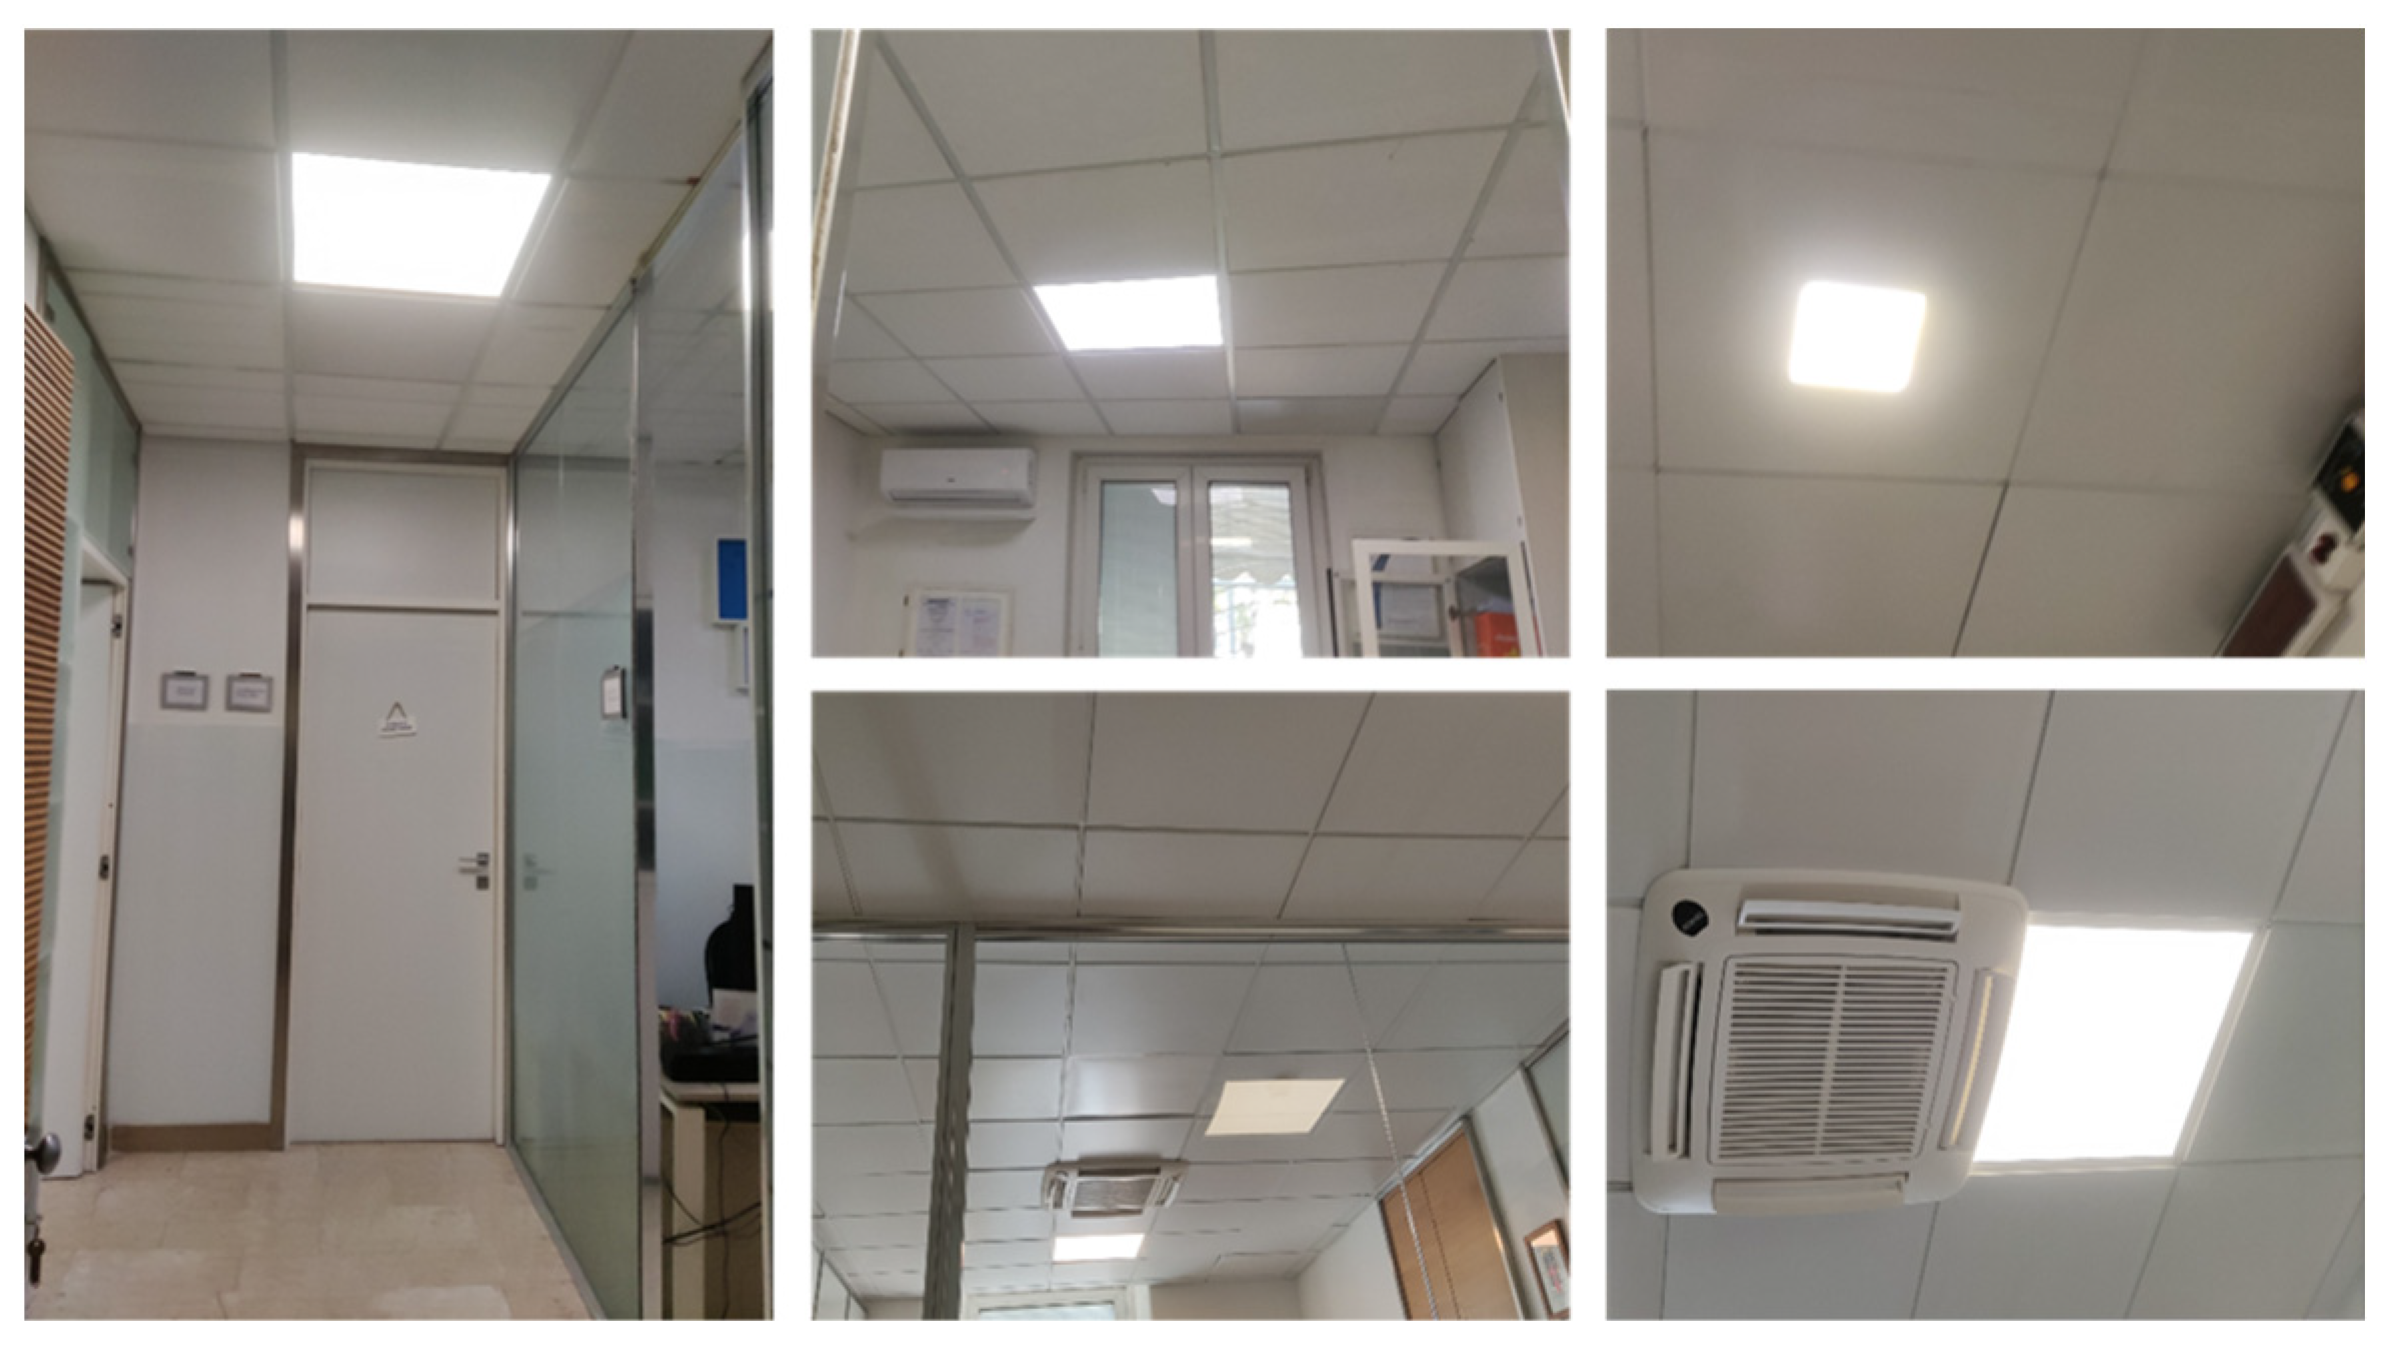
3.2.3. Lighting System
The lighting system is differentiated based on the illuminance levels required for medical activities. The main lamps (
Figure 10) found in the low-level activity rooms (such as patient rooms, hallways, kitchens, and so on) are 60 × 60 cm, 4 × 10 W neon lamps.
Other types of devices were found in some very representative zones, such as the operating blocks and sterilization and delivery rooms. The main types are
Disano 825 FL 4 × 18 W 825 Comfort—opal plate;
Disano 843 FL 4 × 14 W T5 843 Hermetic—satin-finished optics;
Disano 828 FL 4 × 18 W 828 Comfort—prismatic plate;
Disano 828 FL 4 × 36 828 Comfort—prismatic plate;
Disano 843 FL 4 × 24 T5 843 Hermetic—satin-finished optics.
3.3. Energy Consumptions
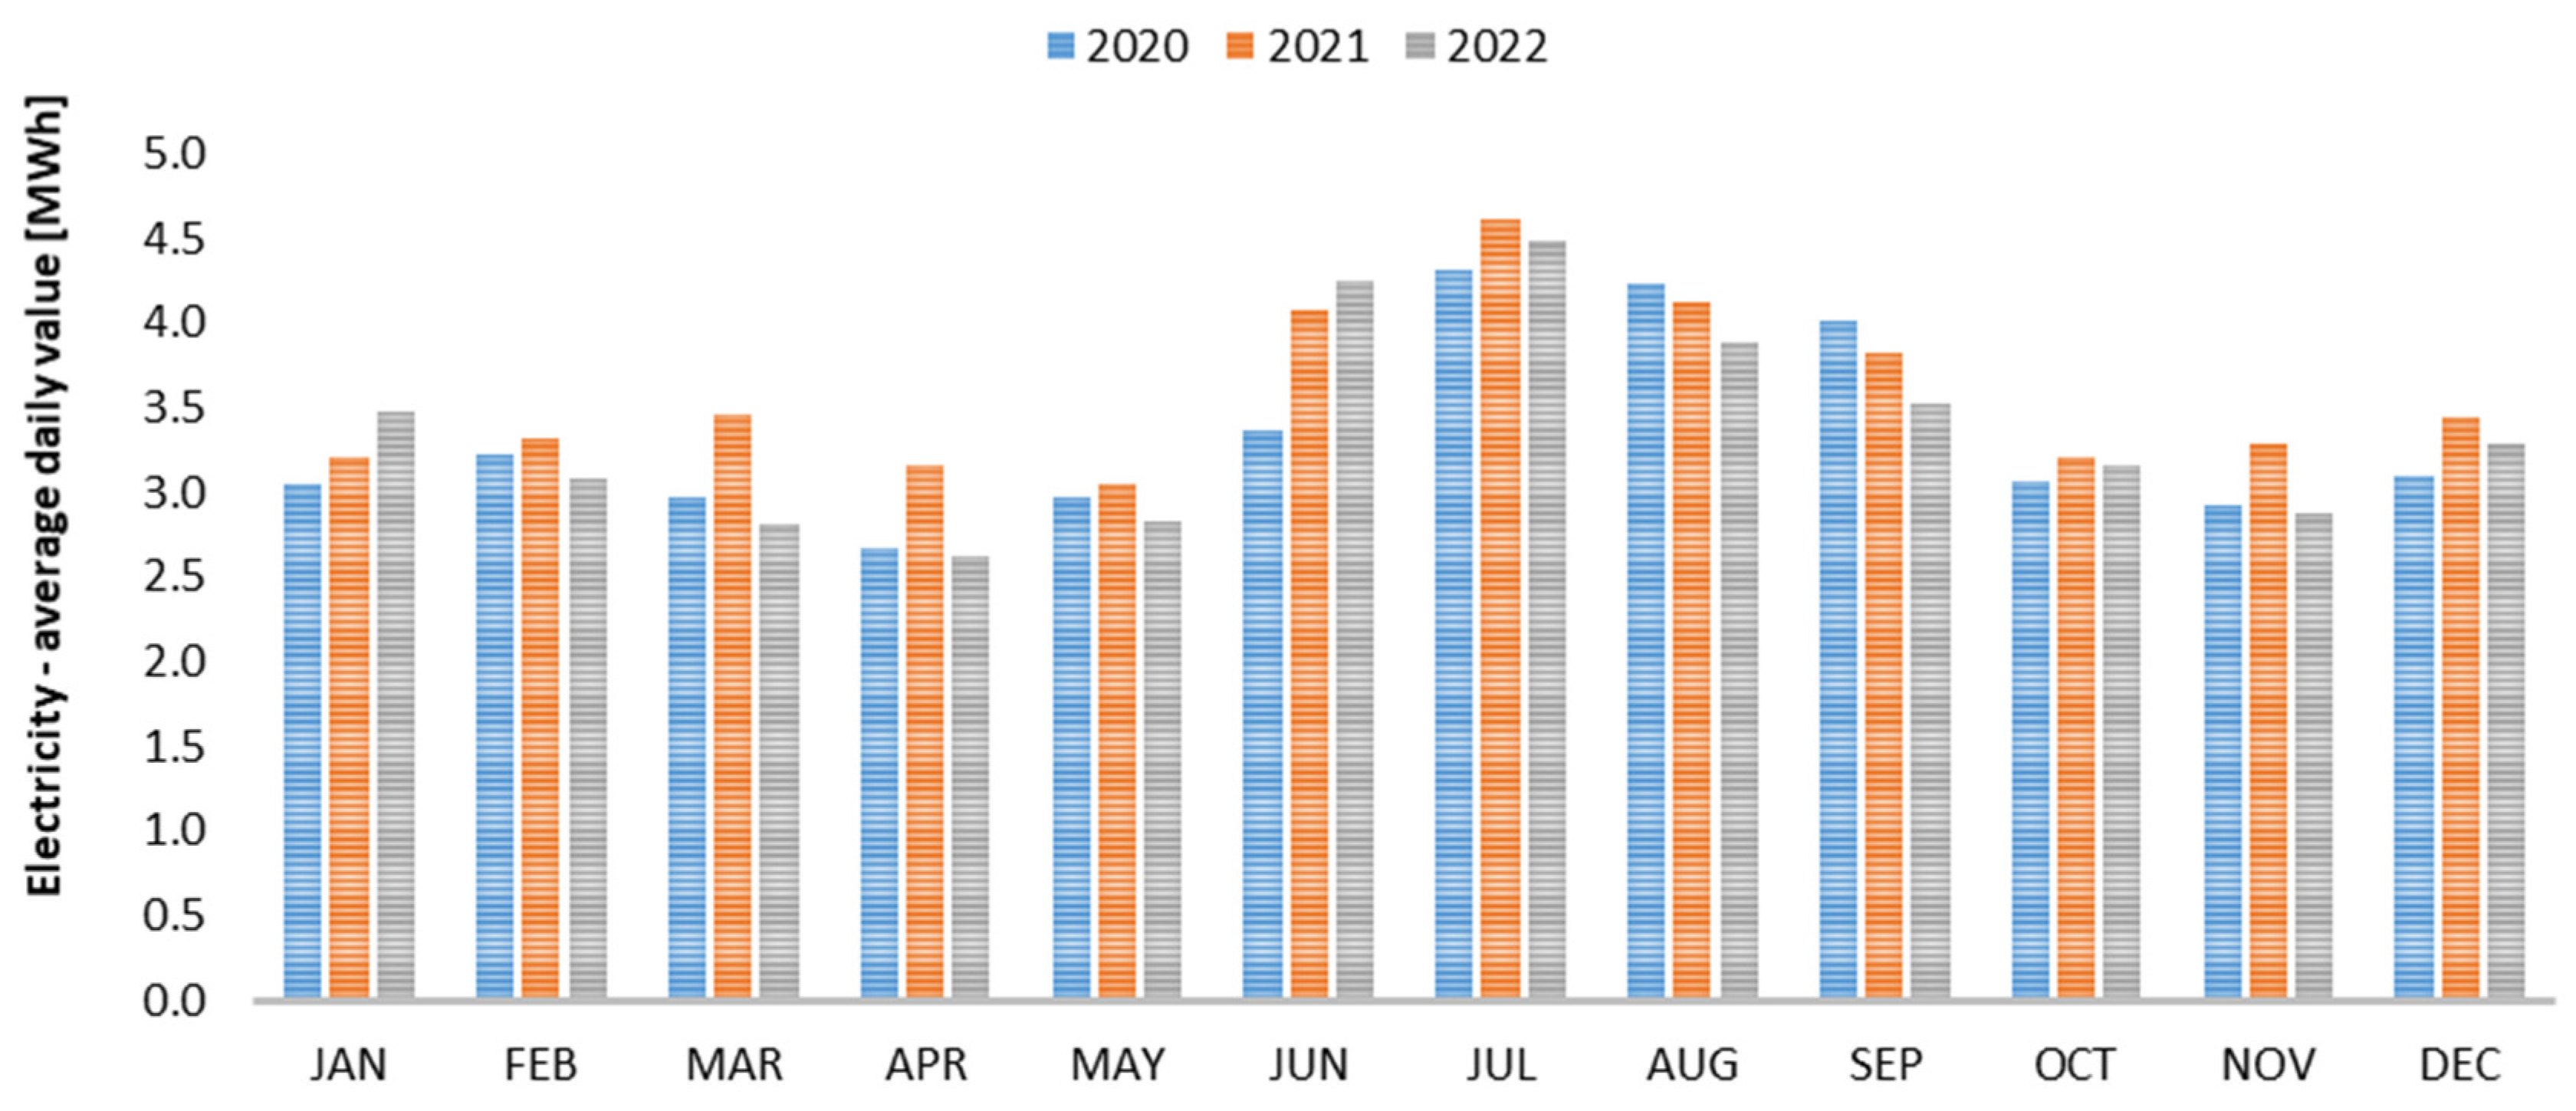
3.3.1. Electricity Consumption Analysis
Electricity is purchased through a medium-voltage supply contract with an available power level of 500 kW.
Figure 11 shows the average required daily active electricity. The average value is comparable each month, with a slight increment during the summer because of a higher incidence of cooling energy requests and a lower value of heat pump nominal efficiency during the summer. The total annual consumption increased from 1217 MWh in 2020 to about 1302 MWh in 2021 and about 1225 MWh in 2022. However, the values are consistent over the years, and the variation can be mainly attributed to differences in the hospital services required by patients and, thus, contingent causes.
Electricity was also measured using sub-meters in order to verify the absorption of dedicated lines during emergency activities or when equipment with high power requirements is installed.
Table 6 shows the measurements on three typical days of the winter period.
3.3.2. Natural Gas Consumption Analysis
The same analysis was performed for natural gas; taking into consideration the gross calorific value declared on the hospital’s energy bills, the annual request is an average of 103 MWh with an incidence of 10% during the winter months and 5–7% during the summer. The total annual cost is about EUR 5156, and it represents about 2.4% of the total expenditure on energy vectors.
4. Energy Quality in the State of Fact
4.1. Thermo-Hygrometric Comfort Analysis
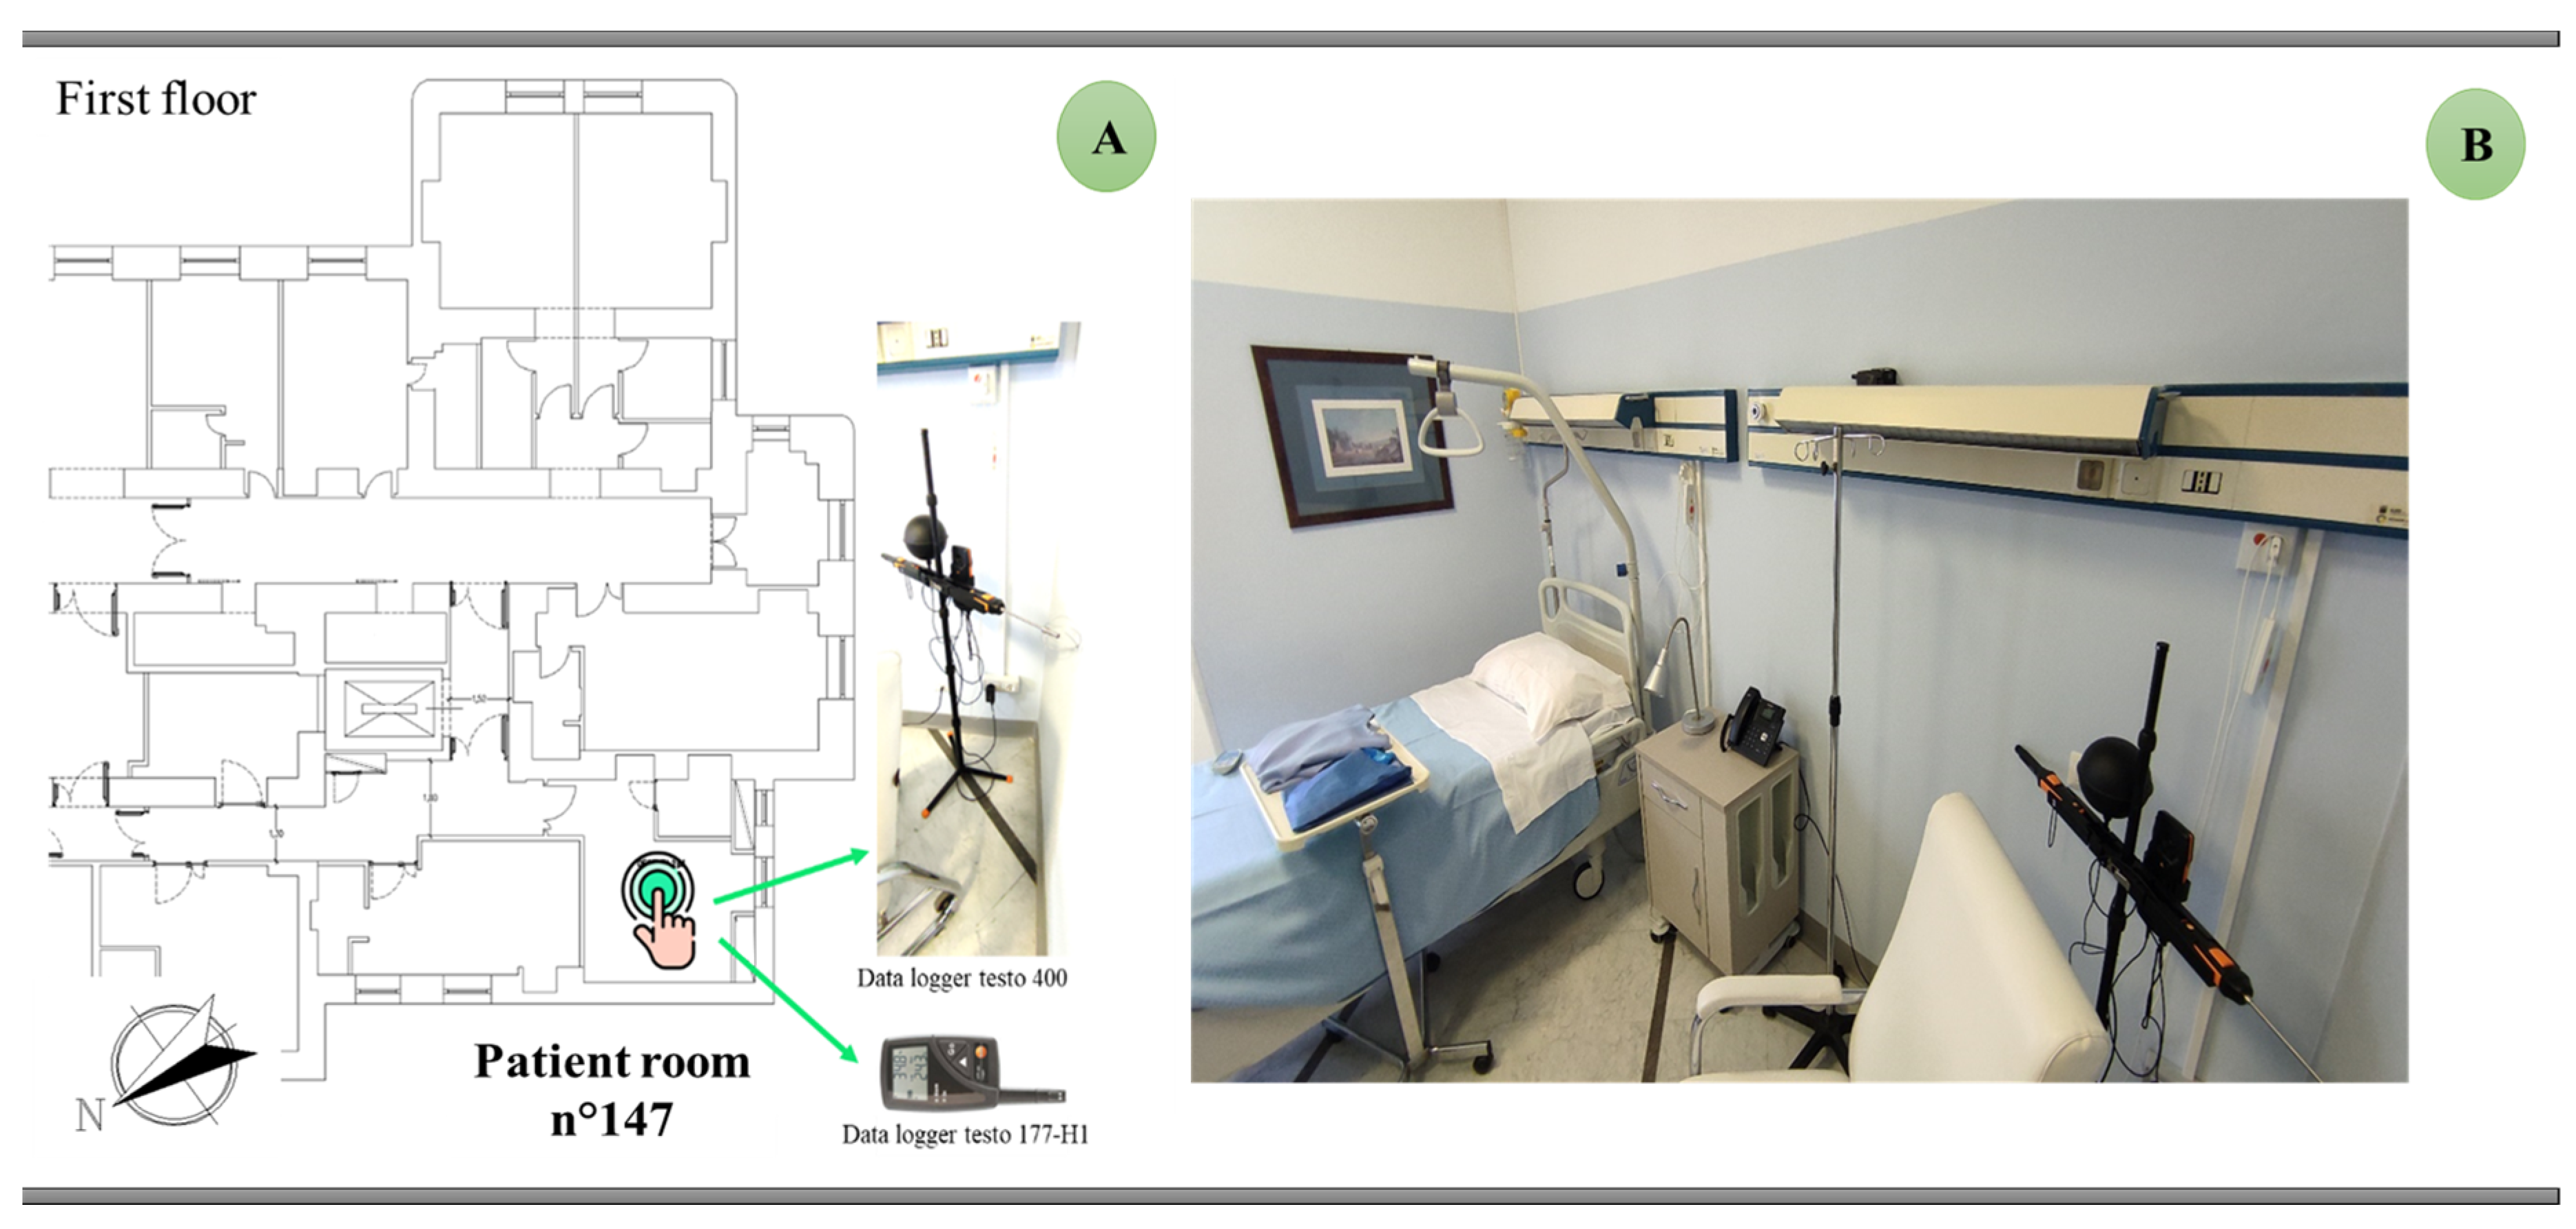
The indoor quality of two representative patient rooms was analyzed in a 10-day measurement campaign during a typical period of the winter season (from 6 March to 13 March 2023) when the heating system was turned on. This kind of use was chosen because both the occupant behavior that type of installed HVAC, the indoor conditions are more variable than in rooms (e.g., operatory blocks) where strict values are fixed by a current normative.
The indoor air temperature and the relative humidity were measured with a 177-H1 testo datalogger (resolution, 0.1 °C/0.1%; accuracy, ±0.5 °C/±2%). Moreover, a testo 400 datalogger was used to monitor CO2 concentrations (accuracy, ±50 ppm +3% of m.v), and a hot-wire anemometer (accuracy ±0.03 m/s +5% of m.v) and a globothermometer (class 1 according to EN 60584-2) were used to measure indoor air velocity and global temperature respectively. A sampling period equal to 10 min was chosen in order to accurately detect all possible variations in the considered variables.
Figure 12 shows one of the patient rooms under investigation, which was continuously occupied during the monitoring; it was west-facing, with a floor area of 17.9 m
2 and a glazed surface of 3.8 m
2.
The sensors (
Figure 12B) were positioned in order to avoid the influence of direct solar radiation or heating emitters.
The monitoring results suggested that the control of the latent load is quite limited since the relative humidity was within an acceptable range for 67% of the measurements; meanwhile, on some days (8–10 March), it rose up to 70%, with a peak value of 90%. The air temperature was mostly within the acceptable comfort range, with variations ranging between 18.8 °C and 23.6 °C. Furthermore, it was noted that, when the temperature falls below 20 °C, there is a fluctuation in airspeed between 0.15–0.25 m/s, and thus, it can be concluded that, in such periods, the occupants could open the door or window to assure natural ventilation, and this behavior influenced the air temperature.
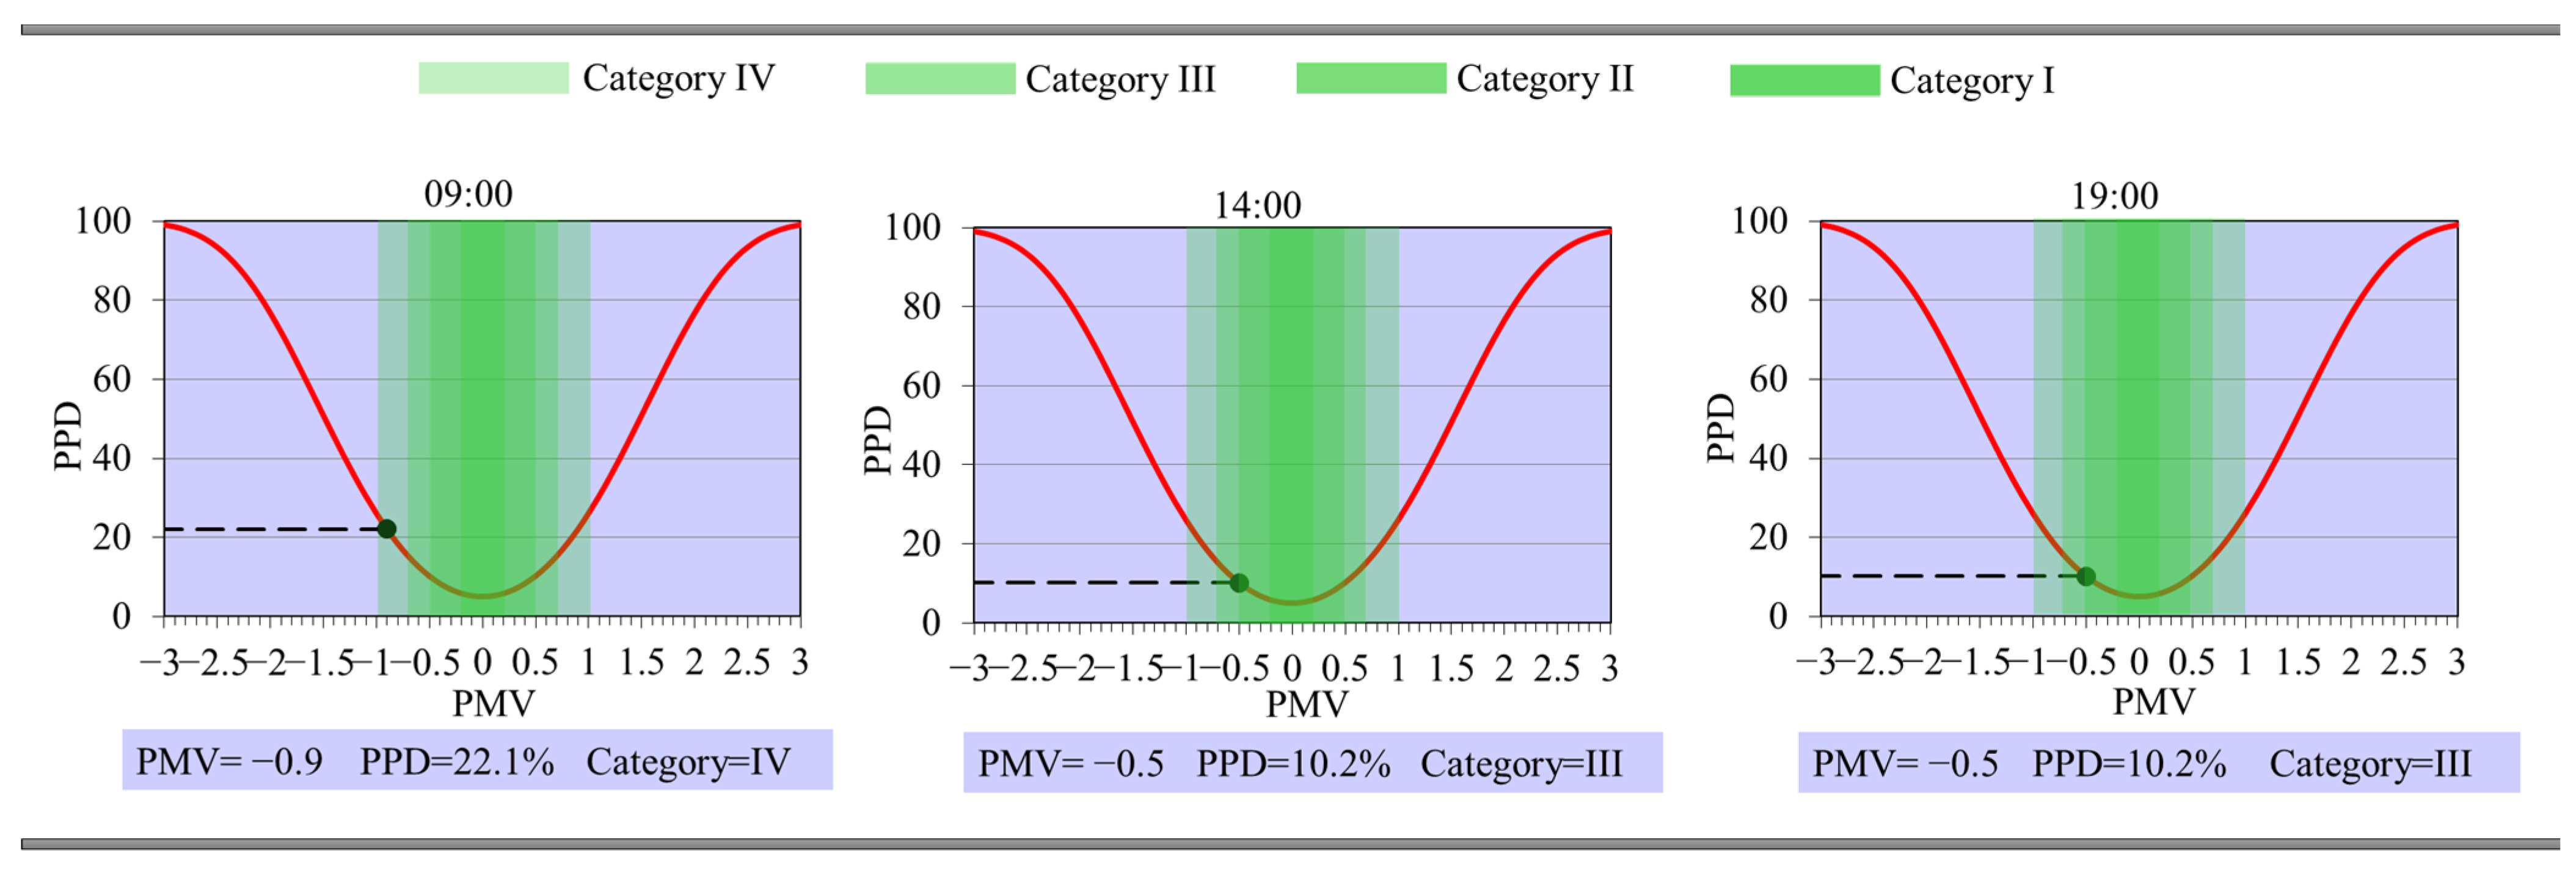
Figure 13 shows the calculated PMV and PPD values at three different hours on 9th March; a metabolic rate of 46 W/m
2 (0.8 met) was assumed, which corresponds to a person lying down. In order to define the thermal resistance of clothing, different clothing combinations were assumed; e.g., for long and short pajamas, with or without a dressing gown, the clothing thermal resistance can vary between 0.9 clo and 4.6 clo, as shown by [
38]. Assuming that, for the reference period, the hospitalized occupant has long pajamas and a 23% coverage rate with a quilt, a value of 1.6 clo was chosen.
As reported in
Figure 13, the comfort index was in a range of −0.5 ÷ 0, corresponding to the “thermal neutrality” sensation. However, it must be pointed out that the acceptability interval to be considered is −0.2 < PMV < 0.2 (category I), which is suitable in the presence of thermally vulnerable subjects. For this reason, a redesign of the HVAC system with improved ventilation could contribute to satisfying this standard.
CO2 concentrations varied between 470 and 700 ppm. Considering the interim technical report “Monitoring CO2 for prevention and management in indoor environments in relation to the transmission of the SARS-CoV-2 virus infection” by the Italian National Institute of Health in 2022, the outdoor environment can be considered to have a carbon dioxide concentration of between 400 and 500 ppm (with hourly and daily variations that are affected by the season and can be over 150 ppm). Consequently, considering the values measured inside the room, it can be concluded that it falls into Category I according to EN 16798.
4.2. Building Modelling Calibration
All data acquired during the audit were used to define the numerical model with TERMUS BIM [
39], which is used to implement Italian technical standards. The tailored rating method was applied to optimize the energy performance in real operating conditions.
Once the construction of the opaque and glazed envelope was completed, all possible thermal bridges were constructed and calculated conforming to UNI EN ISO 14683 [
40]. All detected internal loads were assigned to thermal zones and occupancy profiles, microclimatic conditions, air exchanges, and lighting; for the HVAC system, the profiles used were all hours of all days between November and April in heating mode and from May to September in cooling mode.
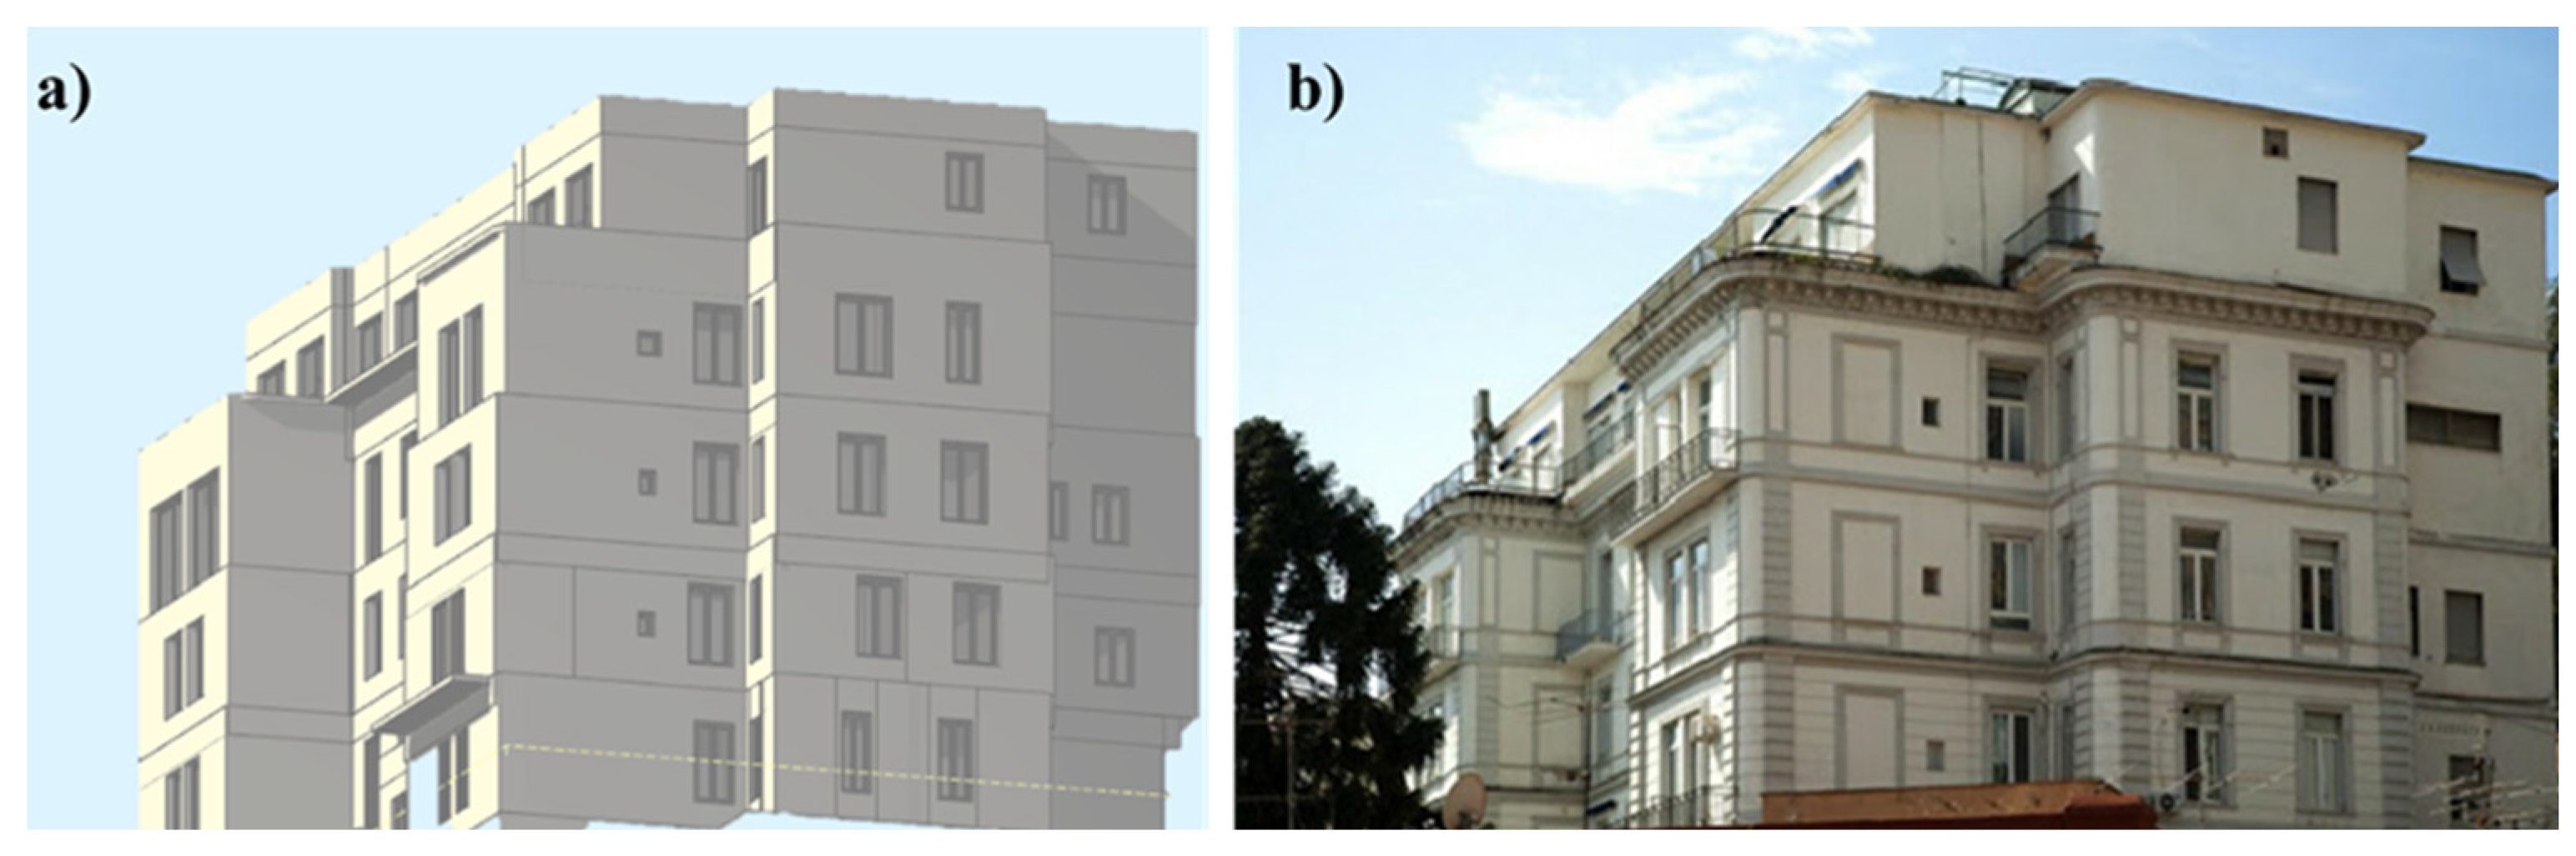
Figure 14 shows a rendering of the building and a comparison with a real image.
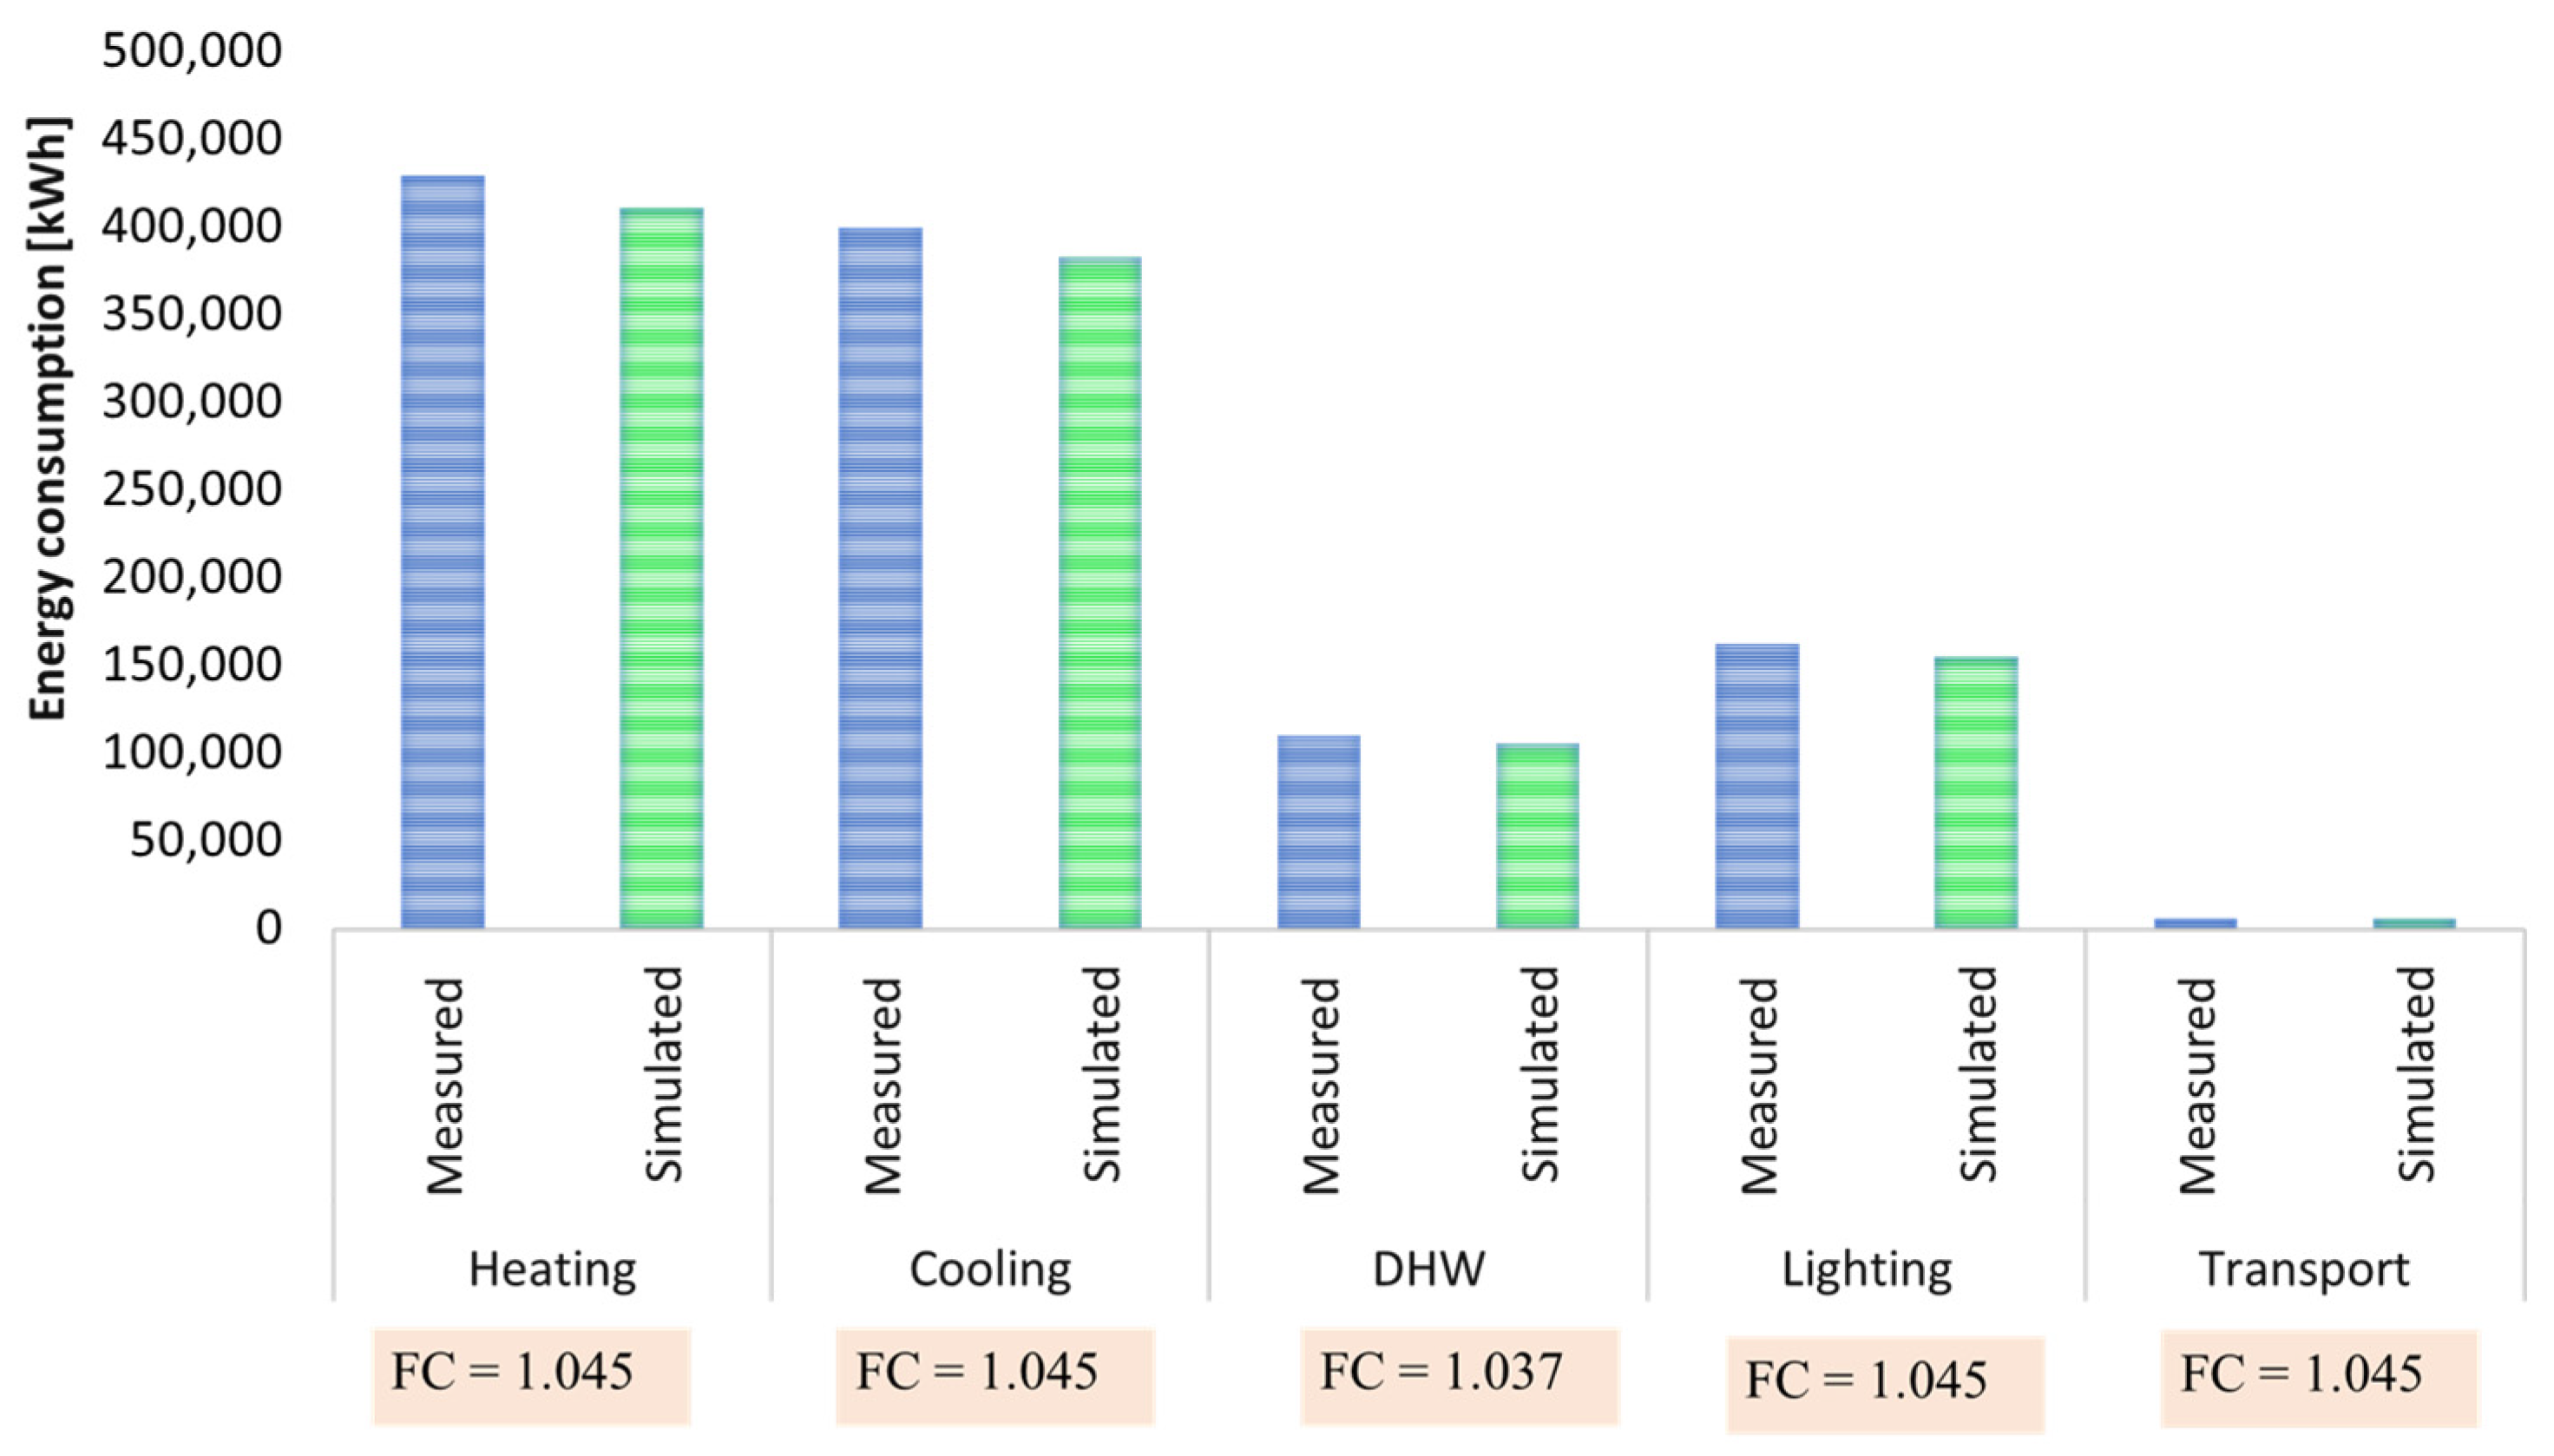
Considering the total annual consumption, the percentage variation between the estimated and actual values is 3% and 4% for gas and electricity, respectively, with relative CF values equal to 1.036 and 1.045. The consumption rates of each service, with their congruence factors, are represented in
Figure 15.
Under these conditions, the overall congruence factor was 1.044, thus falling within a high congruence range.
4.3. Energy Indicators
Table 7 shows both the definition of the considered indicators according to [
41] and the calculation for the building’s state of fact.
In order to evaluate the building quality, these can be compared with the sector benchmarks reported by Report RSE/2009/117 [
42]. Considering specific consumption in terms of the tons of oil equivalent per bed (toe/pl), this value ranges from 3.8 toe/pl in Sardinia to 24.5 toe/pl in Lombardy. The Campania region (where Naples is located) assumes a value of 7.43 toe/pl, while a national average value can be considered to be 12.6 toe/pl.
Clinica Ruesh has a specific consumption value of 3.89 toe/pl, which is lower than both the national levels and those of the same region (and, therefore, the climate conditions).
4.4. Efficiency Interventions Design
Based on the results obtained from the simulations and taking into account the detected criticalities, the following interventions were analyzed:
The installation of more efficient windows with roller shutters as a mobile shading system;
The replacement of the lighting system;
The HVAC system upgrading;
The installation of a new photovoltaic system.
4.4.1. Replacement of Windows
According to [
40], double-selective, argon-filled windows (glass transmittance 1.1 W/m
2 K) with aluminum frames (thermal brake) will be installed on floors −1, 0, and 1. Regarding shading systems, in addition to the current internal systems, the possibility of installing mobile systems such as motorized PVC shutters in an insulated box was evaluated. This installation would reduce the glazed surface to around 70 cm. Therefore, since the total glazed area subject to the intervention is approximately 214 m
2, the total cost is EUR 124,693.
4.4.2. Improvement of Lighting System
The proposed intervention aims both to satisfy the occupants’ requests and guarantee adequate illuminance levels for medical activities with lower electricity consumption. LED lamps were considered, with different characteristics based on the hospital wards they will be placed in (e.g., 4000 lm for an operatory block and 1450 lm for patient rooms), as was the integration of these with a control system, i.e., the installation of a presence and brightness detector in at least the wards and hallways. From an economic point of view, considering the replacement of approximately 345 lamps, the total cost is EUR 143,011.
4.4.3. Air-Conditioning System Efficiency
The efficiency enhancement of the air-conditioning system involves, first of all, the replacement of one of the heat pumps of the MCHS with a four-pipe polyvalent unit with an air source and outdoor installation (COP 3.92, EER 3.96). This system produces DHW and, thus, removes dedicated gas-fired boilers.
Moreover, based on the results of indoor comfort tests, there is a plan to install a VRF system in all patient rooms. This is the most suitable intervention in terms of invasiveness and impact. The chosen outdoor unit includes heat recovery, the cooling power is 73 kW with an EER of 3.75, and the heating power is 81 kW with a COP of 3.87.
The cost of the polyvalent unit is EUR 67,753, while the installation of the VRF system requires a total estimated investment cost of approximately EUR 200,326.
4.4.4. Photovoltaic System Installation
Considering the landscape constraints, it was decided to propose a new installation with photovoltaic modules with monocrystalline cells and colored glass. A model with 62 cells was considered, with a maximum power of 300 W and an efficiency of 18.18%. Globally, 240 panels (396 m
2) can be installed for a total power output of 72 kW. The produced energy will be entirely self-consumed. The estimation of the productivity is based on the monthly average value of solar radiation, as reported in [
35] using a procedure available in the adopted TERMUS BIM tool. Based on market analyses, the total cost will be EUR 252,000.
6. Conclusions
The paper presented the application of a multistage methodology for the selection of efficiency measures to be applied to hospital buildings. It is based on a detailed energy audit with a complete measurement protocol in order to provide the most reliable description of different thermal zones, both in terms of indoor parameters and HVAC systems. With this information, a numerical model was defined, and the calibration process was also explained. The second phase involved the selection of passive and active efficiency measures whose profitability was evaluated by using economic, environmental, and economic indices.
The application of this methodology to the case study of Clinica Ruesh, located in Napoli (Italy), will support designers in identifying necessary information and the implementation of complete methods for defining energy balance. In terms of refurbishment design, a reduction of the total primary energy demand by 19% and of polluting emissions by 49% requires the following: (a) the adoption of double-selective glass with aluminum frames and motorized PVC shutters; (b) the replacement of existing lamps with LEDs; (c) the installation of a new polyvalent heat pump; (d) and the installation of VRF systems in patient rooms. Moreover, the installation of an integrated and colored PV system of 72 kWp is recommended. Without considering incentives, according to an actualized payback calculation, these efficiency measures can be repaid in around 10 years, and the NPV40 is EUR 1,120,856. Incentives are an attractive prospect in this sector; indeed, the payback period can be halved, and the NPV40 would be EUR 512,373.00.
The outcomes of this investigation will be used as a starting point for further comparisons of post-refurbishment measurements; on the other hand, the study wants to help bridge a gap in the existing scientific literature regarding the effect of the integration of several types of measures also on indoor quality by studying the refurbishment of hospitals and healthcare facilities. Moreover, it should be stressed that the methodological approach developed could be easily replicable for the refurbishment of other building types in any climatic location.


 ,
, 


