Abstract
Water, Energy and Food (WEF) are coordinated and constrained by each other, constituting a multivariate coupled feed-forward dynamical system. Traditional modeling and simulation methods struggle to model and simulate complex interactions in the WEF nexus. Therefore, we proposed and developed an agent-based model, which is one of the most effective tools for simulating complex systems. It also has unique advantages in simulating WEF allocation, which is very helpful in improving regional WEF use efficiency. By taking Ningdong Energy and Chemical Base as the research area, an agent-based water–energy–food model based on MESA library was developed using Python 3.9 language, which includes six types of agents and can explore and simulate the complex dynamic interactions in the supply and demand process of WEF sectors. Different behavior rules were proposed to quantify the interactions between WEF sectors of Ningdong Energy and Chemical Base. Four different scenarios were set up, namely, the baseline scenario, the water conservation scenario, the new reservoir scenario and the integrated scenario, and the uncertain system evolution processes between departments and resources under the four different scenarios were analyzed in detail to quantitatively analyze the evolution of the water–energy–food complex system of Ningdong Energy and Chemical Base, which has proven the effectiveness of the proposed model. The results show that: water allocation, energy consumption and food consumption in the domestic sector have similar degrees of impact, because the natural population growth rate does not change under different scenarios; water allocation in the food sector shows a trend corresponding to changes in crop yields; water allocation in the energy management sector shows an upward trend, the water allocation in the actual years 2016–2020 is almost the same, and in the forecast years 2021–2025, the baseline scenario and the water conservation scenario can’t meet the demand volume of the energy management sector due to limited water sources, so the total allocated water is lower than that in the increased reservoir and comprehensive scenario; the water allocated to ecological sector has a balanced situation, and the annual growth of the ecological greening coverage area is also balanced; the total water allocation also shows a trend of annual growth; regarding the annual energy volume that can be delivered to the area outside the base, the curve first grows sharply with a growth rate of about 19.85%, and then becomes slowly with a growth rate of about 3.53%. The total volume is expected to increase to 4.96 × 107 tce by 2025; the total energy, consumed energy and output energy, in general, shows a growing trend, and with the development of the economy and technology, the total energy of the base will reach 7.96 × 107 tce by 2025.
1. Introduction
The components of the water–energy–food nexus (WEF Nexus) are coordinated and constrained by each other, constituting a multivariate coupled reciprocal feeder dynamical system. The concept of the water–energy–food nexus was first introduced in 2011 at a conference in Bonn, later Germany [1]. Mujtaba and Prof. Elbashir organized workshops in Qatar and India in 2015, which extensively discussed the water–food–energy nexus to ensure a broader global public good [2]. There are various complex relationships between water, energy, and food sectors, such as energy cooling and food irrigation requiring significant water consumption, water extraction, distribution, transmission, and recycling, requiring energy, while food production, storage, and processing are increasingly dependent on energy, and food generates energy in the form of biomass [3,4]. It is estimated that by 2030, global water scarcity will reach 40%, energy demand will triple, and food demand will increase by 50% [5]. In addition, about 15% of global water withdrawals are used for energy production, 70% for food production, about 3% for power generation, and 6% for food production [6]. With the growth of population, social and economic development and improvements in people’s living standards, sharp contradictions have been formed between limited resource supply and growing demand, and the mutual promotion, constraints and interactions among resources, society, the economy and the ecological environment together constitute a complex system, which, together with the characteristics of both interdependence and competition among the three, make the water–energy–food interaction more complex, which may cause more far-reaching impacts. Therefore, it is necessary to quantify the interactions between the various resource demands without sacrificing any component of the relationship to meet future needs [7], yet these systems are often analyzed and planned independently, meaning that any strategy that focuses on a single resource is likely to negatively affect the other two [8].
In order to realize the cooperative optimal allocation and management of water resources, energy generation and food production, and ensure the security of water resources, energy and food, our predecessors have carried out a large number of relevant studies on the WEF nexus. Al-Ansari, Korre et al. (2015) developed an integrated energy, water and food life cycle assessment tool to assess the environmental impact of expanding food production in Qatar, demonstrating that the food system is the largest contributor to global warming [9]. Water, energy, food, land and climate form a tightly interconnected relationship, and determining how they interact and how changes in one department affect the other can require unreasonable time frames, and be very difficult and dangerous to achieve in practice. Sušnik, Chew et al. (2018) created realistic “simulations” through serious games to provide a safe environment for testing and evaluating the long-term impacts of policies [10]. Schlör, Venghaus et al. (2018) developed the WEF System City Index (NXI) to quantify the resilience of WEF relationships in cities, and the results indicate that the use of the NXI enables policy-makers to identify the interaction and prosperity gaps between cities in various regions of the world without reducing the complexity of the WEF system [11]. Chen, Yu et al. (2018) developed a coupled coordination model to quantify the relationship between water, energy and food, and the results show that the vulnerability level of the WEF system in the northwest region was mostly at level 1 [12]. Wu, Elshorbagy et al. (2021) integrated the production, supply, and demand of the WEF system into a system model based on a system dynamics model for the Canadian province of Saskatchewan, and the model results reveal varying degrees of sensitivity in the water, energy, and food sectors to socioeconomic and climate drivers, with higher temperatures directly contributing to water demand, and this slightly affects hydropower production. Thermal power generation is the most sensitive to GDP, followed by population, flow and temperature. Economic development and population growth increase end-use electricity consumption. Warmer air temperatures also require more electricity to cool space [13]. In Tabatabaie and Murthy’s work (2021), the three WEF resources were divided into 21 departments, and the total output of each sub-department was quantified using a linear time-varying input–output model; sensitivity and uncertainty analyses and multi-objective optimization were also performed to quantify the interdependencies among the WEFs [14]. Liu, Jiang et al. (2022) proposed a quantitative analysis framework based on WEAP-MODFLOW to analyze the interaction between WEF relationships in agricultural watersheds, which considers water-saving irrigation and drought scenarios to quantitatively analyze the impacts of surface water, groundwater, energy consumption, and food yield. Water, energy, and food are a complex system, and the studies done by the above scholars use different methods to provide useful information about the relationship between water, energy, and food, respectively [15].
Although the above models are powerful in describing water, energy, and food systems at a general level, they also have various disadvantages, such as the fact that life cycle analysis models are a static approach and are generally not used directly to analyze dynamic processes in complex systems [16], and system dynamics models lack the ability to represent heterogeneous interacting participants and lack the ability to represent micro-level processes and interactions [17]. These non-interactive modeling techniques, therefore, cannot fully capture the dynamics of synergies and trade-offs and the interactions that exist between the different entities involved, leading to the possibility that their results are difficult to achieve in some cases. At the same time, most of the existing studies consider the macroscopic large-scale perspective of the water–energy–food complex system, while fewer studies address the simulation of a synergistic water–energy–food network for energy and chemical bases in arid and semi-arid water-scarce regions.
The agent-based Modeling (ABM) approach, also known as multi-agent systems (MAS) in engineering disciplines, was developed based on the theory of complex adaptive systems, and provides a means to solve all the above challenges [18,19]. As an important tool for studying large complex systems such as “human–nature coupled systems”, multi-agent modeling has been widely used in many scientific fields. ABM is a class of computational models [20] that provides a “bottom-up” approach to system analysis, mainly by simulating the interactions between low-level micro-agents in a system and between agents and their environment, and exploring the “emergent” phenomena at the macro or system level [21], to quantify the water, energy and food nexus and explore their interactions prior to implementing policy or technology interventions [22,23], providing a research design program for policy management [19].
This work takes Ningdong Energy Chemical Industry Base (abbreviated as “Ningdong Base”) as the research area, which is a “national key development zone” with abundant energy resources, but there are problems here such as limited water resources, growing energy demand, insufficient food supply and other uncertainties in the system’s evolution process, and the disturbance of one of the subsystems can cause “cascading effects” in the other two subsystems, resulting in unpredictable consequences. With the development of social economy, the competition for resources in life, agricultural production, industry, and ecology has become more intense. The increasingly scarce freshwater resources, constantly changing food supply, and increasing energy demand, coupled with the new characteristics of interdependence and contradiction among the three, make the relationship between water, energy, and food more complex. ABM, as one of the most effective tools for simulating complex systems, has unique advantages in optimizing WEF allocation and improving the efficiency of regional WEF use.
This work enriches the application of ABM in water–energy–food research, aiming to simulate the resource flow and social interactions of the complex water food energy system in the Ningdong Base, and describe how to generalize these processes in the model. This work proposes a dynamic decision-making scheme, and develops an agent-based water–energy–food model based on the MESA library in Python 3.9 language to simulate the system evolutionary process of Ningdong Base. The evolution of complex water energy food systems in Ningdong Base was quantitatively analyzed by setting different scenarios.
2. Case Study Area and Data
2.1. Overview of Ningdong Base Research Area
Ningdong Base is a drought-sensitive area in northwest China (Figure 1). It is located in the east-central part of Ningxia, with a total planning area of 3484 km2 and a core area of 800 km2, which is a national key development zone approved by the State Council. Ningdong Base is an important energy base in China with abundant coal resources, but the industrial development here is inseparable from water resources, as coal mining, downstream coal-fired power generation and the coal chemical industry all need to consume a lot of water resources. Ningdong Base belongs to the semi-arid desert continental monsoon climate zone in the middle temperate zone, and its climate is characterized by aridity and low rainfall, with annual rainfall of only 300–500 mm and evaporation 4–6 times the rate of rainfall. Overall, the amounts of surface water and underground water resources in Ningdong Base have not changed significantly over the years, reaming basically stable at about 7.5 million m3; the amount of mine water gushing from unconventional water resources is large, but the utilization efficiency is not high. The development of Ningdong Base almost completely depends on the Yellow River water source. The large consumption of energy and water resources will certainly affect the consumption of food and water resources. With economic and social development and population growth, the demand for water resources, energy and food has been increasing sharply. The promulgation of a plan for ecological protection and high-quality development of the Yellow River Basin has set out higher requirements for the coordinated development between water resources, energy and food. In order to prevent the problem of a shortage of water resources, energy and food, it is necessary to quantitatively identify the problems between water resources, energy and food, and emphasize their coordinated development.
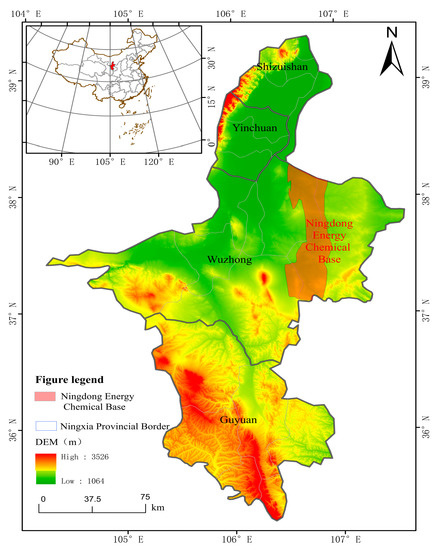
Figure 1.
Location map of Ningdong Base.
2.2. Data
The developed model involves six departments: development and reform department, life department, food department, energy department, water administration department, and natural and ecological department. The data used are related to the variables of each agent, and mainly involve water resources, energy, food, and social and economic information based on historical statistical data. This information is based on historical statistical data from government reports and local agricultural institutions, the literature, and statistical websites, all of which were used to represent the attributes of agents or define behavioral rules. The measured year is from 2016 to 2020, and the predicted year is from 2020 to 2025. Table 1 describes the input dataset used in the model and simulation (See Supplementary Materials for some detailed calendar year input data). For data not found in Ningdong Base, such as the irrigation water utilization coefficient, data from Ningxia have been used.

Table 1.
Data sources.
The prediction dataset used in the simulation was calculated using the exponential smoothing method, which is based on historical time data used to predict data for any future time period. The confidence interval is the default 95%. The specific variables used in this study include: Yellow River water volume, groundwater volume, unconventional water volume, irrigation water utilization coefficient, per capita daily water demand, crop prices, crop area, and urban green space coverage. The predicted values of coal and coal chemical products are designed using recursive formulas based on the main indicators of the “14th Five Year Plan for the Development of Ningdong Base”.
3. Methodology
3.1. Agent-Based Modeling (ABM)
ABM is a modeling approach developed based on the theory of complex adaptive systems [34]. It allows for the abstraction of elements of complex systems into independent, heterogeneous microscopic agents, and the study of macro-level “emergent” phenomena by specifying certain properties, rules of behavior, and interactions between agents and between agents and the environment, by performing “bottom-up” simulations of each microscopic subject. ABM is an effective tool for modeling complex nonlinear systems using nonlinear functions that use the subject’s behavior to derive the nature of the processes within the adaptive system under consideration [35]. This bottom-up modeling approach avoids the construction of complex numerical equations and solves the complexity problem in the simulation of complex systems. In general, the agent-based simulation model consists of three main components (Figure 2): agent, environment and interaction mechanism. The agent is an autonomous decision-maker or independent unit, which is autonomous, collaborative, adaptive and heterogeneous, and is able to respond dynamically to changes in the environment or the activities of other agents. The environment is a virtual world that simulates a complex system on which the subject depends and interacts with other agents [36], and the interaction mechanism includes the interaction between subject and subject, and between a subject and the subject’s environment. Interactions between agents are competitive and manifest through the consumption of public resources, or through the supply and demand in the market [19].
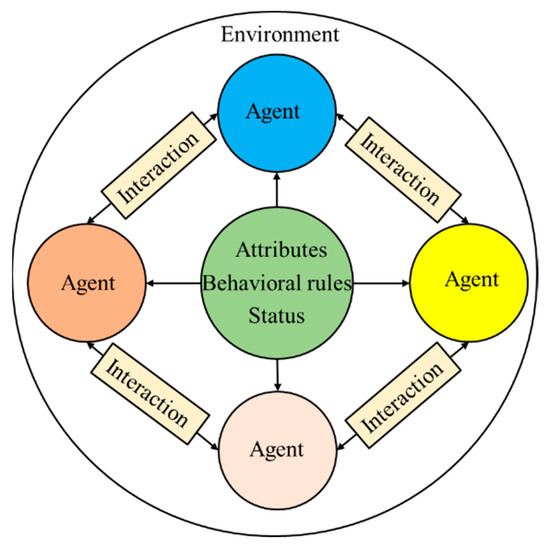
Figure 2.
Multi-agent model composition.
In the case study of this paper, an agent-based water–energy–food model has been developed based on the MESA library using Python 3.9 languagePython 3.9. Python 3.9 can use the classes defined in the framework to create different types of behavioral models. The ABM can use “what-if” analysis to quantify impacts and model possible outcomes to guide departmental decisions [37]. The upper entities of the agent are resources, managers and users. Resources represent discrete resources such as water, energy and food; users consume resources, while managers regulate and manage resources flowing to users. In the high-level entity, one can create numerous low-level entities.
3.2. The Programming Software
Usually, agent-based modeling can be implemented in two ways: using packaged simulation software such as AnyLogic 8.7.12, MASON.20 or NetLogo 6.2.2, or custom development using high-level programming languages [38]. The agent-based modeling approach proposed in this study falls into the latter category, and the developed ABM model is based on the Python 3.9 programming language, a high-level combination of interpretative, compiled, interactive, and object-oriented scripting language. Realistic complex problems can be solved by dividing them into smaller subproblems stored in so-called “agents”. In addition, Python 3.9 has a rich library that can handle a variety of tasks. This study uses the MESA library in Python 3.9Python 3.9 to build ABM models [39], which allows users to use built-in core components (such as spatial lattices and agent schedulers), customize objects, and build interactions between agents and between agents and the environment to enable the fast creation of agent-based models, visualize them using a browser-based interface, and use Python 3.9’s data analysis tools to analyze their results [40] (Masad D 2015). By running the model several times, we smooth out some random “noise” and get the overall expected behavior of the model. The following section details the application of the different components of the MESA library in this case study.
3.3. Model Design
3.3.1. Agent Designed in the Model
The upper-level entities of the agent are resources, managers, and users. Resources represent discrete amounts of resources water, energy and food; users consume resources, while managers regulate and manage the flow of resources to users. To represent the characteristics of the Ningdong Base, the following lower-level entities are implemented (Table 2). There are six types of agents represented in this model: nature and ecology department, life department, food department, energy department, nature and ecology department, and water administration department. All six of these departments, as agents, are government agencies.

Table 2.
Entities in the Ningdong Energy Chemical Industry Base.
3.3.2. Defining Attributes and Behaviors for an Agent-Based Model Development
In this work, the living intelligent elements in the water–energy–food complex system of Ningdong Base are abstracted as agents in the water–energy–food multi-agent system. Based on this, six specific departments are finally identified after theoretical analyses by drawing on the existing indicators in the relevant literature, and considering the availability of data, namely, the development and reform department, the life department, the food department, the energy department, the nature and ecology department and the water administration authority, who together interact in a bounded environment representing the local water–energy–food system. The main attributes and behavioral rules characterizing agents involved in this work (Table 3).

Table 3.
General features of agents involved in this study.
3.3.3. The Modeling Framework
The modeling framework is structured as shown in Figure 3, emphasizing the linkages between decision-making, human activities and the WEF system. The ABM process consists of four main phases. In the first stage, the model receives historical water, energy and economic data information as inputs. Based on the collected data, the above input data can be considered as the boundary conditions of the ABM environment. In the second stage, the user’s demand is calculated in advance and the user’s variable “demand” is updated according to a specific sub-model. In the third stage, the agents perform the decision-making process. Simulating the competitive interaction of users and managers with water, energy and food resources, the agent interaction process considers the constraints on the agent’s behavior (The little man holding the checkmark and cross symbol in the figure represents the agent considering the constraints and thus making a decision.), e.g., recycled water cannot be used for domestic purposes and groundwater cannot be used for energy and industrial production. At the same time, it is assumed that departments other than the development and reform department have priority in the use of water, energy and food. In the fourth stage, the resource allocation is calculated for each agent for each year.
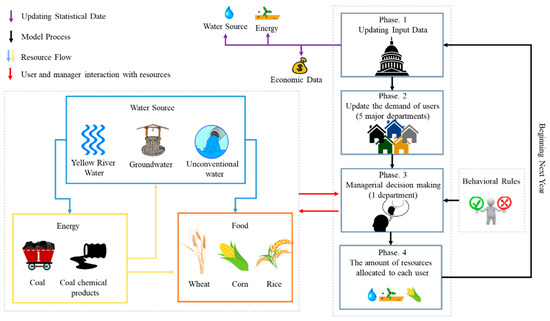
Figure 3.
Overview diagram of simulation model.
Previous studies have emphasized the use of simulation models to optimize water use in individual departments, but in arid regions where multiple departments compete for limited resources, trade-offs between different departments require a holistic approach to resource allocation.
Each year, the nature and ecology department determines the allocation of each department according to the updated request of each stakeholder and the rules of water source and design. It then calculates the energy and food consumption of each department according to the energy and food resources, and then enters into the next year.
Figure 3 shows a schematic diagram of the ABM simulation model. We used the model to simulate a 5-year period from 2016 to 2020 with a temporal resolution of one year. The ABM process consists of four main phases.
In the first stage, the model receives historical water, energy and economic data as inputs. Based on the collected data, the aforementioned input data can be considered as boundary conditions for the ABM environments. The input water and energy data include the amount of water and energy capacity, and the statistical economic parameters include the sale price of crops, and the value of the boundary condition will be updated at the beginning of each loop.
In the second stage, the resource demand of each department is calculated.
Life department. For simplicity, we have aggregated the urban domestic demand of the Ningdong Base to a representative body, the life department agent. Per capita urban domestic water use in the Ningdong Base was calculated based on the monthly average of urban water use from 2016 to 2020. In all policy scenarios, the annual life department allocation is calculated by the nature and ecology department based on the life department demand.
where is the population at time-step i, is days in a year, is daily domestic water use per capita.
Energy demand in the life department:
where is the population at time-step i, Day is the number of days in a year, is personal daily electricity use.
Life department food demand:
where is the population at time-step i, Day is the number of days in a year, is daily food consumption per person.
Food department. In the agent of food, farmers’ “demand” is calculated based on defined auxiliary variables such as cropping structure, irrigated area, and specific water requirements per unit area. In an economically oriented ABM, farmers are assumed to have full foresight and knowledge, and they are rational maximizers of their self-interest. In this case, farmers only want to make as much profit as possible with the size of their available farmland. Assuming that the main crop types in the Ningdong Base are wheat, corn and rice, the sales prices of the main crop types in the study area are queried through the China Economic and Social Data Platform as shown in Figure 4. The upward trend after the sudden decline in prices is due to the impact of domestic supply and demand and increased national de-stocking in 2019, as a result of which the region’s food crop market demand slowed down and prices fell. In 2020 food prices rose across the board, mainly due to the global spread of the COVID-19, extreme weather, and energy price increases to fund the raised costs of planting. A large number of food purchases are the result of food price increases, and the corn shortage also drove up food prices. The irrigated area of the crop is calculated by a genetic algorithm with the goal of maximizing the profit obtained (Figure 5). Based on the water demand of the selected crop type and the planted area of the agent, the farmers’ irrigation water demand was estimated. Farmers obtain irrigation water from surface water and groundwater. In general, the water needed for food irrigation comes mainly from the Yellow River. If the local surface water cannot meet the irrigation water demand, farmers can extract their unmet demand from groundwater resources through legal or illegal wells and use groundwater as a supplementary water source for irrigation [20]. It is worth noting that in the agricultural decision-making process, even under severe drought conditions, the lower line of water for food irrigation should be guaranteed to prevent the occurrence of fallow farmland.
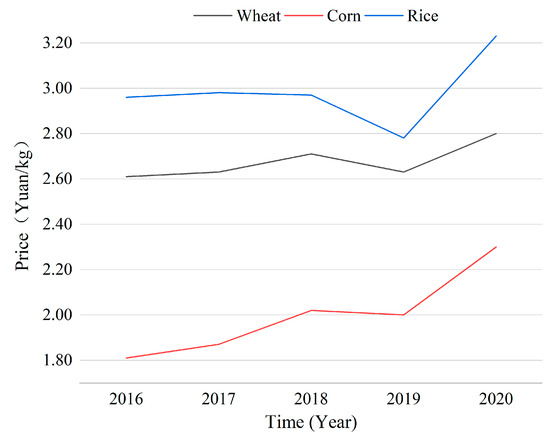
Figure 4.
The market prices of the main crop types in the study area.
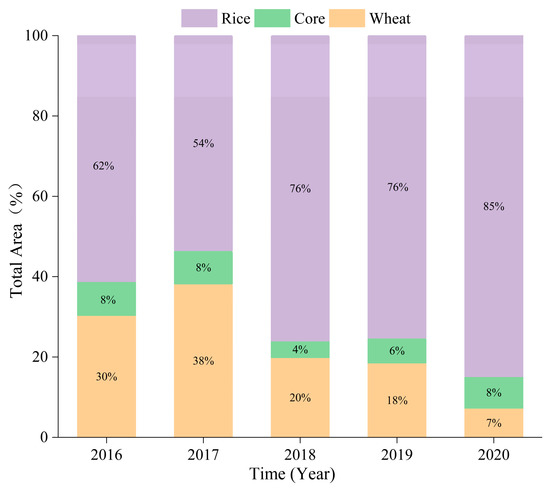
Figure 5.
Average total farming area for each crop type in ABM (in percentage).
Energy demand in the food department:
where is energy consumption for planting at time-step i, Day is energy consumption for harvesting at time-step i, and is energy consumption for irrigation at time-step i.
Energy department. The core function of the energy department agent in Ningdong Base is the supply of energy and the consumption of water resources. It considers the amount of water consumed by coal and coal products (raw coal, oil, olefins, glycols, methanol and thermal power) and the amount of energy that can be delivered out of the Ningdong Base after meeting its energy demand.
Nature and ecology department. The natural and ecological management department agent considers the Ningdong Base from an environmental point of view, mainly including the amount of water used for watering roads, landscaping and other purposes, as well as the energy consumed in the process of water use.
Water administration department. The main function of the water administration department agent in Ningdong Base is the supply of water sources to meet the demand for water from the agents in other departments. In the water administration authority agent, water sources such as Yellow River water, groundwater and other water are used to allocate water to each water user agent, mainly for domestic, industrial, ecological and agricultural uses, and energy consumption is considered from the perspective of water supply, water use, consumption and discharge; auxiliary variables such as water treatment energy consumption and drainage energy consumption are used.
In the third stage of the model simulation, in view of the water source conditions of the Ningdong Base, the following allocation principles were adhered to:
- (1)
- “Supply by quantity” and “living first, then production”, giving priority to residential water and important industrial water, and reasonably arranging production, ecological and other water;
- (2)
- The unified deployment of Yellow River water, non-conventional water sources (mine water, recycled water) and groundwater;
- (3)
- The superior water supply. The water needed for living in each park is supplied by the Yellow River, and the water used in coal mines is given priority over mine dewatering water, while the remaining mine dewatering water is mainly used in coal washing and other water industries with low water quality requirements.
In the water distribution process of Ningdong Base, the core idea is that when the agent of the nature and ecology department distributes water, the water demand of the agent of the life department is satisfied first, the remaining water satisfies the water consumption of the agent of the food department and the agent of the energy department, and finally the water consumption of the agent of the nature and ecology department. According to the water distribution rules designed in this study, the detailed steps are as follows, and the water distribution rules and constraints of Ningdong Base are shown in Figure 6.
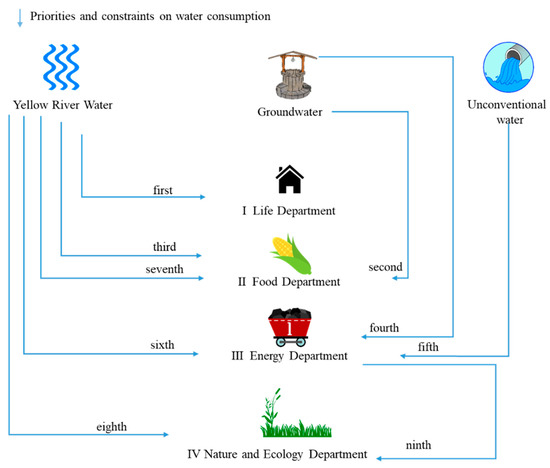
Figure 6.
Water allocation in the development and reform department.
It is assumed that the water consumption of the agent of the life department is supplied by Yellow River water; the water consumption of the agent of the food department is supplied by Yellow River water and groundwater. The minimum line of water consumption of the agent of the food department is satisfied by groundwater first; if the requirement is not satisfied, all the groundwater is supplied to food water before using the remaining value of Yellow River water to meet the minimum limit of water used by the agent of the food department. It is judged whether agent of the food department uses all the groundwater; if not, all the remaining water is allocated to the agent of the energy department, and all the non-conventional water is also supplied to the agent of the energy department. The remaining water used by the agent of the energy department is supplied by the Yellow River, and the remaining Yellow River water is supplied to the agent of the food department after deducting the bottom line. The water demand of the agent of the nature and ecology department is supplied by Yellow River water first, and if the Yellow River water is not satisfactory, it is supplied by industrial return water; industrial return water is equal to the product of the industrial water regression coefficient (0.68) and industrial water consumption.
The model for the consumption of energy and food by the agent in each department is synchronized in the process of water supply to each department.
In the fourth stage, the resource allocation is calculated for each agent for each year.
4. Results and Discussion
4.1. Model Validation
Usually, in general measurements as well as experimental data processing, the relative error should be controlled within 5%, otherwise it means that the measurement results are not accurate enough. The relative errors calculated in this paper are all less than 5%, so the results of the simulated average value of water distribution in each department of Ningdong Base are accurate and can reflect the basic situation of water distribution in Ningdong Base. Table 4 lists a more detailed comparison of the measured and simulated water distribution using the average value. Possible reasons for the existence of errors are that when performing water consumption calculations for the energy sector, the water distribution calculations for coal and coal products, which account for a significant proportion of the water consumption in the Ningdong Base, were considered, and the water distribution for other energy sources such as green hydrogen was not considered, because of the difficulty of data collection; it is also possible that certain parameters were randomly processed when performing water demand calculations for each sector; for example, when calculating the daily domestic water consumption per person in rural areas at 0.04–0.06 m3, which led to some errors in the final results. The limitation of the agent-based modeling approach used in the study is that the data are not sufficient to parameterize the attributes or decisions of the agents, so stochastic treatment was done and assumptions were made about the constructed model. We assumed that all agents in the base aim to meet their own resource needs or have the highest resource utilization rate; other external factors, such as climate change and natural disasters, are not considered to affect the model, and in the model design only factors that have a significant impact on the system within the base are considered, such as resource prices, resource utilization rates, and changes in planting structure.

Table 4.
Measured and simulated values of Ningdong Base.
4.2. Scenario Design
In order to simulate the evolution of resource flow and social interaction in the water–energy–food system of Ningdong Base under different policies, four scenarios were designed: baseline scenario, water saving scenario, increased reservoir scenario, and integrated scenario (water saving scenario and increased reservoir scenario), as shown in Table 5. All models were run from 2016 to 2020 as the actual measurement years and from 2020 to 2025 as the simulated forecast years. We ran 10 simulation runs for each scenario, and by running the models multiple times, we smoothed out some of the stochastic “noise” and obtained the overall expected behavior of the models. We will focus on analyzing the average of the 10 runs for each scenario, with a temporal resolution of years for the model output, using Python 3.9 software for model construction, data analysis, and visualization.

Table 5.
Description of scenarios.
The baseline scenario (business as usual) is used for modeling and projecting the nexus of water–food–energy at Ningdong Base under the current (2016 to 2020) and future (2021 to 2025) conditions. The water saving scenario (water saving irrigation) could provide insights into the impacts of improved irrigation water use efficiency. For the scenario of increasing reservoirs, the main focus is on meeting the amount of resources required by all departments, which here mainly refers to meeting the water demand of each department, with other conditions being the same as in the baseline scenario. The combined scenario is a combination of the water savings scenario and the increasing reservoirs scenario, both of which increase the irrigation water use coefficient and meet all the demanded quantities for each department.
4.3. Scenario Analysis
The amount of resources allocated to the life department in the baseline scenario is shown in Figure 7, Figure 8 and Figure 9. The water consumption of the life department shows a sawtooth upward trend, mainly because of the random numbers assigned to the calculation of rural water consumption by people and animals. As the population grows, the energy consumption and food consumption in the life department show a gradual upward trend. Independent of the scenario, the resource demand of the life department has the highest priority, so there are always sufficient resources to meet its demand. Similarly, the amount of water needed for food irrigation must meet the minimum that arable land cannot be left unused, and the resource supply constraints are limited to the food department, the energy department, and the nature and ecology department. In other words, the life department has a similar degree of influence in all scenarios, since the natural population growth rate does not change in the different scenarios, and the demand for resources in the life department is equal to the supply of resources.
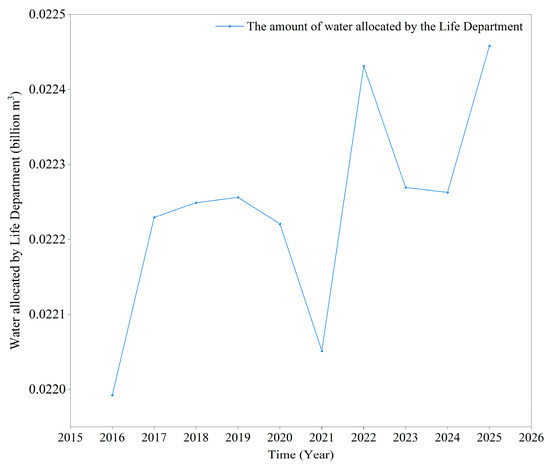
Figure 7.
The amount of water allocated to the life department.
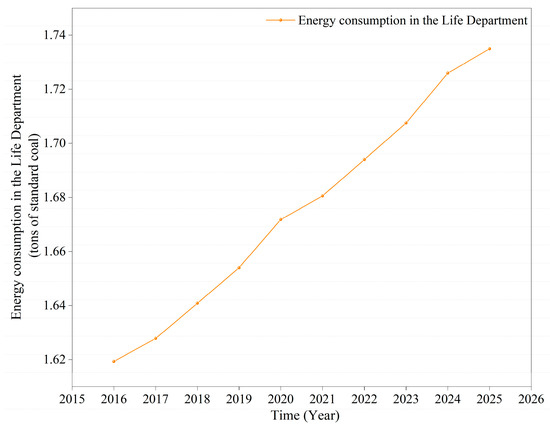
Figure 8.
Energy consumption in the life department.
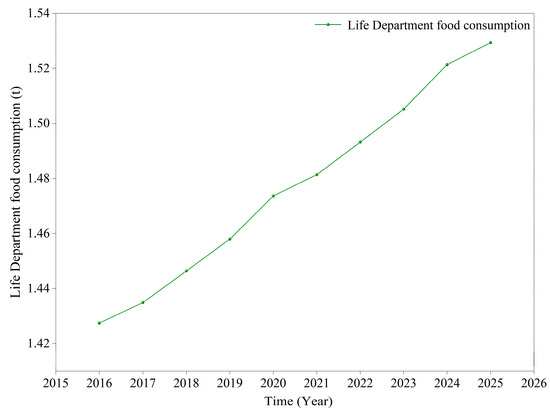
Figure 9.
Life department food consumption.
Under the baseline scenario, the food department’s water allocation at the Ningdong Base from 2016 to 2025 shows a fluctuating trend, with the acreage of wheat, corn, and rice adjusted annually based on these external factors due to changes in market prices, different irrigation quotas, and changes in farmers’ crop-planting preferences, which in turn can affect changes in food irrigation water requirements, as shown in Figure 10. The change in irrigation water allocation remains almost the same in the increasing reservoir scenario as in the baseline scenario. However, in the water conservation scenario and the integrated scenario, due to the increase in the irrigation water use coefficient, the irrigation water allocations for the water conservation and integrated scenarios show a significant decline compared to the baseline scenario and the reservoir increase scenario, with a decline of about 19.96% in the water conservation scenario and 21.61% in the integrated scenario compared to the baseline scenario.
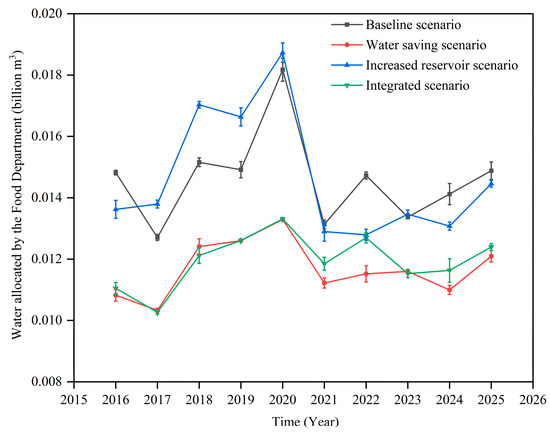
Figure 10.
Water allocated to the food department under different scenarios.
Based on the crop-planting area and the irrigation water requirement for each crop, the crop yields of the Ningdong Base were calculated as shown in Figure 11. The annual crop yield trends, in different scenarios, are roughly the same, with rice yielding the most each year, which can be as high as 4946.53 t, followed by corn and wheat. This perspective of crop yield shows that most farmers choose to grow the most profitable crops, and the increased efficiency of irrigation makes it possible to produce a comparable and relatively large amount of food production with relatively little water. For example, among the water allocations managed by the food department, the baseline scenario and the scenario with increased reservoirs both have the highest water allocations in 2020, which are 0.0182 billion m3 and 0.0188 billion m3, respectively, and the highest allocations in the water conservation scenario and the composite scenario are 0.01329 billion m3 and 0.01332 billion m3, respectively, whereas they correspond to rice yields in the baseline scenario, the scenario with water conservation, scenario with increased reservoirs and the composite scenario are 4805.08t, 4586.06t, 4946.53t and 4597.81t, respectively; the lowest water allotment in the composite scenario in 2017 is 0.01023 billion m3, and the rice yield is 3008.31t, while the rice yield in the baseline scenario is 2784.78t, and the rice yield is higher than that in the baseline scenario by 223.53 t. The water allocation in the food department shows a trend of change corresponding to the change in crop yield.
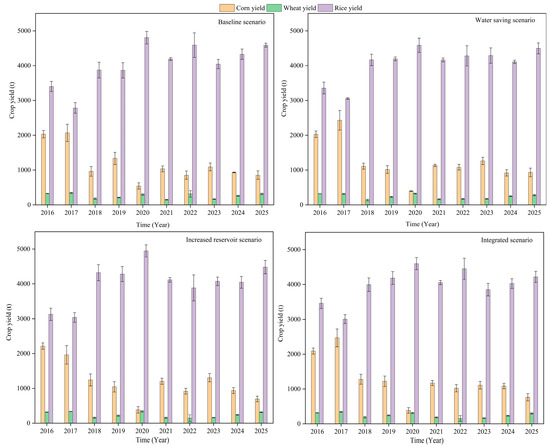
Figure 11.
Crop yield under different scenarios.
Under the baseline scenario, the water allocation in the energy department of the Ningdong Base for 2016–2025 shows an increasing trend, as shown in Figure 12 and Figure 13. The water allocation in the measured years 2016–2020 is relatively flat compared to the water allocation in the forecast years 2021–2025, as the forecast years are designed with the main indicators of the 14th Five-Year Plan according to the recursive formula, so the water allocation in the forecast years shows a nearly linear change. In the water saving scenario, the total water supply is constant and the irrigation efficiency increases, such that the water saved by the food department is used by the energy department, and under the water saving scenario, the energy department is allocated a slightly higher proportion of water than in the baseline scenario, with the energy department accounting for about 99.9% of the baseline scenario, and the trend remains almost the same. The changes in water allocation for the scenario with increased reservoirs and the integrated scenario remain almost the same, showing an upward trend. Among the four scenarios, the water allocation for the actual measurement years (2016–2020) is almost the same, indicating that the water supply can meet the demand volume of the energy department during that period, and in the 2020–2025 forecast years, the baseline scenario and the water conservation scenario are not able to meet the energy department’s requirements due to the limitation of water sources. In the 2020–2025 forecast years, the baseline and water conservation scenarios do not meet the demand of the energy department due to water supply constraints, so the water allocation here is lower than that of the additional reservoirs and the combined scenario.
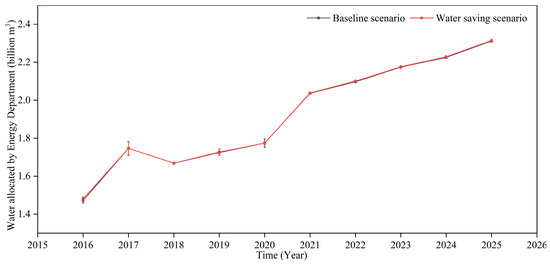
Figure 12.
Energy department water allocation of baseline scenario and water saving scenario.
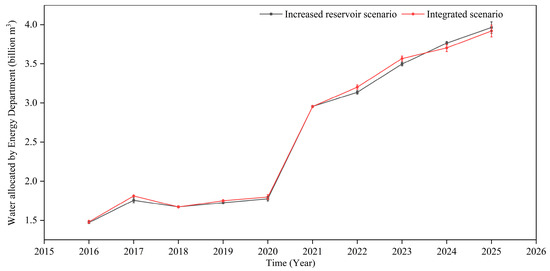
Figure 13.
Water allocation in energy departments under increased water allocation for reservoir scenarios and integrated scenario.
As shown in Figure 14, the water allocation for the nature and ecology department shows an increasing trend from year to year. The source of water supply for the nature and ecology department is the Yellow River water or industrial return water; the supply of Yellow River water is limited, but the industrial return water can be recycled, so in the four scenarios, the water allocation for the nature and ecology department is equal to its demand, i.e., the balance of supply and demand, and as the ecological greening coverage area grows year by year, the water allocation also shows a trend of increasing year by year, due to the greening management. Due to the different irrigation systems used, the water allocated to the nature and ecology departments in different scenarios may be slightly different, but the change trend is almost the same.
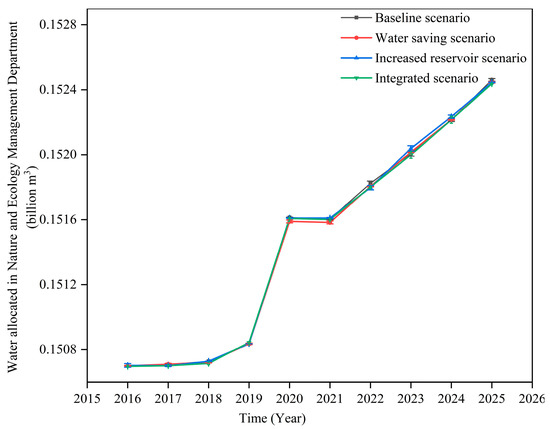
Figure 14.
Water allocated in nature and ecology department under different scenarios.
In the four different scenarios, the total water allocation for each department shows an upward trend. As shown in Figure 15, it can be seen that the total water allocation for the baseline scenario and the water conservation scenario is almost the same. Although the irrigation water utilization coefficient has been increased to 0.68, the amount of water saved from irrigation still cannot meet the amount of water needed for the energy department, and additional water sources are needed to supplement it; the scenario with increased reservoirs and the integrated scenario can both do so. The water allocation rate for the baseline scenario and the water saving scenario is about 7.62% after 2020, and the water allocation rate for the reservoir increase scenario and the integrated scenario is about 37.13%, which represents an increase of 29.51%. In the baseline scenario, water allocated to the nature and ecology department is mainly provided by industrial return water, except in 2016, when 0.1487 billion m3 of Yellow River water was consumed, indicating that the water supplied is not able to meet the water demand requirements of the Energy Department. The scenario of increasing reservoirs and the integrated scenario with nearly the same trend of water allocation are able to meet the actual demands of each department.
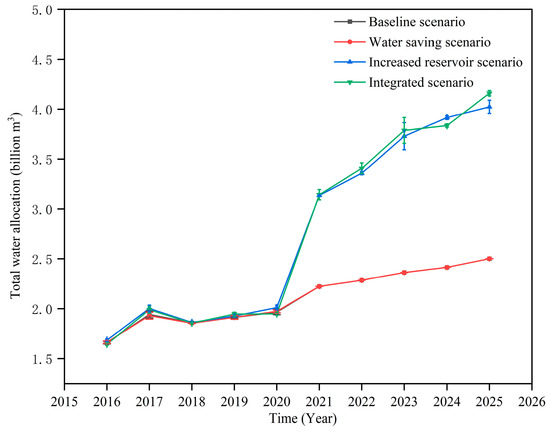
Figure 15.
Total water allocation for different scenarios.
The energy consumption of the energy department, as a whole, shows an upward trend change, as shown in Figure 16. The energy consumption of the energy department is mainly determined by the scale of coal chemical products and the unit energy consumption of producing this product, and in 2017, because the scale of coal production capacity increased compared with 2016, its energy consumption also increased relatively, because when the scenario setting was carried out, it was mainly focused on water, and no parameters about regulating energy were set, so the change in energy consumption did not have a strong effect on the scenario setting. However, since the energy consumption in the unit area is assigned random numbers when calculating the energy consumption of the energy department, there are fluctuations during each operation, so we use the average value of the Ningdong Base as the energy consumption of the energy department. From the graph, we can see that the energy consumption of the energy department increases as the scale of coal chemical products expands, but without exceeding the maximum value of the important indexes in the 14th Five-Year Plan of Ningdong, which will reach 3.0 × 10⁷ tcein 2025, up from 1.61 × 10⁷ tce in 2016; this is an increase of 1.39 × 10⁷ tce, and it will continue to grow as much as the scale allows.
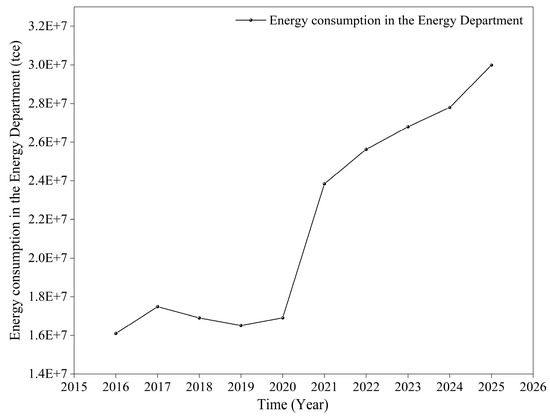
Figure 16.
Energy consumption in the energy department.
The energy consumption of the food department shows a fluctuating trend. The energy consumption of the department contains three parts: cultivation energy consumption, irrigation energy consumption and harvesting energy consumption, and the parameters involved in calculating the energy consumption of the food department are the planting area and the average mu energy consumption index. The average mu energy consumption is within a certain range, so the departmental energy consumption is also within a certain range. The minimum value is 457.57 tce and the maximum value is 459.91 tce.
The energy consumption in the nature and ecological management department has shown and still shows an increasing trend in different scenarios, as shown in Figure 17. The main factors affecting energy consumption are average energy consumption per acre and urban green space coverage, which is increasing every year, so energy consumption is also increasing.
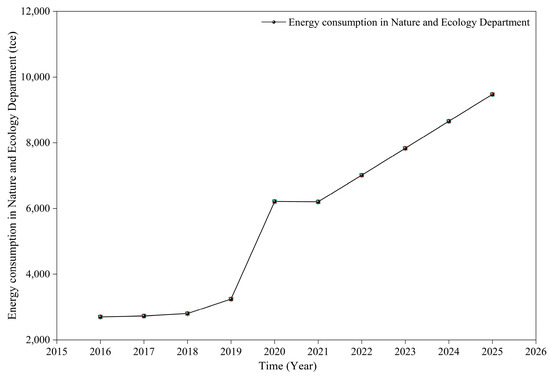
Figure 17.
Energy consumption in the nature and ecology department.
After meeting the energy demand of the study area, the surplus energy can be sold at a certain price. Figure 18 shows the amount of energy that can be delivered to the area outside the base each year; the curve increases sharply first, with a growth rate of about 19.85%, and then slowly with a growth rate of about 3.53%. In 2016, the energy output was 2.42 × 10⁷ tce, which is expected to increase to 4.96 × 107 tce by 2025. Figure 19 shows the trends of total energy, consumed energy and output energy, where orange indicates the total energy volume of Ningdong Base, green indicates the energy output from Ningdong Base to outside the base, and purple indicates the actual energy consumed by each department within the base. It can be clearly seen that the overall trend shows an increase. With the development of economy and technology, the total energy of the base will reach 7.96 × 107 tce by 2025.
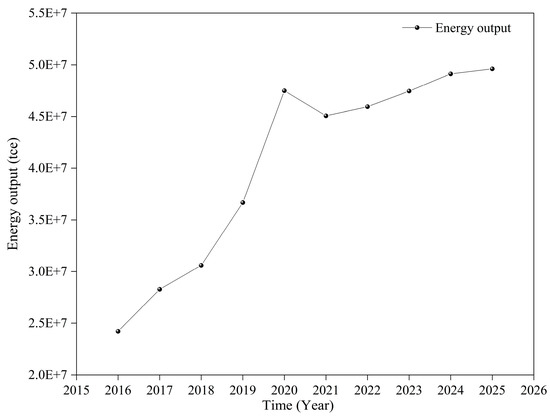
Figure 18.
Energy output.
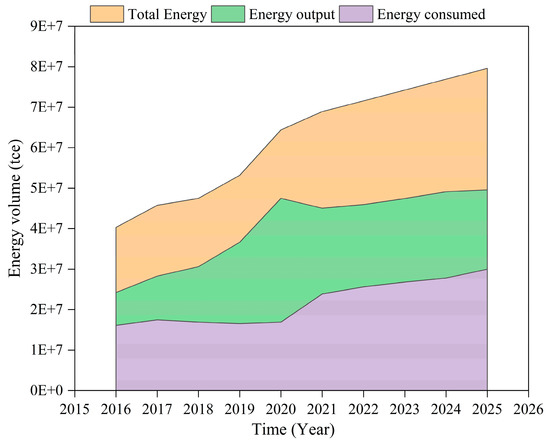
Figure 19.
Trends in total energy, energy output and energy consumed.
5. Conclusions
Based on the analysis of the complex system of water–energy–food in Ningdong Base, four different scenarios were set up, namely, the baseline scenario, the water conservation scenario, the scenario of increasing reservoirs and the integrated scenario, and the uncertain system evolution results between each department and resources under the four different scenarios were analyzed in detail.
The degree of impact of the life department is similar in all scenarios, since the natural population growth rate does not change in the different scenarios, and the demand for resources in the life department is equal to the supply of resources.
The perspective of crop production shows that most farmers choose to grow the most profitable crops, and the increase in irrigation efficiency allows them to produce a comparable or relatively large amount of food production with relatively little water. The lowest water allocation in the integrated scenario in 2017 was 010.23 million m3, with a rice yield of 3008.31 t, while the baseline scenario had a rice yield of 2784.78 t. The rice yield was 223.53 t higher than the baseline scenario, and the water allocation in the food department showed a trend corresponding to the change in crop yield.
The water allocation for the energy management sector showed an upward trend, with almost the same amount of water allocated for the 2016–2020 actual years, and in the 2021–2025 projection years, the baseline scenario and the water conservation scenario are not able to meet the amount demanded by the energy management sector due to the limitation of water sources, so water allocation is lower here than under the increased reservoir and integrated scenarios.
The water allocation of the nature and ecology department is equal to its demand, i.e., there is a balance in supply and demand, and with the annual growth of the ecological greening coverage area, the water allocation also shows a trend of annual growth, due to the different irrigation systems of greening management, so the water allocated to the nature and ecology department in different scenarios will be slightly different, but the change trend is nearly the same.
The total amount of water allocated in the base scenario and the water saving scenario is almost the same; although the irrigation water utilization coefficient has been increased to 0.68, the amount of water saved via irrigation still cannot meet the amount of water demanded by the energy department, and additional water sources are needed to supplement it. The increased reservoir scenario and the integrated scenario can supply the amount of water needed by both the energy department and the nature and ecology department.
The amount of energy that can be delivered to the area outside the base each year showed a curve that first increases sharply at a rate of about 19.85%, and then slowly at a rate of about 3.53%.
In conditions where water cannot be adequately supplied, priority can be given to the water saving scenario and the integrated scenario. Under conditions where water is adequately supplied, all these scenarios can be considered, but the integrated scenario is recommended because it considers improvements in irrigation water efficiency, which can save some of the water while meeting the amount of demand.
6. Limitations and Future Research Directions
Agent-based modeling (ABM) is a modeling method developed based on complex adaptive systems theory. It can simulate the real world (Ningdong Base), decompose the complex system’s simulation into six major categories, and give the six types of agent certain attributes, behaviors and interaction mechanisms. The heterogeneous agents are simulated “top-down”, and the process of resource flow and social interaction in the demand and supply system between each agent is studied. The developed model is a coupled natural and social system in which resources and departments interact and generate feedback loops. That is, there is competition among departments for resources, and according to the priority use of resources by each department, the department that uses resources first will make the amount of resources allocated to other departments later decrease. Meanwhile, the availability of resources also affects the allocation of resources, because each departmental agent responds to the availability of resources by changing its behavior in using resources, such as reducing the allocation of resources. This bottom-up modeling approach can effectively avoid the construction of complex numerical equations and solve the complexity problems in complex system simulation; however, the bottom-up multi-intelligent modeling data demand is large, and computationally intensive, which limits the simulation scale to some extent, while more factors need to be considered in the modeling process; for example, the availability of water attributes of environmental subjects can be added in the future. Although significant progress has been made in research on the water–energy–food (WEF) nexus, there are still many limitations that require further research to extend and improve it.
Future work will explore the interactions between multiple different agents in each department, including consideration of economic inequality among Ningdong Base residents and the setting of more household user agents for Ningdong Base. In the future, industrial stakeholders can also be decomposed to include more diversity and heterogeneous firm agents, large and small, in the model. Future efforts are needed to improve the model’s robustness and representativeness to reflect the interactions between multiple stakeholders and their environments across different scales, departments, and regions. It should be noted that since the Ningdong Base is still under planning and construction, the data considered in the paper are mainly set on a yearly basis, related to the research scale.
Supplementary Materials
The following supporting information can be downloaded at: https://www.mdpi.com/article/10.3390/su151411428/s1, Figure S1. Measured and predicted water supply from the Yellow River at Ningdong Base. Figure S2. Measured and predicted groundwater supply at Ningdong Base. Figure S3. Measured and predicted non-conventional water supply at Ningdong Base. Figure S4. Measured and predicted irrigation water utilization coefficient of Ningdong Base. Figure S5. Measured and predicted daily per capita domestic water demand of Ningdong Base. Figure S6. Measured and predicted crop prices at Ningdong base. Figure S7. Measured and predicted crop area in Ningdong Base. Figure S8. Measured and predicted urban green space area in Ningdong Base. Table S1: Entities in the Ningdong Energy Chemical Industry Base.
Author Contributions
Conceptualization, M.Z. and Y.J.; Methodology, M.Z. and Y.J.; Validation, M.Z., G.Y.; Formal analysis, M.Z.; Investigation, M.Z. and G.Y.; Resources, M.Z. and X.W.; Data curation, M.Z. and G.Y.; Writing – original draft, M.Z.; Writing – review & editing, M.Z., G.Y., Y.J. and X.W.; Visualization, M.Z. and G.Y.; Supervision, Y.J. and X.W.; Project administration, Y.J. and X.W.; Funding acquisition, Y.J. All authors have read and agreed to the published version of the manuscript.
Funding
The study was supported by National Natural Science Foundation of China (No. 41961124006, 52121006, 51979184, 51409219), Young Top-Notch Talent Support Program of National High-level Talents Special Support Plan, Research Project of Ministry of Natural Resources (No. 20210103), Six Talents Peak Project of Jiangsu Province (No. JNHB-068) and 333 High-level Talents Cultivation Project of Jiangsu Province for providing financial support for this research. We are also thankful to anonymous reviewers and editors for their helpful comments and suggestions.
Data Availability Statement
We don’t have the permission to provide the related data at the moment.
Conflicts of Interest
The authors declare no conflict of interest.
References
- Hoff, H. Understanding the Nexus, Background Paper for the Bonn Conference 2011: The Water-Energy-Food Security Nexus; Stockholm Environment Institute: Stockholm, Sweden, 2011. [Google Scholar]
- Abdelaziz, A.; Abidin, S.Z.; Adhitya, A.; Ahmed, W.; Al-Habsi, N.; Alnouri, S.; Al-Obaidi, M.; Alsadaie, S.; Altaee, A.; Aryafar, M.; et al. The Water-Food-Energy Nexus: Processes, Technologies, and Challenges, 1st ed.; Mujtaba, I.M., Srinivasan, R., Eds.; CRC Press: Boca Raton, FL, USA, 2017; p. 792. ISBN 9781315153209. [Google Scholar]
- Debecker, D.P.; Kuok, H.K.; Moores, A.; Rossi, L.M.; Sels, B.; Allen, D.T.; Subramaniam, B. Shaping effective practices for incorporating sustainability assessment in manuscripts submitted to ACS Sustainable Chemistry & Engineering: Catalysis and catalytic processes. ACS Sustain. Chem. Eng. 2021, 9, 4936–4940. [Google Scholar]
- Modak, A.G.; Mankar, A.R.; Mankar, A.R.; Pant, K.K.; Bhasin, V.; Nayak, C.; Bhattacharya, S. Controlled synthesis of Ru-single-atoms on ordered mesoporous phosphine polymers for microwave-assisted conversion of biomass-derived sugars to artificial sweeteners. Nanoscale 2022, 14, 15875–15888. [Google Scholar] [CrossRef]
- Grimm, V.; Berger, U.; DeAngelis, D.L.; Polhill, J.G.; Giske, J.; Railsback, S.F. The ODD protocol: A review and first update. Ecol. Model. 2010, 221, 2760–2768. [Google Scholar] [CrossRef]
- Zhang, X.-N.; Guo, Q.-P.; Shen, X.-X.; Yu, S.-W.; Qiu, G.-Y. Water quality, agriculture and food safety in China: Current situation, trends, interdependencies, and management. J. Integr. Agric. 2015, 14, 2365–2379. [Google Scholar] [CrossRef]
- Lubega, W.N.; Farid, A.M. Quantitative engineering systems modeling and analysis of the energy–water nexus. Appl. Energy 2014, 135, 142–157. [Google Scholar] [CrossRef]
- Eftelioglu, E.; Jiang, Z.; Tang, X.; Shekhar, S. The Nexus of Food, Energy, and Water Resources: Visions and Challenges in Spatial Computing. In Advances in Geocomputation; Springer: Cham, Switzerland, 2017; pp. 5–20. [Google Scholar] [CrossRef]
- Al-Ansari, T.; Korre, A.; Nie, Z.; Shah, N. Development of a life cycle assessment tool for the assessment of food production systems within the energy, water and food nexus. Sustain. Prod. Consum. 2015, 2, 52–66. [Google Scholar] [CrossRef]
- Sušnik, J.; Chew, C.; Domingo, X.; Mereu, S.; Trabucco, A.; Evans, B.; Vamvakeridou-Lyroudia, L.; Savić, D.A.; Laspidou, C.; Brouwer, F. Multi-stakeholder development of a serious game to explore the water-energy-food-land-climate nexus: The SIM4NEXUS approach. Water 2018, 10, 139. [Google Scholar] [CrossRef]
- Schlör, H.; Venghaus, S.; Hake, J.-F. The FEW-Nexus city index—Measuring urban resilience. Appl. Energy 2018, 210, 382–392. [Google Scholar] [CrossRef]
- Chen, H.G.; Zhang, Y.H.P. New biorefineries and sustainable agriculture: Increased food, biofuels, and ecosystem security. Renew. Sustain. Energy Rev. 2015, 47, 117–132. [Google Scholar] [CrossRef]
- Wu, L.; Elshorbagy, A.; Pande, S.; Zhuo, L. Trade-offs and synergies in the water-energy-food nexus: The case of Saskatchewan, Canada. Resour. Conserv. Recycl. 2021, 164, 105192. [Google Scholar] [CrossRef]
- Tabatabaie, S.M.H.; Murthy, G.S. Development of an input-output model for food-energy-water nexus in the pacific northwest, USA. Resour. Conserv. Recycl. 2021, 168, 105267. [Google Scholar] [CrossRef]
- Liu, Y.; Jiang, Y.; Xu, C.; Lyu, J.; Su, Z. A quantitative analysis framework for water-food-energy nexus in an agricultural watershed using WEAP-MODFLOW. Sustain. Prod. Consum. 2022, 31, 693–706. [Google Scholar] [CrossRef]
- Nair, S.; George, B.; Malano, H.M.; Arora, M.; Nawarathna, B. Water-energy-greenhouse gas nexus of urban water systems: Review of concepts, state-of-art and methods. Resour. Conserv. Recycl. 2014, 89, 1–10. [Google Scholar] [CrossRef]
- Heckbert, S.; Baynes, T.; Reeson, A. Agent-based modeling in ecological economics. Ann. N. Y. Acad. Sci. 2010, 1185, 39–53. [Google Scholar] [CrossRef]
- Yang, Y.-C.E.; Cai, X.; Stipanović, D.M. A decentralized optimization algorithm for multiagent system-based watershed management. Water Resour. Res. 2009, 45, W08430. [Google Scholar] [CrossRef]
- Magliocca, N.R. Agent-Based Modeling for Integrating Human Behavior into the Food–Energy–Water Nexus. Land 2020, 9, 519. [Google Scholar] [CrossRef]
- Pouladi, P.; Afshar, A.; Afshar, M.H.; Molajou, A.; Farahmand, H. Agent-based socio-hydrological modeling for restoration of Urmia Lake: Application of theory of planned behavior. J. Hydrol. 2019, 576, 736–748. [Google Scholar] [CrossRef]
- An, L. Modeling human decisions in coupled human and natural systems: Review of agent-based models. Ecol. Model. 2012, 229, 25–36. [Google Scholar] [CrossRef]
- Hering, J.G.; Waite, T.D.; Luthy, R.G.; Drewes, J.E.; Sedlak, D.L. A changing framework for urban water systems. Environ. Sci. Technol. 2013, 47, 10721–10726. [Google Scholar] [CrossRef] [PubMed]
- Bieber, N.; Ker, J.H.; Wang, X.; Triantafyllidis, C.; van Dam, K.H.; Koppelaar, R.H.; Shah, N. Sustainable planning of the energy-water-food nexus using decision making tools. Energy Policy 2018, 113, 584–607. [Google Scholar] [CrossRef]
- China Economic and Social Big Data Research Platform. Available online: https://data.cnki.net/ (accessed on 1 September 2021).
- Ningxia Water Resources Bulletin. Available online: http://slt.nx.gov.cn/slzt/ (accessed on 1 September 2021).
- China Energy Statistical Yearbook. Available online: http://www.stats.gov.cn/sj/ndsj/ (accessed on 1 September 2021).
- Daily Electricity Demand. Available online: https://wen.baidu.com/question/1712571590435501860.html (accessed on 1 September 2021).
- Food Consumption Per Person Per Day. Available online: https://edu.iask.sina.com.cn/jy/3lsc55PMcpr.html (accessed on 1 September 2021).
- Ningxia Industrial Water Quota. Available online: https://ishare.iask.sina.com.cn/f/cg6IbjtMRQ (accessed on 1 September 2021).
- Energy Consumption Per Mu of Crops. Available online: http://www.cqvip.com/qk/83634c/201035/36207197.html (accessed on 1 September 2021).
- Ningxia Agricultural Water Consumption Quota. Available online: https://doc.wendoc.com/b9290f5c570ed6133bbfb1183 (accessed on 1 September 2021).
- Water Quota for Greening Management. Available online: http://slt.nx.gov.cn/slzt/sdjsksxd/zlxz/202302/t20230214_3956457.html (accessed on 14 February 2023).
- Energy Consumption for Drinking Water Treatment. Available online: https://kns.cnki.net/kns8/Detail?sfield=fn&QueryID=7&CurRec=3&recid=&FileName=BJJN202303029&DbName=CJFDLAST2023&DbCode=CJFD&yx=&pr=&URLID= (accessed on 25 March 2023).
- Epstein, J.M.; Axtell, R. Artificial societies and generative social science. Artif. Life Robot. 1997, 1, 33–34. [Google Scholar] [CrossRef]
- Bonabeau, E. Agent-based modeling: Methods and techniques for simulating human systems. Proc. Natl. Acad. Sci. USA 2002, 99 (Suppl. 3), 7280–7287. [Google Scholar] [CrossRef] [PubMed]
- Rachid, B.; Mohamed, T.; Khouaja, M.A. An agent based modeling approach in the strategic human resource Management, including endogenous and exogenous factors. Simul. Model. Pract. Theory 2018, 88, 32–47. [Google Scholar] [CrossRef]
- Kaegi, M.; Mock, R.; Kröger, W. Analyzing maintenance strategies by agent-based simulations: A feasibility study. Reliab. Eng. Syst. Saf. 2009, 94, 1416–1421. [Google Scholar] [CrossRef]
- Xiao, Y.; Fang, L.; Hipel, K.W. Agent-Based Modeling Approach to Investigating the Impact of Water Demand Management. J. Water Resour. Plan. Manag. 2018, 144, 04018006. [Google Scholar] [CrossRef]
- Kazil, J.; Masad, D.; Crooks, A. Utilizing Python 3.9 for Agent-Based Modeling: The Mesa Framework. In Social, Cultural, and Behavioral Modeling, Proceedings of the 2020 International Conference on Social Computing, Behavioral-Cultural Modeling & Prediction and Behavior Representation in Modeling and Simulation, Washington, DC, USA, 18–21 October 2020; Springer International Publishing: Berlin/Heidelberg, Germany, 2020. [Google Scholar] [CrossRef]
- Masad, D.; Kazil, J. MESA: An agent-based modeling framework. In Proceedings of the 14th PYTHON 3.9 in Science Conference, Austin, TA, USA, 6–12 July 2015. [Google Scholar]
- Unit Energy Consumption. Available online: https://zhidao.baidu.com/question/493512363635761372.html (accessed on 1 September 2021).
- Unit Energy Consumption. Available online: https://ir.p5w.net/question/00018182AB60BDA34A0B92D1E0EDE4EAD6EC.shtml (accessed on 1 September 2021).
Disclaimer/Publisher’s Note: The statements, opinions and data contained in all publications are solely those of the individual author(s) and contributor(s) and not of MDPI and/or the editor(s). MDPI and/or the editor(s) disclaim responsibility for any injury to people or property resulting from any ideas, methods, instructions or products referred to in the content. |
© 2023 by the authors. Licensee MDPI, Basel, Switzerland. This article is an open access article distributed under the terms and conditions of the Creative Commons Attribution (CC BY) license (https://creativecommons.org/licenses/by/4.0/).