Article

Exploring Business Owners’ Engagement Behavior for Promoting Regional Brands in China: An Empirical Analysis Based on the TPB and ABC Theory

1
Institute of Quality Development Strategy, Wuhan University, Wuhan 430072, China
2
School of Electrical Engineering and Automation, Wuhan University, Wuhan 430072, China
3
School of Information Management, Wuhan University, Wuhan 430072, China
*
Author to whom correspondence should be addressed.
Sustainability 2023, 15(14), 11329; https://doi.org/10.3390/su151411329
Submission received: 9 June 2023 / Revised: 13 July 2023 / Accepted: 19 July 2023 / Published: 20 July 2023
(This article belongs to the Special Issue Sustainability in Regional Development and Tourism)

Abstract

:
To help promote existing regional brands and to gain more competitive advantages by encouraging behavior towards promoting regional brands (BPRB) from business owners, this article aims to examine the roles of resource advantage (RA), government policy (GP), consumer pressure (CP), and attitudes toward promoting regional brands (APRB) based on the theory of planned behavior (TPB) and the attitude–behavior–context (ABC) theory. Both the direct and indirect effects of RA, GP, CP, and APRB on BPRB are explored in the proposed conceptual model, where the field survey data are from business owners who participated in a regional branding process. A sample of 237 valid responses was used to perform partial least squares (PLS) regression. The results show that RA, CP, and GP significantly and positively impacted BPRB, where GP was the strongest influencing factor, followed by RA and CP. APRB was found to significantly and positively mediate the relationship between RA and BPRB, as well as between GP and BPRB. The findings of all the influencing factors and their rankings in motivating business owners’ behavior, as well as their revealed underlying mechanism, provide a useful theoretical and practical reference for promoting and advancing regional brands’ sustainability.

1. Introduction

Regional branding can promote the economic growth of regions, which can entail a brand’s development based on its geographic location (Eshuis et al. [1]), usually with the aim of triggering associations, adding value, and distinguishing a region from others (Kladou et al. [2]). A strong and attractive regional brand (RB) can create a value-added premium (Bo and Yang [3]), help regions acquire a competitive advantage over others (Soltani et al. [4]), and thus contribute to the sustainable development of a region. Very recently, it has been proposed that embedding culture as a kind of regional advantage into RB products can help improve the behavior loyalty of customers (Xu and Zhao, [5]). In addition, the RB agricultural product can also be taken as an important tool to promote the development of the regional economy into low-carbon agricultural production in China (Xu et al. [6]). Because of the above-mentioned benefits, there has been a rapid increase in RB being registered and formed in China to exploit the country’s abundant regional resources (Lu and Sun [7]).
Unfortunately, the quality of development of regional brands (RBs) in China is not as good as expected due to multiple factors. First, due to RB having the characteristics of public goods, it has an obvious free rider problem (Pasquinelli [8]), especially in the long development or promotion stage, which needs to continuously enrich the sustainability of the brands and quality of the products. Secondly, due to the short construction time and a lack of experience in China, the status quo results in “learning from each other” and tends to homogenize the constructed RB, where the misalignment between a regional branding mode and resource conditions not only wastes resources but also prevents competitiveness and the superior capacity of RB products (Zheng et al. [9]). Thirdly, some RBs in China still have problems such as uneven distribution, small scale, and low brand value (Wang [10]). As a result, how to help RBs’ sustainable development in China is an important issue.
This article attempts to offer potential solutions to solve this problem by promoting RBs based on psychological theories and from the perspective of stakeholders. Due to the characteristics of the public goods of RB (Pasquinelli [8]), it is thus of significant importance to take into account all the stakeholders involved in the branding and promotion process (Donner and Fort [11]). Of all the stakeholders (including public government managers of the RB, business owners of the RB, and consumers of the regional product based on Margarisová and Vokáčová [12]) involved in developing RBs, business owners are key in a diverse network of actors and so their roles must be fully identified and emphasized (Reynolds et al. [13]). Eshuis et al. [14] argued that the involvement of business owners who carry professional knowledge and corporate interests together with financial resources could positively increase the influence and effect of regional branding policies compared to residents and public managers. Thus, it is essential to involve them in the design and development of related policies and promote their active participation in regional branding (Zhou et al. [15]). Furthermore, it is also necessary to consider the interplay of different kinds of key stakeholders in promoting RBs, for example, by proposing a novel conceptual model and using quantitative analysis methods.
Based on the above discussion, it is now clear that the success of RBs depends on their active and effective participation, including their promotion by business owners, and thus there is an urgent need to analyze the factors influencing business owners’ engagement behavior. However, the literature on behavior associated with RBs has often focused on residents (Chen and Dwyer [16]; Eshuis et al. [14]), consumers (Cheung et al. [17]; Jiang et al. [18]; Xu and Zhao [5]), and the government (Sun et al. [19]); to the best of our knowledge, very little research has focused on the behavior of business owners in the promoting or developmental stages of RBs. Other gaps in the literature can be summarized as follows, (1) current research on companies’ behavior has centered on the initial creation stage of RBs, and there is a glaring paucity of research on the promotion stage of existing RBs; (2) Eshuis et al. [14], Reynolds et al. [13], and Binderkrantz et al. [20] underscored companies’ involvement in the place marketing process and used the qualitative analysis method, but were unable to provide quantifiable measures or to identify the rankings of influencing factors based on the degree of significance; (3) only a few studies have used “promoting regional brand behavior” as an outcome variable, and identifying and choosing this variable in the conceptual model to be proposed in this work offers a novel perspective to solve the problems encountered in the promotional stages of existing RBs.
From the stakeholders’ perspective and after synthesizing relevant theories, including TPB (theory of planned behavior; Ajzen [21]) and ABC (attitude–behavior–context theory; Guagnano et al. [22]), five latent variables were identified for use in constructing the conceptual model. In summary, these five variables included (1) behavior toward promoting regional brands (BPRB) from the firm or business owners, which is the outcome variable learned from the TPB; (2) attitude toward promoting regional brands (APRB) by the firm or business owners, which is a variable from the TPB; (3) consumer pressure (CP) perceived by business owners, which is from the subjective norm variable in the TPB; (4) government policy (GP), which is a variable introduced in our case based on the ABC theory; (5) resource advantage (RA), which is also a variable introduced in our case based on the ABC theory. This empirical study is the first to combine the TPB with the ABC theory and to consider BPRB as an outcome variable to adapt the context of driving business owners’ involvement behavior in promoting RBs. A novel integrated model will be presented in the next section consisting of these five constructs, where GP is further treated as a reflective-formative second-order construct (supply-side policy, demand-side policy, and regulatory policy), and the other variables of RA, CP, APRB, and BPRB are all first-order constructs.
Our research objectives were threefold using partial least squares–structural equation modeling (PLS-SEM): (1) to identify what the core influencing factors of BPRB are; (2) to explore to what extent RA, GP, and CP play a role in influencing BPRB; and (3) to investigate whether APRB plays a role as a mediating variable on the links from either RA or GP to BPRB and which indirect effect is stronger. This study contributed to the mechanism of business owners’ engagement behavior in promoting RBs and has implications for future research in that it extends the TPB by identifying its key antecedents of RA and GP, thus providing a reference for economic development in relation to the context of promoting RBs in China and worldwide.
For clarity and easy reading, Table 1 shows the abbreviations that we use in this paper. However, these abbreviations are also defined in the text.

2. Theoretical Background and Research Hypotheses

2.1. Related Theories for Determining the Variables of the Research Model

In this part, the rationale for introducing the above-mentioned variables is fully explained. It is well known that TPB is one of the most influential and fundamental psychological theories on predicting behavior, where it is stressed that individual behavior is affected by attitudes, the subjective norm (SN), and perceived behavioral control (PBC). Although the TPB model is insightful and provides a good reference for the study of business owners’ BPRB, further research rooted in this framework has exposed the model’s many limitations. The influencing factors of behavior in the TPB are primarily subjective factors of the individual; however, the willingness to transform behavior into real action is affected by other external factors as well. For example, addressing the problem of the three variables (attitudes, SN and PBC) in TPB is not always powerful and effective: the variables of brand love and behavior loyalty are proposed to explain and predict behaviors in the work of Hegner et al. [23] and Izquierdo-Yusta et al. [24], respectively.
Specific but not limited to the current circumstances regarding RBs in China, based on the TPB, the factors influencing the firm or business owners’ BPRB include their APRB and perceived CP. In our study, we further adopted the attitude–behavior–context (ABC) theory proposed by Guagnano et al. [22] and combined it with the TPB to predict BPRB. According to the ABC theory, BPRB results from the combined effect of business owners’ attitudes and contextual factors or environmental conditions; therefore, the firm owners exhibit behavior to gain certain expected benefits [25] by promoting place branding actively. As for the external conditions associated with the promotion of RBs, Li et al. [26] and Yu et al. [27] claimed that regional resources and government guidance, which were important stimuli for building RBs; Zhang et al. [28] found that government support indirectly promoted companies’ engagement behavior; and Zhou et al. [15] introduced three dimensions regarding the government’s policies about regional branding: (1) the demand side; (2) the supply side; and (3) environmental policies. However, as far as we know, no existing research has empirically examined the internal mechanism with respect to how external factors (i.e., resources, government policies)—which are also antecedent factors of the TPB—influence BPRB.
After explaining why we chose the five variables, the interplay between them or the cause–effect relationships (research hypotheses) are proposed and presented in the next section.

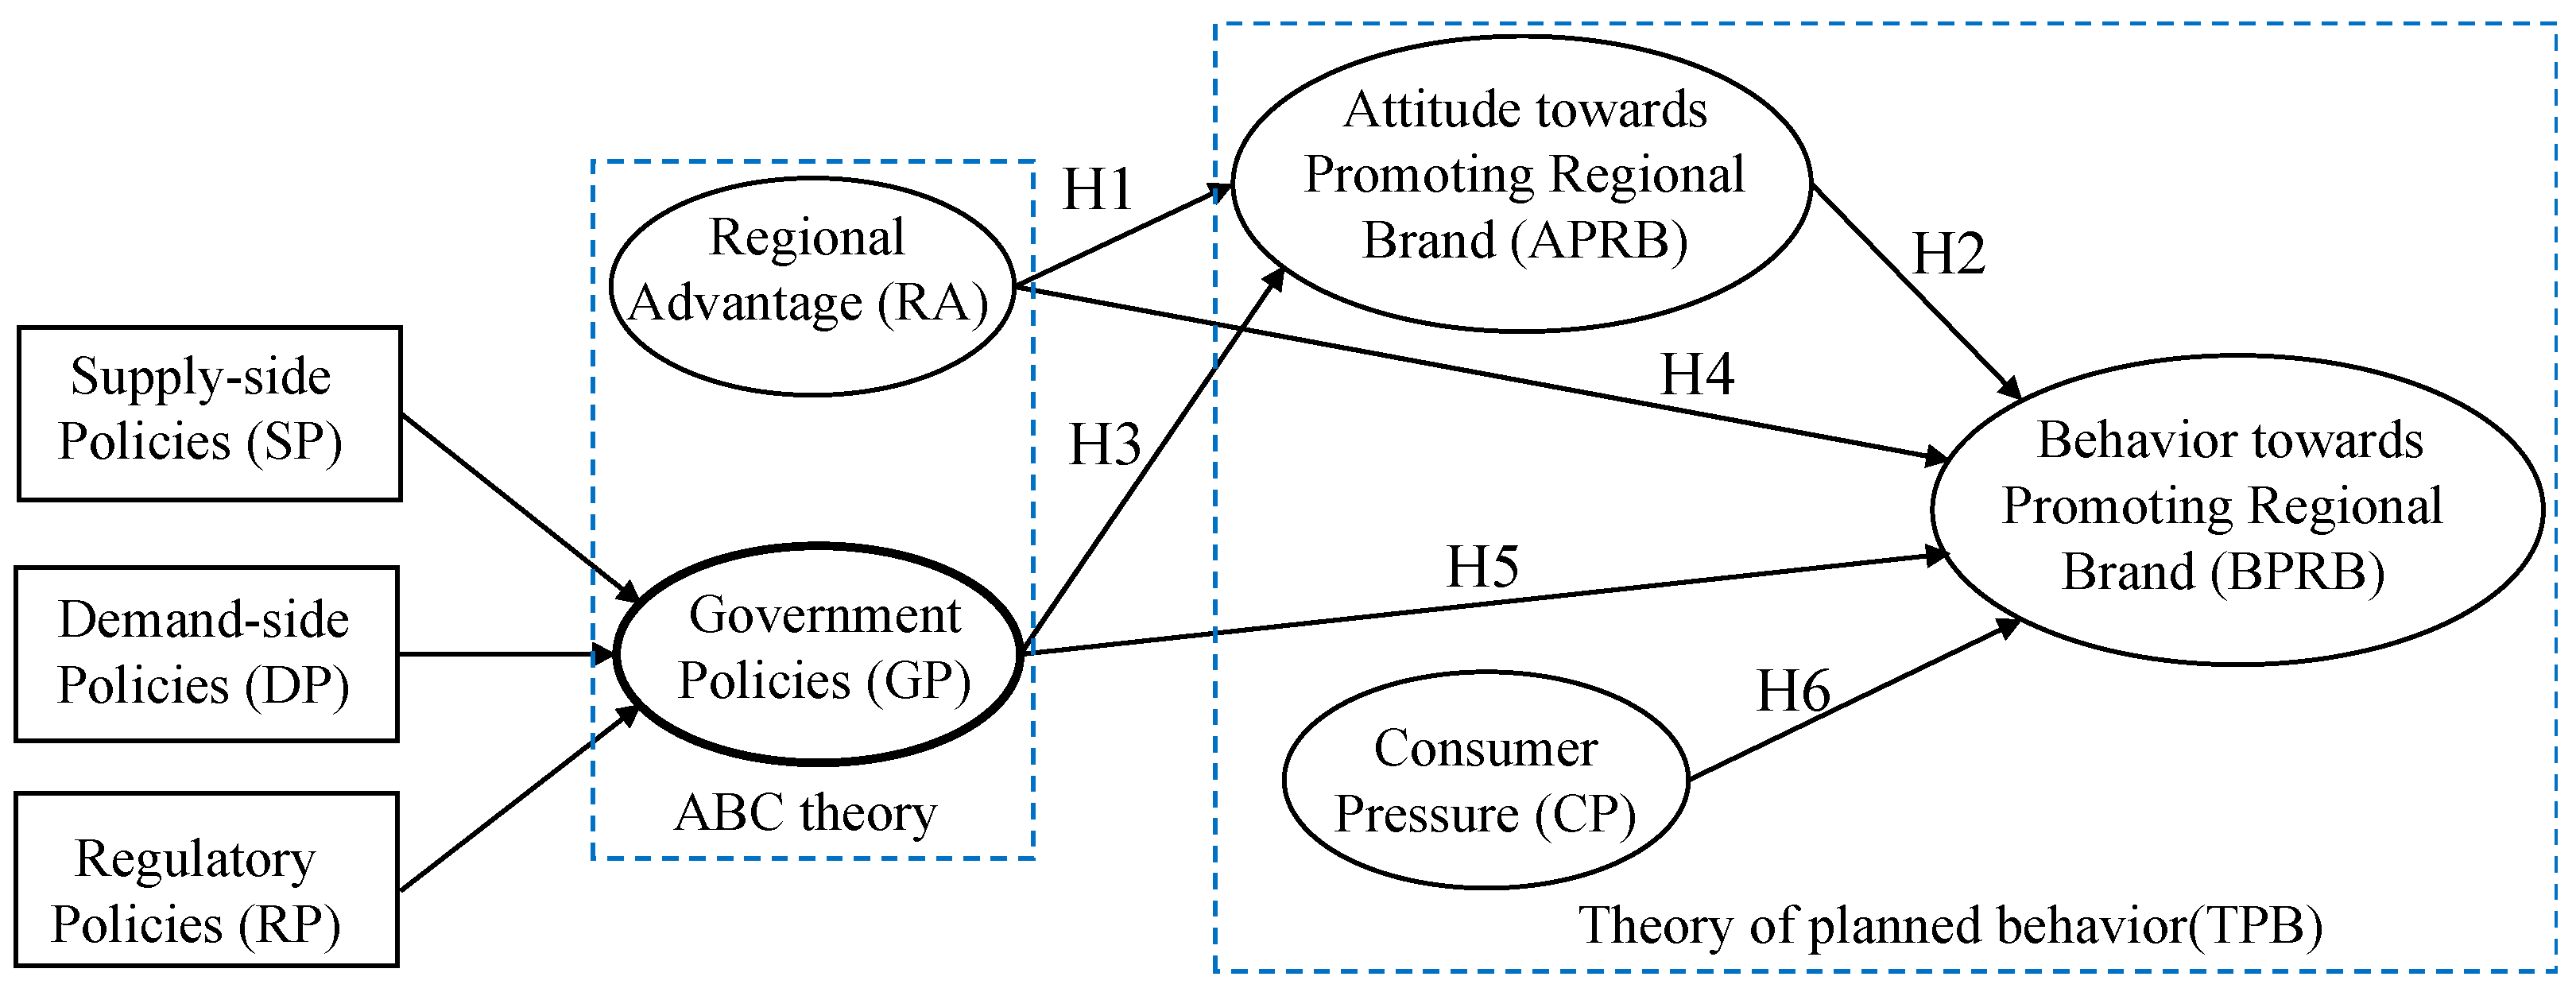
2.2. Research Hypotheses

2.2.1. APRB and Its Antecedents/Consequences

Attitude is an important psychological construct because it can dictate and predict many kinds of behaviors (Kraus [29]); they are relatively permanent and steady evaluative summaries regarding activities that promote place branding performance by firm owners in this work. The TPB defines its attitude toward behavior as “the degree to which a person has a favorable or unfavorable evaluation or appraisal of their behavior in question”: the more favorable the attitude of someone, the stronger an individual’s intention to perform the associated behavior according to Ajzen [21]. Although attitude obviously has an effect on behavior, it can also have its antecedent variable(s). For example, in the work of Paul et al. [30], the construct of “attitude towards green product purchase” originated from TPB and is supplemented with the antecedents of “environmental concern” when forming the conceptual model with “purchase intention for green products” as the dependent variable; in addition, this attitude also serves as a mediator. Further work by Maichum et al. [31] introduced “environmental knowledge” as the second antecedent of attitude.
In our work, RA is such an antecedent of APRB that it offers location endowments and historical and cultural resources (Li et al. [26]). For example, Wang [10] argued that consumers could identify the RBs of agricultural products by discerning the different geographic positions of agricultural products with regional elements. Chen et al. [32] found that the effect of the regional culture is increasingly prominent and that it can boost the development of unique industries of agricultural products. Further, based on the theory of social exchange, when firms perceive a premium associated with RA, they actively participate in optimizing the allocation of regional resources to the process of building RBs (Klijn et al. [33]) and display a positive attitude (Sirgy and Su [34]). Therefore, RA, which involves a business opportunity (Merrilees et al. [35]), affects firms’ APRB (Wang [10]) and facilitates good competitiveness (Li et al. [26]). Based on this discussion, we formulated the following hypothesis:
H1. 
RA has a positive influence on APRB.
On the other hand, the attitude toward building/promoting the brand can predict behavior (Charton-Vachet et al. [36]; Hegner et al. [23]) and is an important component of relational exchange, according to Keng et al. [37]. Merrilees et al. [35] portrayed brand attitudes as opportunities to perform business. All these viewpoints indicate that attitude is a critical stimulus in the brand-building/promoting process (Faircloth et al. [38]). Hence, favorable attitudes and positive emotions toward promoting RBs can also drive firms’ target behavior (Sirgy and Su [34]). At the same time, as mentioned above, since APRB has its antecedent variable, it is, in fact, a mediator, i.e., RA positively influences BPRB via APRB. Based on this review, we developed the following hypotheses:
H2. 
APRB positively influences BPRB.
H2a. 
APRB partially mediates RA’s effect on BPRB.
Finally, except for the antecedent of RA, GP also plays an antecedent variable role in APRB and is a more effective and desirable influencing factor affecting it (Zhang et al. [28]). Zhou et al. [15] and Rothwell [39] classified GP for RBs into three categories: (1) the supply-side policies; (2) the demand-side policies; and (3) the environmental policies. When local governments formulate policies regarding RBs, they engage in RB building, according to Doyle [40]. Taking the agricultural industry as an example, a local government could draw up corresponding policies and plans to improve RB’s development of agricultural products and then drive the popularity of RBs (Wang [10]). Furthermore, Zhao and Sun [41] corroborated that the government could apply different policies to guide and promote the place branding process. Thus, when firms realize the benefits and resources of GP, a positive attitude is induced (Zhao and Sun [41]; Zhao et al. [42]) to follow what the GP is intended for. Additionally, noticing that since GP is an antecedent of APRB, we formed the following hypotheses:
H3. 
GP has a positive effect on APRB.
H3a. 
APRB partially mediates GP’s effect on BPRB.

2.2.2. BPRB and Its Influencing Relationships

BPRB involves brand engagement, which has been conceptualized from both psychological and behavioral angles (So et al. [43]). In this work, BPRB contains the brand engagement behavior of (1) adopting art(s) and culture-based activities to promote a place-based brand (Scaramanga [44]); (2) striving to build brand identity where the product guarantees quality (Margarisová and Vokáčová [12]); (3) being involved in developing the content of a region’s marketing strategy (Eshuis et al. [14]); (4) and carrying out inter-firm collaboration/cooperation led by the government (Zhou et al. [15]) in relation to RBs, especially in promoting them. However, the current literature on brand engagement focuses on customers (Bose et al. [45]; Cheung et al. [17]; Jiang et al. [18]), residents (Zhao et al. [46]), and brands (Chen and Dwyer [16]). Therefore, there is very limited research on business owners’ engagement when promoting RBs. In addition, its promotion behavior also occurs among countries in order to maximize economic opportunities while safeguarding ecosystems. The Asian Development Bank [47] discussed the Central Asia Regional Economic Cooperation platform, which is composed of 11 countries, to promote the development of regional tourism through the identification of opportunities that can enhance and expand cooperation among member countries in the tourism sector.
RA is an essential element with respect to business owners’ BPRB; however, only a few studies have investigated the relationship between RA and BPRB. Similar studies indicate that the development of RBs must rely on local resources and that local characteristics should be embedded into relevant brands, according to Luo [48]. Moreover, Gómez and Molina [49] stated that the RB of the wine industry in four Spanish regions, based on their origin resources, could increase brand equity, thereby driving firms’ engagement behavior (Donner and Fort [11]). As such, we proposed the following hypothesis:
H4. 
RA has a direct and positive effect on BPRB.
As contextual factors supplement TPB, GP determines the external environment for promoting RB and hence plays an important role in influencing BPRB. In fact, RB policies can strengthen regional identity and differentiation from other regions by selecting a consistent local element mix (Zhao et al. [46]). Yu et al. [27], Doyle [40], and Eshuis et al. [14] noted that GP resulted in regional development and brand performance. Merrilees et al. [35] analyzed the motivation of firms’ engagement with RBs based on the stakeholder theory in an environment that enjoys GP. In addition, GP facilitates participation in the engagement behavior of RB building (Donner and Fort [11]; Zhang et al. [28]. At the promotion stage of improving RBs’ growth, the importance of GP requires an in-depth investigation. Given the above analyses, we posited the following hypothesis:
H5. 
GP has a direct and positive effect on BPRB.
The subjective norms of the TPB refer to the desire to act how others think one should act and are, therefore, internally controlled (Ajzen [21]). Lee et al. [50] stressed that subjective norms have two components that function in concert: (1) one’s beliefs about how other people would like one to behave; and (2) positive or negative judgments about every belief. When it comes to this study, companies’ subjective norms originate from their perceived CP (Zameer et al. [51]), and firms are encouraged by the consumer’s circle of influence. Consumers’ responses and appeals can create coercive pressure on firms (Staw and Epstein [52]). Hegner et al. [23] examined consumer perceptions on whether the emotion of love, reviews, and recommendations for a brand affect companies’ behavior. Zhao et al. [42] asserted that consumer resources have a favorable impact on companies’ engagement behavior. If firms violate the coercive pressure exerted by consumers, they lose important consumer resources (Zhao and Sun [41]). Accordingly, as Shamim and Butt [53] revealed, firms should try to offer brand-related marketing information (e.g., events, ads, social media brand communication) so that consumers’ subjective and behavioral responses can be evoked. Based on the above research, we formed the hypothesis below:
H6. 
CP positively influences BPRB.
Based on the preceding discussion, all the hypotheses from the literature review are summarized and listed as H1–H6. We also depict the proposed conceptual model in Figure 1. It is emphasized here that GP can be treated as a reflective-formative second-order construct formed by three first-order reflective constructs of SP, DP, and RP in order to fully measure the GP in detail. In addition, all the variables associated with the TPB and the contextual variable of the ABC theory are also indicated in Figure 1.

3. Research Methodology

3.1. Measurement of the Constructs/Variables

We measured all constructs based on a previous study and modified them to fit the present context and collect respondents’ answers. Since past studies have verified that a 7-point Likert scale is well suited for surveys (Chaulagain et al. [54]), we assessed all constructs using a 7-point Likert scale ranging from 1 (strongly disagree) to 7 (strongly agree). This survey included the measures of RA, APRB, GP, CP, and BPRB, as well as five demographic variables, as shown in Table 2 below. We measured RA using the four items from Li et al. [26]. We adapted APRB’s items from diverse sources (Charton-Vachet et al. [36]; Lee et al. [50]; Maichum et al. [31]; Paul et al. [30]; Wang et al. [55]). The BPRB has four items drawn from multiple studies (Bose et al. [45]; Chen et al. [56]; Eshuis et al. [14]). We adapted the three items of CP from Picazo-Vela et al. [57] and Osei-Frimpong et al. [58]. In contrast to the first-order constructs, and according to the second-order constructs discussed in Zhou et al. [15], GP is proposed as a reflective-formative second-order construct; its three first-order constructs/factors are reflective, and the second-order construct of GP is formative.

3.2. Questionnaire Survey and Data Collection

3.2.1. Design of Questionnaire

Before administering the formal survey, we conducted both the pre-test and the pilot test to confirm the designed questionnaire. Both procedures have also been widely adopted by the relevant research community, such as by Liu et al. [59]. (1) For the pre-test, in-depth interviews of the survey questionnaire were formed based on the hypotheses stated above, and we invited 10 owners with regional branding experience to participate. Next, we modified and reworded the survey items to appear ambiguous or easily misunderstood. We tried our best to ensure that the respondents could fully understand the content and to align the survey as much as possible with the Chinese context to improve testing quality. (2) For the pilot test (also known as the feasibility study), we collected 42 valid responses from business owners in the Wudang Mountains. The internal consistency reliability (which is important for ensuring the quality of the subsequent PLS-SEM) among the individual items of latent variables or constructs was measured using Cronbach’s α. The reason for conducting this pilot test was that although we adopted a mature scale (composed of items measuring the latent variables/constructs, as can be seen in Table 1) from the published literature, the context may have a subtle difference. Thus, we ran this pilot test to check whether all the items could satisfy the context and ensure the analysis results when using the PLS; whether all the items in the questionnaire were good could be determined by Cronbach’s α value. As for the reliability coefficient criteria suggested by Nunnally and Bernstein [60], Cronbach’s α during the pilot test was over 0.7, indicating that the survey’s internal consistency and stability were favorable.

3.2.2. Data Collection and Sample Characteristics

After the designed questionnaire based on the prior literature was finalized, the survey was carried out in the Wudang Mountains and Wuyi Mountains, where abundant RBs represent the country’s eastern and central regions, respectively. However, both regional brands are in their own developing stages. We administered a formal survey with convenient random sampling in different regional parts of the Wuyi and Wudang Mountains in May and June of 2021, as well as in July and August of 2022, respectively. The Wudang Mountains, located in Hubei Province, are a national AAAAA (5A) tourist attraction on the World Heritage List. They are famous for their Taoist culture, which respects nature and pursues harmony between people and nature. In the Wudang Mountains, tourists can experience Taijiquan (a physical practice based on circular movements and breathing), traditional clothing, the Wudang sword, Wudang vegetarian food, and cultural homestays. The Wuyi Mountains are located in the Fujian Province and have been labeled a World Heritage Site by the United Nations Educational, Scientific, and Cultural Organization, with a major RB being Dahongpao Tea. Thus, we chose a series of tea plantations as survey objects. The corresponding survey data were conducted in a face-to-face field survey manner, although the business or firm owners were difficult to make appointments with and meet to collect their answers. The gathered survey data were then used to analyze the proposed model.
Because decision-making and other behaviors play a critical role in business owners’ involvement in place-based branding, 130 owners of related industries in the Wudang Mountains and 120 owners of tea plantations in the Wuyi Mountains answered the survey. During this process, to obtain a high-quality dataset, scientifically trained investigators who explained the survey’s content and purpose approached the participants personally. To prevent insincere answers from bosses/owners/managers, we checked the content by asking others who were familiar with the bosses/owners/managers about it. Consequently, 250 questionnaires were returned. After evaluating data with missing values or unengaged responses, we removed some of the surveys; 237 were valid for analysis (for a valid rate of 94.80%).
Table 3 outlines the demographic characteristics; there were more male (77.22%) than female (22.78%) owners. Most respondents were aged between 30 and 39 (44.94%) or between 40 and 49 (31.01%). Their level of education was concentrated around university graduates (24.89%), junior schools and below (24.47%), and college graduates (23.21%). In addition, 53.16% of the respondents came from the Wudang Mountains, while 46.84% were from the Wuyi Mountains. Most owners (64.56%) worked in the service industry due to Wudang and Wuyi Mountains being tourist attractions.

3.3. Data Analysis Method

SEMs are one of the most powerful methods for the study of causal relationships in survey data. They are a combination of factor analysis and multiple regressions. There are two components in the SEM, including the outer measurement model and the inner structural model. This measurement model describes the relationship between the latent variables/unobservable variables/constructs by a series of observable variables/measurable variables/items/indicators/factors; in the structural model, the relationships between latent variables/constructs are hypothesized. For instance, the relationships between latent variables are described with the use of arrows (as can be seen in Figure 1). Based on different statistical algorithms to obtain the path coefficients associated with the arrows, there are PLS-SEM and covariance-based SEM (CB-SEM), which can be used based on different studies (Hair et al. [61]). CB-SEM is a confirmatory approach to theory testing or comparisons, while PLS-SEM is especially useful for developing models including high-order factors, which is the case of our work since GP is a second-order variable.
We applied PLS-SEM to test the conceptual model and hypotheses in this work due to its ability to deal with structural relationships of complex latent variables (Chen et al. [56]). One feature of PLS-SEM is that it does not require variables to follow a multivariate normal distribution (Hair et al. [62]) and, thus, have has widely adopted in research (Izquierdo-Yusta et al. [24]; Xu and Zhao [5]; Zhao et al. [46]; Zhou et al. [15]). Another advantage of using PLS-SEM is that it can also perform well with a small sample size (Hair et al. [62]; Kock and Hadaya [63]) even for complex models comprising second-order constructs (Choi et al. [64]), reflective and formative second-order constructs (Urbach and Ahlemann [65]), and for mediation analysis (Hair et al. [66]; Wong [67]). Thus, PLS-SEM is indeed an appropriate method for the data analysis of this study thanks to its state-of-the-art built-in statistical algorithms. To ensure the accuracy of the analysis results, we used the software package SmartPLS 3 to perform the analysis to assess the significance level of the estimates based on 5000 bootstraps. Furthermore, we used a two-stage approach which was built into the SmartPLS software package to assess the higher-order constructs of GP (Wilson [68]; Sarstedt et al. [69]).

4. Results

4.1. Common Method Bias/Variance Test

Common method bias (CMB) can occur when both the independent and dependent variables are measured within one survey (Kock et al. [70]). To investigate the potential severity of CMB, two statistical analyses were performed. We initially used Harman’s single factor test (Podsakoff et al. [71]), which allowed us to load all items into an exploratory factor analysis (EFA), examine the results of the unrotated factor analysis, and determine the minimum necessary factors for explaining the variance of the variable. If only one factor was extracted or if a factor had a very large explanatory power, then there was serious CMB. In our study, the first factor accounted for 36.88%, which is below the 50% benchmark set by Podsakoff et al. [72], confirming that there was no obvious CMB. In addition, we employed the process of Liang et al. [73] to test for CMB. We developed a new measurement model with all indicators loaded on a common method factor and calculated and compared the variances of each indicator with the original measurement. As illustrated in Table 4, these findings suggest that the ratio of substantive variance to method variance was approximately 55:1, which implies that there was no substantial CMB. Thus, CMB was not a major concern in our research.

4.2. The Measurement/Outer Model and Scale Validation

Before going to evaluate the structure/inner model, the validity of the outer model of the measuring instrument/scale, as presented in Table 1, was evaluated based on PLS regression. For first-order reflective constructs (RA, APRB, CP, and BPRB), we calculated the factor loading, Cronbach’s α, the composite reliability (CR), and the average variance extracted (AVE) to assess whether the measurement/scale could reliably reflect the model’s convergent validity. However, for the formative construct (the second-order construct GP is formed by DP, RP, and SP), traditional indicators such as Cronbach’s α, CR and AVE are not applicable, and the determination of the existence of a collinearity problem was checked through calculating the variance inflation factor (VIF) (Henseler et al. [74]).

4.2.1. Test for Second-Order Construct of GP in the First Stage

As previously described, GP is a reflective-formative second-order construct, which is not commonly seen in the field of regional branding research, and a two-stage approach (Sarstedt et al. [69]; Wilson [68]) should be employed to analyze it. According to the two-stage approach, we first assessed the reliability and validity of the first-order measurement model regarding GP, where, in this model, only GP and its factors of DP, EP, and SP were considered. We tested the reliability of the items by factor loading, Cronbach’s α, CR, and AVE. Table 5 presents the results, which show that all the remaining factors were over the threshold level of 0.7 (Chin [75]) and were statistically significant. Similarly, all Cronbach’s α values exceeded the recommended threshold level of 0.6 (Hair et al. [76]). We measured internal consistency reliability using CR. The value of CR for all the first-order measures was greater than the minimum acceptable level of 0.7 (Fornell and Larcker [77]), which indicates that we attained internal consistency of the constructs. Fornell and Larcker [77] argued that the AVE should be higher than 0.5 since the AVE values ranged between 0.590 and 0.633, and high levels of convergent validity were implied. In light of the above, our results suggest that the first-order indicators obtained good reliability and validity.
Secondly, we gauged the discriminant validity of the first-order measurement model using the criterion proposed by Fornell and Larcher [77], which has also been widely used by the research society (Choi et al. [64], Izquierdo-Yusta et al. [24]). Table 6 displays the detailed values regarding the discriminant validity. Because the square root values of the AVE for each construct were greater than the correlation coefficients between each construct and other constructs, discriminant validity was considered favorable for the measurement model regarding GP. During this phase, the second-order GP was measured using the repeated indicator approach (Lohmöller [78]); namely, the indicators of the first-order constructs (3 items for each one of DP, RP, and SP) were used as indicators for the second-order construct (GP has 9 items). The evaluated scores of DP, RP, and SP were stored for further use.

4.2.2. Test for the Measurement in the Second Stage

In the second stage of the two-stage approach, we used the former scores of DP, SP, and RP evaluated from the above first stage to construct the manifest variables for the second-order construct of GP, where GP became a first-order construct. Hence, in the second stage, all the variables were first order, and we needed to assess the formative construct of GP and the reflective constructs of RA, APRB, CP, and BPRB in the measurement model. The criteria for the reflective constructs were in line with the above section when testing the first-order construct of DP, SP, and RP.
All the indicator loadings were over the threshold level of 0.7 (Chin [75]) except for APRB4. However, Bagozzi and Yi [79] recommended a lower threshold of 0.5. Therefore, we retained APRB4 (above 0.6). All factor loadings were highly significant. Moreover, Cronbach’s α, CR, and AVE of the four constructs were above the minimum level of 0.6 (Hair et al. [76]), 0.7 (Fornell and Larcker [77]), and 0.5 (Fornell and Larcker [77]), respectively. However, for the formative construct of GP, the weights suggested the relative importance of each indicator; however, traditional reliability and validity assessments were not applicable (Bollen [80]). As shown in Table 7, the indicator weights of GP, which were highly significant, exceeded the threshold level of 0.2 (Chin [75]; Lohmöller [78]), suggesting the relative importance of each indicator in GP’s formation. In addition, formative indicators should be tested for collinearity through the VIF (Henseler et al. [74]), with values of the outer model inferior to 3.3 (Petter et al. [81]). Consequently, the results implied no multi-collinearity in the GP indicators.
In the final step, we also analyzed the discriminant validity of the second stage (Table 8). From the analysis results, we confirmed that the correlation among the constructs was no higher than the square root of the constructs’ AVE. Hence, discriminant validity was favorable (Fornell and Larcker [77]), i.e., there were differences between the latent variables.

4.3. Structural/Inner Model and Hypotheses Testing

4.3.1. Model Fit

Prior to presenting the results for hypothesis testing, it was also mandatory to use VIF values to check if there was any collinearity with the proposed structural model. To this end and after the calculation, the VIF of the inner model test produced result values ranging from 1.262 to 1.958, with values less than the recommended value of 3.3 (Petter et al. [81]). Hence, there was no collinearity in this study.
Chin [75] recommended an evaluation of the structural model in PLS based on the determination coefficients R2, the effect size f2 (Hair et al. [62]; Henseler et al. [74]), and the Stone-Geisser test Q2 (Geisser [82]; Stone [83]), which are suitable for endogenous constructs (including APRB and BPRB in this work). After the evaluation, the R2 values of APRB and BPRB were 0.348 and 0.507, respectively, exceeding the minimum level of 10% (Falk and Miller [84]). Consequently, the analysis results indicated that the explanatory power of this model was high. Furthermore, the f2 values of APRB and BPRB were 0.318 and 0.260, respectively, which reflected the changes in R2 in relation to the unexplained variance of the endogenous variable and signaled a medium effect size (Cohen [85]). The Q2 obtained by blindfolding measured the predictive relevance of the latent variable for the structural model (Matzler et al. [86]). In addition, the Q2 values of APRB and BPRB were 0.168 and 0.315, and were both greater than 0, thus guaranteeing the model’s predictive relevance (Chin [75]; Fornell and Cha [87]). Furthermore, we also calculated the effect size (Cohen [85]) q2, which showed the predictive power of the exogenous constructs (including RA, GP, and CP) on the endogenous constructs, where the values for APRB and BPRB were 0.130 and 0.152, respectively.

4.3.2. Path Analysis of the Proposed Hypotheses

Once we evaluated all psychometric properties of the measurement instruments, the next step was to employ a structural model to estimate the proposed hypotheses in Figure 1, where the path coefficients represented the intensity and direction of the causal relationship between the variables. Moreover, we performed the estimation by resampling the data, and the estimated values were more precise than the commonly used approximate limit values (Purvis et al. [88]). Hence, we utilized this technique to test the significance of the relationship between the variables.
Table 9 summarizes the hypotheses tested in the study and showed that RA positively and significantly affected APRB and BPRB, thus supporting H1 and H4 (RA→APRB: β = 0.143, t-value = 2.181; RA→BPRB: β = 0.148, t-value = 2.202). Similarly, GP had a significant effect on APRB and BPRB, thereby supporting H3 and H5 (GP→APRB: β = 0.511, t-value = 8.298; GP→BPRB: β = 0.159, t-value = 2.328). Moreover, APRB significantly influenced BPRB (APRB→BPRB: β = 0.452, t-value = 6.803). Hence, H2 was also supported. Lastly, CP had significant and direct effects on BPRB, thereby supporting H6 (CP→BPRB: β = 0.124, t-value = 1.981). In summary, H1–H6 were all supported.

4.3.3. Testing the Mediation Effects

To verify whether the mediation effect was statistically meaningful, we used bootstrapping (5000 resamples) to obtain the path coefficients and t-values of the indirect effects (Preacher and Hayes [89]). As shown in Table 10, because the indirect effects of APRB on the relationships between RA and BPRB (t = 2.317), as well as between GP and BPRB (t = 4.551), were significant, the indirect effects were all supported. Furthermore, recent research (Matzler et al. [86]; Zhao et al. [90]) has suggested the use of confidence intervals (CIs) to investigate the mediating effects. Therefore, we adopted 95% CI for the specific mediating effects obtained with 5000 bootstrapping resamples. As seen in Table 10, the value of zero was not contained within the 95% CI; therefore, the mediation effects were once again confirmed.
As the direct effects of RA and GP on BPRB (H2 and H5) were supported, APRB played a partially intermediary role. Additionally, following the approach of Hair et al. [76], we obtained the VAF ranging from 20% to 80% (Table 10), which signaled that firms more impacted by RA and GP felt a more positive APRB (i.e., RA and GP greater APRB), thereby exhibiting greater BPRB.

5. Discussion of Findings

Based on the survey data from two Chinese tourism regions under developing stages of RBs, including the Wudang Mountains in Hubei Province and Wuyi Mountains in Fujian Province, the business owners’ engagement behavior for promoting RBs was investigated, and the interplay among RA, GP, CP, APRB, and BPRB explored by performing PLS-SEM empirically. The results verified and supported all the proposed research hypotheses in the proposed conceptual model. The discussion regarding the empirical analysis results was made as follows.
(1) The influence of RA on APRB/BPRB, and the causal relationship of RA and BPRB through the mediator of APRB, were verified. It is intuitively reasonable that firms are more willing to participate in promoting RBs by exploiting regional resources, especially those with unique regional advantages. This finding complemented what was found by Li et al. [26] when investigating RBs of agricultural industries, where it was mentioned that “the existence of resource endowment promotes not only the government’s guidance and support for the development of characteristic agricultural industries but also the industry association’s supervision of regional brands of characteristic agricultural products, thus playing a strong role of promotion”. According to our analysis results, RA can also positively affect the attitude and further induce the behavior of business owners, in addition to its promotion from the government and industry association sides, for promoting RBs. Very recently, Xu and Zhao [5] found that cultural RA could also help build the consumers’ loyalty and hence promote RB’s development by embedding culture (a kind of RA) into RB products. As a result, from extant research findings, protecting the RA is of paramount importance for the sustainable development of RBs, which was also discussed by Wang [10].
(2) In addition to the importance of RA, the influences of GP on APRB/BPRB, and the causal relationship of GP and BPRB through APRB, were verified. This study recognized that GP is one of the greatest influence factors on BPRB based on the analysis result with PLS regression, which is in line with Zhang et al. [28]. However, a slight difference here is that the dependent variable in our study was BPRB, while the dependent variable was decision-making engagement behavior. Furthermore, the RBs of the manufacturing industry were mainly discussed (Zhang et al. [28]), while in our work, different industries, including agriculture, processing, and service industries, were all taken into account when evaluating the influence of GP more comprehensively. Contrary to our conclusion, Zhao and Sun [41] found that CP (path coefficient 0.34) played a greater role than GP (path coefficient 0.27) in predicting behavior in relation to its participation in RBs. The reason for this discrepancy might be caused by the different development stages of RBs, which is emphasized here in that our study investigates the effect of GP on RB’s promotion behavior.
(3) As for how CP is concerned, it plays a positive influence on BPRB, which reflects how CP is also a key driver of BPRB and needs to be paid attention to. Unlike GP and RA, CP ranked third place in affecting BPRB based on our empirical analysis. Margarisová et al. [91] found that for the efficient use of regional products and demand support, it is necessary to define a regional product from a customer perspective. As Xu and Zhao [5] also revealed that the embeddedness of cultural elements within RB products has a positive effect on the consumers’ loyalty, which can accordingly promote the performance of RBs. Only by those business owners who can engage in BPRB, including perceiving pressure from constantly satisfying fast-changing consumer needs and cultivating their behavior loyalty, can RBs and their associated products become more successful and promoted. Due to an increasingly competitive market, it is always important to meet consumers’ needs by providing products with good quality and improving their level of service by business owners to promote RBs. This is true for other related fields, such as Kim et al. [92], who emphasized that fashion brands are struggling to distinguish themselves from increasingly apathetic consumers. However, the case for business owners managing RBs is more complicated since GP and RA are more influential; they should be simultaneously in consideration with CP when making decisions or strategies that promote the performance of RBs.
(4) This finding verifies the underlying impact mechanism of GP and RA on BPRB through the mediator of APRB. The mediating effect of attitude can also be identified in other fields, such as green product purchase, where attitudes can mediate the relationship between either “environmental concern” (Maichum et al. [31]; Paul et al. [30]) or “environmental knowledge” (Maichum et al. [31]) and “purchase intention”. Other past studies have corroborated that both GP and RA are primary predictors of behavior; however, this was unable to identify the effect of APRB and neglected its mediating role. This study has clearly revealed the internal mechanism of the nexus between RA/GP and BRPB. Furthermore, the mediation effects differed in magnitude, and few studies have recognized this difference between RA/GP and BRPB. In fact, it was found that the indirect effect of APRB (VAF = 59.23%) on the relationship between GP and BPRB was stronger than that (VAF = 30.52%) on the relationship between RA and BPRB. As such, this study validates the importance of APRB and opens the black box by revealing the mediating effect of APRB on the link between GP and BPRB, as well as between RA and BPRB, providing a pioneering reference for future research.

6. Research Implications to Theory and Practice

6.1. Theoretical Contributions

First, the study extends the TPB, which has been widely employed in the literature, and compensates for its shortcomings through its combination with the ABC theory in the field of promoting regional branding. This study was the first to integrate the TPB and ABC theory and to investigate the underlying mechanism of how to promote the development of existing RBs from business owners’ engagement in BPRB. Specifically speaking, this research enriched the necessary antecedent factors for TPB, and an integrated TPB-ABC conceptual model consisting of APRB, RA, GP, CP, and BPRB was formed in the context of promoting RBs.
Second, this study enriched the influencing factors on behavior in the field of promoting RBs and also their impact mechanism. This study recognized GP to be the greatest influencing factor on BPRB based on data analysis results with PLS regression. Furthermore, we simultaneously integrated RA, GP, and CP into the proposed model to investigate their interplay on BPRB. In addition, the underlying impact mechanism of GP and RA on BPRB through the mediator of APRB was also found. Hence, this study provided a new theoretical explanation for influencing factors and their mechanism of action on BPRB, contributing to the theory of RB.

6.2. Practical Implications

Based on the above conclusions, this study put forward the following policies and strategies for promoting RBs, which are of reference value, especially for developing and undeveloped countries to expand their regional economies.
First, due to GP having the greatest influence on BPRB, the government should offer better business environments and design suitable policy resources to meet the needs of owners running businesses in case of their leaving and moving to other regions. For example, provincial governments should incorporate policies into local laws and increase the total years of execution to render a stable environment and guarantee the sustainability and promotion of RBs. In addition, political elites, who play a central role in building RBs and have the power to shape the regional image and provide marketing activities (Naef [93]), can facilitate business owners’ BPRB. Furthermore, the business owners’ participation in establishing relevant RB product standards and policies should be strengthened in order to increase their engagement in constructing RBs (Zhang et al. [28]).
Second, due to RA and CP also being crucial drivers of BPRB, governments, and firms should further explore and improve geographic resource endowments to drive firms’ engagement in promoting RBs. On the other hand, Zhao and Sun [41] claimed that given the market influence of consumer groups, consumer demand could force business owners to participate in promoting RBs. Therefore, firms must design and produce high-quality RB products for consumers in order to enhance their satisfaction. On the other hand, since RA is the fundamental basis for supporting RB’s development, the RA should be exploited in a sustainable way, such as the embedding of RA into the RB product in order to enhance consumers’ behavior loyalty (Xu and Zhao [5]).
Third, due to the important role of the mediating effects of APRB, governments should pay attention to the attitude of business owners. From these empirical results, the more positive the attitude that owners have towards RA or GP, the more likely they are to participate in promoting RBs. Therefore, governments need to strive to build owners’ positive attitudes. For example, governments could show and promote RA and favorable financial policies through short videos, graphics, and live broadcasts. In addition, the continuity of policies fulfilling the promises of governments (Doyle [40]) should enhance the positive attitude of firm owners in ensuring their enthusiasm and engagement. Thus, local governments can support specific and sustainable pilot projects to improve the positive attitude of business owners toward the credibility of policies. Therefore, considering the above countermeasures, business owners can have a positive attitude and are more likely to participate in the promotion of RBs.

7. Research Conclusions

Regional branding is important in promoting rural regions with their unique natural and cultural heritage. However, the success of RBs highly depends on regional resources, government managers, business owners, and consumers. The present study is among one of the first attempts to examine the roles of RA, GP, CP, and APRB when influencing the novel outcome variable of BPRB, which directly determines the performance of RBs during their promotion and development stages. The proposed research model was empirically tested through survey data taken from business owners in the Wudang Mountains and Wuyi Mountains of China. Our results verify that GP, taking the forms of SP, DP, or RP, has a positive influence on BPRB and is the most important factor affecting BPRB. It reflects the significance of strengthening GP in practice for promoting RBs. In addition, RA has a positive influence on BPRB and ranks in second place, indicating the importance of exploiting RA for driving BPRB. As for CP, it plays a positive influence on BPRB and ranks in third place. It reflects that CP is also a key driver for BPRB, which needs to be paid attention to. Finally, APRB plays a partially mediating role between RA and BPRB, as well as between GP and BPRB, where the indirect effect through the path (GP→APRB→BPRB) is stronger. The study offers important theoretical and practical implications for promoting RBs.

8. Limitations and Avenues for Future Research

Although our findings can help to promote the development of RBs, the study has some limitations that should be noted. First, we designed our theoretical model for the unique context of China. We have not yet analyzed its applicability and effectiveness in other countries or regions. In the future, we aim to examine its applicability and improve it by further considering the engagement behavior of promoting RBs in other countries or regions to improve the model’s universality, especially in developing or underdeveloped nations. Second, we explored the mediating role of APRB in the relationships between RA and BPRB, as well as between GP and BPRB. However, to simplify the model, there may be other influential mediating or moderating variables, such as mediation on trust or the moderation of authenticity. Future research should verify whether these constructs are mediators or moderators. Third, the different personality traits of owners can have different influences on individual attitudes and choice behaviors (Lynn [94]), which we did not consider when simplifying the current model. In future studies, the Big Five personality traits of owners should be introduced into the model to understand how they stimulate or influence business owners’ behavior. Forth, inspired by Akbari and Moradipour [95] and Fikouie et al. [96], a series of between-group studies could be conducted by choosing different region groups with different characteristics regarding business owners, including RA or GP, to further improve the current research.

Author Contributions

N.X.: Corresponding author, Conceptualization, Investigation, Writing, Literature review, Methodology, Software, Data analysis. Y.Z.: Conceptualization, Supervision, Validation. S.Q.: Literature search, Gathering questionnaire. All authors have read and agreed to the published version of the manuscript.

Funding

This research received no external funding.

Institutional Review Board Statement

Not applicable.

Informed Consent Statement

Not applicable.

Data Availability Statement

The data that support the findings of this study are available from the corresponding author upon reasonable request.

Conflicts of Interest

The authors declare no conflict of interest.

References

  1. Eshuis, J.; Braun, E.; Klijn, E.H. Place Marketing as Governance Strategy: An Assessment of Obstacles in Place Marketing and Their Effects on Attracting Target Groups. Public Adm. Rev. 2013, 73, 507–516. [Google Scholar] [CrossRef]
  2. Kladou, S.; Kavaratzis, M.; Rigopoulou, I.; Salonika, E. The Role of Brand Elements in Destination Branding. J. Destin. Mark. Manag. 2017, 6, 426–435. [Google Scholar] [CrossRef]
  3. Bo, L.; Yang, X.L. Is Consumers’ Willingness to Pay Premium for Agricultural Brand Labels Sustainable? Evidence from Chinese Consumers’ Random n-price Auction Experiment. Br. Food. J. 2022, 124, 359–374. [Google Scholar] [CrossRef]
  4. Soltani, A.; Pieters, J.; Young, J.; Sun, Z. Exploring City Branding Strategies and Their Impacts on Local Tourism Success, The Case Study of Kumamoto Prefecture, Japan. Asia Pac. J. Tour. Res. 2018, 23, 158–169. [Google Scholar] [CrossRef]
  5. Xu, N.; Zhao, Y. A Moderated Mediation Analysis of the Relationship between Cultural Embeddedness of Regional Brand Products and Behavior Loyalty: A Case Study of Wudang Mountains in Hubei Province of China. Sustainability 2023, 15, 7927. [Google Scholar] [CrossRef]
  6. Xu, P.; Wang, L.; Li, Y.; Liu, M. How Do Local Government Information Sources Affect the Purchase Willingness of Low-Carbon Agricultural Products? The Example of Regional Brand Agricultural Products. Front. Public Health 2023, 11, 1169741. [Google Scholar] [CrossRef]
  7. Lu, J.; Sun, J. Research on the Cooperative Co-Construction of Agricultural Products Regional Brand Under the Strategy of Rural Revitalization–Based on the Perspective of Value Co-Creation. Econ. Manag. Res. 2022, 43, 96–110. [Google Scholar]
  8. Pasquinelli, C. Branding as Urban Collective Strategy-Making: The Formation of Newcastle-Gateshead’s Organisational Identity. Urban Stud. 2014, 51, 727–743. [Google Scholar] [CrossRef]
  9. Zheng, X.P.; Huang, Q.Y.; Zheng, S.Y. The Identification and Applicability of Regional Brand-Driving Modes for Agricultural Products. Agriculture 2022, 12, 1127. [Google Scholar] [CrossRef]
  10. Wang, Y. Discussion on the Regional Brand Development of Agricultural Products. IOP Conf. Ser. Earth Environ. Sci. 2020, 598, 012055. [Google Scholar] [CrossRef]
  11. Donner, M.; Fort, F. Stakeholder Value-Based Place Brand Building. J. Prod. Brand Manag. 2018, 27, 807–818. [Google Scholar] [CrossRef] [Green Version]
  12. Margarisová, K.; Vokáčová, L. Regional Branding: Building Brand Value. Acta Univ. Agric. Et Silvic. Mendel. Brun. 2016, 64, 2059–2066. [Google Scholar] [CrossRef] [Green Version]
  13. Reynolds, L.; Koenig-Lewis, N.; Doering, H.; Peattie, K. Competing for Legitimacy in the Place Branding Process: (Re)negotiating the Stakes. Tour. Manag. 2022, 91, 104532. [Google Scholar] [CrossRef]
  14. Eshuis, J.; Braun, E.; Klijn, E.H.; Zenker, S. The Differential Effect of Various Stakeholder Groups in Place Marketing. Environ. Plan. C Politics Space 2018, 36, 916–936. [Google Scholar] [CrossRef] [Green Version]
  15. Zhou, H.; Zhang, Y.; Zhou, L. The Impact of Government Policies on Place Branding Performance: Evidence from China. Total. Qual. Manag. Bus. 2023, 34, 712–742. [Google Scholar] [CrossRef]
  16. Chen, N.; Dwyer, L. Residents’ Place Satisfaction and Place Attachment on Destination Brand-Building Behaviors: Conceptual and Empirical Differentiation. J. Travel Res. 2018, 57, 1026–1041. [Google Scholar] [CrossRef]
  17. Cheung, M.L.; Pires, G.D.; Rosenberger, P.J. Exploring Consumer–Brand Engagement: A Holistic Framework. Eur. Bus. Rev. 2021, 33, 80–103. [Google Scholar] [CrossRef]
  18. Jiang, Y.Y.; Zan, Y.W.; Balaji, M.S. Generation Z Tourists’ Experience and Delight in Rural Tourism: The Mediating Role of Customer Engagement. Anatolia 2022. [Google Scholar] [CrossRef]
  19. Sun, Y.; Wang, Y.L.; Liu, B.Y.; Sun, Z.R. Evolutionary Game of Destination Brand Co-Construction with Government Involvement. Manag. Decis. Econ. 2023, 44, 2125–2136. [Google Scholar] [CrossRef]
  20. Binderkrantz, A.S.; Christiansen, P.M.; Pedersen, H.H. A Privileged Position? The Influence of Business Interests in Government Consultations. J. Public Adm. Res. Theory 2014, 24, 879–896. [Google Scholar] [CrossRef]
  21. Ajzen, I. The Theory of Planned Behaviour. Organ. Behav. Hum. Decis. Process. 1991, 50, 179–211. [Google Scholar] [CrossRef]
  22. Guagnano, G.A.; Stern, P.C.; Dietz, T. Influences on Attitude-Behavior Relationships: A Natural Experiment with Curbside Recycling. Environ. Behav. 1995, 27, 699–718. [Google Scholar] [CrossRef]
  23. Hegner, S.M.; Fenko, A.; Teravest, A. Using the Theory of Planned Behaviour to Understand Brand Love. J. Prod. Brand Manag. 2017, 26, 26–41. [Google Scholar] [CrossRef]
  24. Izquierdo-Yusta, A.; Martinez-Ruiz, M.P.; Perez-Villarreal, H.H. Studying the Impact of Food Values, Subjective Norm and Brand Love on Behavioral Loyalty. J. Retail. Consum. Serv. 2022, 65, 102885. [Google Scholar] [CrossRef]
  25. Dhir, A.; Sadiq, M.; Talwar, S.; Sakashita, M.; Kaur, P. Why Do Retail Consumers Buy Green Apparel? A Knowledge-Attitude-Behaviour-Context Perspective. J. Retail Consum. Serv. 2021, 59, 102398. [Google Scholar] [CrossRef]
  26. Li, P.; Du, J.; Shahzad, F. Leader’s Strategies for Designing the Promotional Path of Regional Brand Competitiveness in The Context of Economic Globalization. Front. Psychol. 2022, 11, 972371. [Google Scholar] [CrossRef]
  27. Yu, H.S.; Ren, B.Y.; Ye, Y.J.; Dai, Y.D. Research on the Regional Brand Construction of Agricultural Products under the Background of Internet. In Proceedings of the 2018 2nd International Conference on Management, Education and Social Science (ICMESS 2018), Qingdao, China, 23–24 June 2018; Volume 1, pp. 824–828. [Google Scholar] [CrossRef]
  28. Zhang, Y.Y.; Yu, L.T.; Mao, T.; Song, M.S. Research on Enterprise’s Participation Intention and Decision-Making Behavior of Manufacturing Place Brand Building from the Perspective of “Standards + Certification”. J. Mang. 2020, 17, 290–297. [Google Scholar] [CrossRef]
  29. Kraus, S.J. Attitudes and the Prediction of Behavior: A Meta-Analysis of the Empirical. Pers. Soc. Psychol. Bull. 1995, 21, 58–75. [Google Scholar] [CrossRef]
  30. Paul, J.; Modi, A.; Patel, J. Predicting Green Product Consumption using Theory of Planned Behavior and Reasoned Action. J. Retail. Consum. Serv. 2016, 29, 123–134. [Google Scholar] [CrossRef]
  31. Maichum, K.; Parichatnon, S.; Peng, K.C. Application of the Extended Theory of Planned Behavior Model to Investigate Purchase Intention of Green Products among Thai Consumers. Sustainability 2016, 8, 1077. [Google Scholar] [CrossRef] [Green Version]
  32. Chen, M.; Chen, J.D.; Wan, Y.Z. Research on the Influence of Regional Culture of Agricultural Products on Customers’ Purchase Behavior. In Proceedings of the Fourteenth International Conference on Management Science and Engineering Management (ICMSEM 2020), Advances in Intelligent Systems and Computing. Chisinau, Moldova, 30 July–2 August 2020; Xu, J., Duca, G., Ahmed, S., García Márquez, F., Hajiyev, A., Eds.; Springer: Cham, Switzerland, 2021; Volume 1191, pp. 259–272. [Google Scholar] [CrossRef]
  33. Klijn, E.H.; Eshuis, J.; Braun, E. The Influence of Stakeholder Involvement on the Effectiveness of Place Branding. Public Manag. Rev. 2012, 14, 499–519. [Google Scholar] [CrossRef]
  34. Sirgy, M.J.; Su, C. Destination Image, Self-Congruity, and Travel Behavior: Toward an Integrative Model. J. Travel Res. 2000, 38, 340–352. [Google Scholar] [CrossRef]
  35. Merrilees, B.; Miller, D.; Herington, C. Multiple Stakeholders and Multiple City Brand Meanings. Eur. J. Mark. 2012, 46, 1032–1047. [Google Scholar] [CrossRef]
  36. Charton-Vachet, F.; Lombart, C.; Louis, D. Impact of Attitude towards a Region on Purchase Intention of Regional Products: The Mediating Effects of Perceived Value and Preference. Int. J. Retail. Distrib. Manag. 2020, 48, 707–725. [Google Scholar] [CrossRef]
  37. Keng, C.J.; Tran, V.D.; Liao, T.H.; Yao, C.J.; Hsu, M.K. Sequential Combination of Consumer Experiences and Their Impact on Product Knowledge and Brand Attitude: The Moderating Role of Desire for Unique Consumer Products. Internet Res. 2014, 24, 270–291. [Google Scholar] [CrossRef]
  38. Faircloth, J.B.; Capella, L.M.; Alford, B.L. The Effect of Brand Attitude and Brand Image on Brand Equity. J. Mark. Theory Pract. 2001, 9, 61–75. [Google Scholar] [CrossRef]
  39. Rothwell, R. Reindustrialization and Technology: Towards a National Policy Framework. Sci. Public Policy 1985, 12, 113–130. [Google Scholar] [CrossRef]
  40. Doyle, C. Social Urbanism: Public Policy and Place Brand. J. Place Manag. Dev. 2019, 12, 326–337. [Google Scholar] [CrossRef]
  41. Zhao, W.; Sun, R. Driving Firm’s Involvement in Place Branding: Perspectives of Resource-Based and Institutional Theory. Manag. Rev. 2018, 30, 154–163. [Google Scholar] [CrossRef]
  42. Zhao, W.; Sun, R.; Kakuda, N. Institutionalized Place Branding Strategy, interfirm Trust, and Place Branding Performance: Evidence from China. J. Bus. Res. 2017, 78, 261–267. [Google Scholar] [CrossRef]
  43. So, K.K.F.; King, C.; Sparks, B.A.; Wang, Y. The Role of Customer Engagement in Building Consumer Loyalty to Tourism Brands. J. Travel Res. 2016, 55, 64–78. [Google Scholar] [CrossRef]
  44. Scaramanga, M. Talking about art(s): A Theoretical Framework Clarifying the Association between Culture and Place Branding. J. Place Manag. Dev. 2012, 5, 70–80. [Google Scholar] [CrossRef]
  45. Bose, S.; Roy, S.K.; Alwi, S.F.S.; Nguyen, B. Measuring Customer based Place Brand Equity (CBPBE) from a Public Diplomacy Perspective: Evidence from West Bengal. J. Bus. Res. 2020, 116, 734–744. [Google Scholar] [CrossRef]
  46. Zhao, Y.Z.; Cui, X.T.; Guo, Y.R. Residents’ Engagement Behavior in Destination Branding. Sustainability 2022, 14, 5852. [Google Scholar] [CrossRef]
  47. Asian Development Bank. Promoting Regional Tourism Cooperation under CAREC 2030: A Scoping Study; Asian Development Bank: Mandaluyong, Metro Manila, Philippines, 2019; ISBN 9789292615376. [Google Scholar]
  48. Luo, M. Current Situation, Problems and Countermeasures of Brand Construction of Agricultural Products in Hubei Province. J. Bus. Manag. 2019, 7, 1162–1172. [Google Scholar] [CrossRef] [Green Version]
  49. Gómez, M.; Molina, A. Wine Tourism in Spain: Denomination of Origin Effects on Brand Equity. Int. J. Tour. Res. 2012, 14, 353–368. [Google Scholar] [CrossRef]
  50. Lee, C.; Lim, S.; Ha, B. Green Supply Chain Management and Its Impact on Consumer Purchase Decision as A Marketing Strategy: Applying the Theory of Planned Behavior. Sustainability 2021, 13, 10971. [Google Scholar] [CrossRef]
  51. Zameer, H.; Wang, Y.; Yasmeen, H. Reinforcing Green Competitive Advantage through Green Production, Creativity and Green Brand Image: Implications for Cleaner Production in China. J. Clean. Prod. 2020, 247, 119119. [Google Scholar] [CrossRef]
  52. Staw, B.M.; Epstein, L.D. What Bandwagons Bring: Effects of Popular Management Techniques on Corporate Performance, Reputation, and CEO Pay. Adm. Sci. Q. 2000, 45, 523–556. [Google Scholar] [CrossRef]
  53. Shamim, A.; Butt, M.M. A Critical Model of Brand Experience Consequences. Asia Pac. J. Mark. Logist. 2013, 25, 102–117. [Google Scholar] [CrossRef]
  54. Chaulagain, S.; Wiitala, J.; Fu, X.X. The Impact of Country Image and Destination Image on US Tourists’ Travel Intention. J. Destin. Mark. Manag. 2019, 12, 1–11. [Google Scholar] [CrossRef]
  55. Wang, J.H.; Chu, M.; Deng, Y.Y.; Lam, H.; Tang, J.J. Determinants of Pesticide Application: An Empirical Analysis with Theory of Planned Behaviour. China Agric. Econ. Rev. 2018, 10, 608–625. [Google Scholar] [CrossRef] [Green Version]
  56. Chen, R.X.; Zhou, Z.M.; Zhan, G.; Zhou, N. The Impact of Destination Brand Authenticity and Destination Brand Self-Congruence on Tourist Loyalty: The Mediating Role of Destination Brand Engagement. J. Destin. Mark. Manag. 2020, 15, 100402. [Google Scholar] [CrossRef]
  57. Picazo-Vela, S.; Chou, S.Y.; Melcher, A.J.; Pearson, J.M. Why Provide an Online Review? An Extended Theory of Planned Behavior and the Role of Big-Five Personality Traits. Comput. Hum. Behav. 2010, 26, 685–696. [Google Scholar] [CrossRef]
  58. Osei-Frimpong, K.; McLean, G.; Famiyeh, S. Social Media Brand Engagement Practices: Examining The Role of Consumer Brand Knowledge, Social Pressure, Social Relatedness, and Brand Trust. Inf. Technol. People 2020, 33, 1235–1254. [Google Scholar] [CrossRef]
  59. Liu, B.; Miltgen, C.L.; Xia, H. Disclosure Decisions and the Moderating Effects of Privacy Feedback and Choice. Decis. Support Syst. 2022, 155, 113717. [Google Scholar] [CrossRef]
  60. Nunnally, J.C.; Bernstein, I.H. Psychometric Theory, 3rd ed.; McGraw-Hill: New York, NY, USA, 1994. [Google Scholar]
  61. Hair, J.F.; Ringle, C.M.; Sarstedt, M. PLS-SEM: Indeed a Silver Bullet. J. Mark. Theory Pract. 2011, 19, 139–152. [Google Scholar] [CrossRef]
  62. Hair, J.F.; Sarstedt, M.; Ringle, C.M.; Mena, J.A. An Assessment of the Use of Partial Least Squares Structural Equation Modeling in Marketing Research. J. Acad. Mark. Sci. 2012, 40, 414–433. [Google Scholar] [CrossRef]
  63. Kock, N.; Hadaya, P. Minimum Sample Size Estimation in PLS-SEM: The Inverse Square Root and Gamma-Exponential Methods. Inf. Syst. J. 2016, 28, 227–261. [Google Scholar] [CrossRef]
  64. Choi, H.; Park, J.; Jung, Y. The Role of Privacy Fatigue in Online Privacy Behavior. Comput. Hum. Behav. 2018, 81, 42–51. [Google Scholar] [CrossRef]
  65. Urbach, N.; Ahlemann, F. Structural Equation Modeling in Information Systems Research Using Partial Least Squares. J. Inf. Technol. Theory Appl. 2010, 11, 5–40. [Google Scholar]
  66. Hair, J.F.; Hult, G.T.M.; Ringle, C.; Sarstedt, M. A Primer on Partial Least Squares Structural Equation Modeling (PLS-SEM), 2nd ed.; Sage Publications: Thousand Oaks, CA, USA, 2016. [Google Scholar]
  67. Wong, K.K.K. Technical Note: Mediation Analysis, Categorical Moderation Analysis, and Higher-Order Constructs Modeling in Partial Least Squares Structural Equation Modeling (PLS-SEM): A B2B Example using SmartPLS. Mark. Bull. 2016, 26, 1–22. [Google Scholar] [CrossRef]
  68. Wilson, B. Using PLS to Investigate Interaction Effects Between Higher Order Branding Constructs. In Handbook of Partial Least Squares; Vinzi, V.E., Chin, W.W., Henseler, J., Wang, H., Eds.; Springer: Berlin/Heidelberg, Germany, 2010; pp. 621–652. [Google Scholar] [CrossRef]
  69. Sarstedt, M.; Hair, J.F.; Cheah, J.-H.; Becker, J.-M.; Ringle, C.M. How to Specify, Estimate, and Validate Higher-Order Constructs in PLS-SEM. Australas. Mark. J. 2019, 27, 197–211. [Google Scholar] [CrossRef]
  70. Kock, F.; Berbekova, A.; George Assaf, A. Understanding and Managing the Threat of Common Method Bias: Detection, Prevention and Control. Tour Manag. 2021, 86, 104330. [Google Scholar] [CrossRef]
  71. Podsakoff, P.M.; MacKenzie, S.B.; Lee, J.Y. Common Method Biases in Behavioral Research: A Critical Review of the Literature and Recommended Remedies. J. Appl. Psychol. 2003, 88, 879–903. [Google Scholar] [CrossRef] [PubMed]
  72. Podsakoff, P.M.; Organ, D.W. Self-Reports in Organizational Research: Problems and Prospects. J. Manag. 1986, 12, 531–544. [Google Scholar] [CrossRef]
  73. Liang, H.; Saraf, N.; Hu, Q.; Xue, Y. Assimilation of Enterprise Systems: The Effect of Institutional Pressures and the Mediating Role of Top Management. MIS Q. 2007, 31, 59–87. [Google Scholar] [CrossRef]
  74. Henseler, J.; Ringle, C.M.; Sinkovics, R.R. The Use of Partial Least Squares Path Modeling in International Marketing. Adv. Int. Mark. 2009, 20, 277–319. [Google Scholar] [CrossRef] [Green Version]
  75. Chin, W.W. The Partial Least Squares Approach for Structural Equation Modeling. In Modern Methods for Business Research; Marcoulides, G.A., Ed.; Lawrence Erlbaum Associates: Mahway, NJ, USA, 1998; pp. 295–336. [Google Scholar]
  76. Hair, J.F.; Sarstedt, M.; Hopkins, L.; Kuppelwieser, V.G. Partial Least Squares Structural Equation Modeling (PLS-SEM): An Emerging Tool in Business Research. Eur. Bus. Rev. 2014, 26, 106–121. [Google Scholar] [CrossRef]
  77. Fornell, C.; Larcker, D.F. Structural Equation Models with Unobservable Variables and Measurement Error: Algebra and Statistics. J. Mark. Res. 1981, 18, 382–388. [Google Scholar] [CrossRef]
  78. Lohmöller, J.B. Latent Variable Path Modeling with Partial Least Squares; Physica Heidelberg: Heidelberg, Germany, 2013. [Google Scholar] [CrossRef]
  79. Bagozzi, R.P.; Yi, Y. Multitrait-multimethod Matrices in Consumer Research. J. Consum. Res. 1991, 17, 426–439. [Google Scholar] [CrossRef]
  80. Bollen, K.A. Structural Equations with Latent Variables; Wiley: New York, NY, USA, 1989. [Google Scholar] [CrossRef]
  81. Petter, S.; Straub, D.W.; Rai, A. Specifying Formative Constructs in Information Systems Research. MIS Q. 2007, 31, 623–656. [Google Scholar] [CrossRef] [Green Version]
  82. Geisser, S. A Predictive Approach to the Random Effect Model. Biometrika 1974, 61, 101–107. [Google Scholar] [CrossRef]
  83. Stone, M. Cross-Validatory Choice and Assessment of Statistical Predictions. J. R. Stat. Soc. Ser. B 1974, 32, 111–147. [Google Scholar] [CrossRef]
  84. Falk, R.F.; Miller, N.B. A Primer for Soft Modeling; University of Akron Press: Akron, OH, USA, 1992. [Google Scholar]
  85. Cohen, J. Statistical Power Analysis for the Behavioral Sciences; Lawrence Erlbaum Associates: Mahwah, NJ, USA, 1988. [Google Scholar] [CrossRef]
  86. Matzler, K.; Strobl, A.; Stokburger-Sauer, N.; Bobovnicky, A.; Bauer, F. Brand Personality and Culture: The Role of Cultural Differences on The Impact of Brand Personality Perceptions on Tourists’ Visit Intentions. Tour Manag. 2016, 52, 507–520. [Google Scholar] [CrossRef]
  87. Fornell, C.; Cha, J. Partial Least Squares. In Advanced Methods of Marketing Research; Bagozzi, R.P., Ed.; Blackwell Business: Cambridge, MA, USA, 1994; pp. 52–78. [Google Scholar]
  88. Purvis, R.L.; Sambamurthy, V.; Zmud, R.W. The Assimilation of Knowledge Platforms in Organizations: An Empirical Investigation. Organ. Sci. 2001, 12, 117–135. [Google Scholar] [CrossRef] [Green Version]
  89. Preacher, K.J.; Hayes, A.F. Asymptotic and Resampling Strategies for Assessing and Comparing Indirect Effects in Multiple Mediator Models. Behav. Res. Methods 2008, 40, 879–891. [Google Scholar] [CrossRef] [PubMed]
  90. Zhao, X.S.; Lynch, J.G.; Chen, Q.M. Reconsidering Baron and Kenny: Myths and Truths about Mediation Analysis. J. Consum. Res. 2010, 37, 197–206. [Google Scholar] [CrossRef]
  91. Margarisová, K.; Vokáčová, L.; Kuralová, K.; Hlavsa, T. Regional Branding: Customer’s Experience with the Certified Products. Acta Univ. Agric. Et Silvic. Mendel. Brun. 2018, 66, 1549–1556. [Google Scholar] [CrossRef] [Green Version]
  92. Kim, Y.K.; Sullivan, P. Emotional Branding Speaks to Consumers’ Heart: The Case of Fashion Brands. Fash. Text. 2019, 6, 2. [Google Scholar] [CrossRef] [Green Version]
  93. Naef, P. Touring the ‘Comuna’: Memory and Transformation in Medellín, Colombia. J. Tour. Cult. Chang. 2016, 16, 173–190. [Google Scholar] [CrossRef] [Green Version]
  94. Lynn, M. Effects of the Big Five Personality Traits on Tipping Attitudes, Motives, and Behaviors. Int. J. Hosp. Manag. 2021, 92, 102722. [Google Scholar] [CrossRef]
  95. Akbari, M.; Moradipour, S. Horses for Courses: B2B Salesperson Performance: The Role of Their Characteristics and Promotion Efforts. Middle East J. Manag. 2021, 8, 297–318. [Google Scholar] [CrossRef]
  96. Fikouie, M.; Akbari, M.; Ebrahimpour, M.; Moradipour, S. Seeing the Forest through Trees: Advertising Appeals, Product Involvement, and Construal Level. Middle East J. Manag. 2022, 9, 372–394. [Google Scholar] [CrossRef]
Figure 1. The proposed conceptual model, where the supply-side policy (SP), demand-side policy (DP), and regulatory policy (RP) are first-order constructs. As a result, GP is a reflective-formative second-order construct.
Sustainability 15 11329 g001
Table 1. Abbreviations used in this paper and their meaning.
AbbreviationDescriptionAbbreviationDescription
ABCattitude–behavior–contextPLSpartial least squares
APRBattitude towards promoting regional brandsQ2predictive relevance
AVEaverage variance extractedq2effect size of predictive relevance
BPRBbehavior towards promoting regional brandsR2determination coefficients
CBcovariance basedR1substantive factor loading
CIconfidence intervalR2method factor loading
CILLconfidence interval lower limitRAregional advantage
CIULconfidence interval upper limitRB(s)regional brand(s)
CMBcommon method biasRPregulatory policy
CPconsumer pressureSEMstructural equation modeling
CRcomposite reliabilitySNsubjective norm
DPdemand-side policySPsupply-side policy
EFAexploratory factor analysisTPBtheory of planned behavior
f2effect sizeVAFvariance accounted for
GPgovernment policyVIFvariance inflation factor
PBCperceived behavioral control
Table 2. Measures of the constructs and the literature sources.
ConstructItemSource(s)
APRB
(1)
Promoting RB is beneficial (APRB1).
Charton-Vachet et al. [36]; Lee et al. [50]; Maichum et al. [31]; Paul et al. [30]; Wang et al. [55]
(2)
Promoting RB is wise (APRB2).
(3)
I am willing to engage in promoting RB (APRB3).
(4)
I have a positive attitude towards promoting RB (APRB4).
RA
(1)
Location endowment (RA1)
Li et al. [26]
(2)
Ecological environment (RA2)
(3)
Historical and cultural resources (RA3)
GP
(1)
The supply side policy reflects important values that people care about (SP)
Zhao et al. [42];
Zhou et al. [15]
(2)
The demand-side policy is helpful to me (DP)
(3)
Regulatory policy (RP)
CP
(1)
I feel pressure from consumers to provide reviews (CP1).
Osei-Frimpong et al. [58];
Picazo-Vela et al. [57]
(2)
Consumers expect that I will promote products with good quality (CP2).
(3)
Consumers expect that I will improve the level of service (CP3).
BPRB
(1)
I am interested in participating in various promotional activities and functions (BPRB1).
Bose et al. [45];
Chen et al. [56];
Eshuis et al. [14]
(2)
I would like to use the opportunity to participate in promotional activities (BPRB2).
(3)
I will spend a lot of time participating in a place’s promotional activities (BPRB3).
(4)
I will be highly involved in developing the content of our area’s place-based marketing strategy (BPRB4).
Table 3. Demographic characteristics of the respondents from Wudang and Wuyi Montains.
Classification FrequencyPercentage
GenderMale18377.22%
Female5422.78%
Age (years)Under 2993.80%
30–3910744.94%
40–497331.01%
50–604318.35%
Older than 6051.90%
EducationJunior school and below5824.47%
High school4920.68%
College graduate5523.21%
University graduate5924.89%
Postgraduate and above166.75%
AreaWudang Mountains 12653.16%
Wuyi Mountains11146.84%
OccupationAgriculture (tea plantation)4719.62%
Processing industry (Dahongpao Tea)3815.82%
Service industry (Taijiquan, traditional clothing, the Wudang sword, Wudang vegetarian food, cultural homestays)15264.56%
Table 4. Common method bias test of the variables.
ConstructIndicatorSubstantive Factor Loading (R1)R12Method Factor Loading (R2)R22
RARA10.7840.6150.0150.000
RA20.8140.6630.2940.086
RA30.7950.632−0.0670.004
GPDP0.7910.6260.010.000
RP0.7910.626−0.0190.000
SP0.6700.579−0.0490.002
APRBAPRB10.7700.5930.0020.000
APRB20.7510.5640.1630.027
APRB30.7480.5600.110.012
APRB40.5980.358−0.1320.017
CPCP10.8600.740−0.0710.005
CP20.8330.694−0.1420.020
CP30.8940.799−0.0120.000
BPRBBPRB10.8280.4490.0770.006
BPRB20.8260.686−0.0670.004
BPRB30.8100.682−0.0320.001
BPRB40.7610.656−0.0520.003
Average 0.7840.6190.0020.011
Table 5. Assessment of the three first-order measurements of the second-order construct GP.
First-Order ConstructsItemLoadingCronbach’s αCRAVE
DPDP10.820 ***0.7080.8380.633
DP20.826 ***
DP30.737 ***
RPRP10.741 ***0.6890.8290.618
RP20.829 ***
RP30.785 ***
SPSP10.735 ***0.6530.8120.590
SP20.779 ***
SP30.789 ***
Note: Number of bootstrap samples = 5000; *** p-value < 0.001.
Table 6. Discriminant validity analysis for the first-order construct of GP.
DPRPSP
DP0.796
RP0.5240.786
SP0.4730.3660.768
Note: Bold diagonal values are the square root of the AVE; others are correlation coefficients.
Table 7. Assessment of the second-order construct of GP and other first-order constructs.
ConstructsItemLoading/WeightCronbach’s αCR/VIFAVE
RARA10.768 ***0.7140.8400.636
RA20.814 ***
RA30.809 ***
GPDP0.428 ***n.a.1.314n.a.
RP0.432 *** 1.312
SP0.473 *** 1.132
APRBAPRB10.765 ***0.6860.8100.518
APRB20.747 ***
APRB30.736 ***
APRB40.622 ***
CPCP10.871 ***0.8280.8970.743
CP20.812 ***
CP30.901 ***
BPRBBPRB10.828 ***0.8210.8810.650
BPRB20.818 ***
BPRB30.800 ***
BPRB40.780 ***
Note: Number of bootstrap samples = 5000; *** p-value < 0.001; n.a.: not applicable.
Table 8. Discriminant validity of the model.
APRBBPRBCPRA
APRB0.720
BPRB0.6570.806
CP0.4650.4670.862
RA0.3760.4270.2910.797
Note: Bold diagonal values are the square root of the AVE; others represent the correlation coefficient. Since GP is a formative construct, there is no AVE for it.
Table 9. Analysis results of the direct effects.
HypothesisPath Coefficientt-Value95% CILL95% CIULResults
H1: RA→APRB0.143 *2.1810.0140.271supported
H2: APRB→BPRB0.452 ***6.8030.3150.576supported
H3: GP→APRB0.511 ***8.2980.3740.615supported
H4: RA→BPRB0.148 *2.2020.0220.288supported
H5: GP→BPRB0.159 *2.3280.0210.287supported
H6: CP→BPRB0.124 *1.9810.0050.251Supported
Note: Number of bootstrap samples = 5000. * p-value < 0.05; *** p-value < 0.001.
Table 10. Analysis results of the mediating effects.
Indirect Effect PathIndirect Effect Valuet-Value95% CILL95% CIULVAF
H2a:RA→APRB→BPRB0.0652.3170.0090.11930.52%
H3a:GP→APRB→BPRB0.2314.5510.1420.34459.23%
Disclaimer/Publisher’s Note: The statements, opinions and data contained in all publications are solely those of the individual author(s) and contributor(s) and not of MDPI and/or the editor(s). MDPI and/or the editor(s) disclaim responsibility for any injury to people or property resulting from any ideas, methods, instructions or products referred to in the content.

