Principal Component Regression Modeling and Analysis of PM10 and Meteorological Parameters in Sarajevo with and without Temperature Inversion
Abstract
1. Introduction
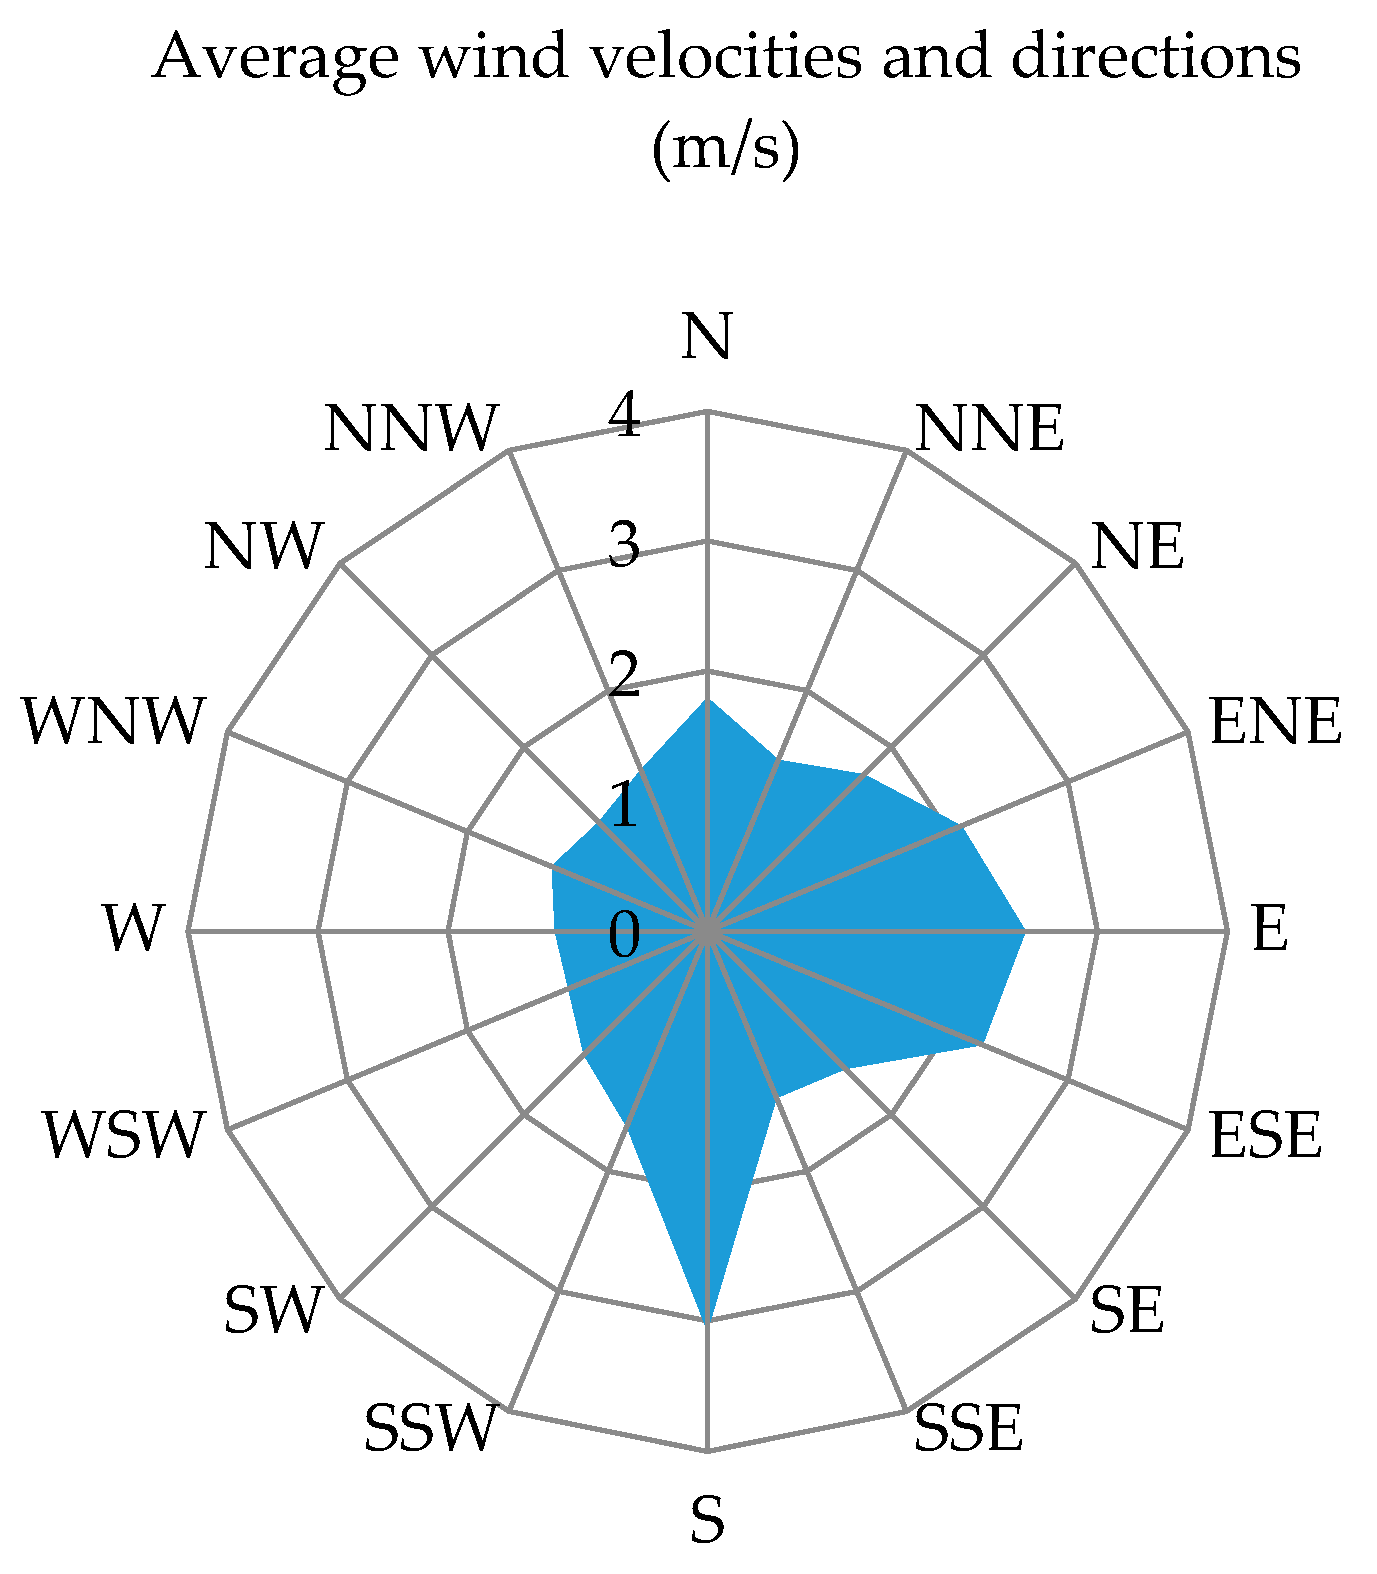

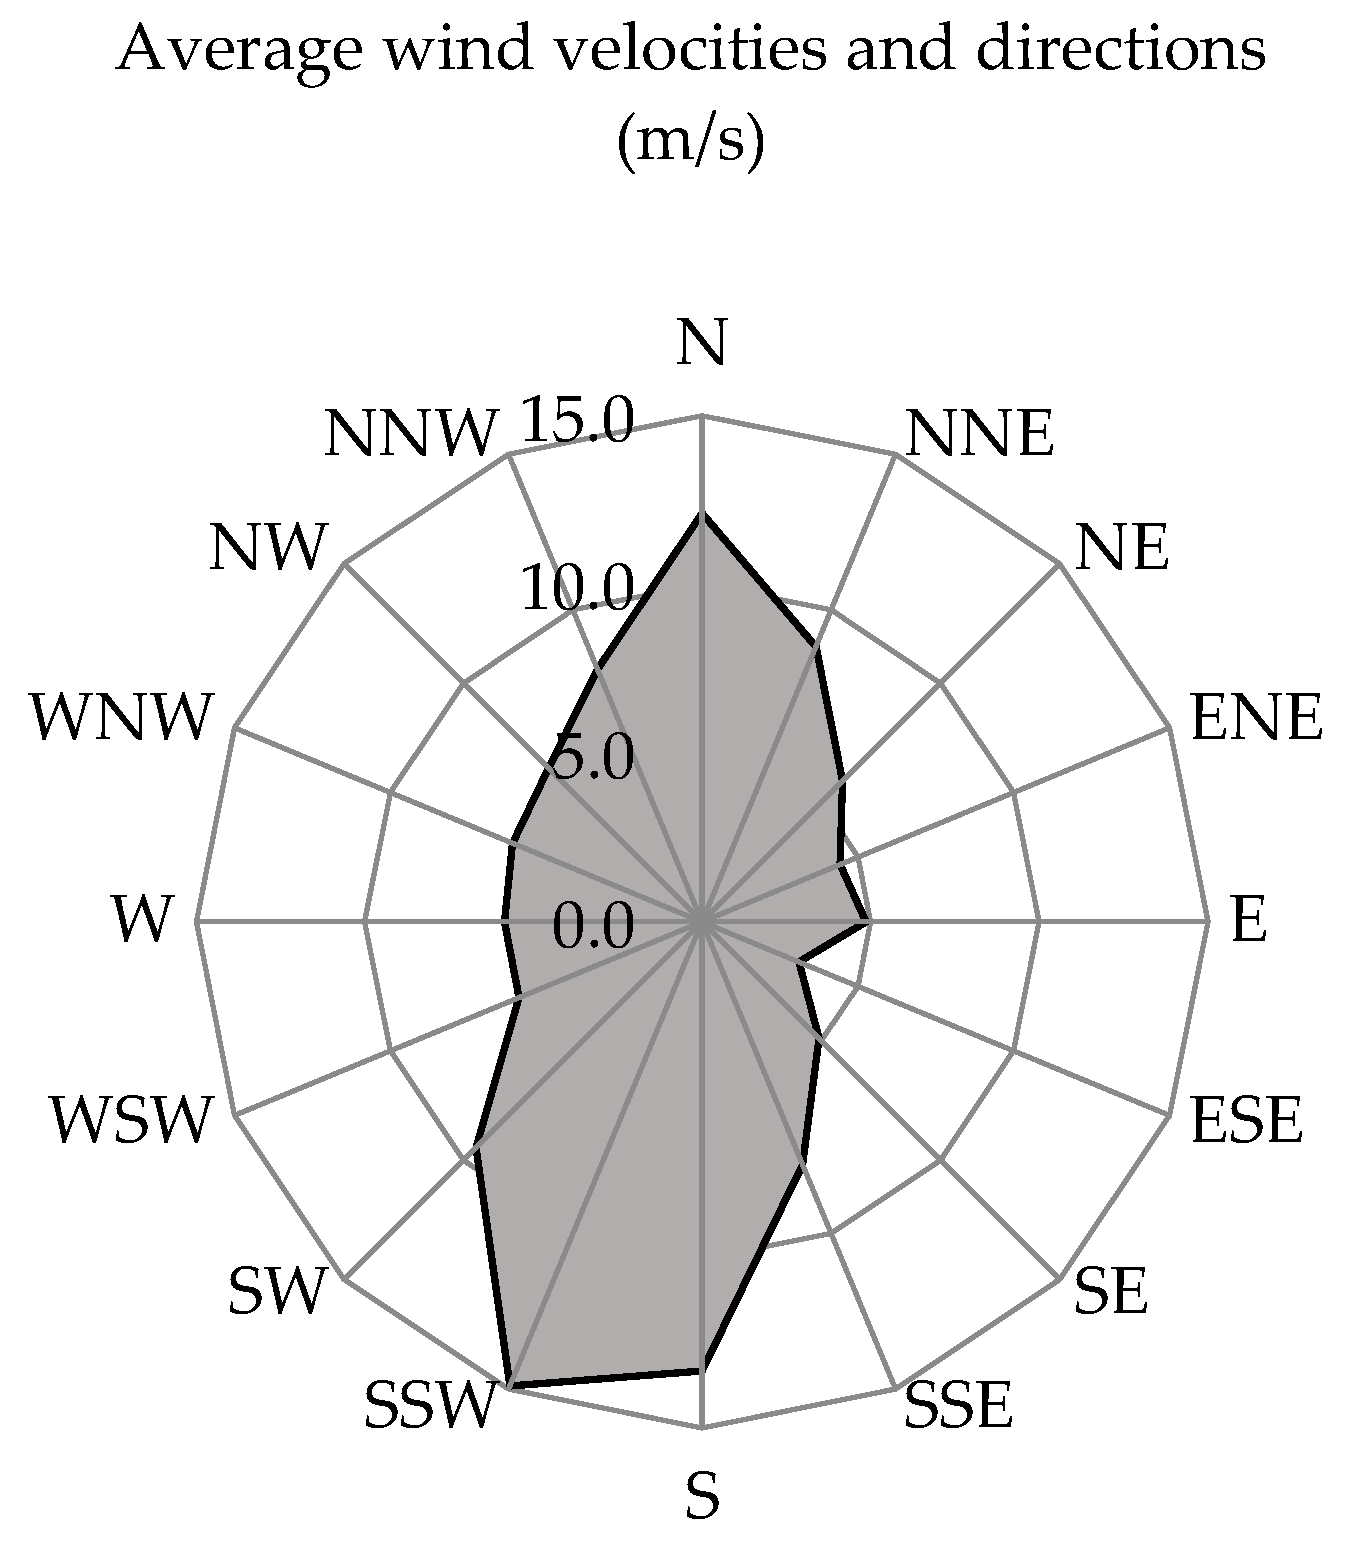
2. Materials and Methods
2.1. Study Area and Data Collection
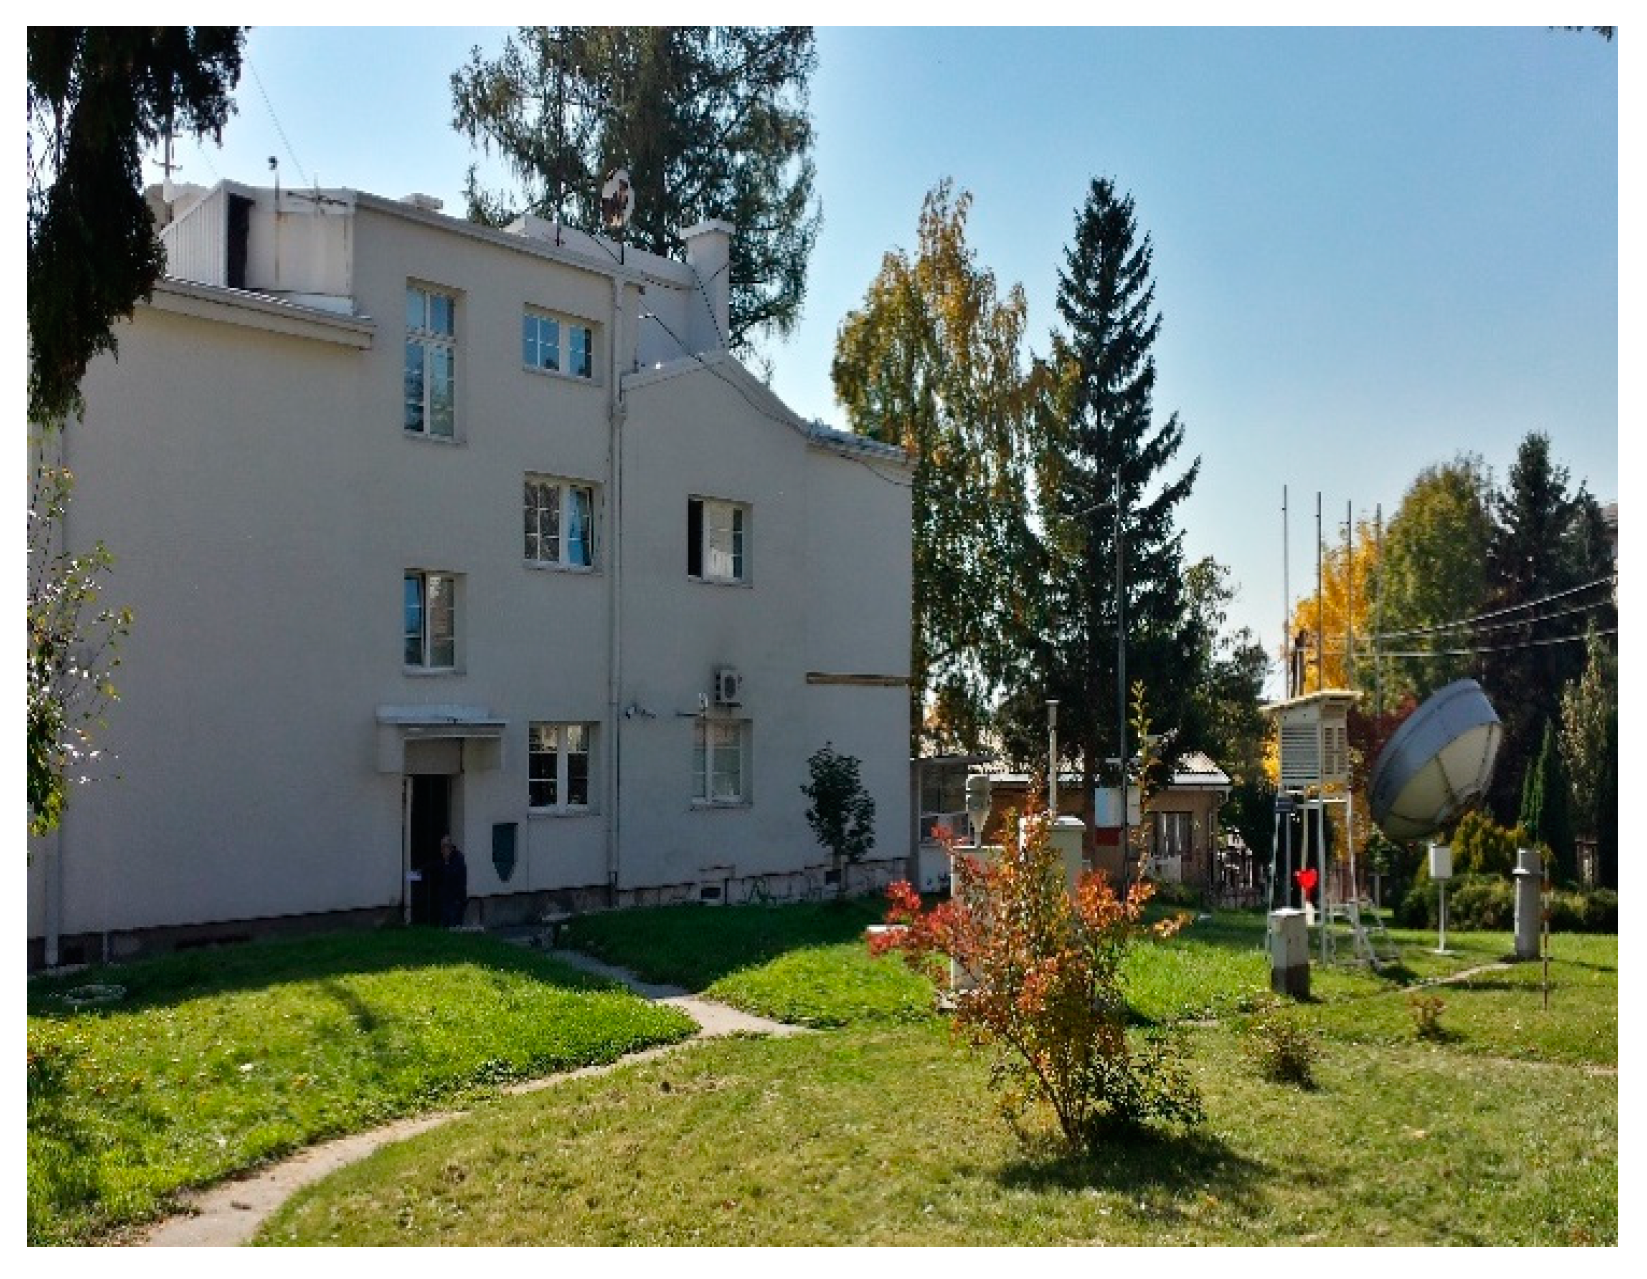
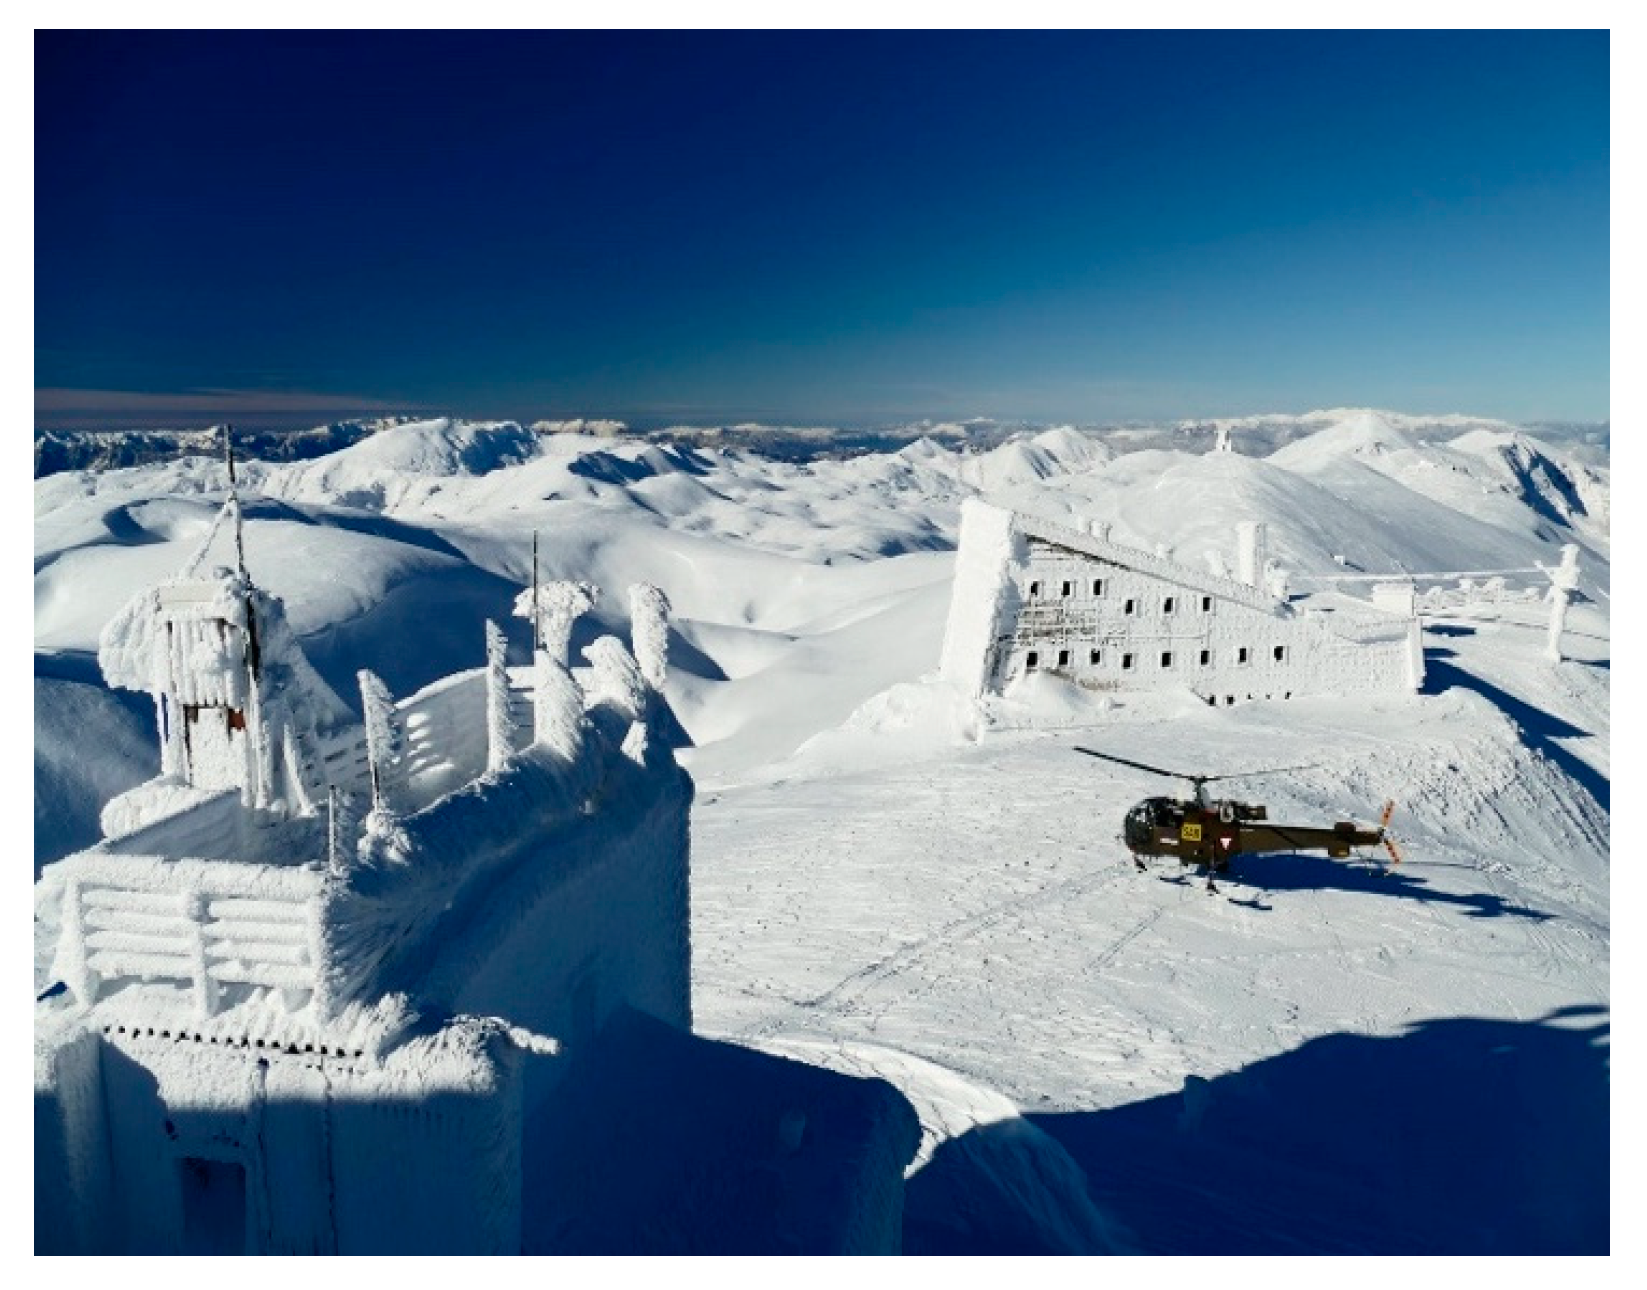
2.2. Principal Component Regression
- number of independent variables;
- number of samples (observations);
- matrix of independent variables;
- matrix of eigenvectors;
- matrix of principal components.
- number of principal components;
- predicted value of average hourly
- principal component regression coefficients;
- intercept;
- principal components.
3. Results and Discussion
3.1. Analysis of and Meteorological Parameters
| January | November | |||||||||
|---|---|---|---|---|---|---|---|---|---|---|
| PM10 | HS | PS | TS | TS/TB | PM10 | HS | PS | TS | TS/TB | |
| Time | p-Value | |||||||||
| 00:00 | 0.002 | 0.033 | 0.000 | 0.000 | 0.000 | 0.200 | 0.000 | 0.002 | 0.000 | 0.002 |
| 01:00 | 0.003 | 0.072 | 0.000 | 0.000 | 0.002 | 0.248 | 0.324 | 0.002 | 0.000 | 0.003 |
| 02:00 | 0.003 | 0.045 | 0.000 | 0.000 | 0.000 | 0.455 | 0.547 | 0.001 | 0.000 | 0.002 |
| 03:00 | 0.006 | 0.005 | 0.000 | 0.000 | 0.000 | 0.663 | 0.234 | 0.000 | 0.000 | 0.005 |
| 04:00 | 0.044 | 0.059 | 0.000 | 0.000 | 0.001 | 0.629 | 0.184 | 0.001 | 0.000 | 0.001 |
| 05:00 | 0.018 | 0.098 | 0.000 | 0.000 | 0.000 | 0.400 | 0.042 | 0.001 | 0.000 | 0.001 |
| 06:00 | 0.027 | 0.249 | 0.000 | 0.000 | 0.000 | 0.375 | 0.010 | 0.002 | 0.000 | 0.000 |
| 07:00 | 0.027 | 0.100 | 0.000 | 0.000 | 0.000 | 0.314 | 0.045 | 0.004 | 0.000 | 0.002 |
| 08:00 | 0.043 | 0.086 | 0.000 | 0.001 | 0.002 | 0.270 | 0.131 | 0.005 | 0.003 | 0.006 |
| 09:00 | 0.004 | 0.006 | 0.000 | 0.001 | 0.019 | 0.142 | 0.014 | 0.026 | 0.000 | 0.009 |
| 10:00 | 0.041 | 0.009 | 0.002 | 0.000 | 0.026 | 0.135 | 0.020 | 0.007 | 0.002 | 0.020 |
| 11:00 | 0.041 | 0.030 | 0.003 | 0.001 | 0.126 | 0.113 | 0.019 | 0.013 | 0.002 | 0.069 |
| 12:00 | 0.006 | 0.090 | 0.006 | 0.008 | 0.151 | 0.376 | 0.017 | 0.043 | 0.002 | 0.048 |
| 13:00 | 0.064 | 0.340 | 0.015 | 0.063 | 0.236 | 0.992 | 0.010 | 0.100 | 0.003 | 0.063 |
| 14:00 | N/A | N/A | N/A | N/A | N/A | 0.978 | 0.001 | 0.072 | 0.004 | 0.085 |
| 15:00 | N/A | N/A | N/A | N/A | N/A | 0.993 | 0.175 | 0.060 | 0.000 | 0.034 |
| 16:00 | 0.002 | 0.137 | 0.001 | 0.013 | 0.096 | 0.251 | 0.135 | 0.028 | 0.000 | 0.035 |
| 17:00 | 0.006 | 0.020 | 0.004 | 0.000 | 0.022 | 0.122 | 0.069 | 0.014 | 0.004 | 0.079 |
| 18:00 | 0.006 | 0.010 | 0.004 | 0.000 | 0.006 | 0.028 | 0.021 | 0.016 | 0.001 | 0.074 |
| 19:00 | 0.001 | 0.063 | 0.000 | 0.000 | 0.008 | 0.013 | 0.049 | 0.009 | 0.001 | 0.069 |
| 20:00 | 0.002 | 0.085 | 0.000 | 0.000 | 0.004 | 0.012 | 0.099 | 0.006 | 0.001 | 0.038 |
| 21:00 | 0.001 | 0.034 | 0.000 | 0.001 | 0.015 | 0.036 | 0.210 | 0.001 | 0.001 | 0.024 |
| 22:00 | 0.002 | 0.110 | 0.000 | 0.000 | 0.009 | 0.078 | 0.332 | 0.002 | 0.000 | 0.012 |
| 23:00 | 0.003 | 0.053 | 0.000 | 0.000 | 0.003 | 0.036 | 0.132 | 0.006 | 0.000 | 0.006 |
3.2. Principal Component Regression Models
| Model 1 | 1 | 0.91 | 0.54 | 0.18 | −0.29 | −0.47 | −0.31 | 0.46 |
| 2 | 0.35 | −0.83 | 0.69 | −0.08 | −0.66 | −0.63 | 0.22 | |
| 4 | 0.01 | −0.01 | −0.50 | −0.75 | 0.03 | −0.12 | −0.11 | |
| 6 | −0.01 | 0 | −0.04 | −0.30 | −0.08 | 0.17 | 0.30 | |
| Model 2 | 1 | 0.67 | 0.98 | 0.46 | −0.62 | −0.91 | −0.88 | 0.03 |
| 2 | 0.74 | −0.18 | −0.16 | −0.11 | −0.24 | 0.02 | 0.35 | |
| 3 | 0 | −0.03 | 0.86 | 0.69 | −0.16 | −0.39 | −0.27 | |
| 7 | 0.01 | 0.01 | 0.07 | −0.14 | −0.06 | 0.06 | −0.08 | |
| Model 3 | 2 | −0.05 | 0.48 | −0.26 | −0.28 | 0.07 | −0.17 | −0.17 |
| 3 | 0.01 | −0.01 | −0.91 | −0.24 | 0.01 | 0.08 | 0.21 | |
| 4 | 0 | 0 | −0.02 | 0.20 | 0.08 | 0.29 | 0.48 | |
| 5 | −0.01 | 0 | −0.18 | 0.26 | −0.01 | −0.13 | −0.19 | |
| Model 4 | 1 | −1 | −0.30 | −0.28 | 0.41 | 0.99 | 0.84 | 0.05 |
| 2 | 0 | −0.93 | 0.78 | 0.47 | 0.01 | 0.13 | 0.03 | |
| 3 | 0 | 0.20 | 0.49 | 0.61 | 0.15 | 0.38 | 0.10 | |
| Model 5 | 1 | −1 | −0.94 | 0.48 | 0.95 | 0.98 | 0.96 | 0.25 |
| 2 | 0.02 | −0.25 | −0.62 | −0.02 | 0.17 | 0.25 | −0.04 | |
| 4 | 0.01 | −0.08 | −0.10 | −0.17 | −0.10 | −0.11 | 0 | |
| Model 6 | 1 | 1 | 0.65 | 0.47 | −0.57 | −1 | −0.95 | 0.09 |
| 2 | −0.01 | −0.12 | 0.84 | 0.75 | 0 | 0.17 | 0.14 | |
| 3 | 0.01 | −0.72 | −0.21 | 0.23 | −0.03 | 0.21 | 0.16 | |
| Model 7 | 1 | 1 | 0.97 | 0.68 | −0.67 | −1 | −0.84 | 0.13 |
| 3 | 0.01 | −0.01 | 0.67 | 0.61 | −0.03 | −0.27 | −0.19 | |
| 4 | −0.02 | −0.01 | 0.01 | 0.33 | 0.05 | 0.29 | 0.31 |
4. Conclusions
Author Contributions
Funding
Institutional Review Board Statement
Informed Consent Statement
Data Availability Statement
Acknowledgments
Conflicts of Interest
References
- Hasanovic, M.; Cetkovic, T.; Pourrut, B.; Caluk Klacar, L.; Hadzic Omanovic, M.; Durmic-Pasic, A.; Haveric, S.; Haveric, A. Air pollution in Sarajevo, Bosnia and Herzegovina, assessed by plant comet assay. Mutagenesis 2023, 38, 43–50. [Google Scholar] [CrossRef]
- Cetkovic, T.; Haveric, A.; Behmen, S.; Hadzic Omanovic, M.; Caluk Klacar, L.; Dzaferspahic, A.; Durmisevic, I.; Mehanovic, M.; Haveric, S. A pilot biomonitoring study of air pollution in the urban area of Sarajevo, Bosnia and Herzegovina: Genotoxicity assessment in buccal cells. Mutagenesis 2023, 38, 33–42. [Google Scholar] [CrossRef]
- Beard, J.D.; Beck, C.; Graham, R.; Packham, S.C.; Traphagan, M.; Giles, R.T.; Morgan, J.G. Winter temperature inversions and emergency department visits for asthma in Salt Lake County, Utah, 2003–2008. Environ. Health Perspect. 2012, 120, 1385–1390. [Google Scholar] [CrossRef]
- Czarnecka, M.; Nidzgorska-Lencewicz, J. The impact of thermal inversion on the variability of PM10 concentration in winter seasons in Tricity. Environ. Prot. Eng. 2017, 43, 157–172. [Google Scholar] [CrossRef]
- Hua, S. The Correlation between Temperature Inversion and Atmosphere Pollution in Beijing. Highlights in Science. Eng. Technol. 2022, 25, 87–93. [Google Scholar] [CrossRef]
- Hosseini, V.; Shahbazi, H. Urban Air Pollution in Iran. Iran. Stud. 2016, 49, 1029–1046. [Google Scholar] [CrossRef]
- Trinh, T.T.; Trinh, T.T.; Le, T.T.; Nguyen, T.D.H.; Tu, B.M. Temperature inversion and air pollution relationship, and its effects on human health in Hanoi City, Vietnam. Environ. Geochem. Health 2019, 41, 929–937. [Google Scholar] [CrossRef]
- World Health Organization. Regional Office for Europe. Air Quality Guidelines: Global Update 2005: Particulate Matter, Ozone, Nitrogen Dioxide and Sulfur Dioxide; WHO Regional Office for Europe: Copenhagen, Denmark, 2006; Available online: https://apps.who.int/iris/handle/10665/107823 (accessed on 19 May 2023).
- World Health Organization. Regional Office for Europe. WHO Global Air Quality Guidelines: Particulate Matter (PM2.5 and PM10), Ozone, Nitrogen Dioxide, Sulfur Dioxide and Carbon Monoxide; World Health Organization: Geneva, Switzerland, 2021; Available online: https://apps.who.int/iris/handle/10665/345329 (accessed on 18 May 2023).
- Nidzgorska-Lencewicz, J.; Czarnecka, M. Thermal Inversion and Particulate Matter Concentration in Wrocław in Winter Season. Atmosphere 2020, 11, 1351. [Google Scholar] [CrossRef]
- Brook, R.D.; Rajagopalan, S.; Pope, C.A., III; Brook, J.R.; Bhatnagar, A.; Diez-Roux, A.V.; Holguin, F.; Hong, Y.; Luepker, R.V.; Mittleman, M.A.; et al. Particulate matter air pollution and cardiovascular disease: An update to the scientific statement from the American Heart Association. Circulation 2010, 121, 2331–2378. [Google Scholar] [CrossRef]
- Manisalidis, I.; Stavropoulou, E.; Stavropoulos, A.; Bezirtzoglou, E. Environmental and Health Impacts of Air Pollution: A Review. Front. Public Health 2020, 8, 14. [Google Scholar] [CrossRef]
- Manju, A.; Kalaiselvi, K.; Dhananjayan, V.; Palanivel, M.; Banupriya, G.S.; Vidhya, M.H.; Panjakumar, K.; Ravichandran, B. Spatio-seasonal variation in ambient air pollutants and influence of meteorological factors in Coimbatore, Southern India. Air Qual. Atmos. Health 2018, 11, 1179–1189. [Google Scholar] [CrossRef]
- Boubel, R.W.; Fox, D.L.; Turner, D.B.; Stern, A.C. Fundamentals of Air Pollution, 3rd ed.; Academic Press, Inc.: San Diego, CA, USA, 1994; pp. 149–152. [Google Scholar]
- Rajagopalan, S.; Al-Kindi, S.G.; Brook, R.D. Air pollution and cardiovascular disease: JACC state-of-the-art review. J. Am. Coll. Cardiol. 2018, 72, 2054–2070. [Google Scholar] [CrossRef]
- Pasic, M.; Bijelonja, I. NARX-SP Neural Network Models for Air Quality Prediction for the 24th and 48th Hour Ahead. Int. J. Qual. Res. 2020, 14, 577–592. [Google Scholar] [CrossRef]
- Pasic, M.; Bijelonja, I.; Kadric, E.; Bajric, H. Modeling of Nonlinear Autoregressive Neural Network for Multi-Step Ahead Air Quality Prediction. TEM J. 2020, 9, 884–892. [Google Scholar] [CrossRef]
- Akbal, Y.; Ünlü, K.D. A deep learning approach to model daily particular matter of Ankara: Key features and forecasting. Int. J. Environ. Sci. Technol. 2022, 19, 5911–5927. [Google Scholar] [CrossRef]
- Ariff, N.M.; Bakar, M.A.A.; Lim, H.Y. Prediction of PM10 Concentration in Malaysia Using K-Means Clustering and LSTM Hybrid Model. Atmosphere 2023, 14, 853. [Google Scholar] [CrossRef]
- Pasic, M.; Bijelonja, I.; Pasic, M. Air quality during SARS-CoV-2 (COVID-19) lockdown in Sarajevo. Period. Eng. Nat. Sci. 2020, 8, 884–892. [Google Scholar] [CrossRef]
- Venter, Z.S.; Aunan, K.; Chowdhury; Lelievel, J. COVID-19 lockdowns cause global airpollution declines. Proc. Natl. Acad. Sci. USA 2020, 117, 18984–18990. [Google Scholar] [CrossRef]
- Seaton, A.; MacNee, N.; Donaldson, K.; Godden, D. Particulate air pollution and acute health effects. Lancet 1995, 345, 176–178. [Google Scholar] [CrossRef]
- European Environment Agency. EU Directive 2008/50/EC of the European Parliament and of the Council of 21 May 2008 on ambient air quality and cleaner air for Europe. Off. J. Eur. Union 2008, L152, 1–44. [Google Scholar]
- Barmpadimos, I.; Keller, J.; Oderbolz, D.; Hueglin, C.; Prévôt, A.S.H. One decade of parallel fine (PM2.5) and coarse (PM10–PM2.5) particulate matter measurements in Europe: Trends and variability. Atmos. Chem. Phys. 2012, 12, 3189–3203. [Google Scholar] [CrossRef]
- Zhang, H.; Wang, Y.; Hu, J.; Ying, Q.; Hu, X.M. Relationships between meteorological parameters and criteria air pollutants in three megacities in China. Environ. Res. 2015, 140, 242–254. [Google Scholar] [CrossRef]
- Hernandez, G.; Berry, T.-A.; Wallis, S.L.; Poyner, D. Temperature and Humidity Effects on Particulate Matter Concentrations in a Sub-Tropical Climate during Winter. In Proceedings of the International Conference of the Environment, Chemistry and Biology, Queensland, Australia, 20–22 November 2017. [Google Scholar] [CrossRef]
- Kassomenos, P.; Kelessis, A.; Petrakakis, M.; Zoumakis, N.; Christides, T.; Paschalidou, A.K. Air Quality assessment in a heavily-polluted urban Mediterranean environment through Air Quality indices. Ecol. Indic. 2012, 18, 259–268. [Google Scholar] [CrossRef]
- Dockery, D.W.; Pope, C.A., 3rd; Xu, X.; Spengler, J.D.; Ware, J.H.; Fay, M.E.; Ferris, B.G., Jr.; Speizer, F.E. An association between air pollution and mortality in six U.S. cities. N. Engl. J. Med. 1993, 329, 1753–1759. [Google Scholar] [CrossRef]
- Zhang, X.; Li, Z.; Wang, F.; Song, M.; Zhou, X.; Ming, J. Carbonaceous Aerosols in PM1, PM2.5, and PM10 Size Fractions over the Lanzhou City, Northwest China. Atmosphere 2020, 11, 1368. [Google Scholar] [CrossRef]
- Blažević, R.; Hadžiahmetović, H.; Ahmović, I. Statistical Analysis and Assessment of Wind Energy Potential in Sarajevo, Bosnia and Herzegovina. Teh. Vjesn. 2021, 28, 1511–1518. [Google Scholar] [CrossRef]
- Fisher, B.E.A. The transport and removal of sulfur dioxide in a rain system. Atmos. Environ. 1982, 16, 775–783. [Google Scholar] [CrossRef]
- Shukla, J.B.; Misra, A.K.; Sundar, S.; Naresh, R. Effect of rain on removal of a gaseous pollutant and two different particulate matters from the atmosphere of a city. Math. Comput. Model. 2008, 48, 832–844. [Google Scholar] [CrossRef]
- Bell, M.L.; Davis, D.L. Reassessment of the Lethal London Fog of 1952: Novel Indicators of Acute and Chronic Consequences of Acute Exposure to Air Pollution. Environ. Health Perspect. 2001, 109, 389–394. [Google Scholar] [CrossRef]
- Brimblecombe, P. The Big Smoke: A History of Air Pollution in London since Medieval Times; Methuen & Co.: London, UK, 1987. [Google Scholar]
- Dunea, D.; Iordache, S.; Ianache, C. Relationship between airborne particulate matter and weather conditions in Târgoviște urban area during cold months. Rev. Roum. Chim. 2015, 60, 595–601. [Google Scholar]
- Vardoulakis, S.; Kassomenos, P. Sources and factors affecting PM10 levels in two European cities: Implications for local air quality management. Atmos. Environ. 2008, 42, 3949–3963. [Google Scholar] [CrossRef]
- Hadziahmetovic, H.; Dzaferovic, E.; Ahmovic, I.; Blazevic, R. Analysis of Wind Velocity Data in the Area of the City of Sarajevo in Period from 2001–2010. In Proceedings of the 29th International DAAAM Symposium, Zadar, Croatia, 24–27 October 2018. [Google Scholar] [CrossRef]
- Hadziahmetovic, H.; Ahmovic, I.; Blazevic, R. Analysis of wind velocity data in the area of Bjelasnica in period from 2000–2010. In Proceedings of the 30th International DAAAM Symposium, Zadar, Croatia, 23–26 October 2019. [Google Scholar] [CrossRef]
- Sarajevo-Google Maps. Available online: https://www.google.com/maps/@43.7871214.18.2224241.62868m/data=!3m1!1e3 (accessed on 19 May 2023).
- Jolliffe, I.T. Principal Component Analysis, 2nd ed.; Springer: New York, NY, USA, 2002. [Google Scholar]
- Flury, B. Common Principal Components and Related Models; John Wiley & Sons: New York, NY, USA, 1988. [Google Scholar]
- Jeffers, J.N.R. Two Case Studies in the Application of Principal Component Analysist. J. R. Stat. Soc. Ser. C 1967, 16, 225–236. [Google Scholar] [CrossRef]
- Abdul-Wahab, S.A.; Bakheitb, C.S.; Al-Alawi, S.M. Principal component and multiple regression analysis in modelling of ground-level ozone and factors affecting its concentrations. Environ. Model. Softw. 2005, 20, 1263–1271. [Google Scholar] [CrossRef]
- Jolliffe, I.T. A Note on the Use of Principal Components in Regression. J. R. Stat. Soc. Ser. C 1982, 31, 300–303. [Google Scholar] [CrossRef]
- Hadi, A.S.; Ling, R.F. Some Cautionary Notes on the Use of Principal Components Regression. Am. Stat. 1998, 52, 15–19. [Google Scholar] [CrossRef]
- Xie, Y.L.; Kalivas, J.H. Evaluation of principal component selection methods to form a global prediction model by principal component regression. Anal. Chim. Acta 1997, 348, 19–27. [Google Scholar] [CrossRef]
- Jouan-Rimbaud, D.; Walczak, B.; Massart, D.L.; Last, I.R.; Prebble, K.A. Comparison of multivariate methods based on latent vectors and methods based on wavelength selection for the analysis of near-infrared spectroscopic data. Anal. Chim. Acta 1995, 304, 285–295. [Google Scholar] [CrossRef]
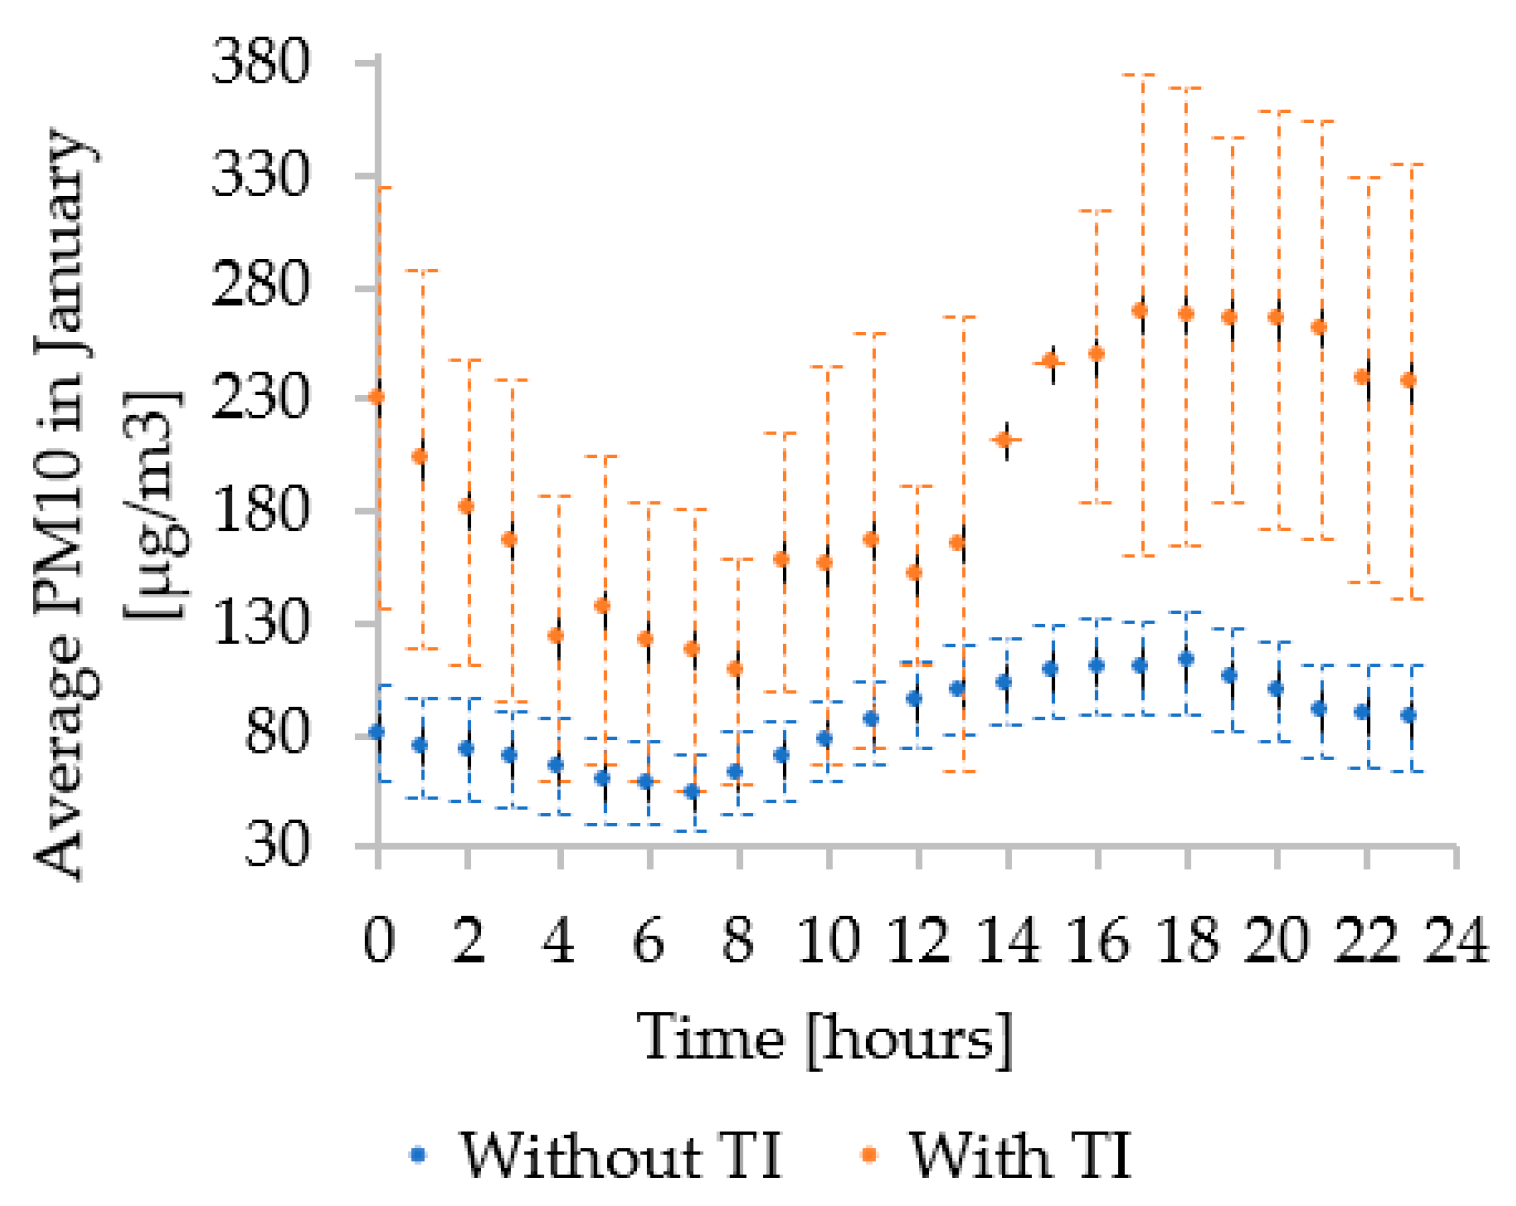

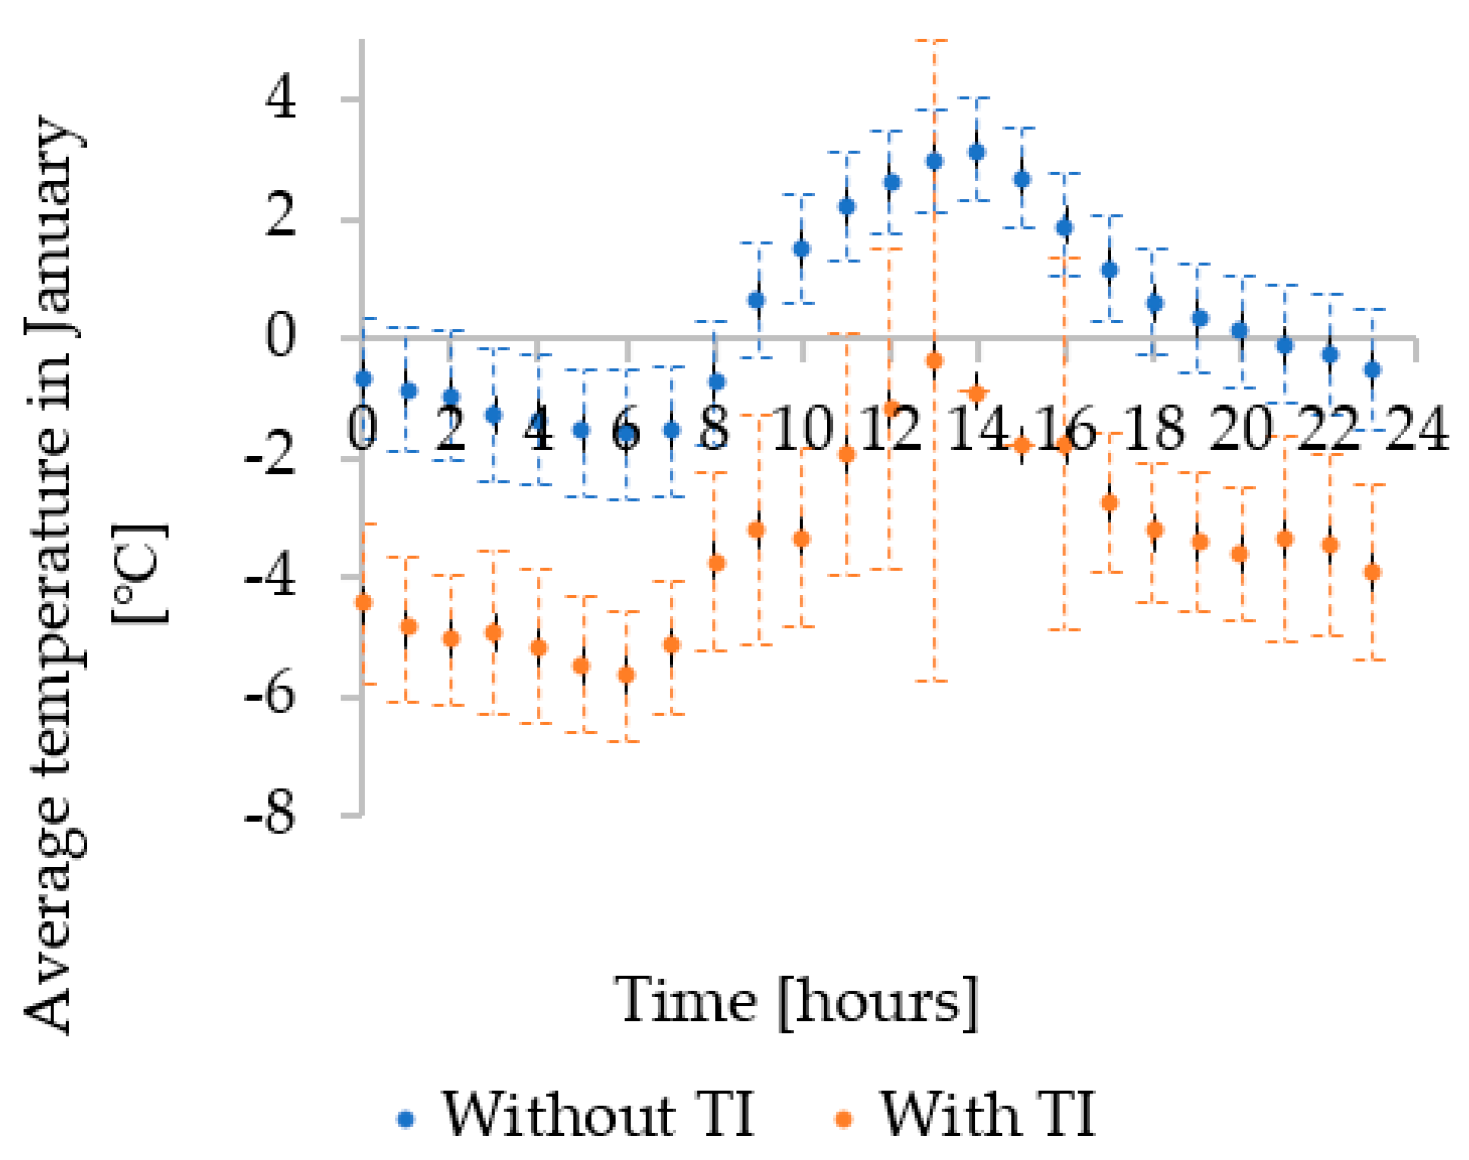


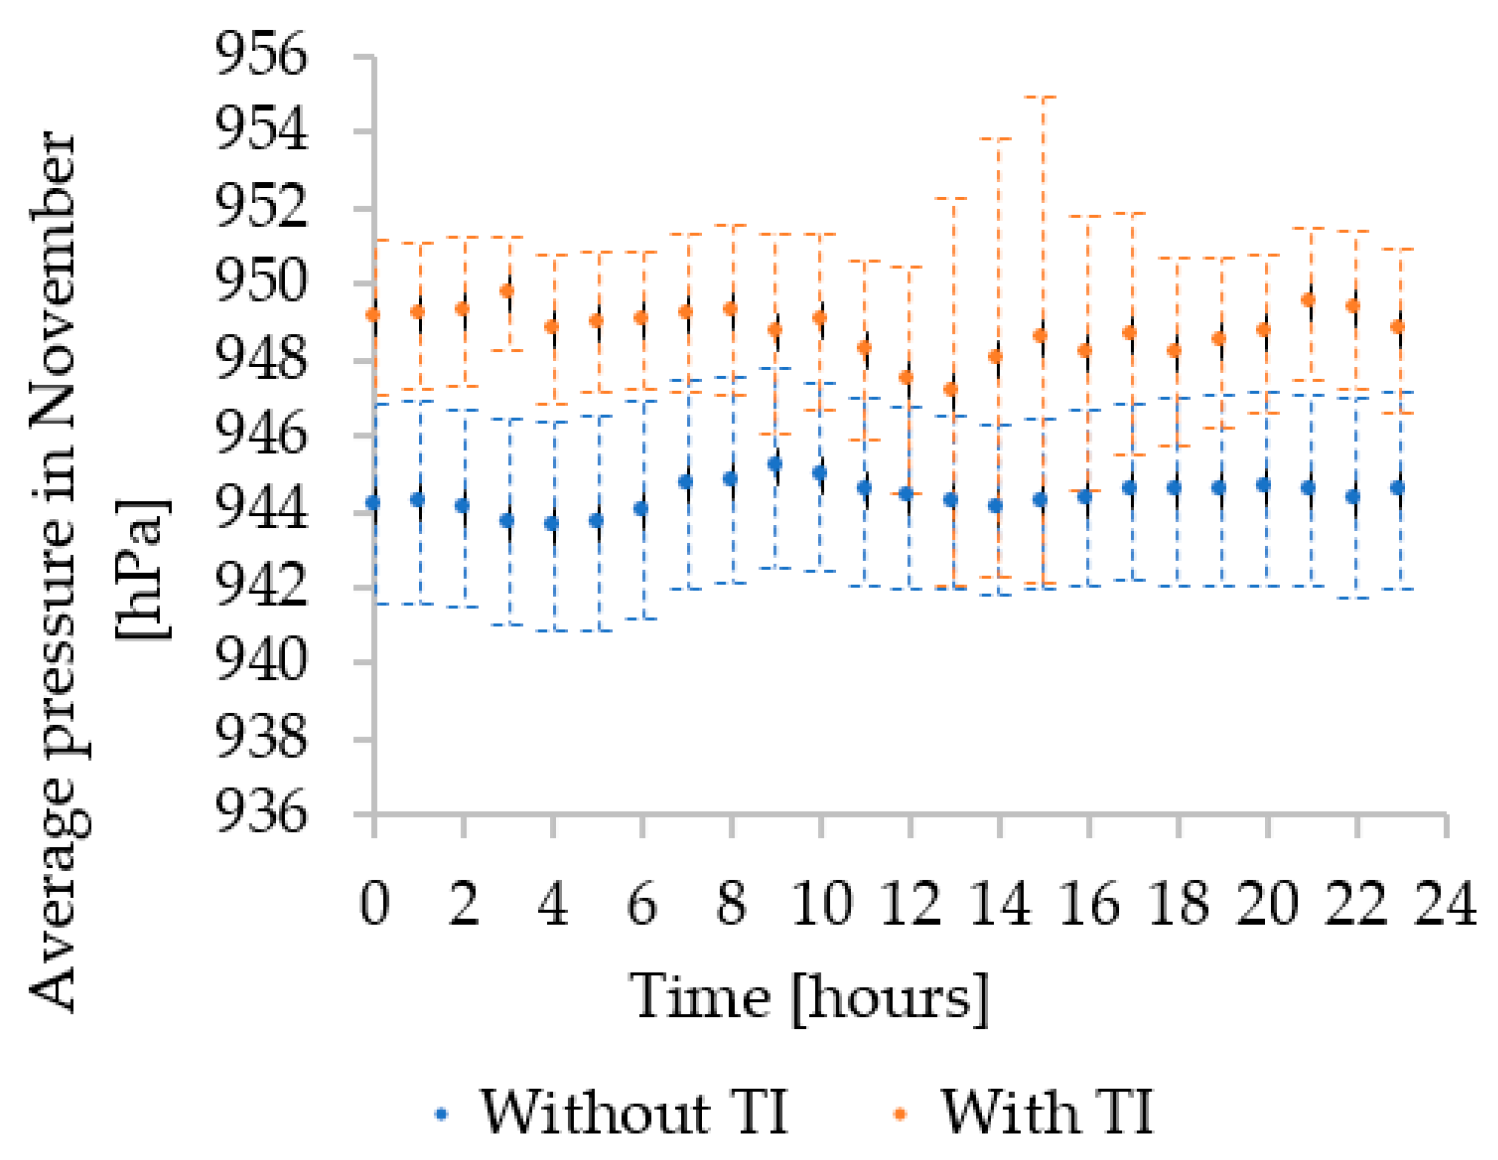

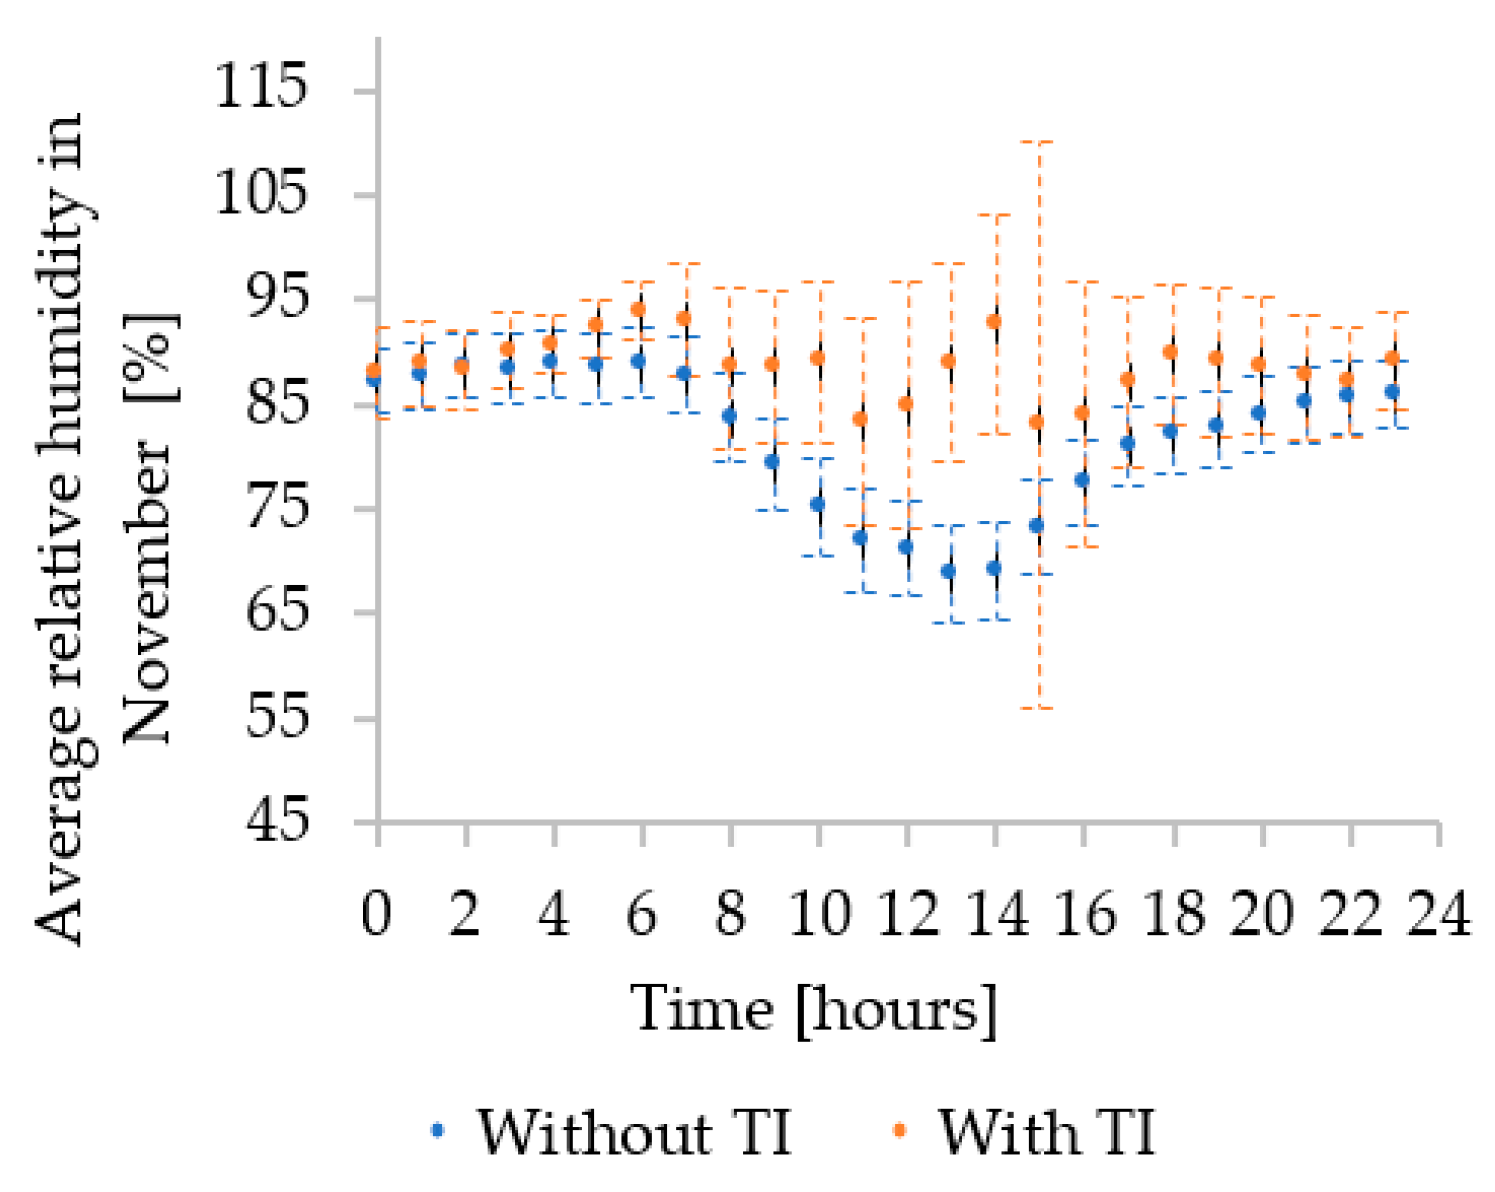




| Model | Month | TI | Full Model | Backward Regression | ||||
|---|---|---|---|---|---|---|---|---|
| (%) | SE | (%) | SE | (%) | SE | |||
| 1 | November | Yes | 85.91 | 12.71 | 81.10 | 13.51 | 34.65 | 24.48 |
| PC: 1, 2, 3, 4, 5, 6, 7 | PC: 1, 2, 4, 6 | PC: 1, 2, 3 | ||||||
| 2 | January | Yes | 85.46 | 25.33 | 83.30 | 24.91 | 74.30 | 30.12 |
| PC: 1, 2, 3, 4, 5, 6, 7 | PC: 1, 2, 3, 7 | PC: 1, 2, 3 | ||||||
| 3 | November | No | 90.02 | 4.27 | 87.54 | 4.38 | 60.59 | 7.41 |
| PC: 1, 2, 3, 4, 5, 6, 7 | PC: 2, 3, 4, 5 | PC: 1, 2 | ||||||
| 4 | December | No | 81.23 | 5.01 | 69.63 | 5.70 | 14.20 | 9.14 |
| PC: 1, 2, 3, 4, 5, 6, 7 | PC: 1, 2, 3 | PC: 1 | ||||||
| 5 | January | No | 97.58 | 3.35 | 97.19 | 3.24 | 36.48 | 14.67 |
| PC: 1, 2, 3, 4, 5, 6, 7 | PC: 1, 2, 4 | PC: 1 | ||||||
| 6 | February | No | 91.32 | 3.33 | 86.33 | 3.74 | 74.79 | 4.84 |
| PC: 1, 2, 3, 4, 5, 6, 7 | PC: 1, 2, 3 | PC: 1 | ||||||
| 7 | March | No | 91.99 | 1.33 | 90.08 | 1.32 | 75.98 | 2.01 |
| PC: 1, 2, 3, 4, 5, 6, 7 | PC: 1, 3, 4 | PC: 1, 2 | ||||||
| Model | Month | TI | PCR Models |
|---|---|---|---|
| 1 | November | Yes | |
| 2 | January | Yes | |
| 3 | November | No | 1 |
| 4 | December | No | |
| 5 | January | No | |
| 6 | February | No | |
| 7 | March | No |
| Standard Error | ||||||||
|---|---|---|---|---|---|---|---|---|
| PC1 | PC2 | PC3 | PC4 | PC5 | PC6 | PC7 | ||
| With TI | November | 0.89 | 0.96 | - | 6.35 | - | 9.76 | - |
| January | 0.66 | 1.54 | 3.88 | - | - | - | 28.9 | |
| Without TI | November | - | 0.76 | 2.43 | 4.06 | 5.16 | - | - |
| December | 0.25 | 2.14 | 4.2 | - | - | - | - | |
| January | 0.1 | 1.28 | - | 2.99 | - | - | - | |
| February | 0.07 | 1.46 | 2.44 | - | - | - | - | |
| March | 0.02 | - | 0.53 | 1.27 | - | - | - | |
Disclaimer/Publisher’s Note: The statements, opinions and data contained in all publications are solely those of the individual author(s) and contributor(s) and not of MDPI and/or the editor(s). MDPI and/or the editor(s) disclaim responsibility for any injury to people or property resulting from any ideas, methods, instructions or products referred to in the content. |
© 2023 by the authors. Licensee MDPI, Basel, Switzerland. This article is an open access article distributed under the terms and conditions of the Creative Commons Attribution (CC BY) license (https://creativecommons.org/licenses/by/4.0/).
Share and Cite
Pasic, M.; Hadziahmetovic, H.; Ahmovic, I.; Pasic, M. Principal Component Regression Modeling and Analysis of PM10 and Meteorological Parameters in Sarajevo with and without Temperature Inversion. Sustainability 2023, 15, 11230. https://doi.org/10.3390/su151411230
Pasic M, Hadziahmetovic H, Ahmovic I, Pasic M. Principal Component Regression Modeling and Analysis of PM10 and Meteorological Parameters in Sarajevo with and without Temperature Inversion. Sustainability. 2023; 15(14):11230. https://doi.org/10.3390/su151411230
Chicago/Turabian StylePasic, Mirza, Halima Hadziahmetovic, Ismira Ahmovic, and Mugdim Pasic. 2023. "Principal Component Regression Modeling and Analysis of PM10 and Meteorological Parameters in Sarajevo with and without Temperature Inversion" Sustainability 15, no. 14: 11230. https://doi.org/10.3390/su151411230
APA StylePasic, M., Hadziahmetovic, H., Ahmovic, I., & Pasic, M. (2023). Principal Component Regression Modeling and Analysis of PM10 and Meteorological Parameters in Sarajevo with and without Temperature Inversion. Sustainability, 15(14), 11230. https://doi.org/10.3390/su151411230


