Article

Assessment of the Effect of Different Loading Combinations Due to Truck Platooning and Autonomous Vehicles on the Performance of Asphalt Pavement

1
Faculty of Engineering, Department of Civil and Environmental Engineering, Beirut Arab University, Beirut 1105, Lebanon
2
Faculty of Engineering, Department of Civil Engineering, Alexandria University, Alexandria 21544, Egypt
*
Author to whom correspondence should be addressed.
Sustainability 2023, 15(14), 10805; https://doi.org/10.3390/su151410805
Submission received: 7 June 2023 / Revised: 25 June 2023 / Accepted: 3 July 2023 / Published: 10 July 2023

Abstract

:
Autonomous vehicles and truck platooning have become the future in the transportation field. This new strategy has many benefits because it lowers fuel consumption and CO2 emissions, improves safety, optimizes transport by using roads more effectively, and reduces traffic congestion. In this research, the effect of the controlled positioning of autonomous and non-autonomous truck loadings on the long-term performance of pavement was estimated using different variables such as climate, uniform wandering values of distance between trucks, and percentage of autonomous trucks by using MEPDG/AASHTOWare Pavement ME Design software. This was achieved by first computing the strain and stress of the different loading combinations, resulting in the computation of the failures in the pavement infrastructure and the pavement thickness needed to support each combination. The second part of the research consisted of designing a platoon strategy that was developed for a series of autonomous and connected trucks such that the lateral position of the trucks and the spacing between them could be explicitly optimized to minimize flexible pavement damage. The findings revealed that a small percentage of autonomous trucks can be beneficial to pavement life and that truck platooning following a well-studied skeleton can open a whole new world of pavement design. This can be revolutionary in changing roads around the world to improve traffic and infrastructure.

1. Introduction

Technology in the transportation sector has taken significant steps forward in the last decade, especially in the vehicle field [1]. One of the revolutionary advances is autonomous trucks, which are trucks that drive by themselves partially or completely [2]. Autonomous trucks analyze millions of possible roadway scenarios and then take appropriate action using a combination of LIDAR, GPS, radar, optical cameras, and high-speed processing power. LIDAR, or light detection and ranging, is similar to sonar but uses light instead of sound to identify surroundings, such as lane markings, road edges, and objects in the roadway. In addition, autonomous vehicles use optical cameras, just as a human driver would, to spot other cars, traffic signs and signals, pedestrians, cyclists, and all the other things that find their way onto or near the road. To reach its destination, an autonomous vehicle needs to know where it is. GPS and other equipment such as altimeters and gyroscopes provide the car with the information it needs to understand its position in the world. Furthermore, the brain of the autonomous vehicle is a processor. To analyze millions of possible scenarios and outcomes of even the simplest roadway interaction, an autonomous vehicle needs robust computing capabilities. Finally, radar helps an autonomous vehicle with situational awareness by making sense of the position of the other cars and the direction they are heading [3]. To improve object recognition and tracking outcomes, high-definition maps comprising point clouds and vector maps are constructed and sent to a world model, which filters out the items off the road and extracts the Frenet coordinates of the objects, as well as the lane information [4]. Automotive stability and guidance control functionality play a significant role in the development of reliable active safety and automated driving systems to improve passenger safety and system reliability in intelligent transportation settings [5]. Another approach is called HYDRO-3D. This approach seeks to increase the object-recognition performance by directly using past object tracking information [6]. The general concept of autonomous trucks is the replacement of some or all of the human factors in the driving process. The ultimate goal of autonomous vehicle technology is to make the vehicle so intelligent that it does not require any driver input. However, truly autonomous trucks, in which the driver relinquishes complete control of the vehicle, are still on the horizon. They have received a considerable amount of attention and have presented ways to improve safety and minimize pollution [7].
Autonomous trucks are most beneficial for truck platooning [8]. In general, truck platooning is when two or more trucks are linked in line with the help of connectivity technology and autonomous truck technology [9]. These trucks maintain a close distance between them, which is usually much shorter than the normal safe distance between two normal trucks. Truck platooning technology, which employs a human-driven lead truck that is subsequently linked to two or more trucks, is likely to be the most extensively deployed autonomous technology.
Despite all the studies conducted on autonomous trucks, there is a detail that has not yet received enough attention: the effect of this technology on infrastructure. There are many types of structures subjected to moving loads, such as pavement structures [10]. Pavement represents a very important part of the transportation field as the most used mode of transportation on Earth [11]. The main focus is on trucks, mainly because they weigh much more than regular cars and, as a consequence, affect the pavement and infrastructure the most, which means that any improvement that can benefit the infrastructure of the roadway must occur in the trucking sector.
Researchers have noticed that trucks tend to move closer to the edge of the lane, resulting in the whole travel path not being fully used [12]. Therefore, most pavements are designed and constructed based on a disproportional number of trucks that occupy a small part of the entire pavement. The use of autonomous trucks may give rise to tighter and smaller usage of a lane, which means faster pavement damage [13]. However, with good control of the positioning of the vehicle, autonomous trucking can offer wider usage of the paced surface, leading to an economical and extended pavement life.
Another issue that affects infrastructure and pavement design is truck platooning. It was found that positioning trucks as one following the other significantly decreased their fuel use [14]. However, such platooning can have consequences on pavement infrastructures, considering that it can lead to congestion and slow down the self-healing properties of asphalt materials.
To use the road further, a uniform dispersion covering the entire extent of the road should be adopted, which will enhance efficiency and/or decrease the necessary pavement depth. A truck-platooning strategy was studied using the distance between two consecutive vehicles of 3 to 10 m; this was achieved successfully considering that the safety distance between trucks driven by human drivers is between 60 and 90 m [15]. Consequently, the reduction in the spacing between successive vehicles reduces the time between two consecutive trucks on the road [16]. This reduction in time is defined as the resting period. As asphalt concrete is characterized by various self-healing behaviors at the macro- and meso-levels, some micro-cracks can be healed during the passing of two consecutive trucks. Thus, decreasing the resting period in truck platooning may negatively affect the self-healing capabilities of asphalt concrete by increasing the damage accumulation within the pavement, crack propagation, and pavement failure.
The advantages of the evolution of the autonomous truck and truck platooning field lie in the reduction in emissions as trucks drive close to each other, significantly reducing air-drag friction. Additionally, claims have been made regarding its influence on safety because trucks trailing behind the head of the platoon only need one-fifth of the time a human driver would need to brake, which also has a positive impact on the environment [17]. Furthermore, truck platooning has an influence on traffic flow because it decreases traffic congestion, increases the capacity of highways, and enhances the accessibility of transport.
In their study, Noorvand et al. [1] simulated the performance of pavements under multiple combinations of autonomous and non-autonomous trucks. They suggested different scenarios for the different combinations. In their research, Mechanistic-Empirical Pavement Design Guide (MEPDG) software was used considering a hot, dry, and no-freeze climate. One traffic level was taken into account, considering the annual average daily truck traffic AADTT to be 2400 trucks/day. The MEPDG software cannot explicitly consider a uniform loading distribution. As a result, the author’s approach was to take into account this specific trait using MEPDG variables. This procedure entails changing the original entry of traffic data using a parameter that accounts for the on-average equivalence of a truck situated as per a uniform distribution depending on one placed following a normal distribution. Equivalency factors (EF) are commonly used in pavement design and analysis to facilitate performance computation [18].
Gungor et al. [19] expected that lining autonomous trucks in a perfectly straight manner close to one another would reduce the consumption of fuel because of the decreased aerodynamic drag. This strategy will decrease the service life of the pavement and accelerate damage accumulation and propagation. The authors came up with a strategy to design a platoon consisting of several autonomous trucks in such a way that the lateral position of each truck and the distance between each truck are optimized in an explicit manner to reduce damage accumulation while reducing the consumption of fuel. As a result, the authors developed an optimization equation that takes into account several inputs like wandering, spacing, climate, traffic levels, lane width, and type of trucks. This proposed approach was tested on a pavement case study, and it was found that the total costs can decrease by 9% and ensure longer pavement service life [20].
Several researchers studied the benefits of autonomous trucks in several aspects, but only a few of them took into account the effect of these trucks on infrastructure. In this study, experiments were conducted using the AASHTOWare ME Design software to study the effect of multiple scenarios on a given road at three different traffic levels: low traffic, mid traffic, and high traffic. In each case, the level of fatigue and rutting that the pavement will suffer during its design life was determined. After determining which scenario of autonomous and non-autonomous vehicle combination is best for the road infrastructure in all traffic cases, a specific design was computed for the given road for that combination.

2. Scope and Objective

The main objective of this research was to simulate asphalt pavement performance in terms of fatigue cracking and permanent deformation with different combinations of autonomous and non-autonomous trucks under different traffic levels. The simulation was conducted using different variables: the percentage of autonomous trucks on the roadway, variability of the resting period, wandering, and different traffic levels. The scope of this research consisted of using a layered elastic model included in the MEPDG software to predict the induced stresses and strains. The performance of each pavement was then evaluated and the pavement thickness needed to support the different combinations was determined. Finally, recommendations regarding the most beneficial scenario for incorporating autonomous trucks into a platoon were suggested accordingly. The results are based on the service life of the pavement. An optimized platoon was created based on this optimization strategy. Experiments were conducted using the AASHTOWare ME Design software to study the effect of multiple scenarios on a given road under three different traffic levels: low, mid, and high traffic.
Figure 1 presents the steps of this study in detail.

3. Methodology and Data

3.1. Software Used

The approach chosen in this research includes mimicking pavement performance with various combinations of autonomous and non-autonomous vehicles and then comparing the damage during the service life of the pavement. The software used in this study is AASHTOWare Pavement ME Design (mechanistic-empirical) to analyze and minimize the generation of distress in asphalt pavement from autonomous truck loading. This is achieved by using the multilayer elastic theory, which is applied by using the load equivalency factor for various patterns of load and traffic distributions [21,22,23].

3.2. Climate and Material Properties

The location chosen for the testing was the state of Illinois, more precisely Chicago. Since all previous studies were conducted in hotter weather [1], the work conducted in this study was performed in a colder one. All climate data were taken from the AASHTOWare Pavement ME Design website.
Typical asphalt and base thicknesses and typical subgrade materials were used as material inputs. Table 1 summarizes all the material properties for all the layers of the pavement, which the analysis is based on [20]. Additionally, the different design structures supported in this study are displayed in Table 2.
To avoid rutting, the AC should be very stiff at high temperatures and soft at moderate temperatures [24,25]. The higher the level of distress, the lower the value of the pavement and the greater the waste due to premature maintenance and/or rehabilitation [24]. On the other hand, over-designing the pavement so that no distresses occur during its service life results in waste due to the excessive use of natural resources (aggregates and bitumen). The ideal lean pavement displays acceptable performance during its service life while consuming only the necessary resources.
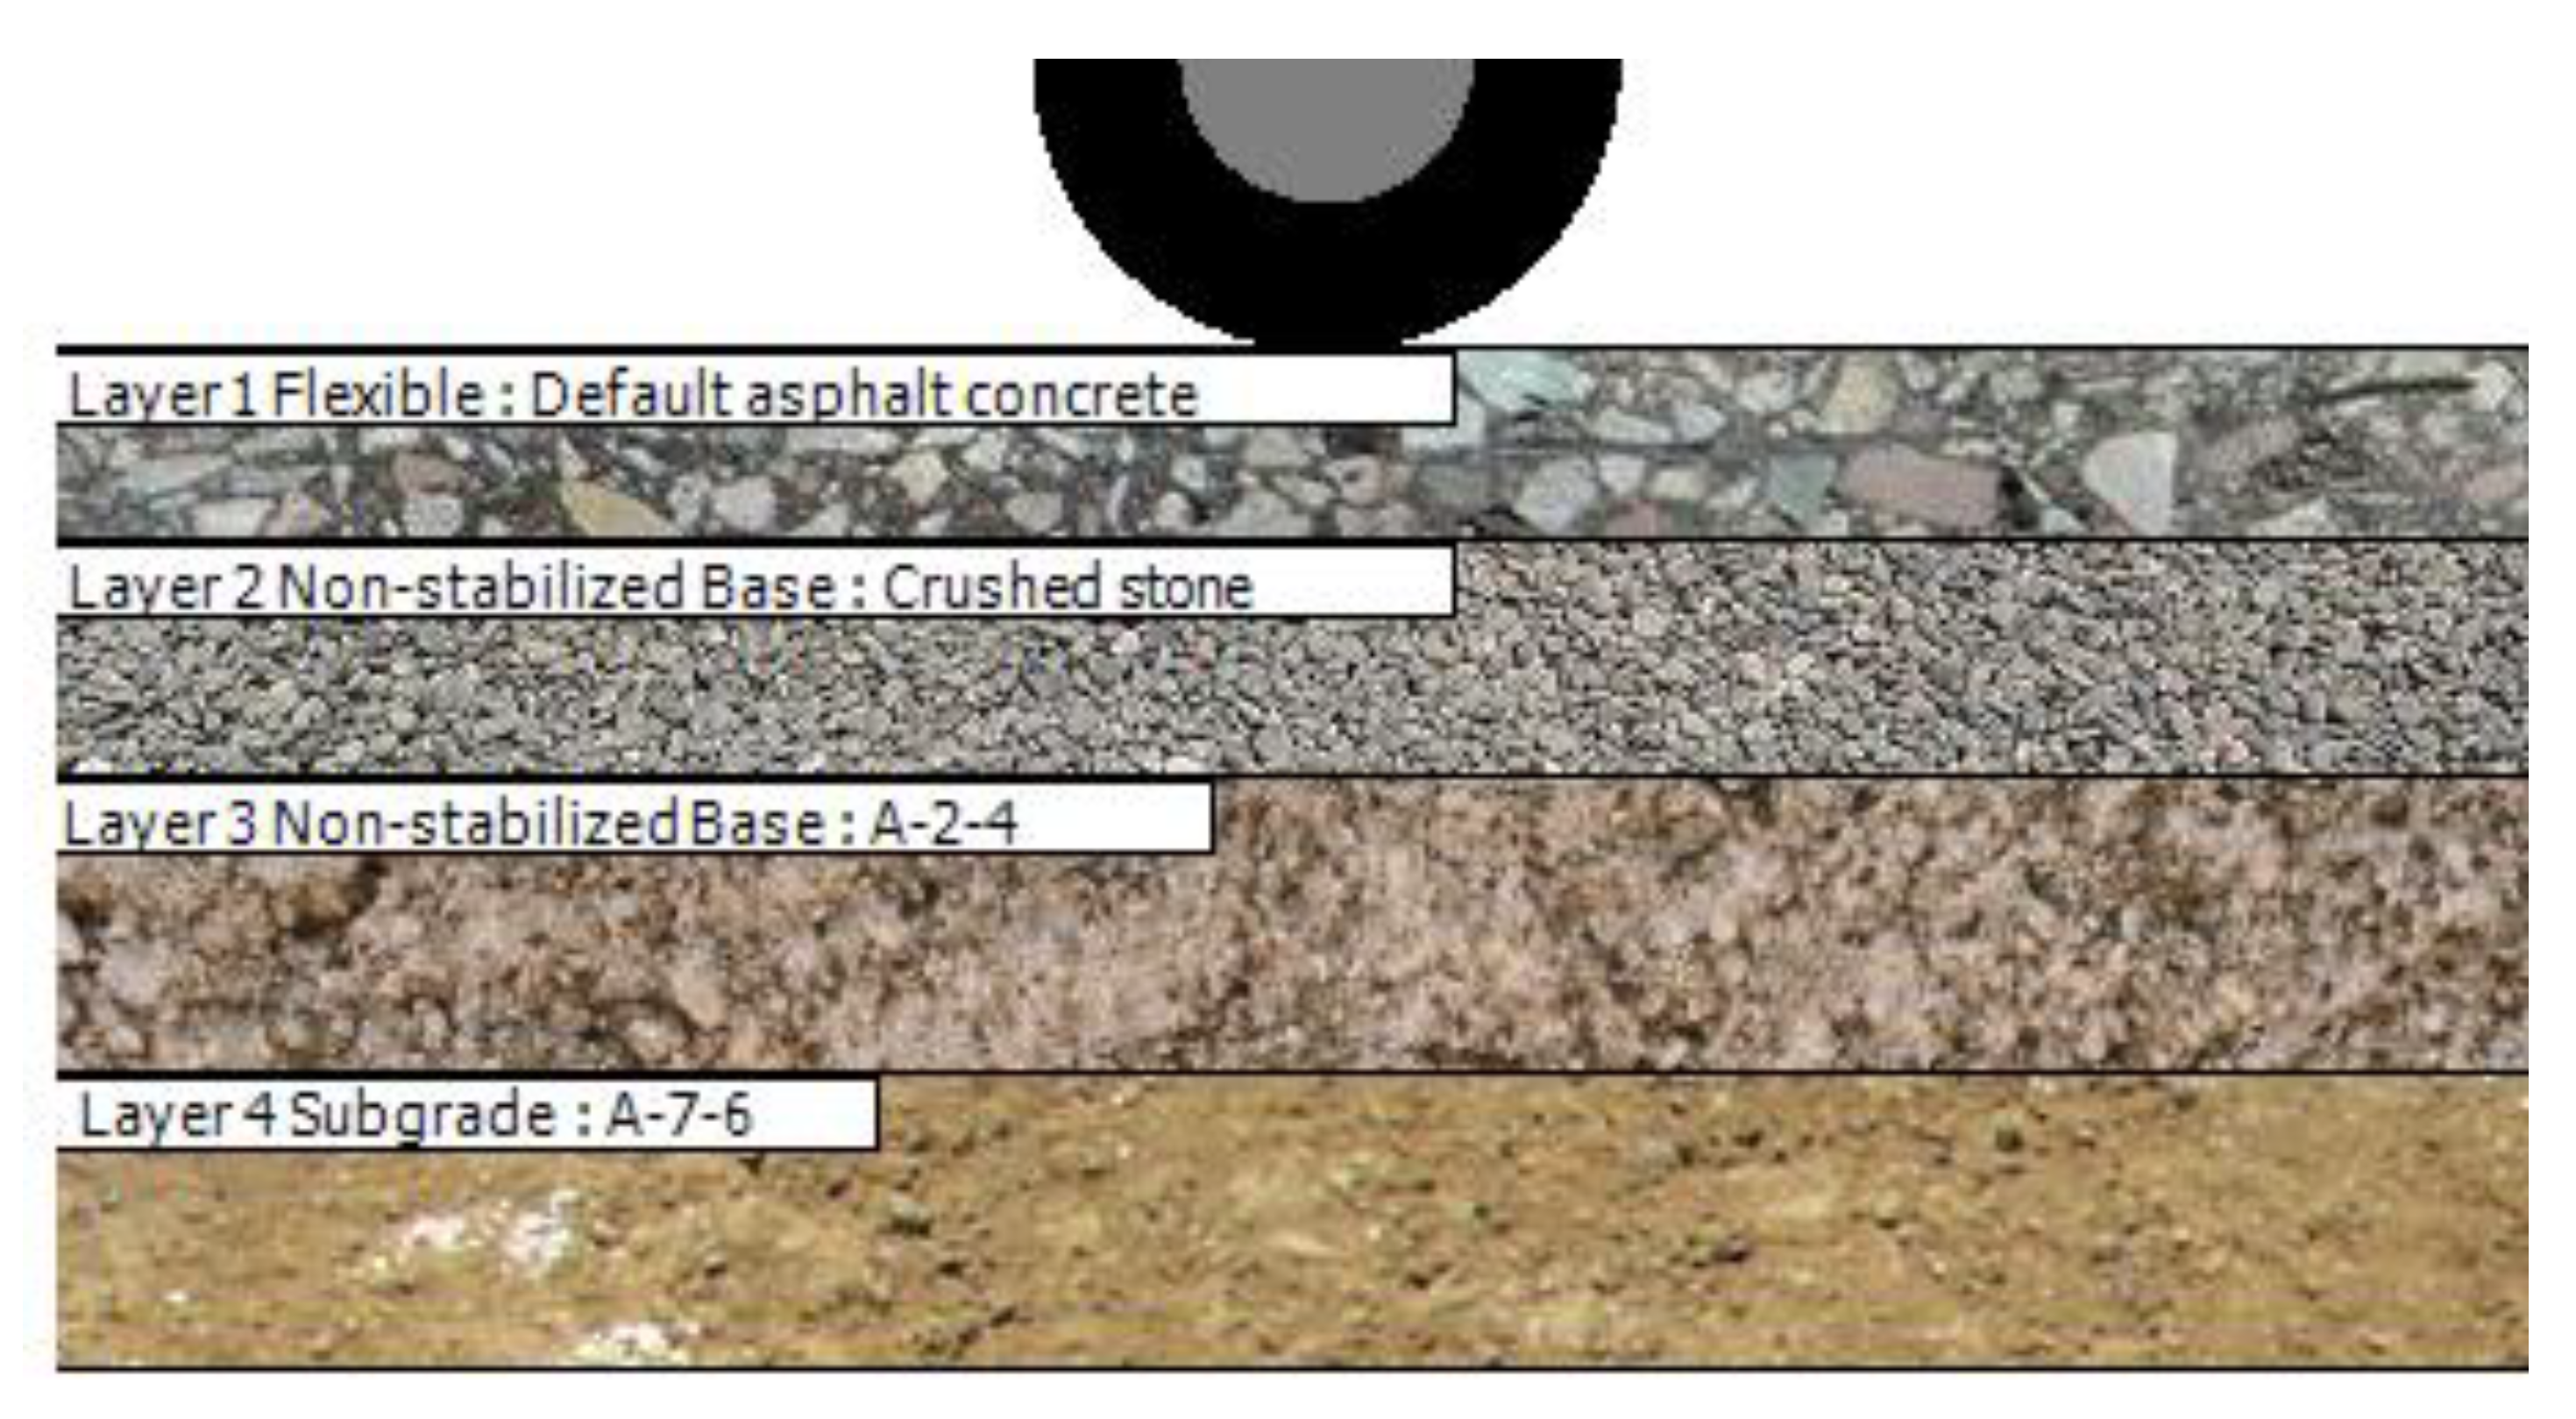
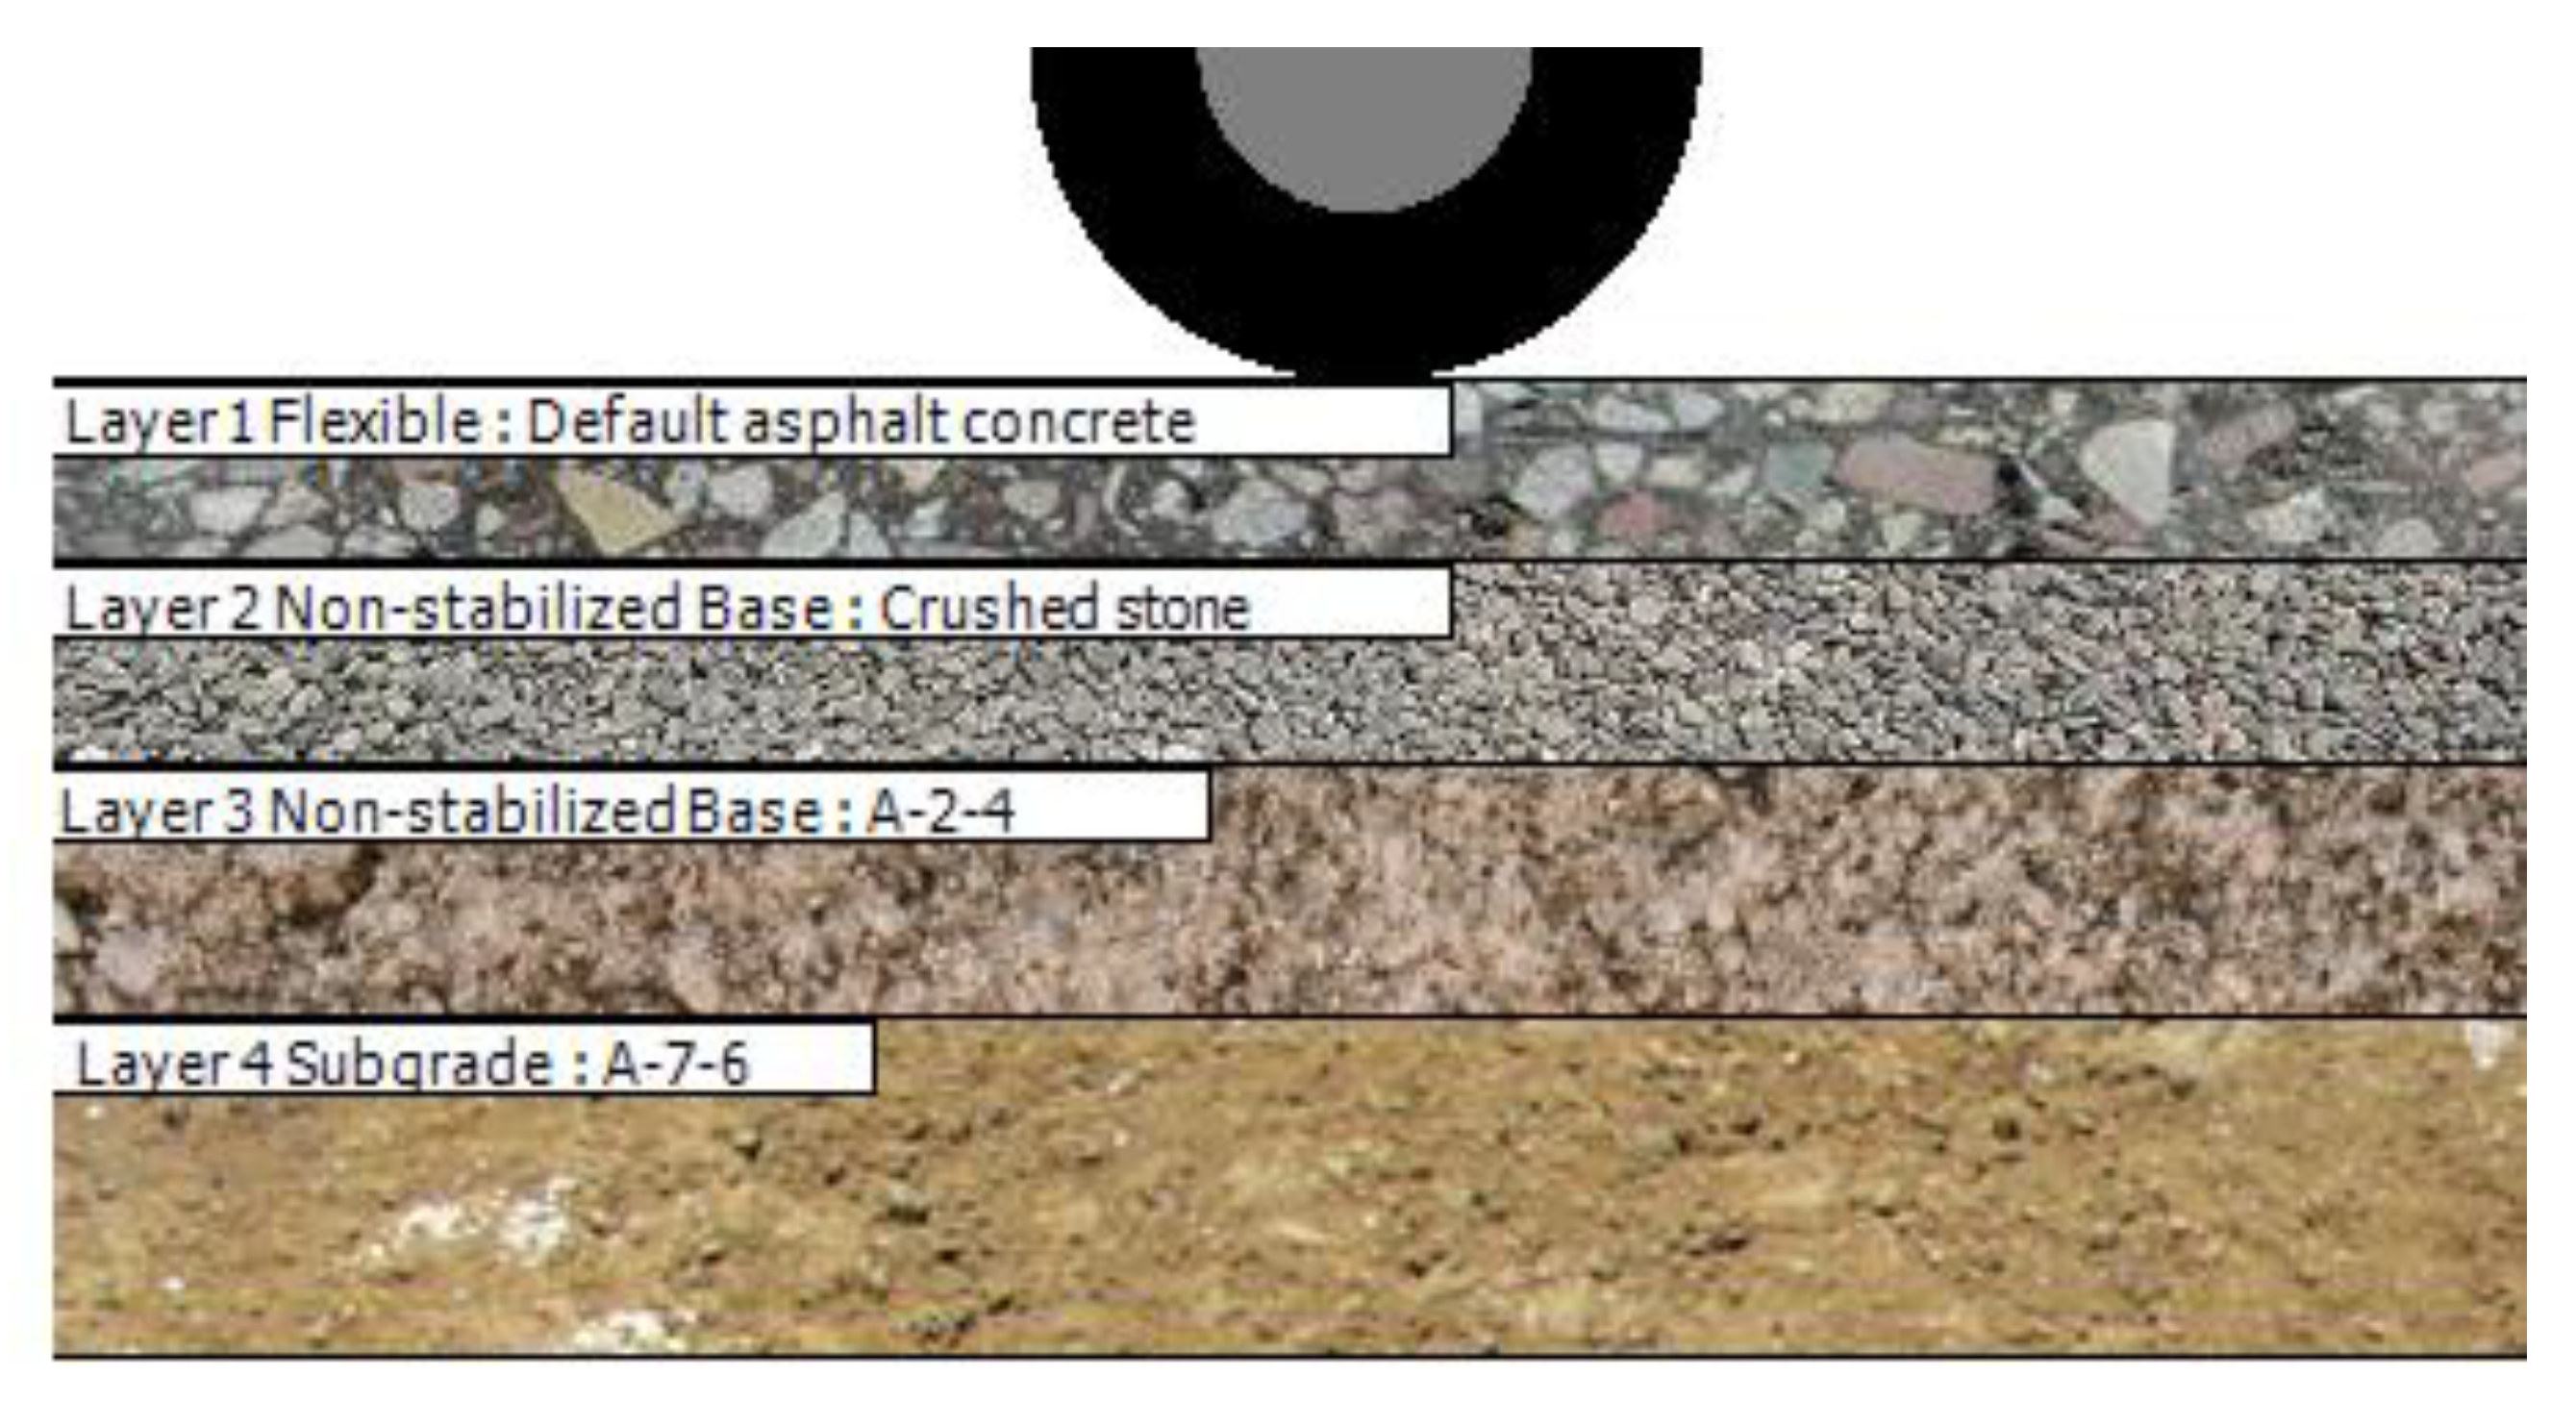
Figure 2 shows the pavement section chosen from Table 2. The pavement consists of 4 layers: the asphalt layer with a thickness of 6.5 inches, the first base layer made of crushed stone with a thickness of 8 inches, and the second base layer A-2-4, which is silty soil, with a thickness of 10 inches. The sub-base layer is made of silty clay. The percentage distribution of vehicle classes in the traffic is shown in Table 3.

3.3. Types of Traffic

Three different levels of traffic are used in this research to study the performance of the infrastructure: low, mid, and high traffic levels. The low traffic level is considered as 500 trucks/day, mid-level traffic as 1000 trucks/day, and high traffic as 2000 trucks/day.

3.4. Percentage of Autonomous Trucks

To test how autonomous trucks should be incorporated with non-autonomous trucks, the percentage of autonomous trucks should be determined. For this purpose, different scenarios for autonomous trucks (AT) and non-autonomous trucks (NAT) are created, as presented in Table 4.
Several scenarios were studied to determine the effectiveness of the autonomous trucks for the pavement’s benefit. It should be noted that a system with 100% autonomous trucks is not expected to exist and work anytime in the future [1]. What is possible is that both autonomous and non-autonomous trucks will occur at the same time and in different combinations.

3.5. Vehicle Positioning

To understand how autonomous trucks may influence the infrastructure, one should initially recognize how the pavement is affected by vehicle positioning [1]. On any roadway, vehicles are spread directionally at first, and then by lane. The truck volume used for the design or examination depends on each of these distributions, as shown in Equation (1) [1].
A A D T T D e s i g n = A A D T T i n p u t × D D × L D
where:
AADTTinput: average annual daily truck traffic (two-way);
AADTTdesign: the value of average annual daily truck traffic used in pavement design lane;
DD: directional distribution of trucks (taken as 50–60%);
LD: lane distribution of trucks.
In this research, it is assumed that the roadway consists of three lanes in each direction. Table 5 shows the design lane distribution (LD) of autonomous and non-autonomous trucks for each scenario.

3.6. Wander

A wheel wander is defined as the “uncertainty of the lateral position of wheel loads on a lane” [26,27]. In other words, wandering occurs when the vehicles position themselves in a lane at distinct transverse locations. Generally, it is a fact that “the edge of a truck tire is approximately 37.5 cm from the lane markings and that trucks are distributed normally with a standard deviation of 25 cm” [11,26]. A uniform distribution using the whole pavement width will permit a more even lane use, resulting in enhanced performance and lowered pavement thickness. A comparison between the normal distribution and uniform distribution of wander in terms of the number of vehicles at any specific point across the lane width is conducted [1]. A normal distribution is considered a continuous, equivalent discrete distribution consisting of five locations. The procedure adopted in this research, by which the wander was quantified, is thoroughly described in NCHRP Report 1–37A.
The area under the normal distribution curve is divided into five quintiles. Every quintile depicts the position where 20% of the total number of trucks will pass, with deviation values of 0, ±0.5244, and ±1.28155. For every specific position, an x-coordinate is built, which is the product resulting from the multiplication of the standard normal deviate (Z) and the standard deviation known as wander. As a result, the strains at the critical location can be determined from the strain distribution.
Although this shows the procedure for a wander that follows a normal distribution, a similar procedure is used for uniform distributions with a single difference of evenly spaced coordinates in five intervals across the range of the assessed locations. Considering the lane width and axle width of truck tires to be 430 cm and 260 cm, respectively, it is possible that the wheel path of autonomous trucks uses the remaining width (170 cm) of the pavement evenly.

3.7. Accounting for the Autonomous Trucks

The AASHTOWare software cannot automatically take into account the different loading distributions. This is the reason behind altering the actual input traffic values in this study using a factor called the equivalency factor (EF), which considers the on-average equivalency of a truck allocated based on a uniform distribution relative to a truck situated based on a normal distribution [1]. EF is commonly used in pavement design and analysis to simplify the calculation of performance [18], as shown in Equations (2)–(7) [1]. In these cases, the main idea of the EF is to determine the number of repetitions to failure (Nf) of some loading configurations to a reference case, as shown in Equation (2).
E F = N f r e f e r e n c e c a s e N f c a s e o f i n t e r e s t
Equation (3) presents how the EF is used to determine the adjusted traffic volume (AADTTInput Adjusted). It is assumed that EF connects the number of passes of a vehicle with a uniform or zero wander travel distribution (AT) to the number of passes of a vehicle whose wander follows a normal distribution (NAT):
A A D T T I n p u t A d j u s t e d = A A D T T I n p u t × E F
Equation (3) is used for Scenario a.
For Scenario b, Equations (4) and (5) are used.
A A D T T I n p u t A d j u s t e d S 2 = A A D T T I n p u t A d j u s t e d N A T S 2 + A A D T T I n p u t A d j u s t e d A T S 2
A A D T T I n p u t A d j u s t e d A T S 2 = L D A T L D N A T × A A D T T I n p u t × P A T × E F
For Scenario c, Equations (6) and (7) are used.
A A D T T I n p u t A d j u s t e d A T S 3 = A A D T T I n p u t × P A T × E F
A A D T T I n p u t A d j u s t e d N A T S 3 = A A D T T I n p u t × P N A T
From the existing literature review, EF was already computed for such cases, and it has been proven that for the uniform distribution, EFfatigue = 0.81 and EFrutting = 0.65 [1].
Therefore, Table 6 shows the different inputs of the AADTT adjusted for the different scenarios for both types of failure: permanent deformation and fatigue cracking. A total of 27 different scenarios are used in this analysis.

4. Results and Discussion

4.1. Predicted Total Rutting

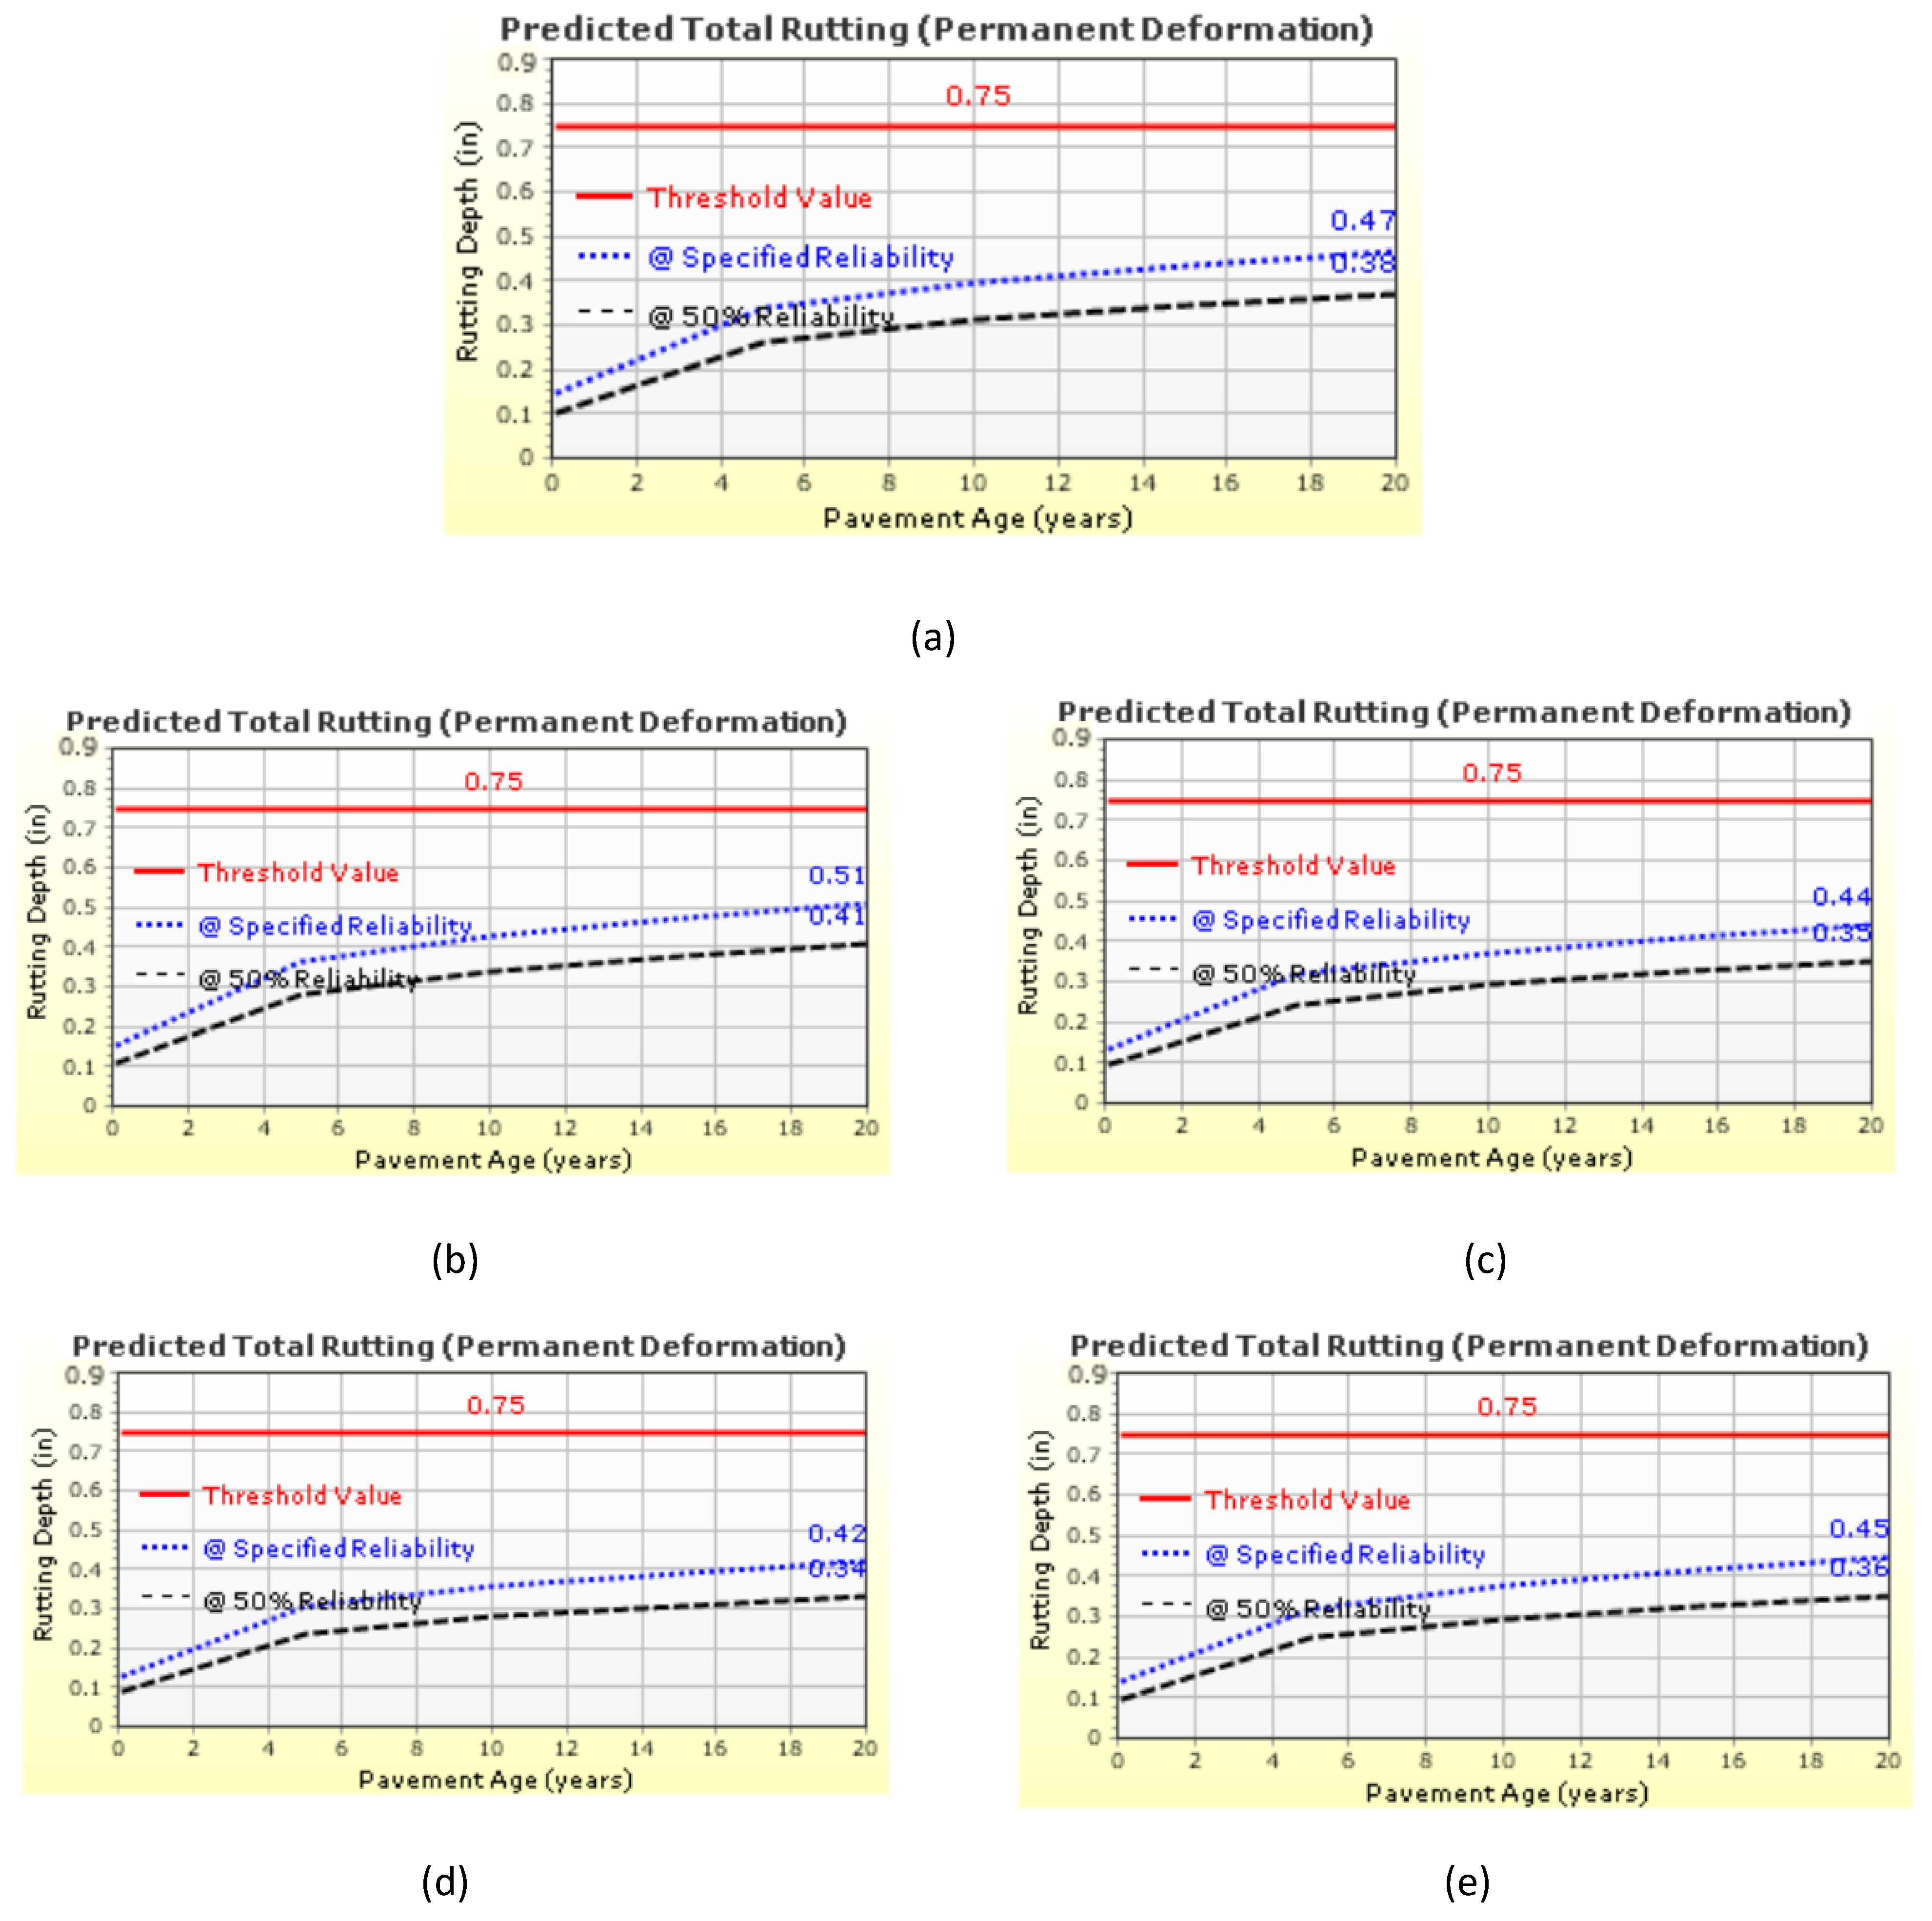
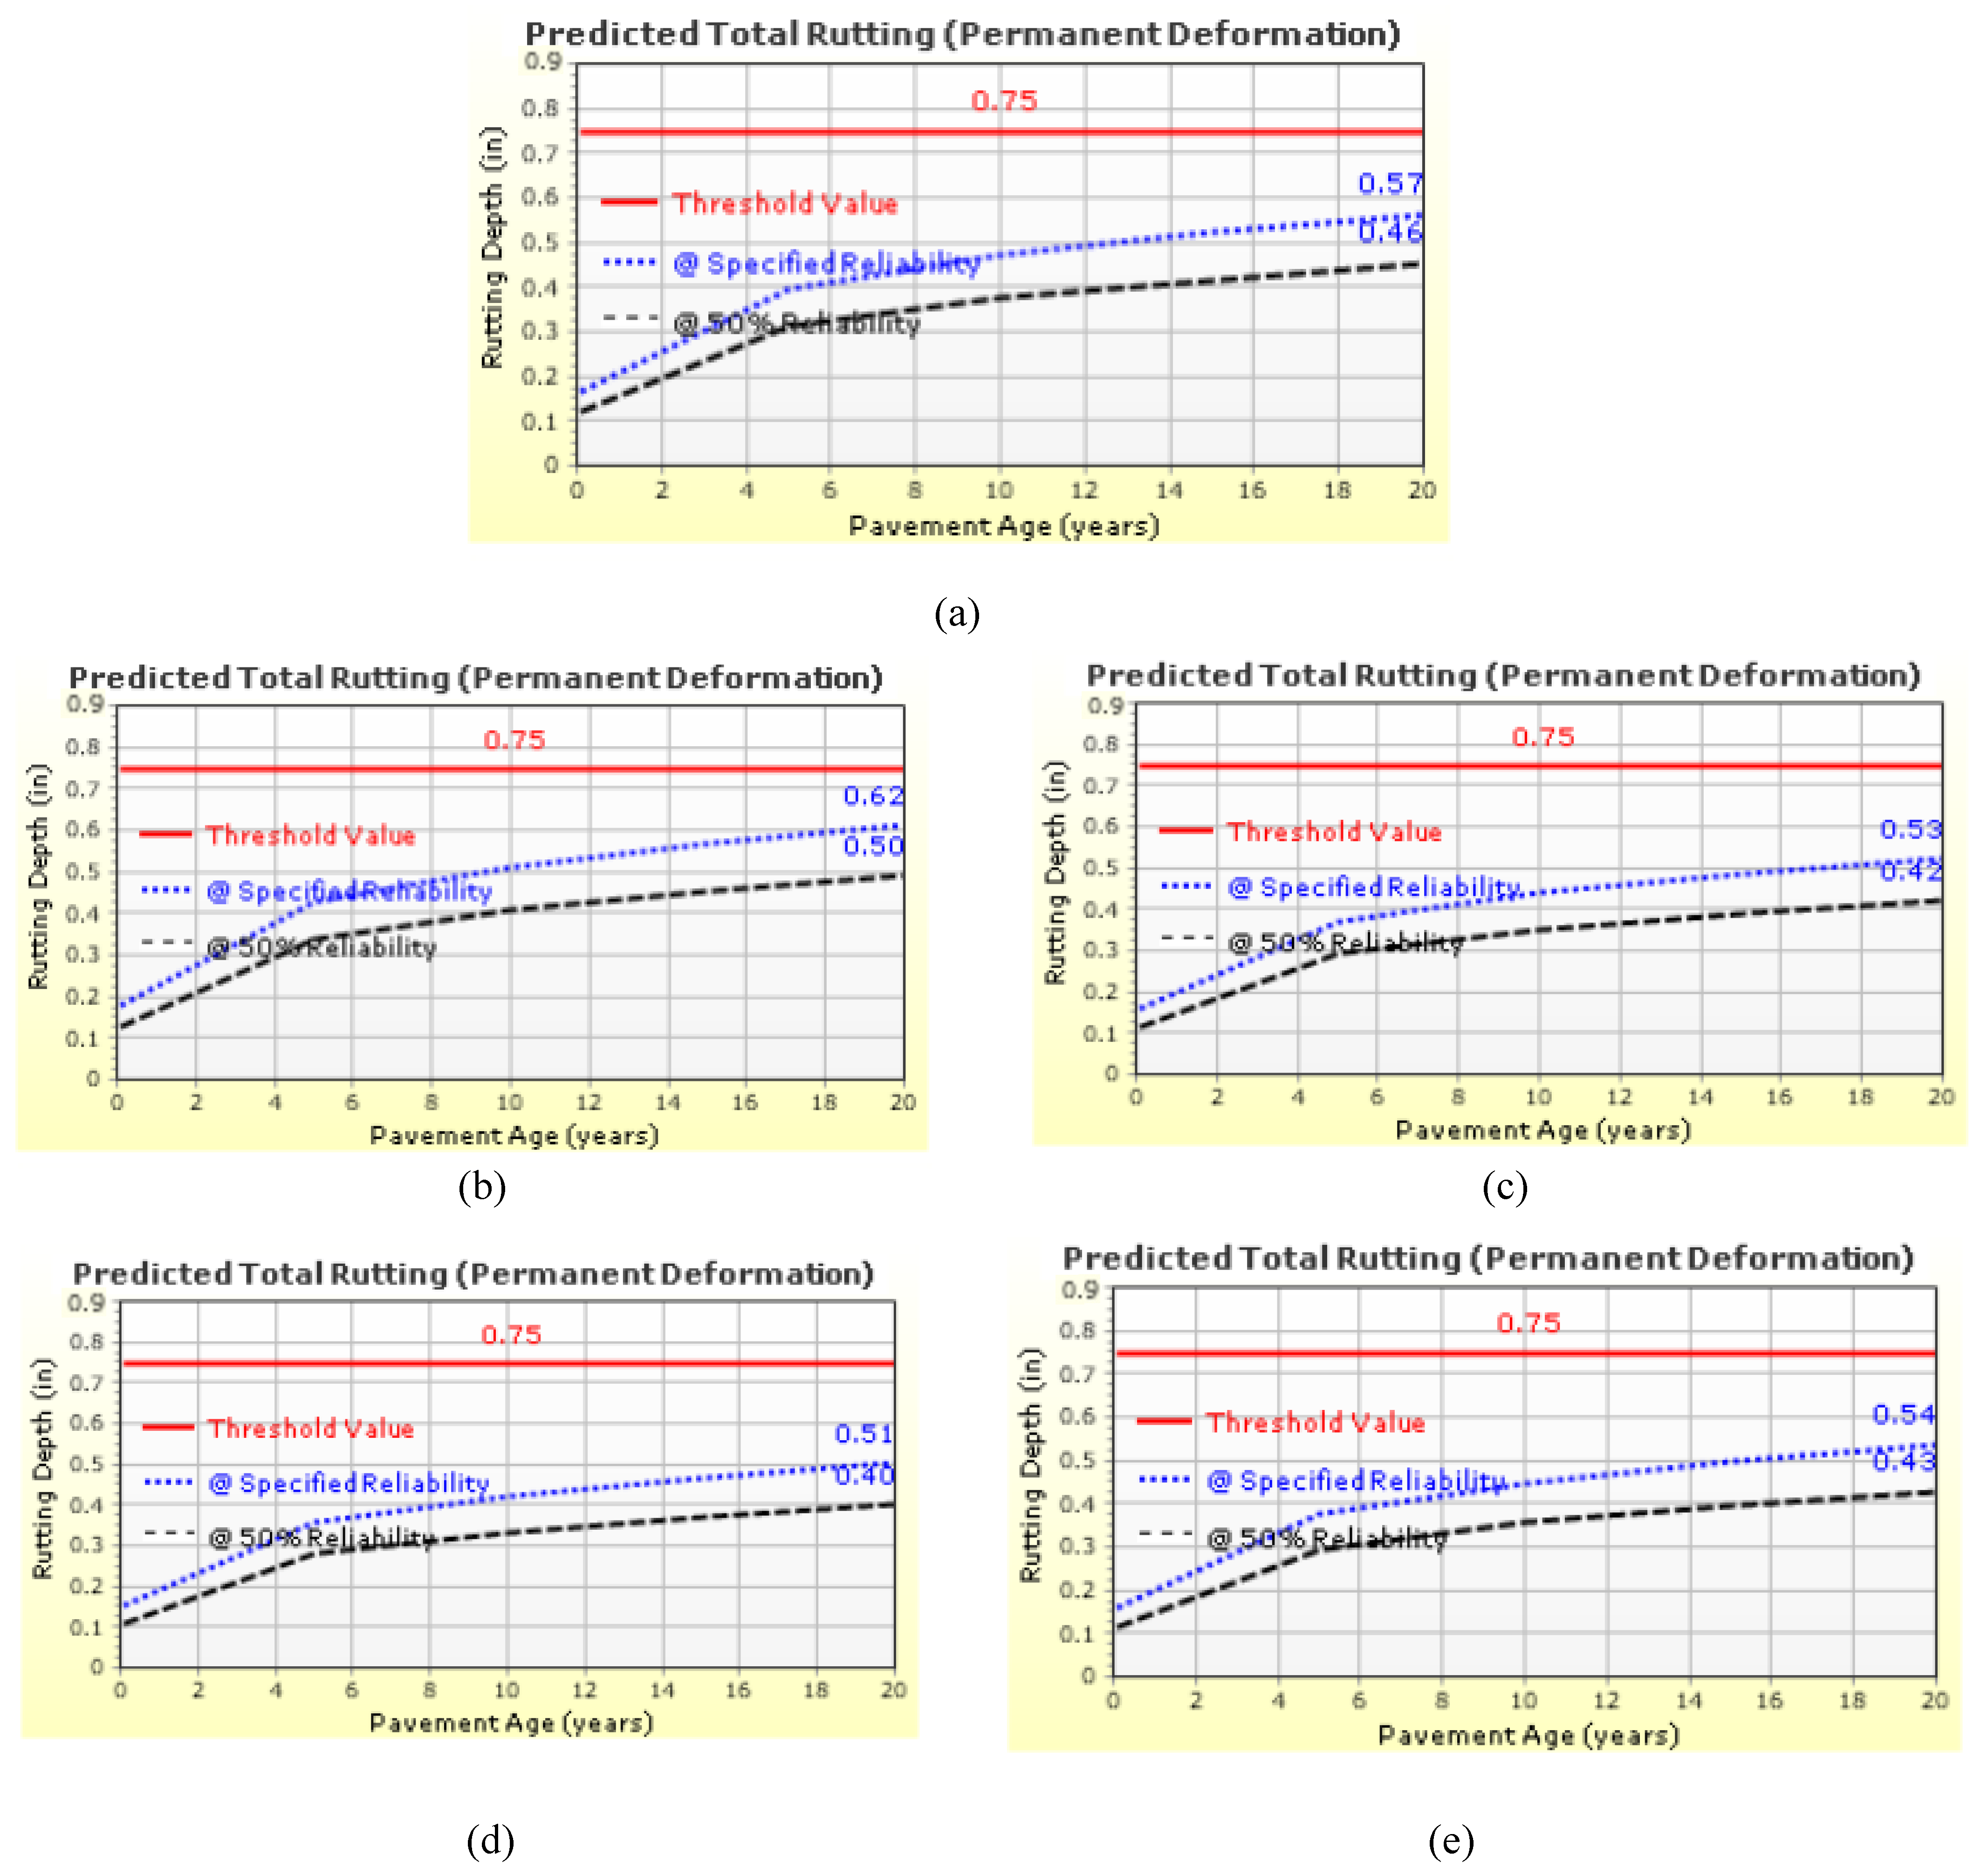
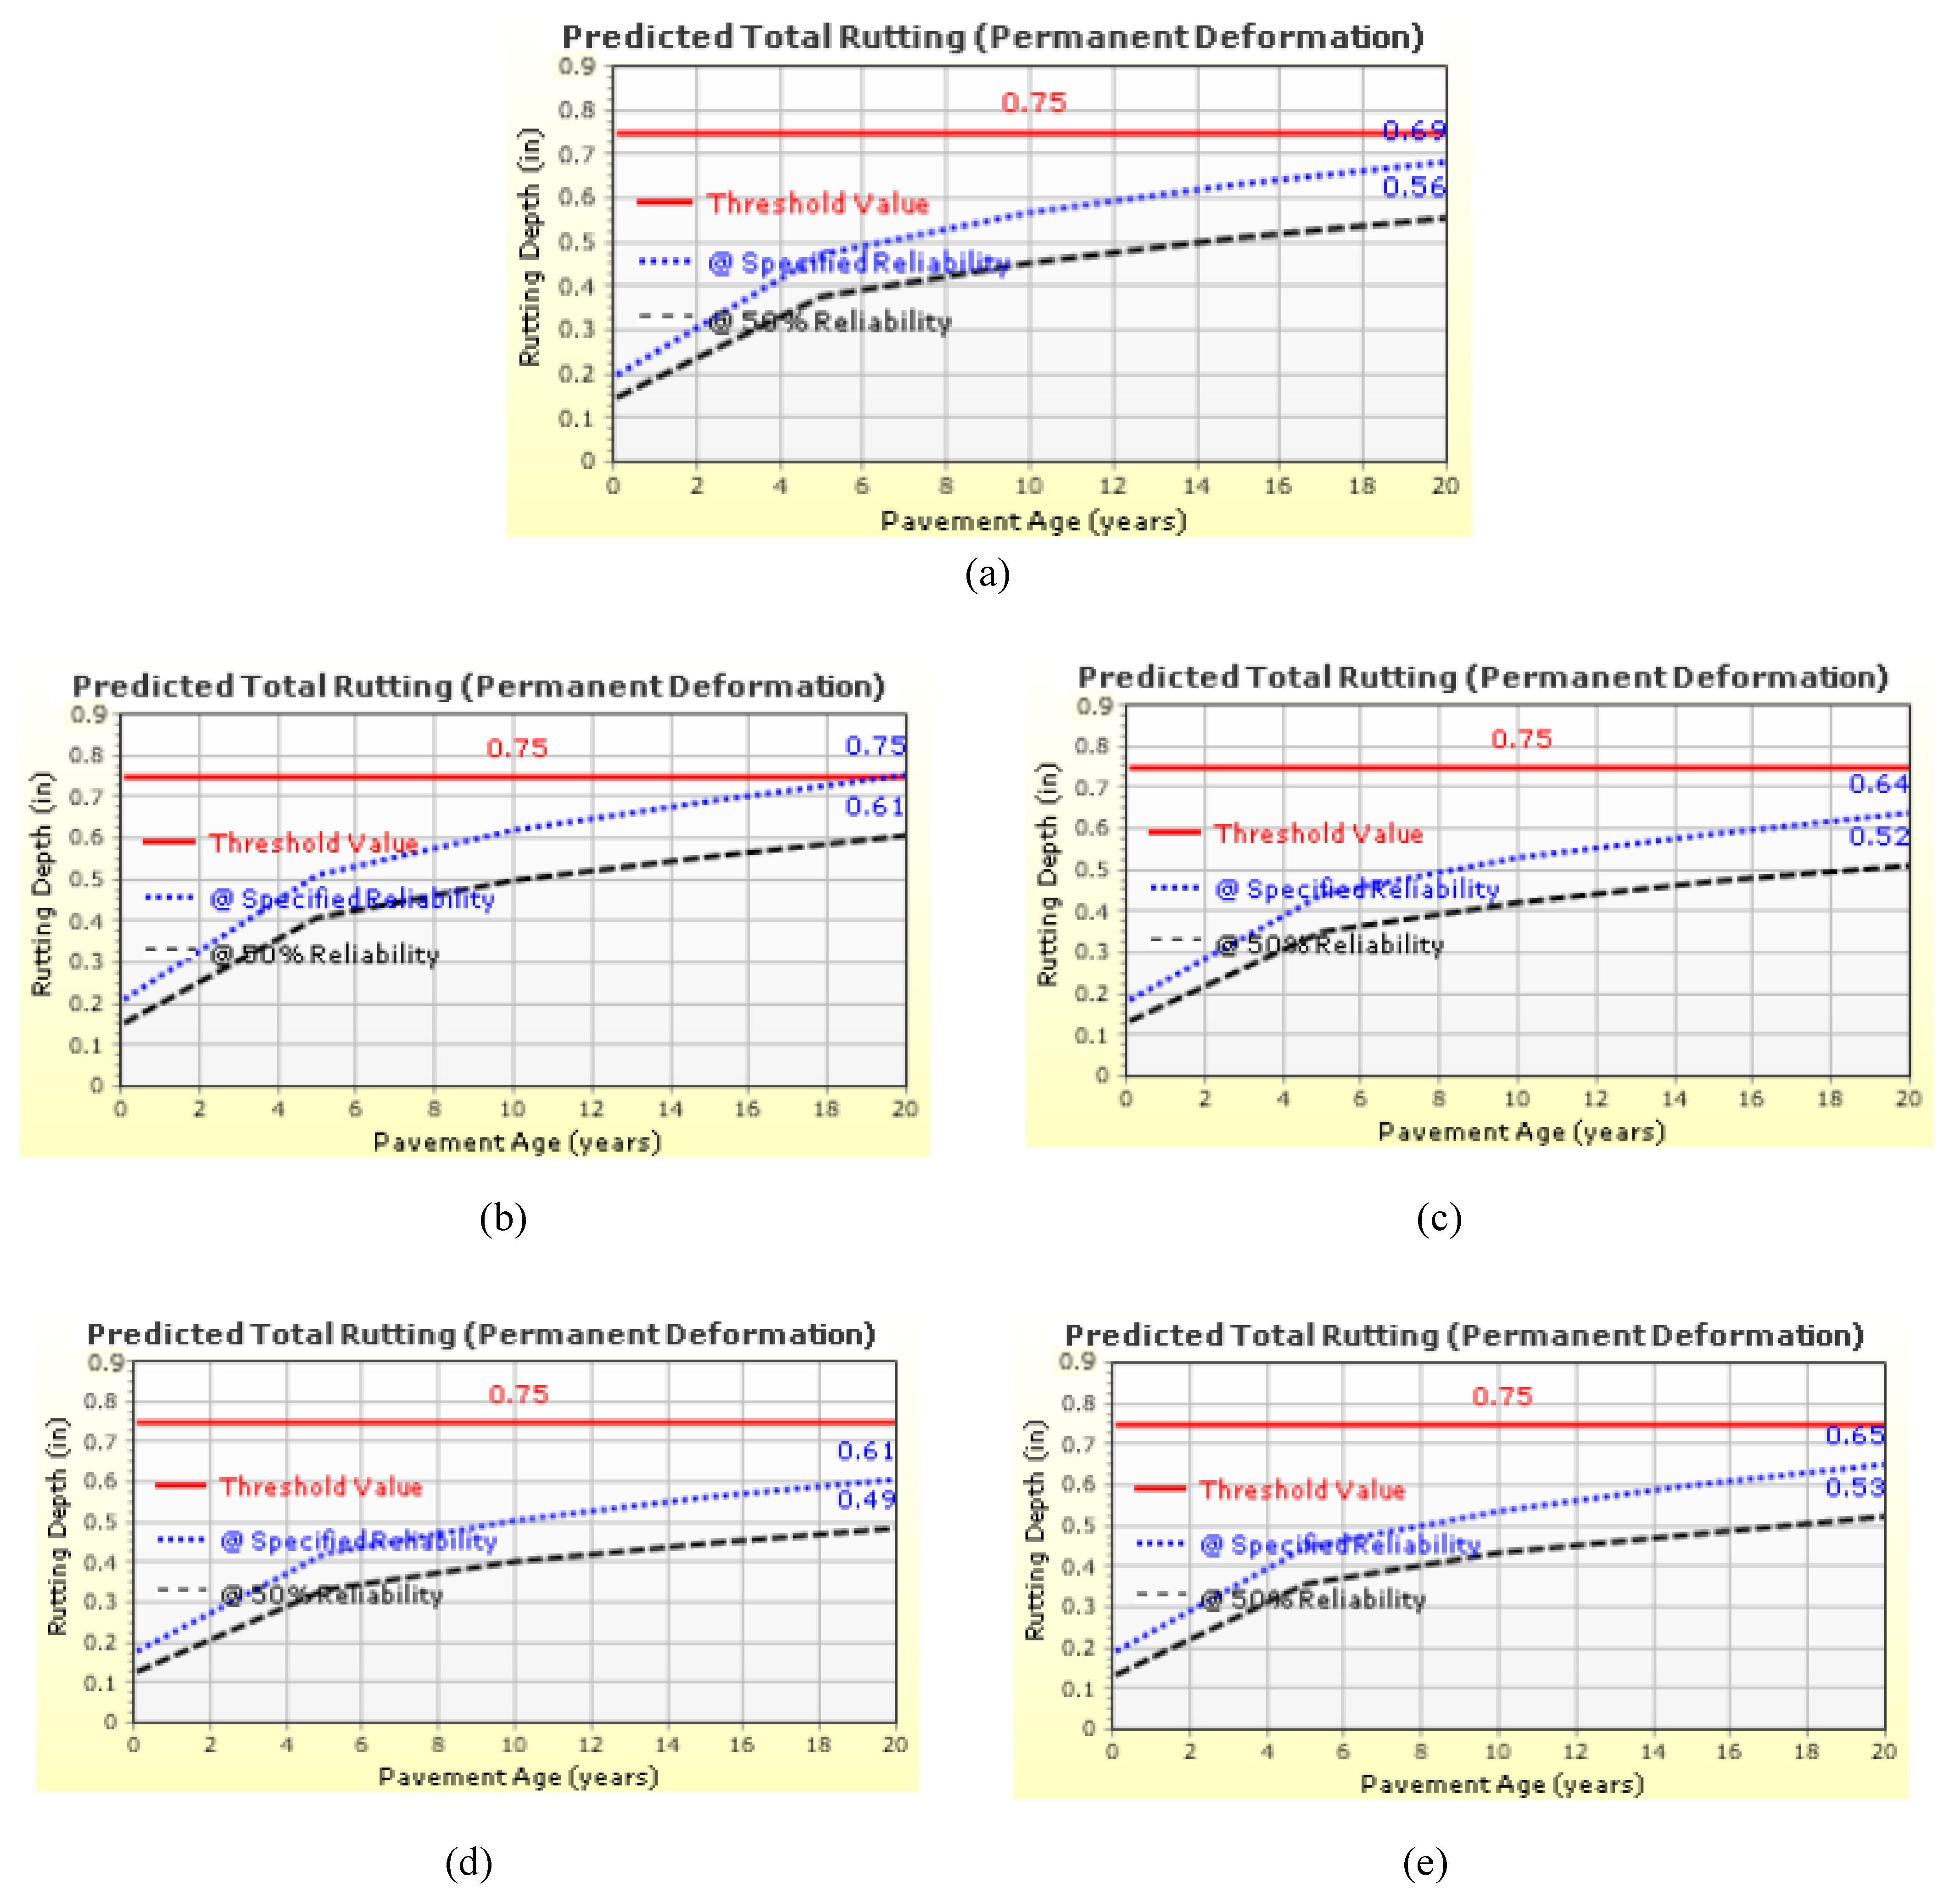
Using the different AADTT adjusted values, the software AASHTOW is used to analyze 27 different results. The comparison of the predicted total rutting (permanent deformation), predicted asphalt concrete (AC) bottom-up, and top-down fatigue cracking is analyzed. The comparative results of the total permanent deformation are shown in Figure 3a–e, Figure 4a–e, and Figure 5a–e, respectively.
For a low traffic of 500 trucks/day, the design passed the criteria for all the scenarios, as shown in Figure 3a–e. However, it is worth noting that the segregated scenario where the autonomous trucks occupy one lane showed the least rutting depth in the pavement after 20 years, with a total of 0.42 inches. On the other hand, the integrated scenario where the autonomous trucks disproportionately position themselves in one lane of the highway showed the most severe rutting depth of all the scenarios, with a total of 0.51 inches after 20 years. The same result was noticed for AADTT = 1000 trucks/day, as shown in Figure 4a–e. The highest predicted rutting depth occurs when the trucks are integrated, with the autonomous trucks disproportionally placing themselves in one lane, reaching 0.62 inches at the end of the pavement life, which still fits the criteria. As for the least predicted rutting depth, the segregated scenario where the autonomous trucks use one lane of the highway showed a rutting depth of 0.51 inches after 20 years. When AADTT = 2000 trucks/day, as shown in Figure 5a–e, not all scenarios passed the criteria. The integrated scenario with the autonomous trucks disproportionally placing themselves in one lane failed, with a rutting depth reaching the maximum allowed depth of 0.75 inches. Other than that, all other scenarios passed the criteria, resulting in a lower rutting depth than that of the reference scenario in this case. The least rutting depth predicted was 0.61 inches, for the segregated scenario where the autonomous trucks occupy one lane. It is clear that for rutting, the segregated scenario worked best, particularly when the percentage of autonomous trucks was below 50%, which led them to occupy one lane.

4.2. Predicted AC Bottum-Up Cracking

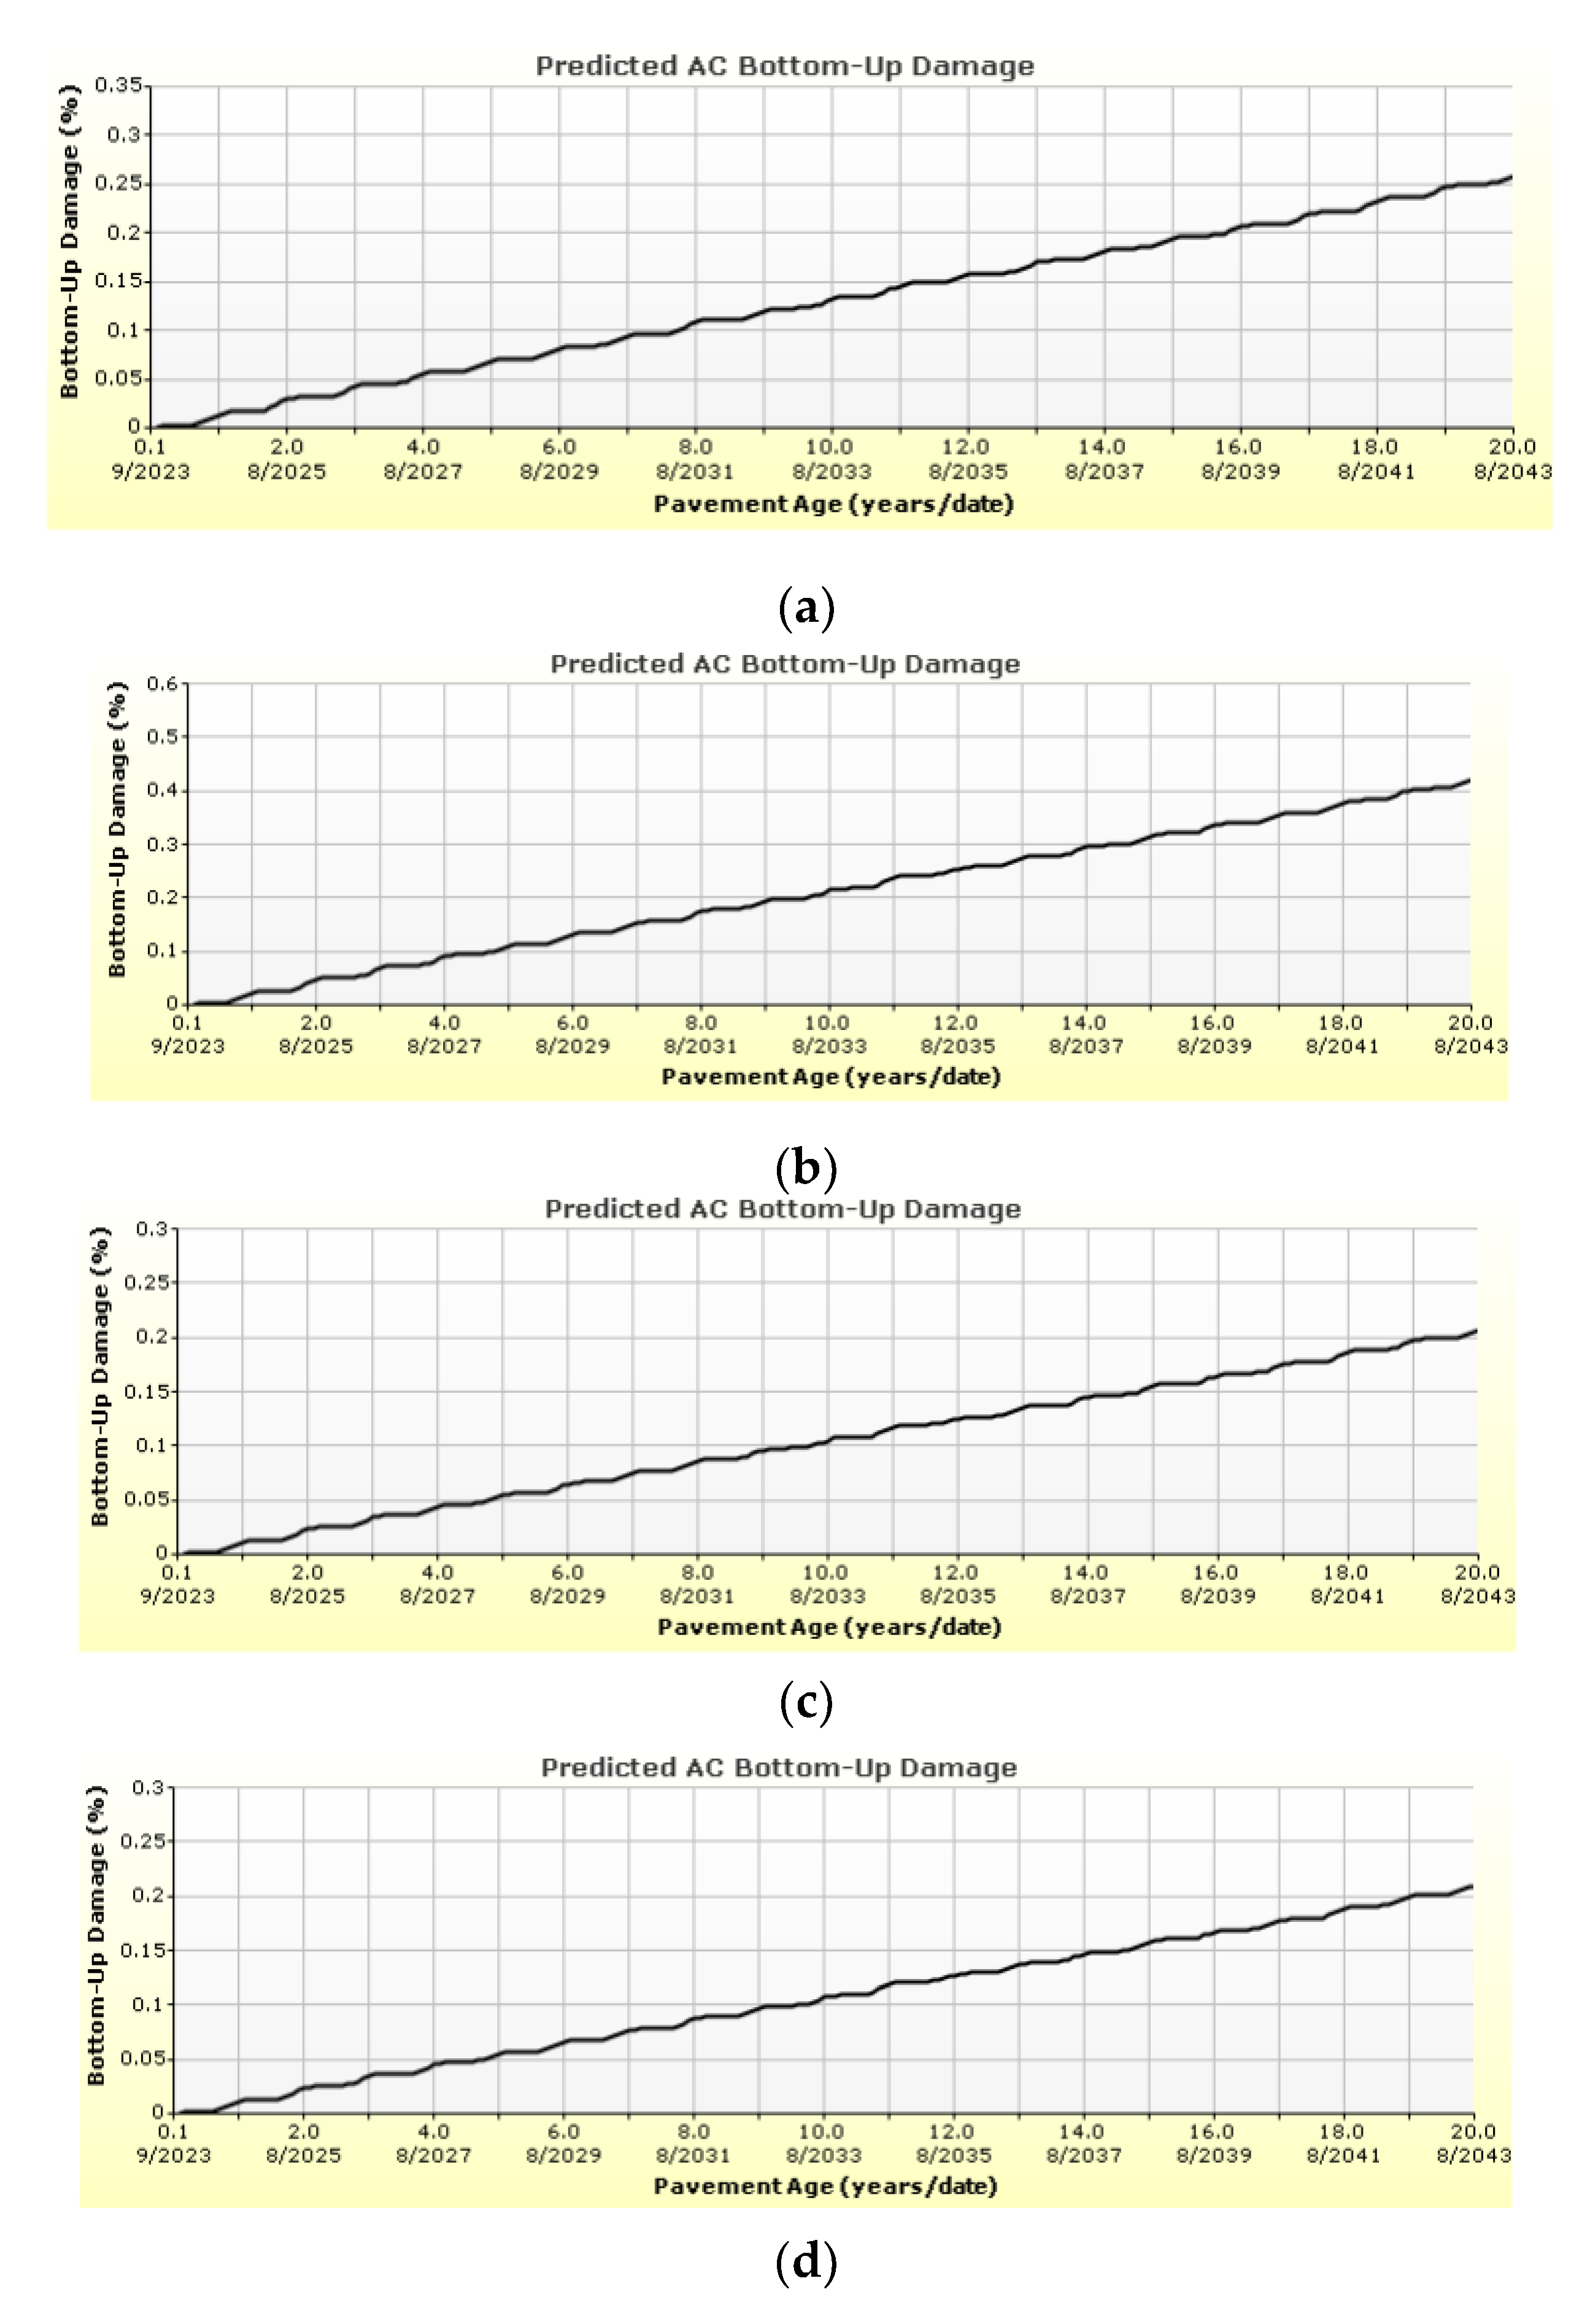
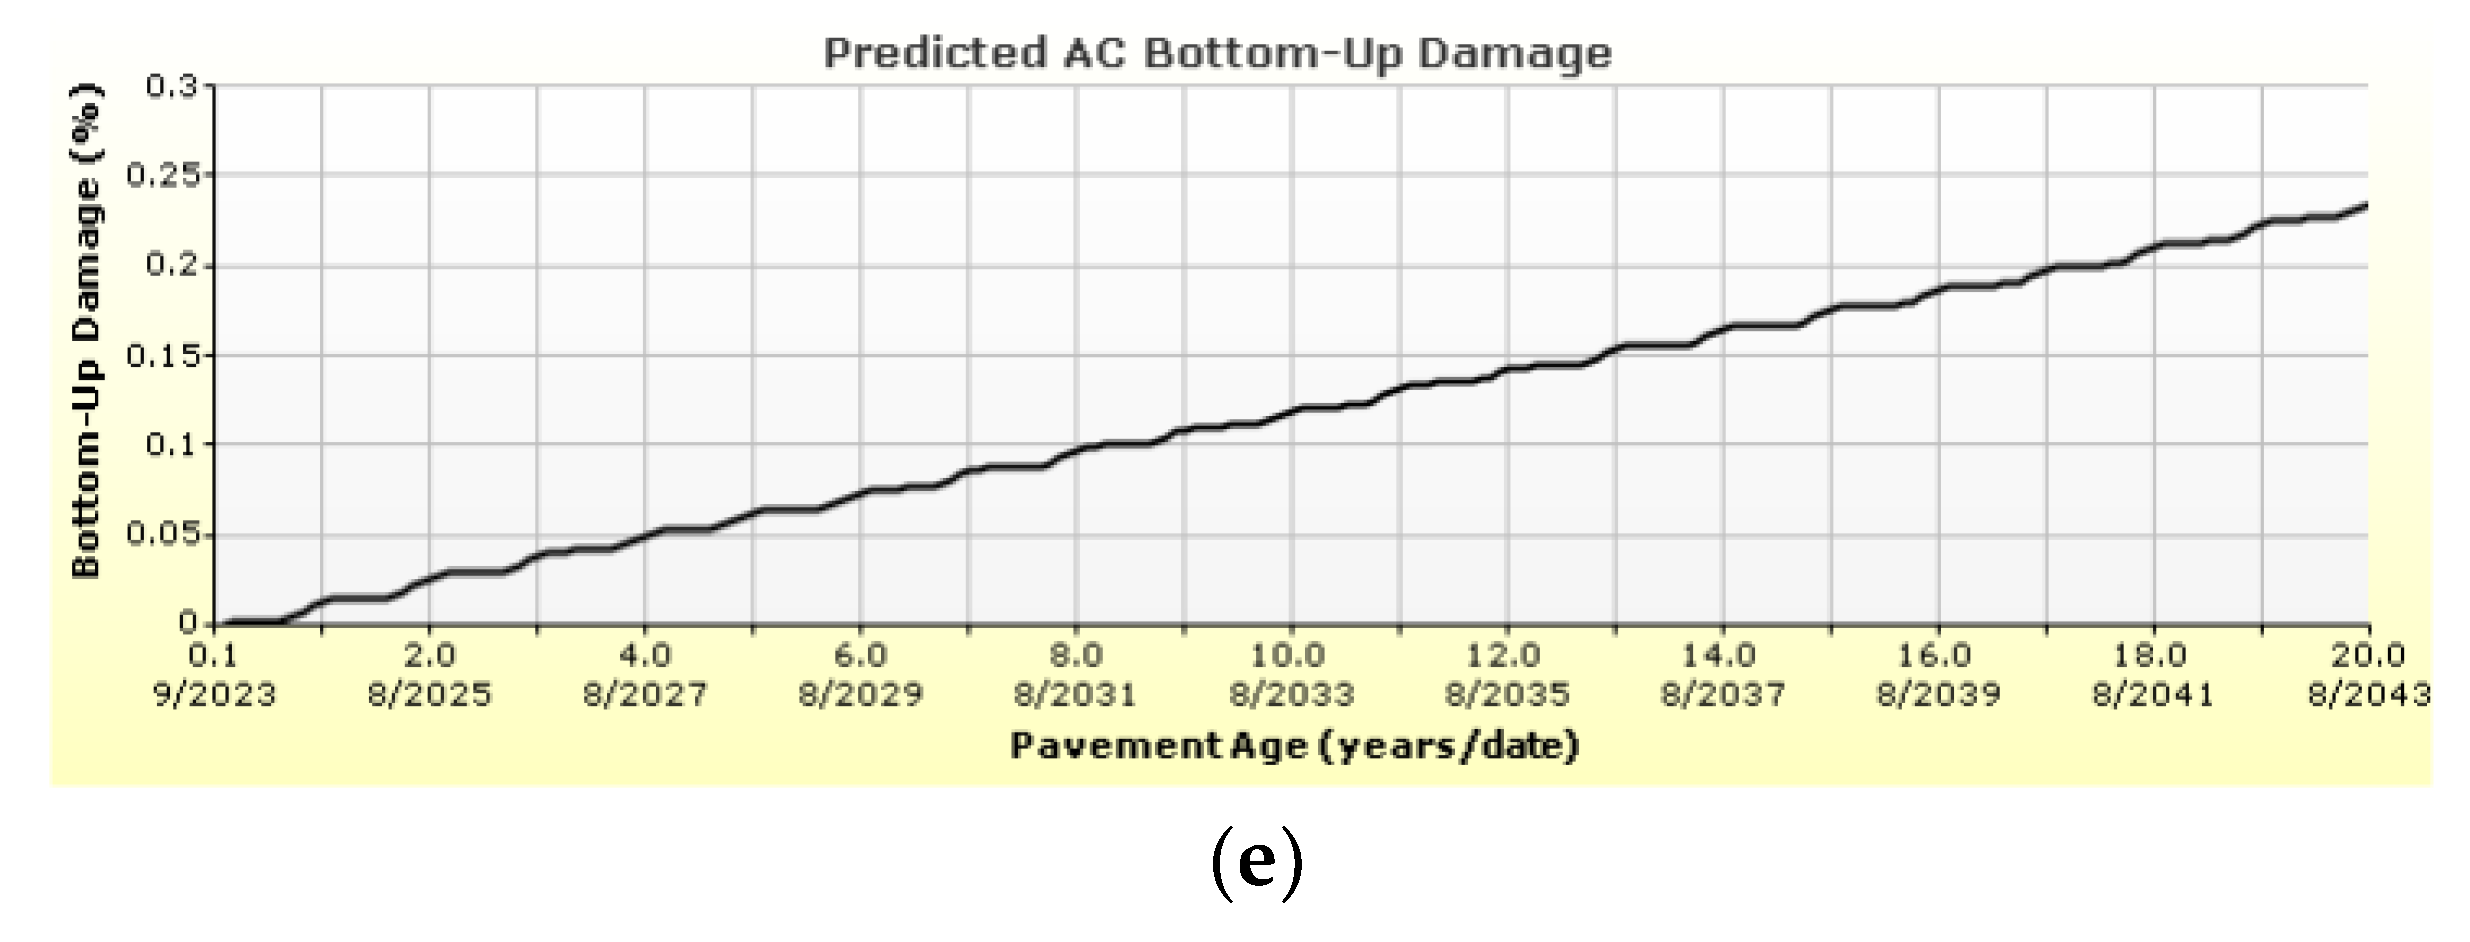
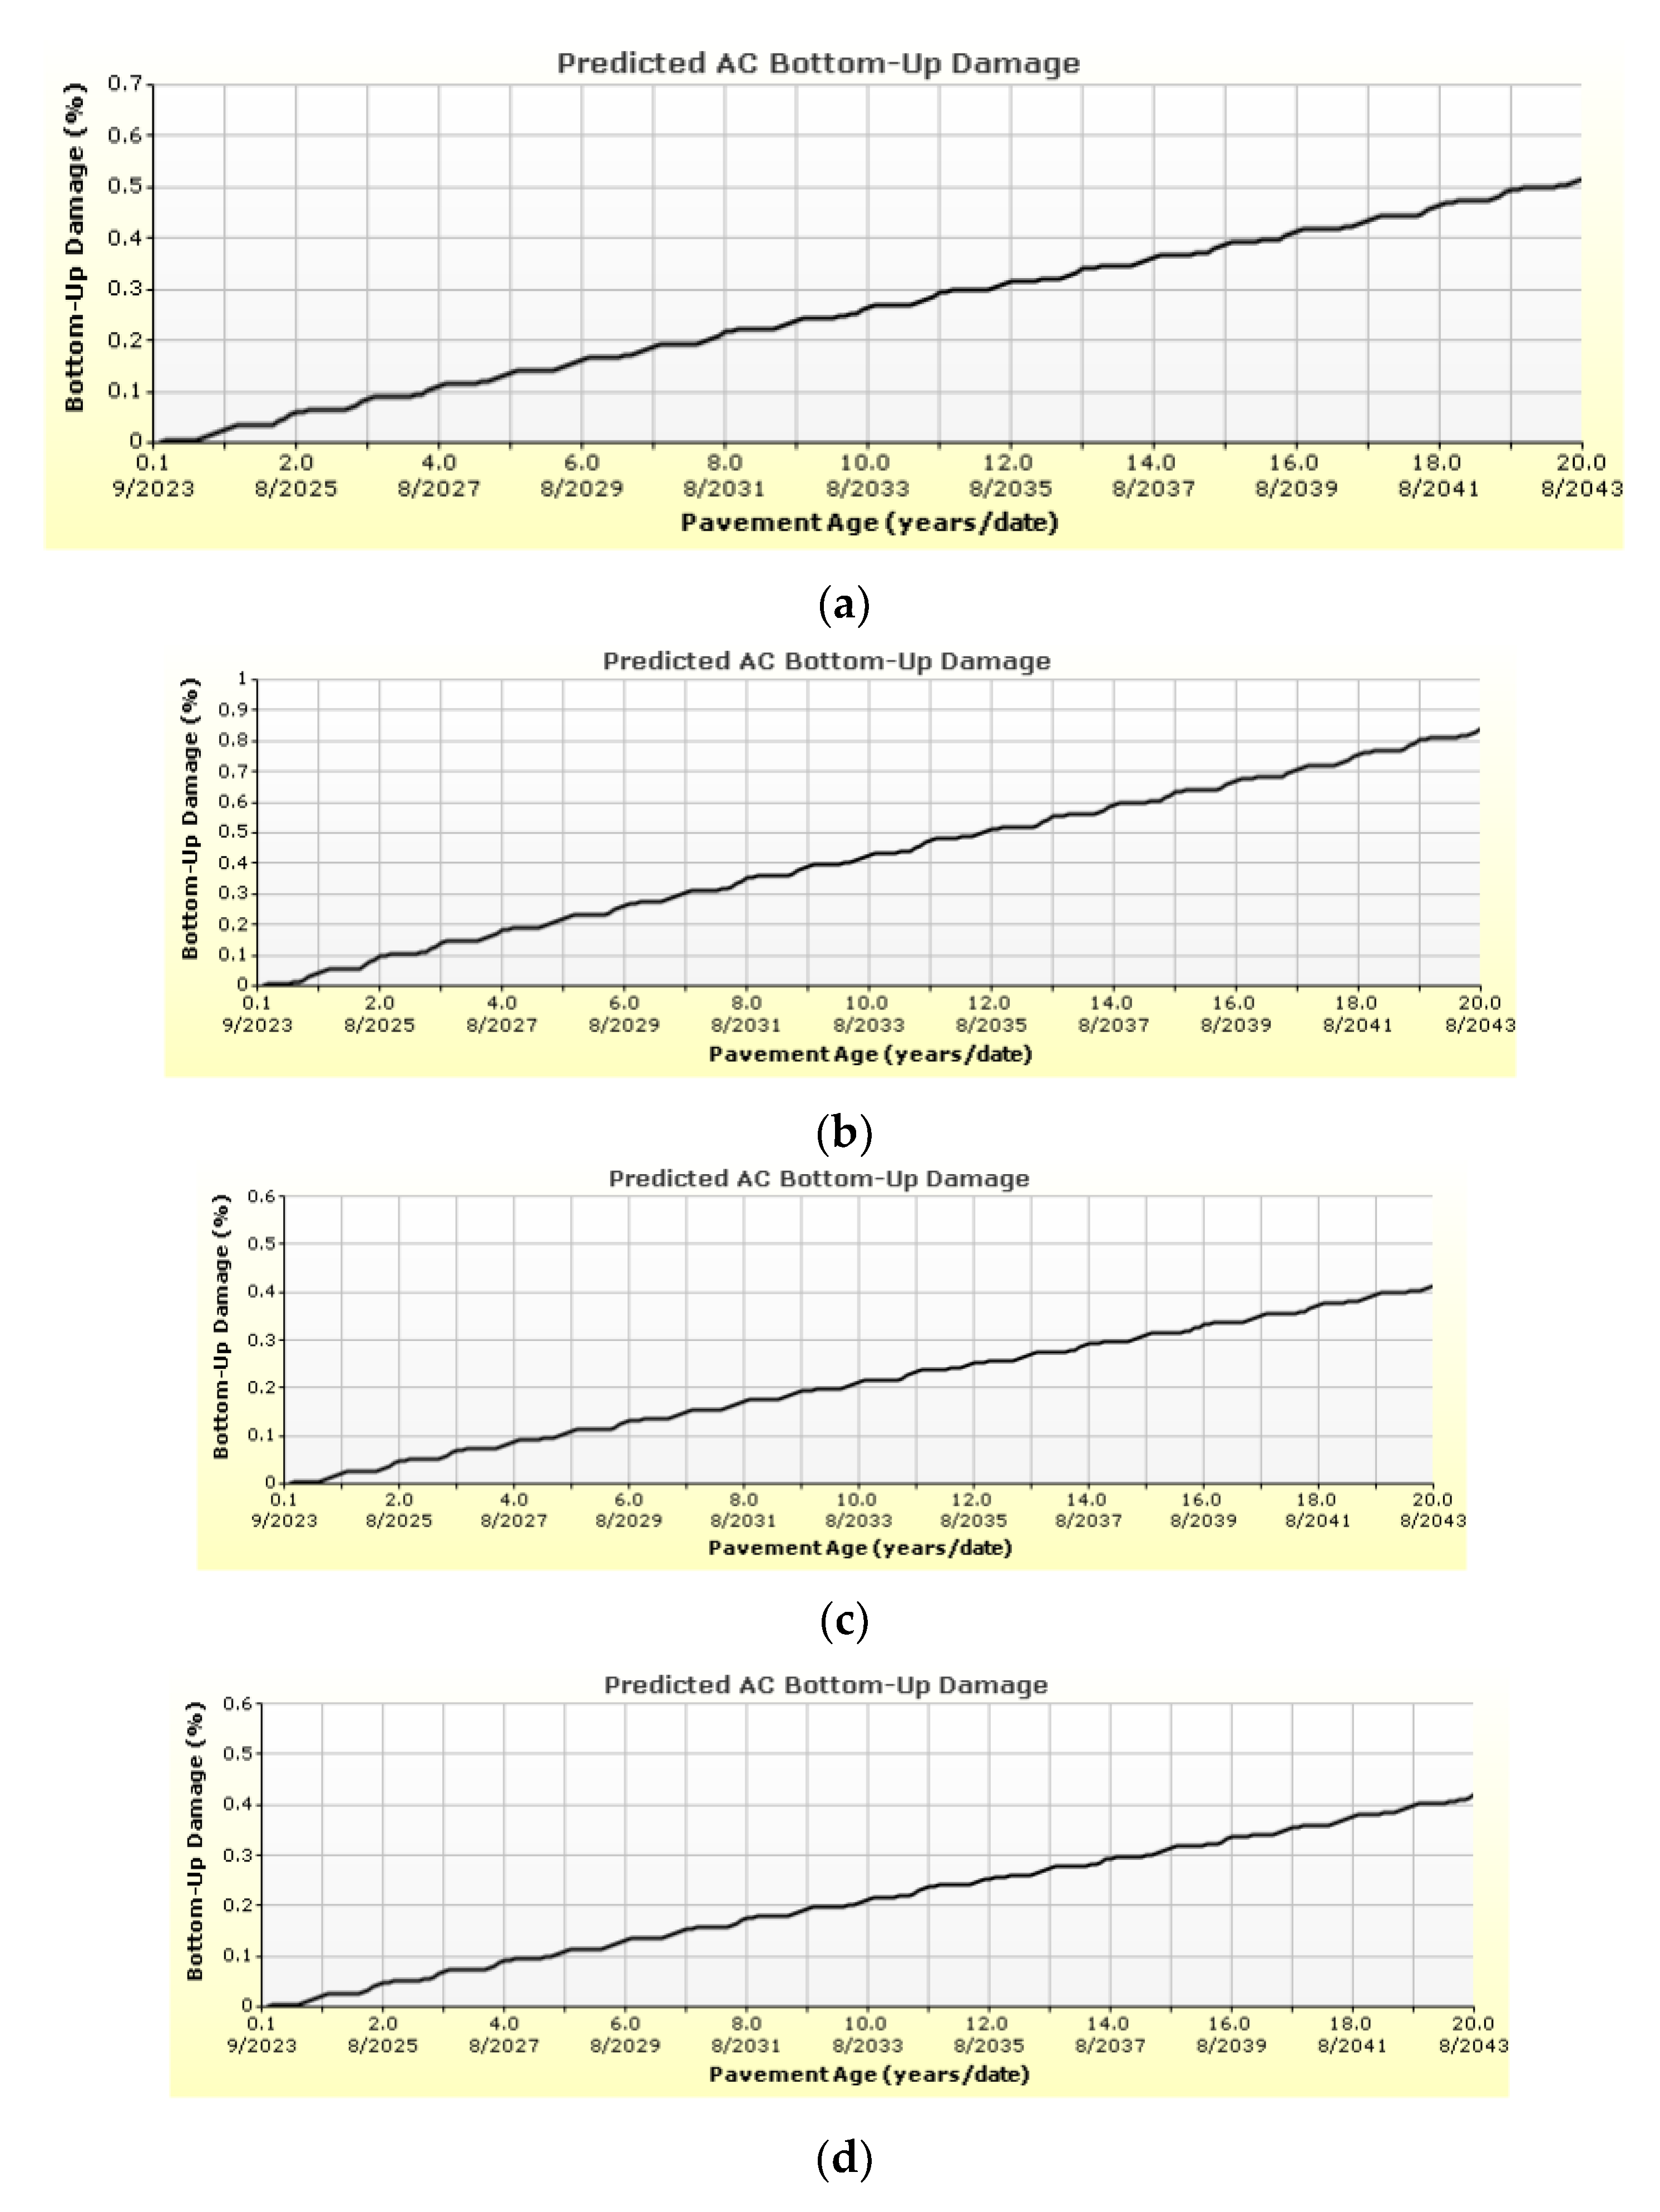
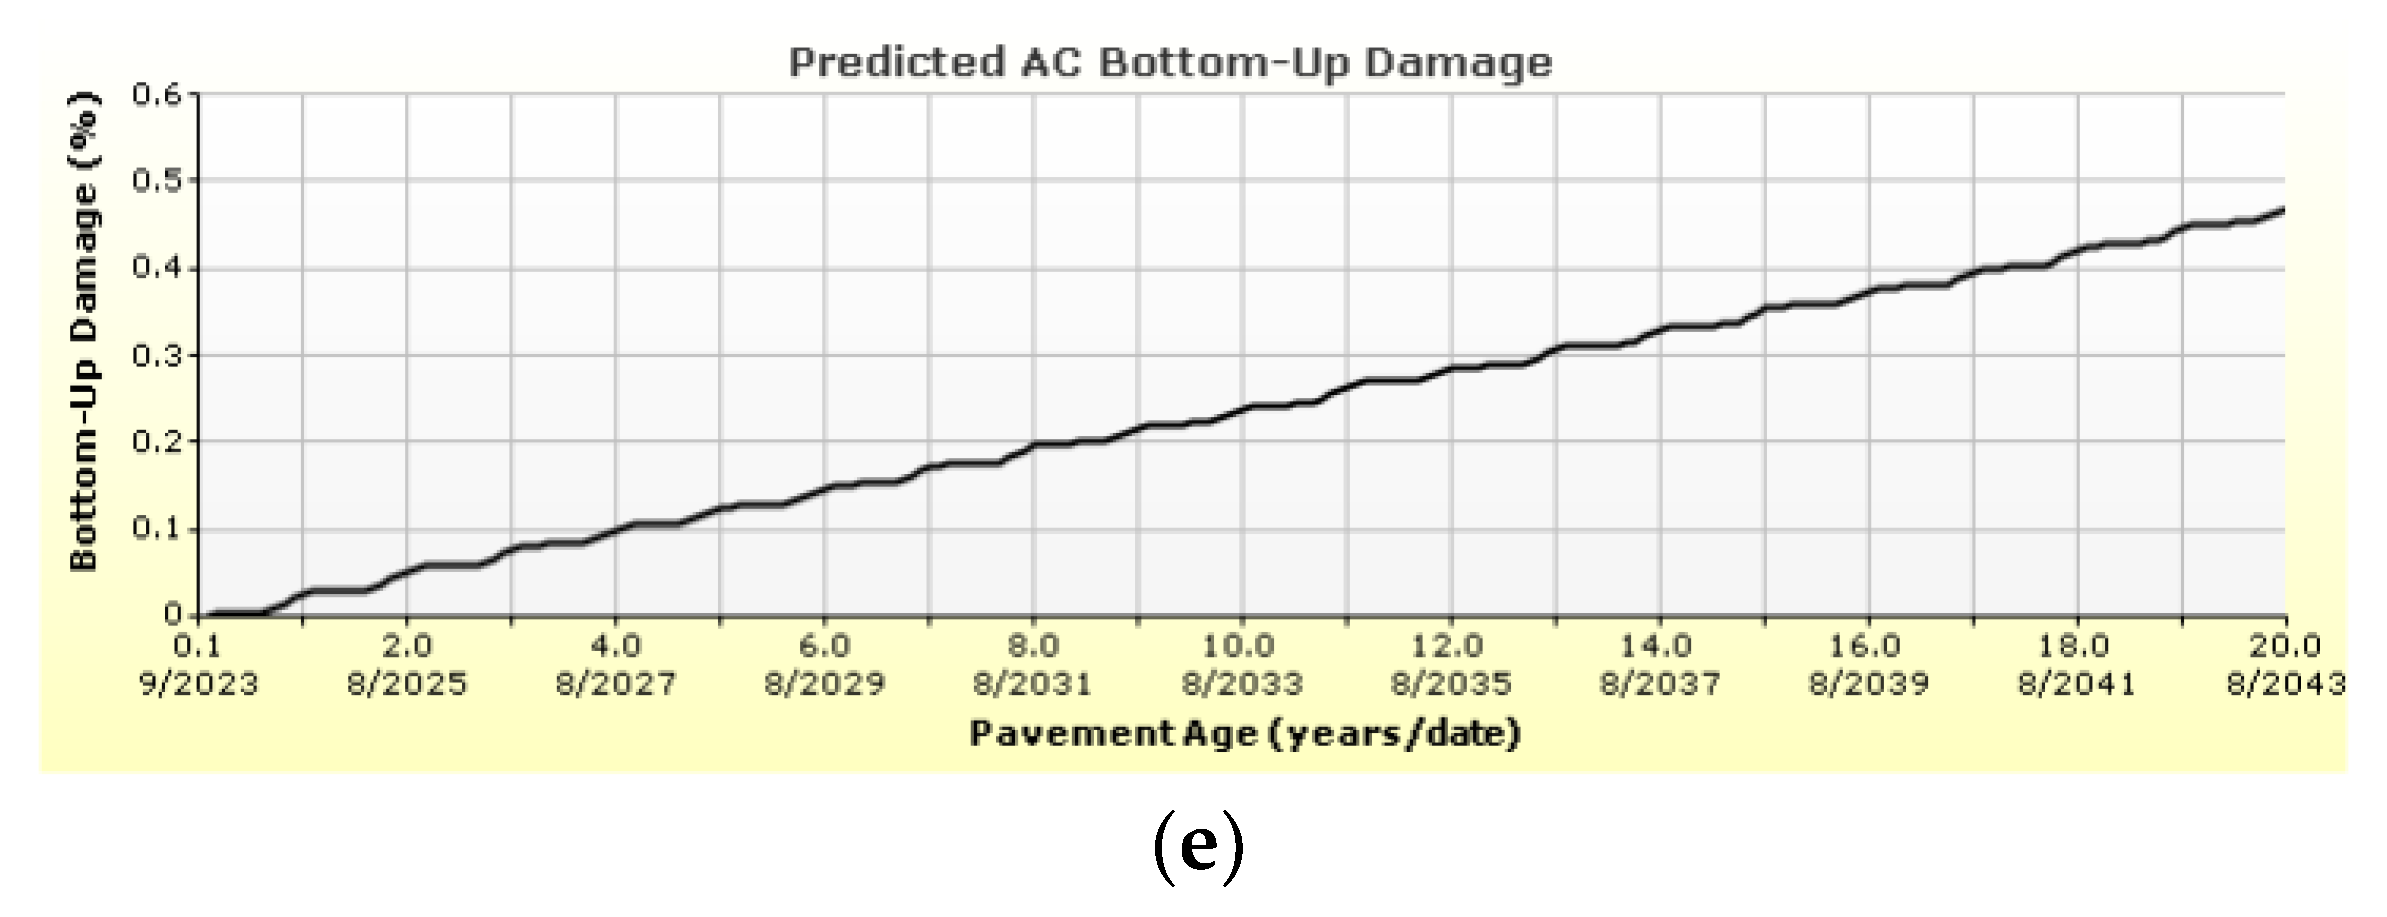
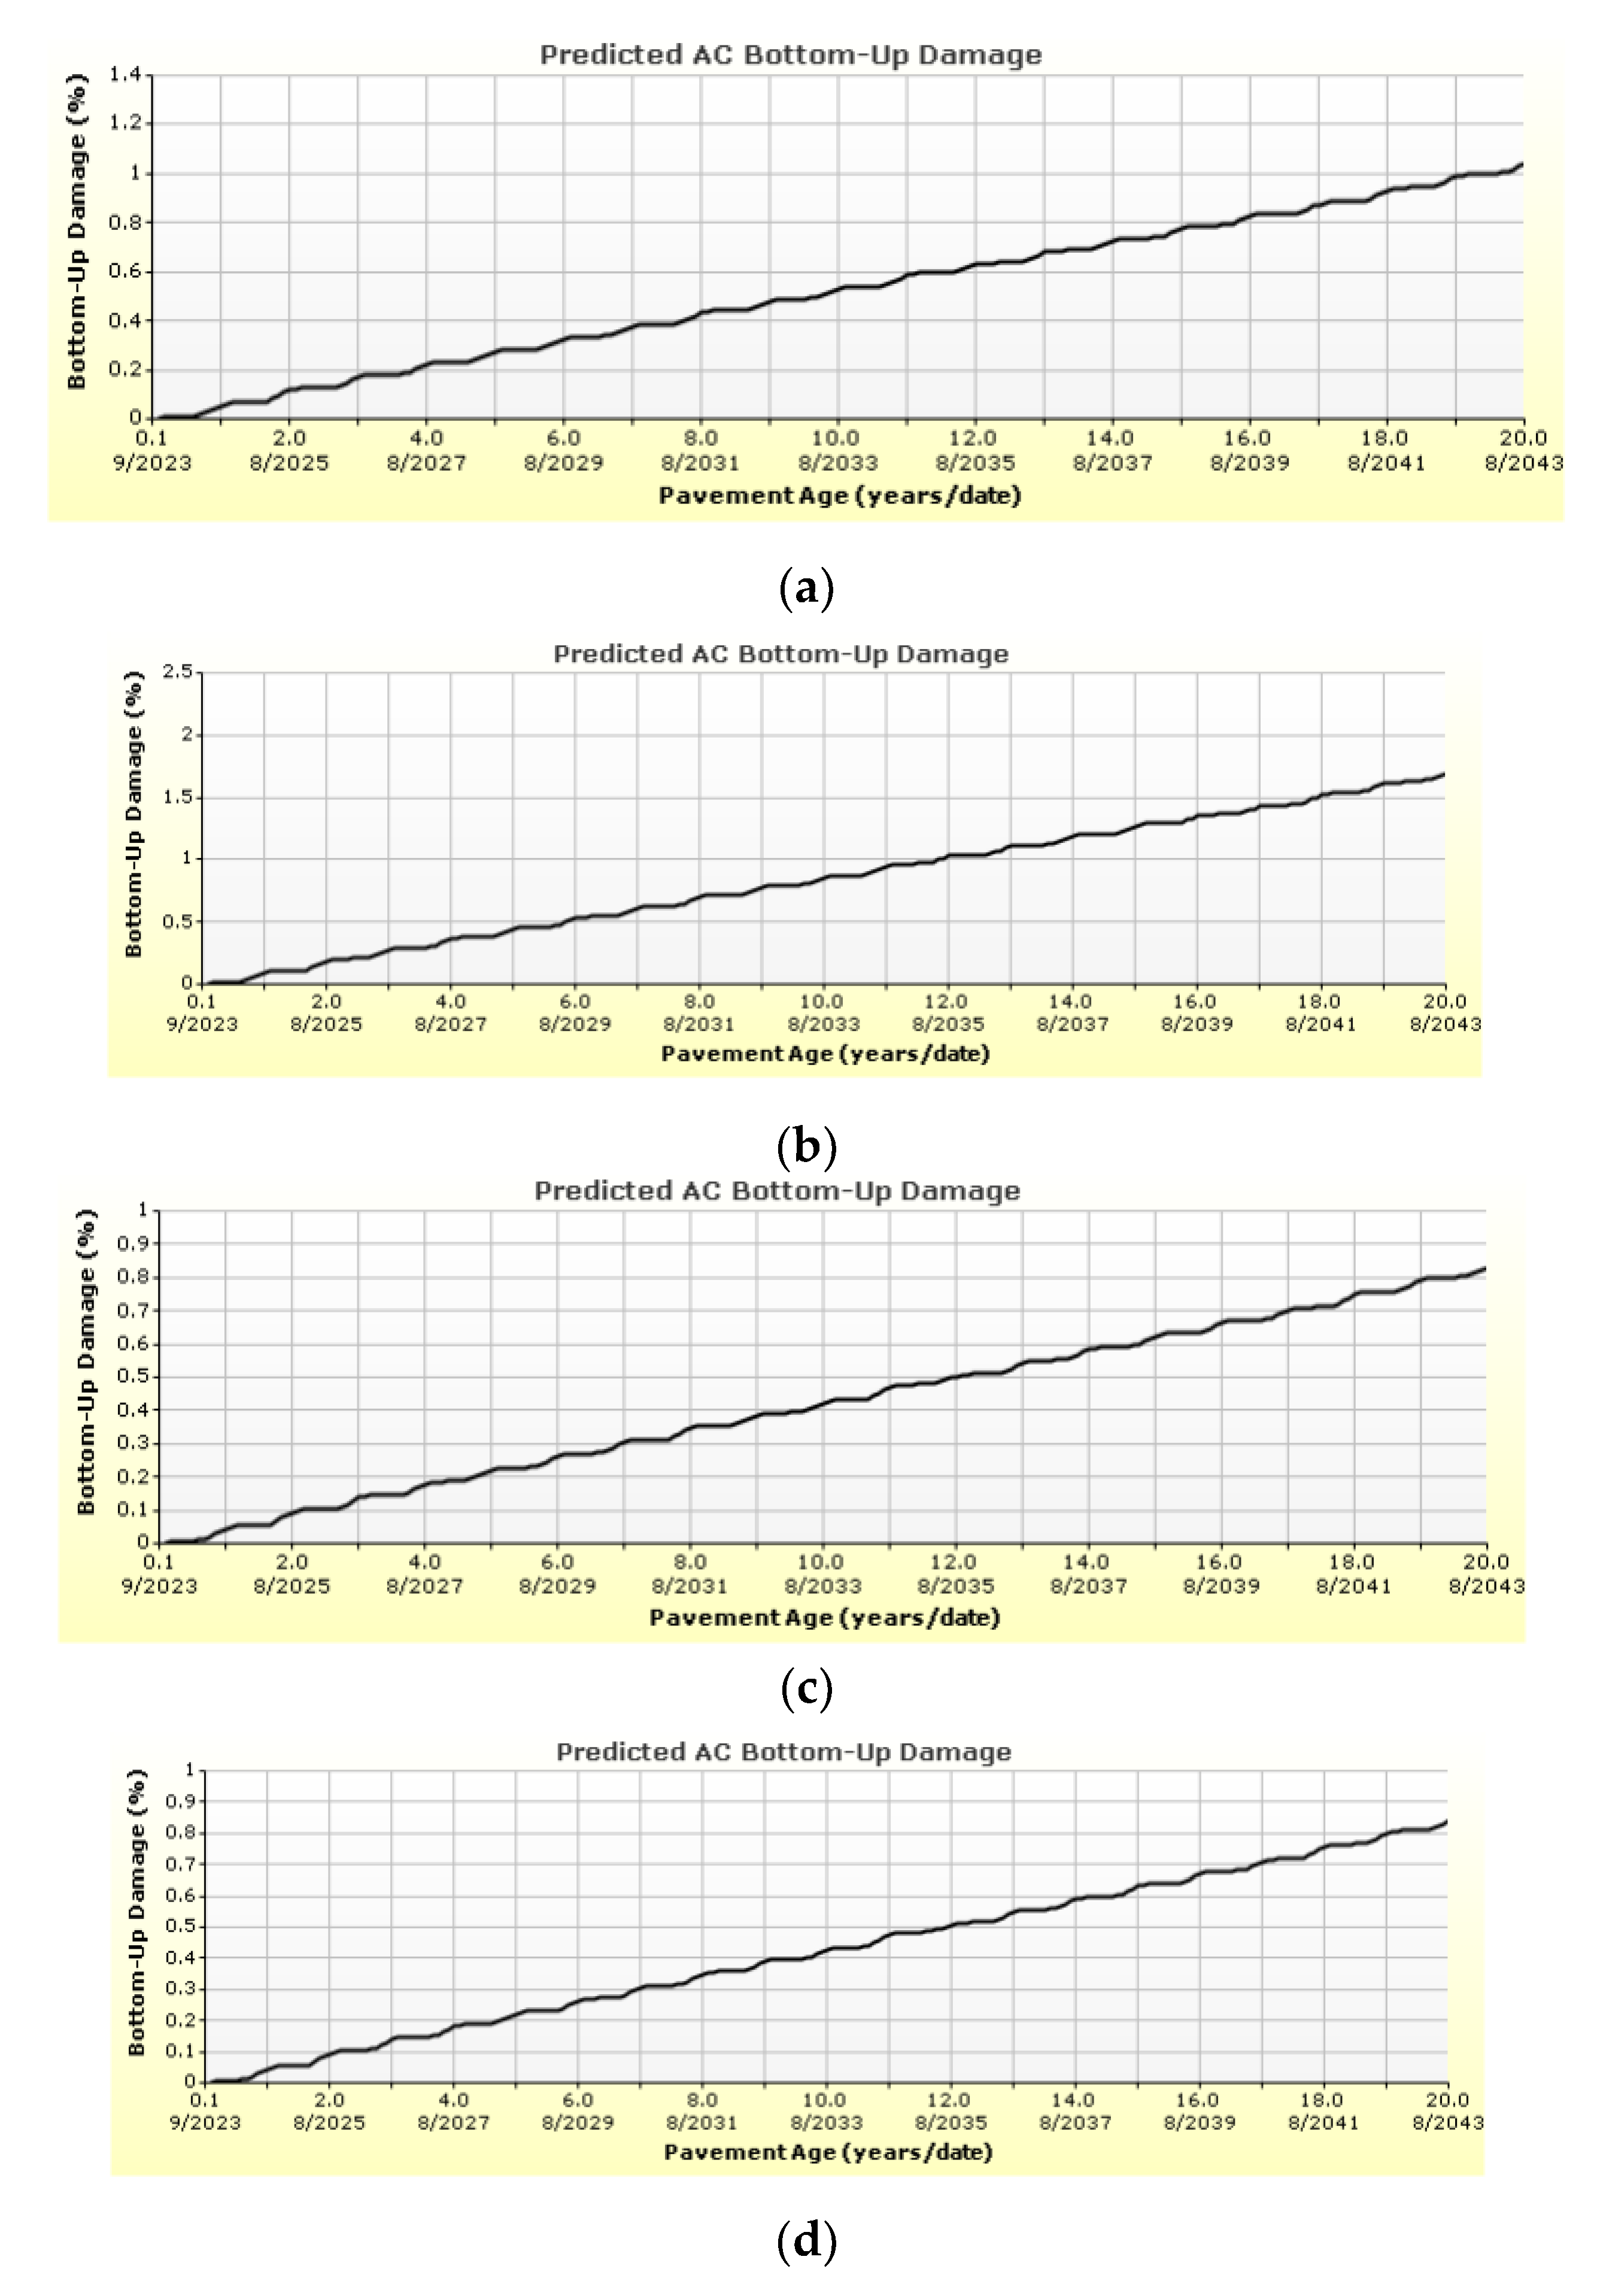
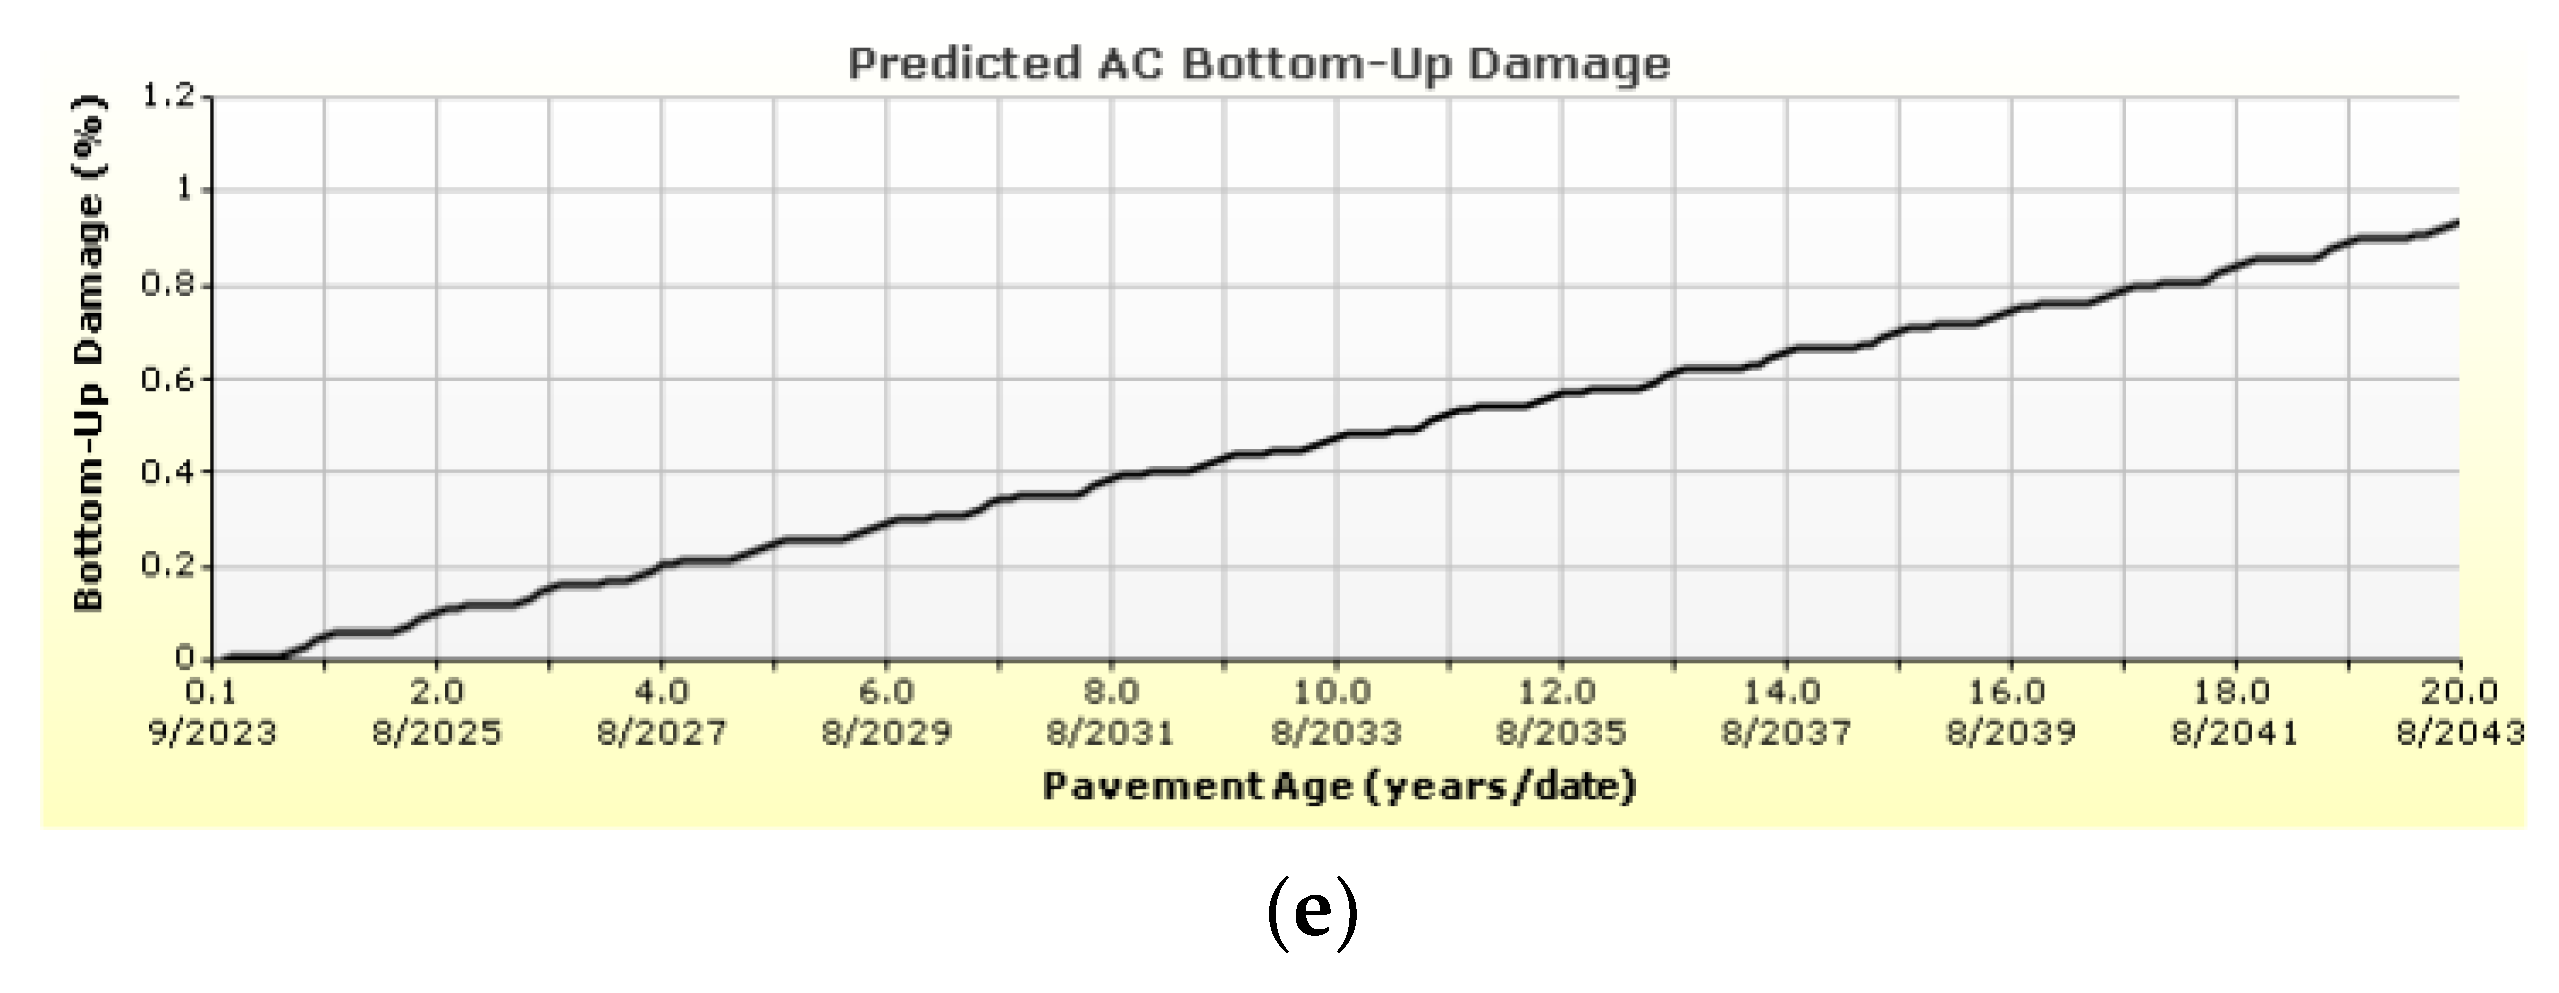
Figure 6a–e, Figure 7a–e, and Figure 8a–e show the comparative results of the total predicted AC bottom-up fatigue cracking.
As for the AC bottom-up cracking in the case of 500 trucks/day, it can be seen that the integrated scenario with the autonomous trucks disproportionally distributed predicted the highest percentage of damage (around 0.41%), which is higher compared to the reference scenario (around 0.26%). On the other hand, the scenario that brought the best results for the lowest percentage of bottom up-damage is the integrated scenario with the autonomous trucks equally distributed among all lanes (around 0.2%). The segregated scenario with AT < 50% falls close to the former, with a percentage of 0.21%.
For an AADTT of 1000 trucks/day, the same results are noticed for the highest predicted AC bottom-up damage, which is the case of the integrated scenario where the trucks are disproportionally placed in one lane, reaching a value of 0.83%. Both the integrated scenario, where the trucks are equally distributed along all lanes, and the segregated scenario, where the autonomous trucks occupy one lane, predicted the lowest damage (around 0.41%).
As for the high traffic depicted by 2000 trucks/day, the same results were developed: the integrated scenario with the disproportionally placed trucks registered the highest percentage of damage (around 1.7%), and both the integrated scenario with the trucks equally distributed among all lanes and the segregated scenario with AT < 50% registered the lowest percentage of damage (around 0.82%).

4.3. Predicted AC Top-Down Cracking

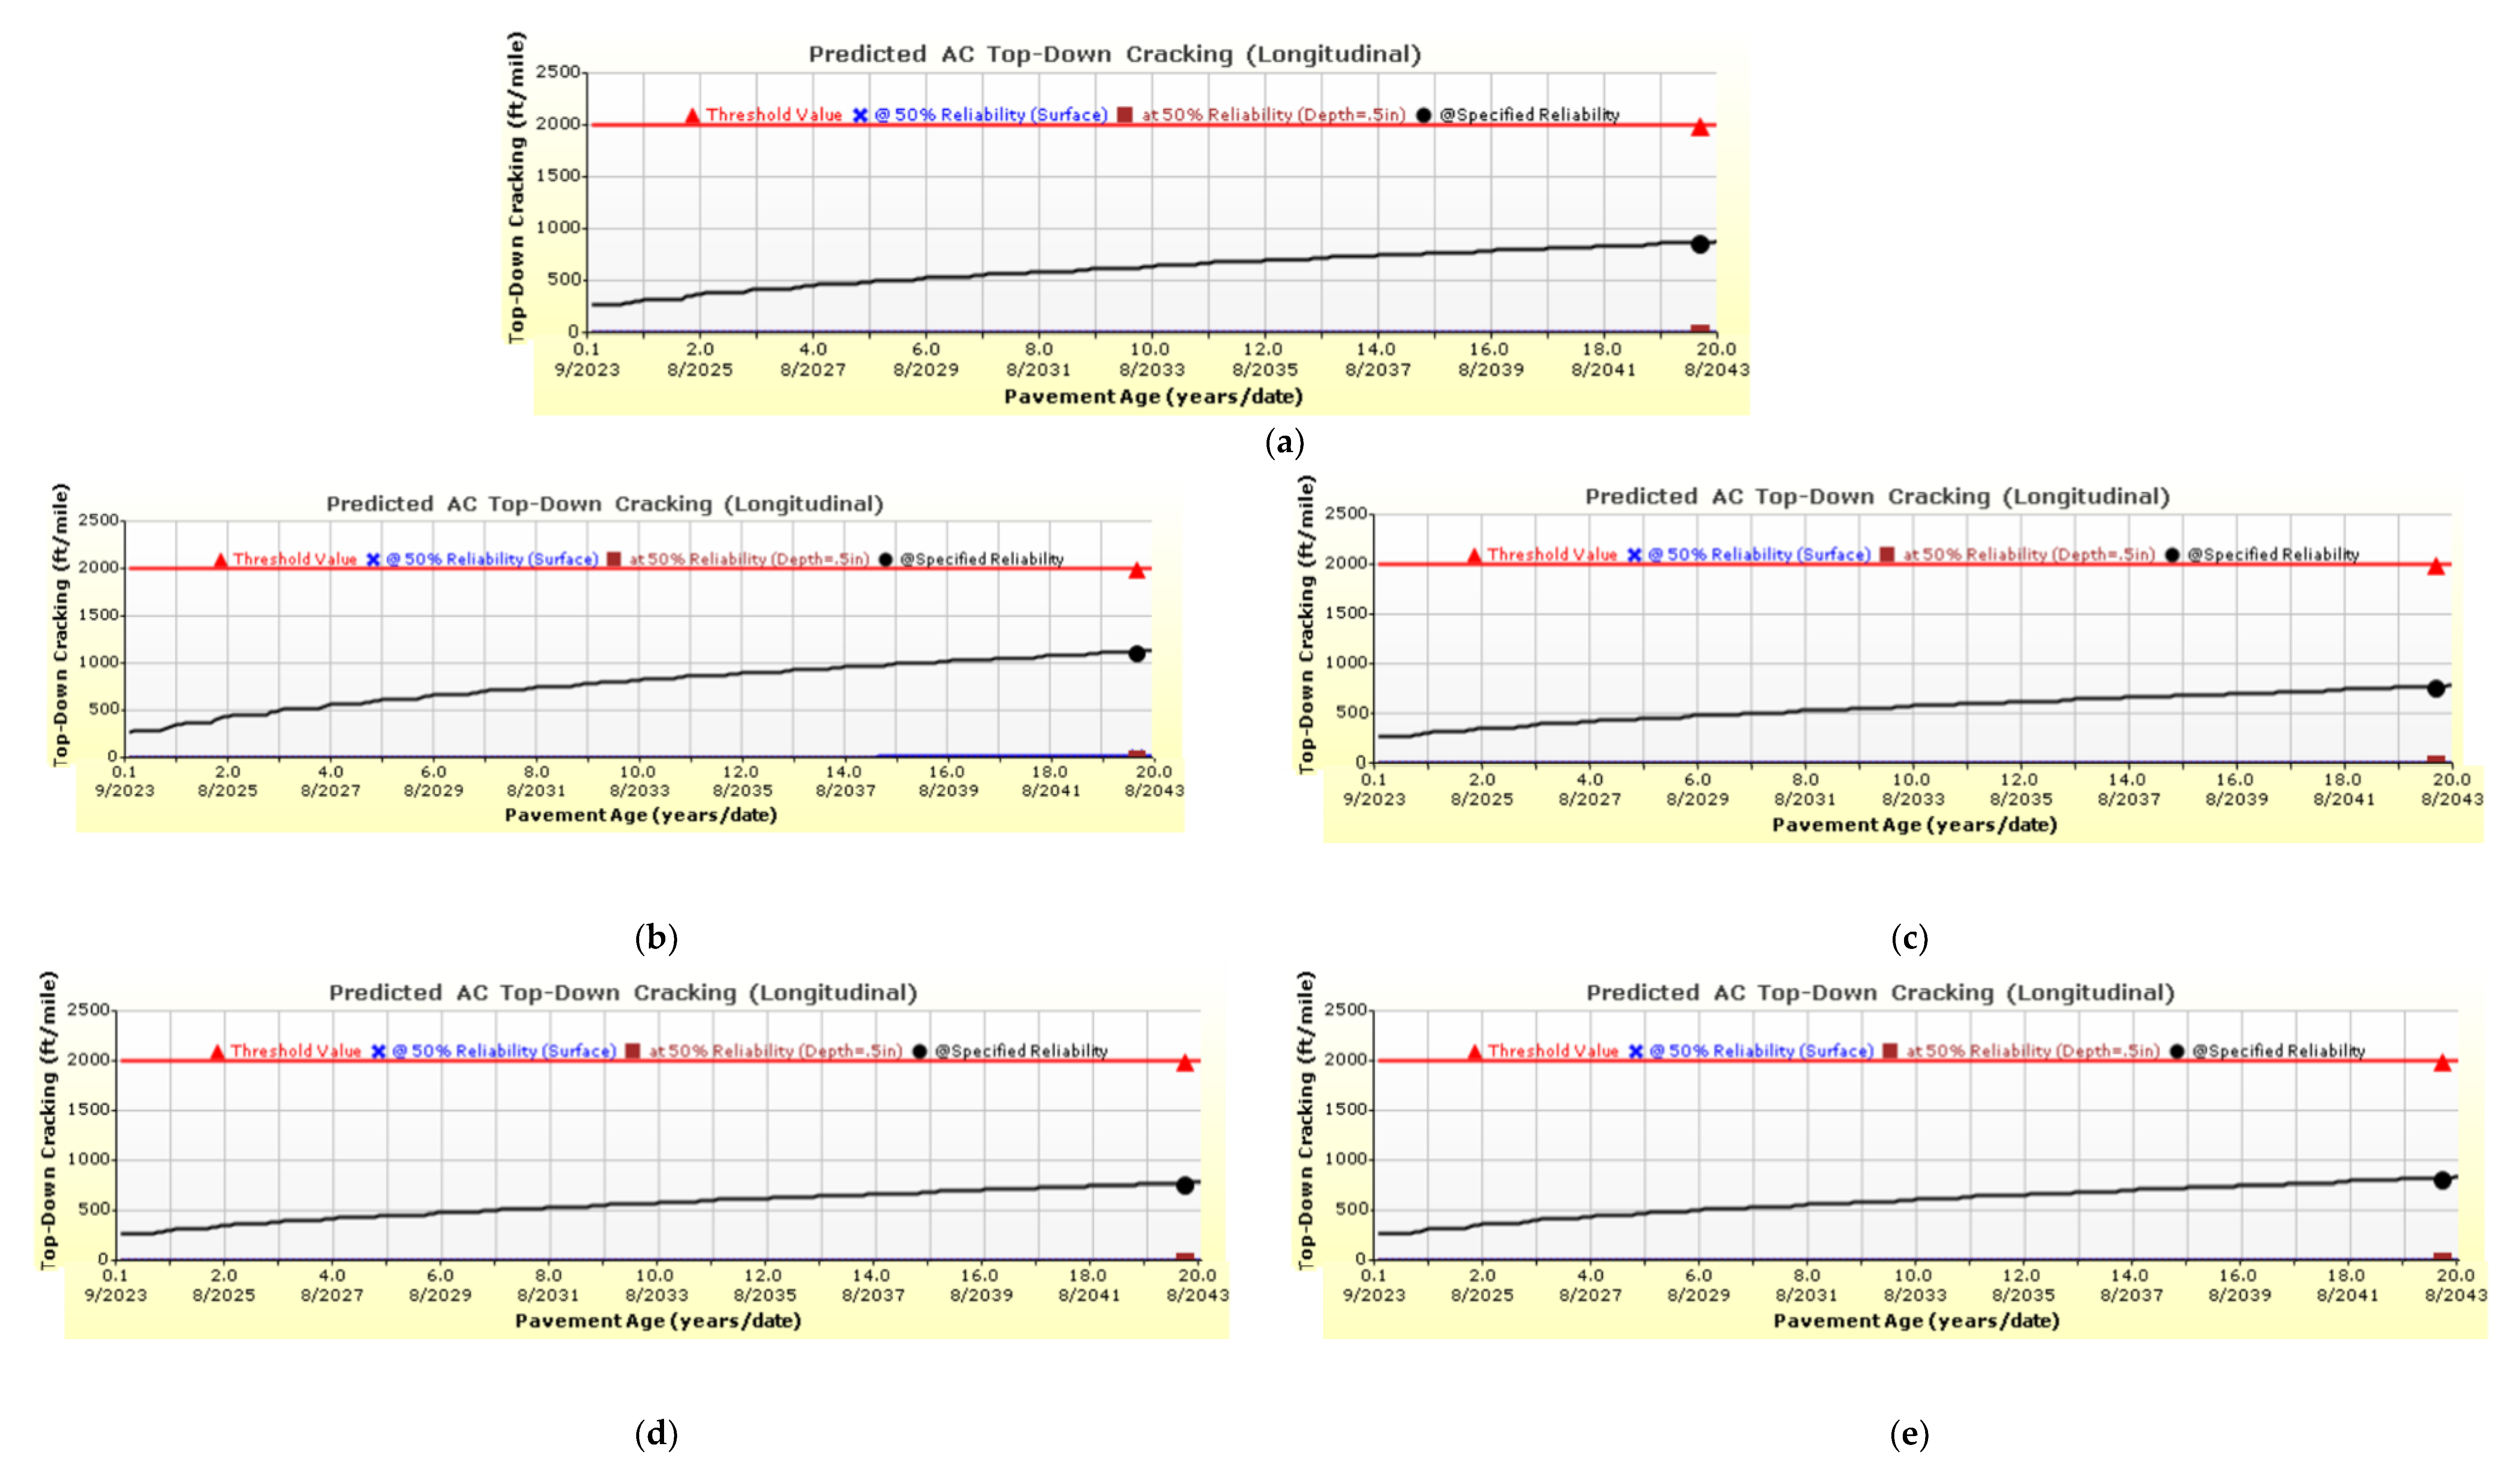
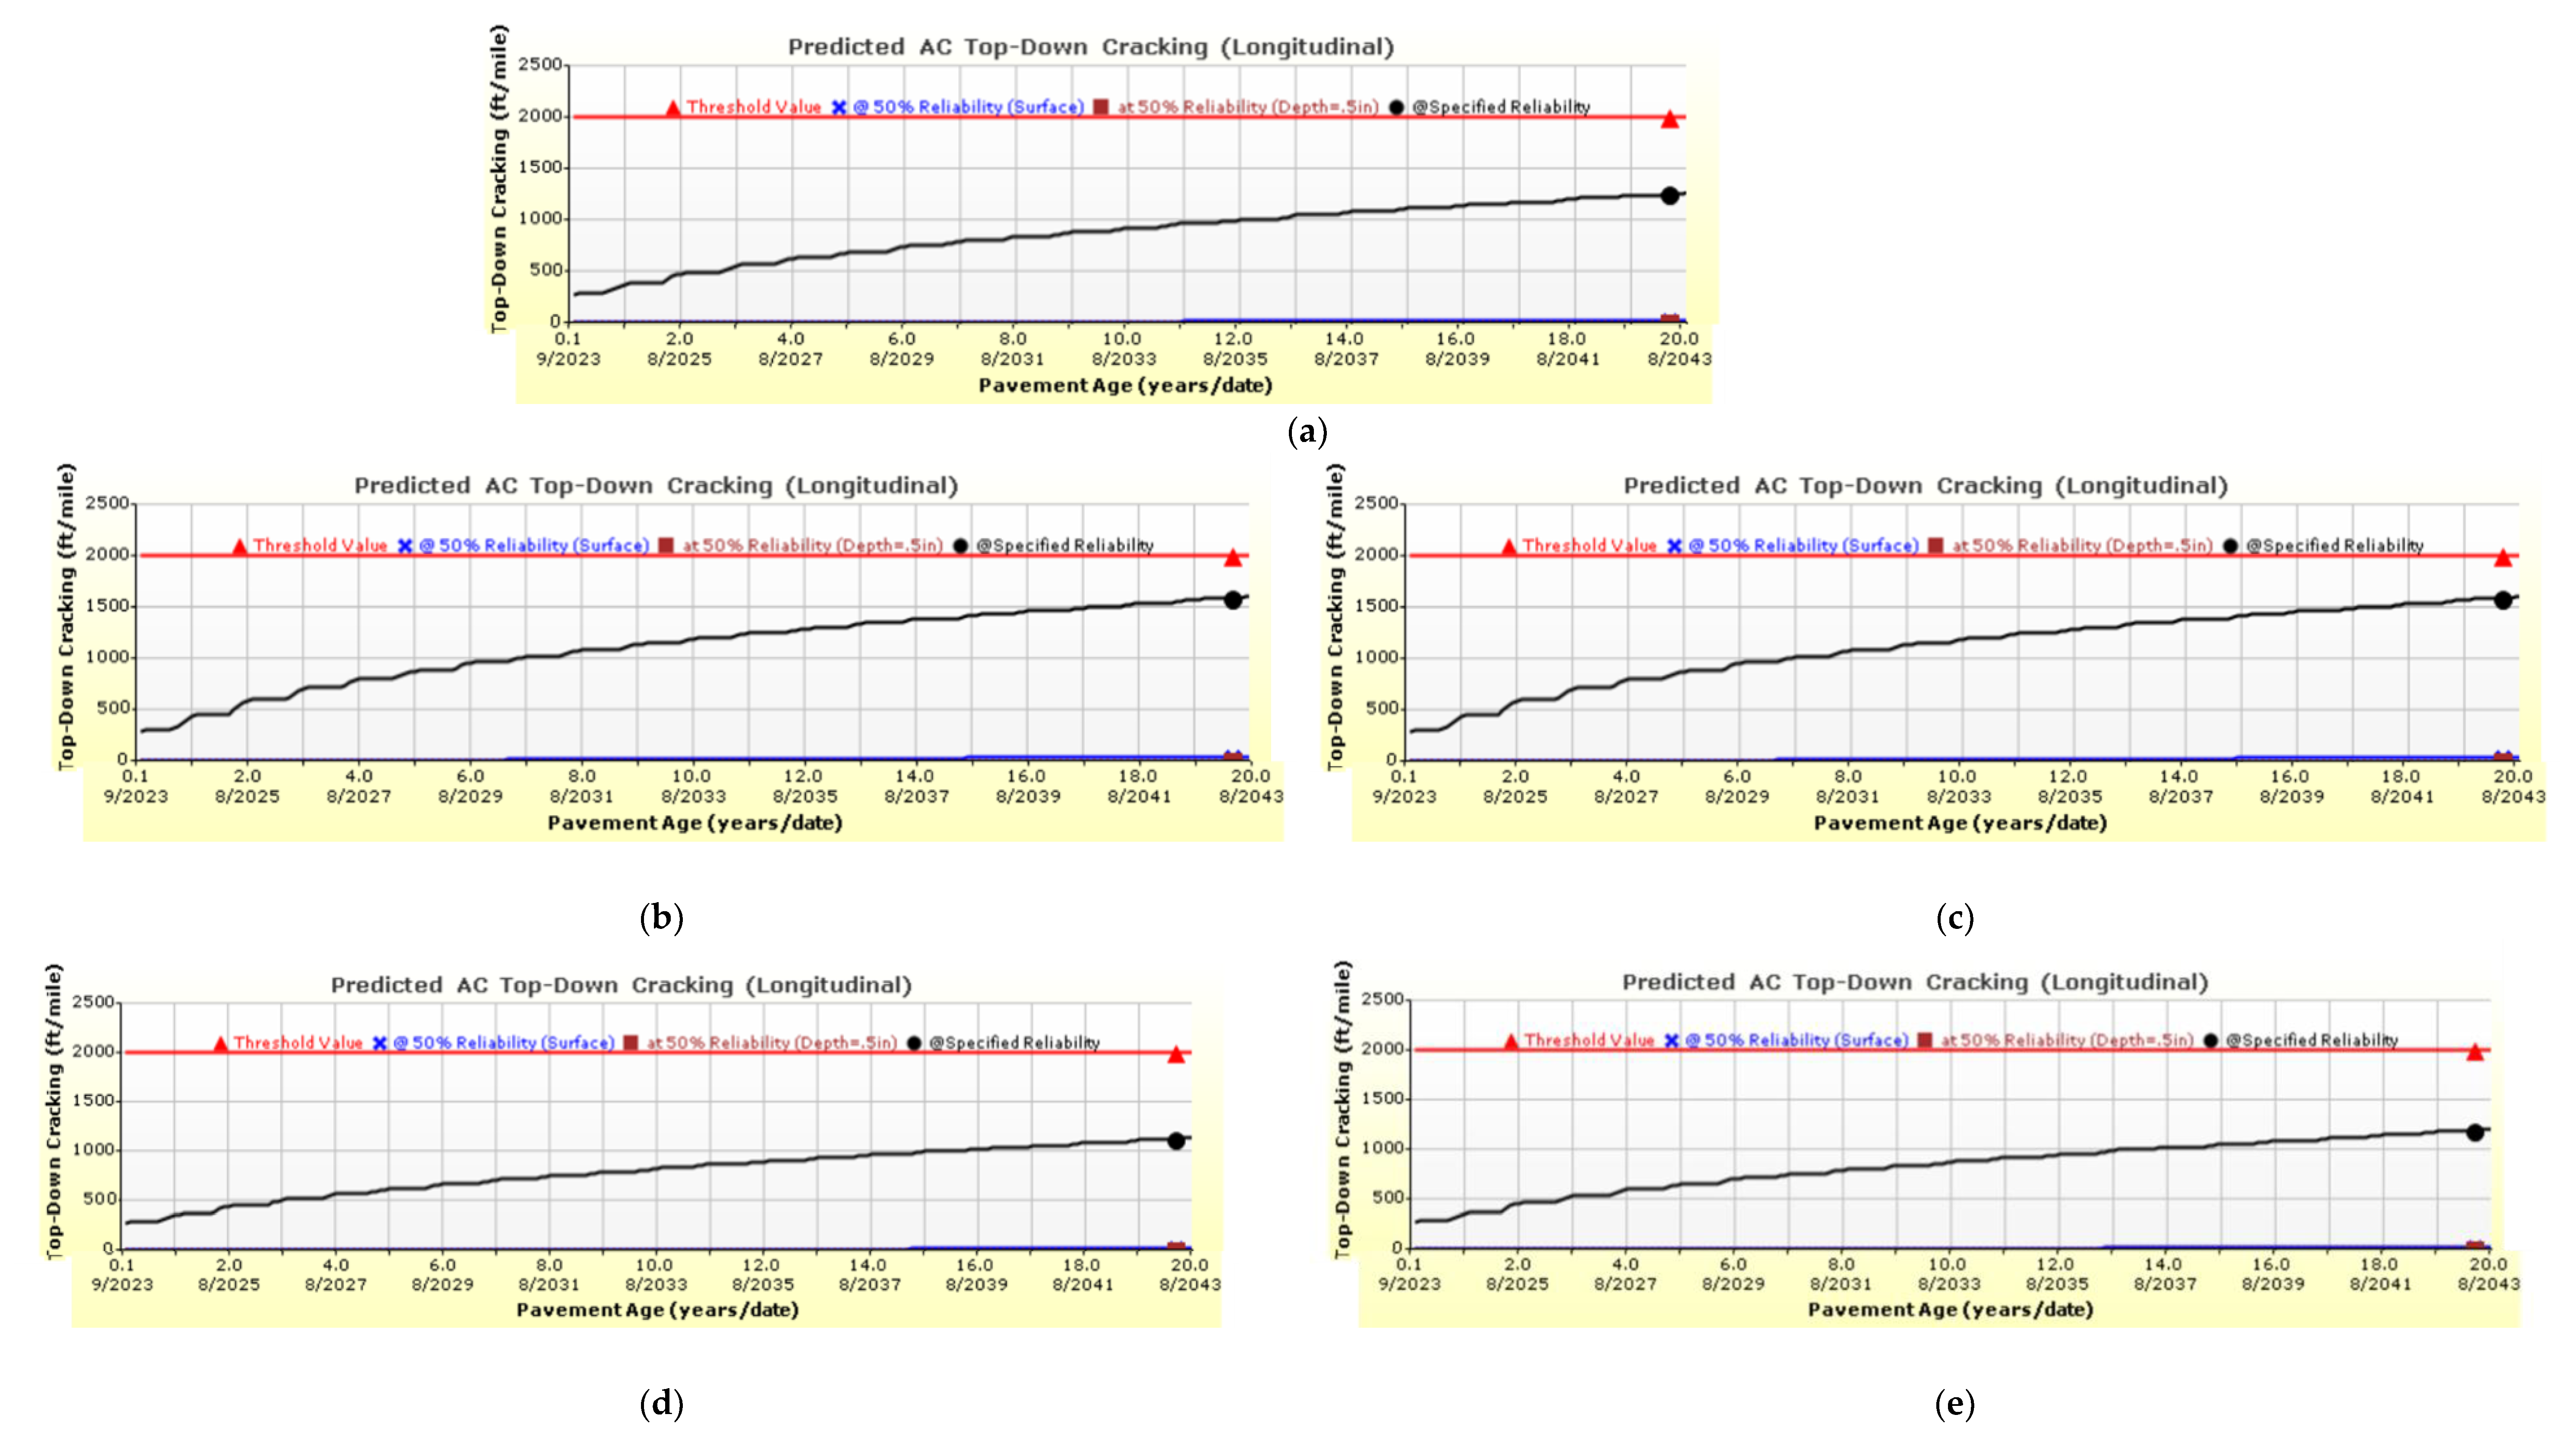
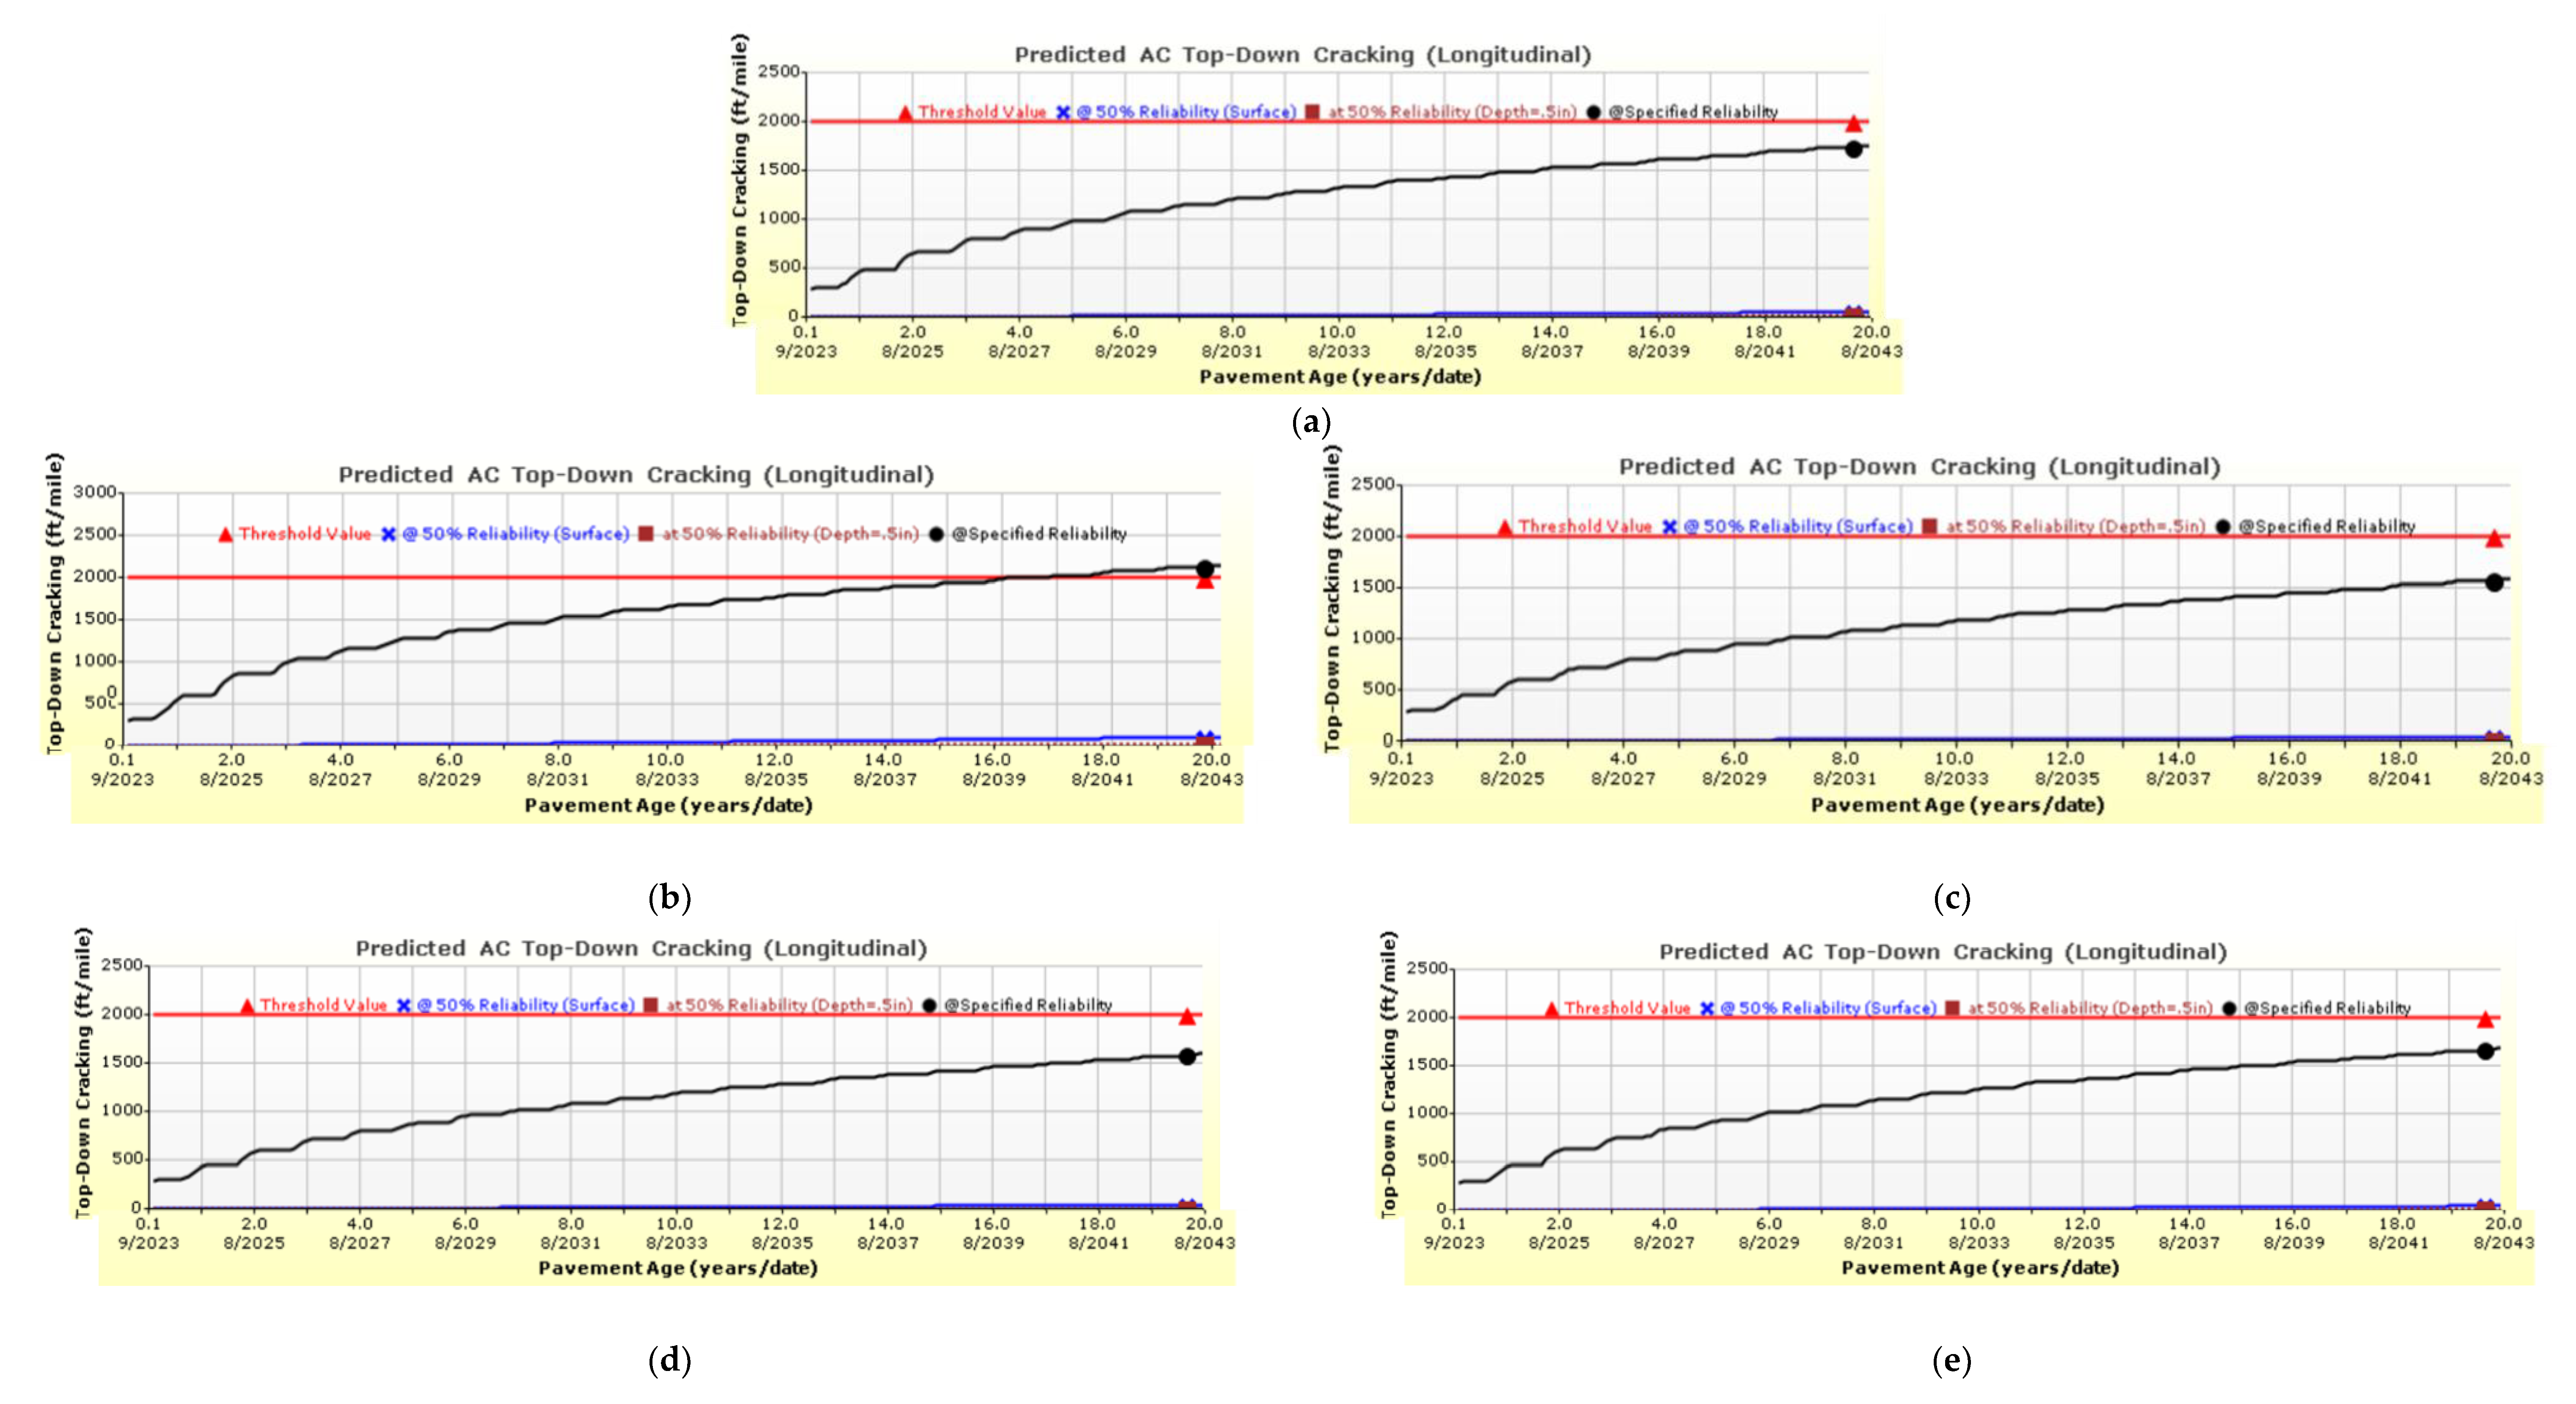
Figure 9a–e, Figure 10a–e, and Figure 11a–e show the comparative results of the total predicted AC top-down fatigue cracking.
Concerning the AC top-down cracking, the integrated scenario with disproportionally placed trucks developed the highest amount of damage for the low traffic depicted by 500 trucks/day (around 1100 ft/mile), which is also higher than that of the reference scenario (around 850 ft/mile). For the lowest value, the three remaining scenarios (integrated with equally distributed trucks and segregated trucks) reached almost the same value between 750 and 800 ft/mile after 20 years of pavement life.
The same results were obtained for the mid-traffic volume with an AADTT of 1000 trucks/day. The worst case was the one where the autonomous trucks were integrated into the traffic and disproportionally placed in one lane, reaching a value of 1600 ft/mile (still below the limit). The best case was the integrated case, where the trucks were equally distributed among all lanes, with a value of 1100 ft/mile, which is not much lower than the segregated scenario where both cases reached 1200 ft/mile.
For the high-traffic case with 2000 trucks/day, not all scenarios passed the limit. The integrated scenario with the disproportionally placed trucks, which was the worst-case scenario in all the test runs, crossed the limit, which was reached after 15 years of pavement life. After 20 years, this value reached 2200 ft/mile.
On the other hand, the integrated scenario where the trucks were equally distributed across all lanes registered a value of 1550 ft/mile, close to the segregated scenario with AT < 50%. When AT > 50%, it reached 1650 ft/mile.

5. Optimum Spacing

The minimum limit for the spacing between two vehicles was 3 m, which is the lowest value tested for autonomous trucks and in-truck platoons. The maximum limit was 60 m, which is the highest value observed for human-driven trucks. The authors of [16,26] found that the optimum spacing between trucks was 3.3 m, which is close to the minimum limit.

5.1. Wandering

In the research study conducted by [16], an optimized skeleton for a platoon with 10 trucks was concluded following a series of steps using different algorithms in MATLAB to solve an optimization equation. To follow the same steps, it is important to set an example using one type of truck. Since the example used in the first part of the research includes many types of trucks, the optimization equation is not applicable.
However, the authors of [16,27] concluded that the ideal value of wandering between the axles of two consecutive cars in a platoon consisting of 10 trucks is 14 cm in a 4.3 m lane. Figure 12 shows the optimized truck configuration for a platoon size of 10.

5.2. Improved Pavement Design

Since the damage decreased noticeably in the segregated scenario, where the autonomous trucks occupy one lane of the highway during the service life of 20 years, a new modified section can be designed to minimize the cost of infrastructure by using fewer materials, and the cost of rehabilitation. Using AASHTOWare, it can be concluded that by decreasing the thickness of the asphalt by 1 inch, the thickness of the crushed stone base layer by 2 inches, and the thickness of the second base of silty soil by 2.5 inches, the pavement is predicted to serve the whole period of 20 years using fewer materials without any type of failure.
The new section for the modified pavement is displayed in Figure 13, where the thickness of the asphalt layer is considered to be 5.5 inches instead of 6.5, the first base layer is considered to be 6 inches instead of 8, and the second base layer is considered to be 7.5 inches instead of 10.
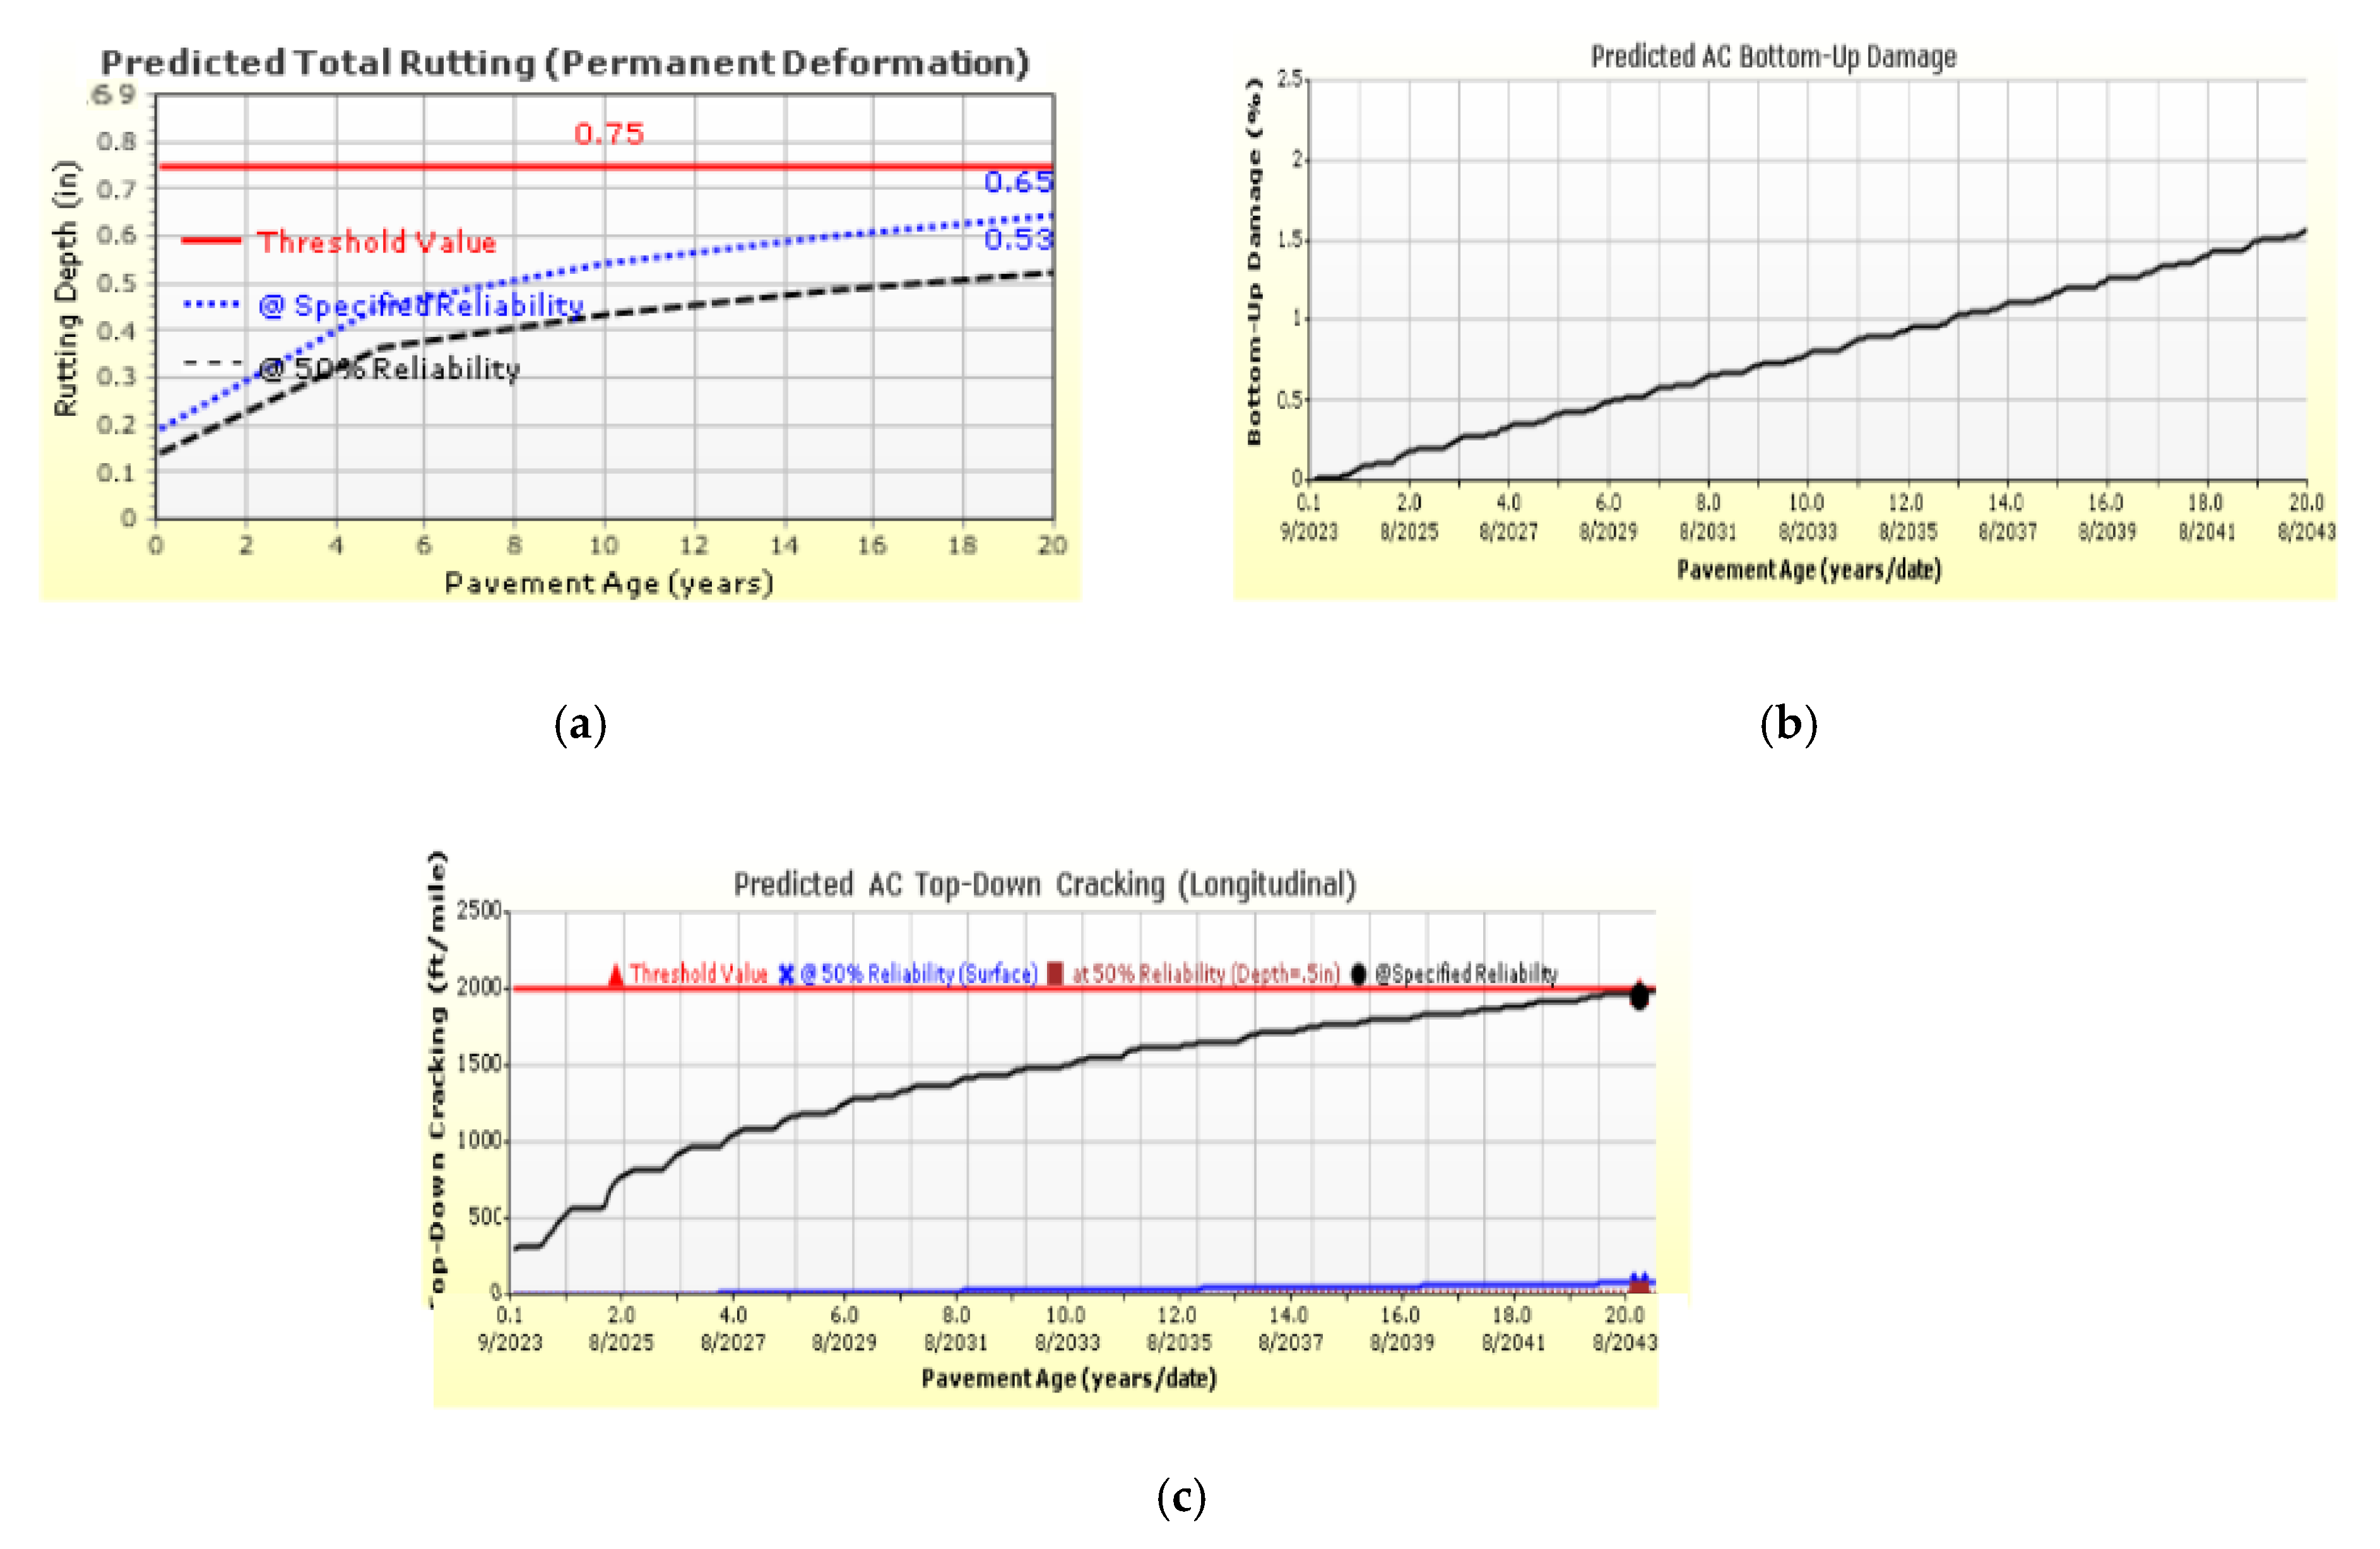
Figure 14 shows the results of the predicted total rutting and the predicted AC bottom-up and top-down cracking for the newly modified pavement section developed, taking into account the high traffic level only, as it has the greatest impact on the pavement.
As shown in the figure, the newly modified section reaches a total predicted permanent deformation of 0.65 inches at the end of the pavement service life, which is higher than the total predicted permanent deformation of the original section. However, the modified pavement section shows no failures. This new section reached only 1.5% of bottom-up damage after 20 years. Nevertheless, it almost reaches the limit of AC top-down cracking by the end of its service life but fails after 20 years.

6. Conclusions

This study provides a framework for the investigation of total rutting and predicts AC bottom-up and top-down cracking. For this purpose, five different scenarios were studied for three different traffic types using the AASHTOWare Pavement ME Design software. The following conclusions can be drawn from the results of this study:
  • In all scenarios, the integrated scenario where the autonomous trucks were disproportionally placed in one lane of the highway registered the worst results in both rutting and fatigue cracking analyses in the course of 2 years, registering AC top-down damage in high traffic during its service life.
  • The integrated scenario, where the trucks are equally distributed among all lanes, and the segregated scenario registered better results than the reference scenario in all cases.
  • For rutting, the segregated scenario, where the percentage of autonomous trucks is lower than 50%, developed the best results in all three types of traffic.
  • Regarding fatigue cracking, the integrated scenario, where the autonomous trucks were equally distributed among all lanes, registered the best results. However, the segregated scenario, where the trucks occupy one lane, also registered very close results.
Based on the research findings, it can be concluded that the best scenario that can be taken into action is the segregated scenario where the autonomous trucks occupy one lane of the highway. Since this case is only applied when the percentage of autonomous trucks is less than 50%, it also showed that for percentages higher than 50%, the integrated scenario where the autonomous trucks are equally distributed across all lanes can be applied.

7. Future Works

In this study, only one climate was taken into account. Thus, in future work, several climates can be taken into account to compare the effects of autonomous trucks on road infrastructure.
Another area that needs to be studied is whether autonomous trucks in this case are good for the economy. In this paper, we concluded that with the use of autonomous vehicles, it is possible to reduce the thickness of the pavement, which is good for the economy. Further studies need to be conducted to determine whether the use of autonomous trucks will benefit the economy in terms of fuel consumption and congestion.
In addition, this study only works on long highways, without taking into account any intersecting roadways. Further studies need to be conducted to determine how truck platooning and autonomous vehicles should work when faced with an intersection or a roundabout. It also needs to be taken into account how autonomous and non-autonomous vehicles must behave together on a single road.

Author Contributions

Conceptualization, R.J. and G.H.M.; methodology, A.E.; validation, R.J. and A.E.; formal analysis, A.E.; investigation, G.H.M.; resources, G.H.M.; data curation, R.J.; writing—original draft preparation, G.H.M.; writing—review and editing, R.J.; visualization, A.E.; supervision, R.J.; project administration, A.E. All authors have read and agreed to the published version of the manuscript.

Funding

This research received no external funding.

Institutional Review Board Statement

Not applicable.

Informed Consent Statement

Not applicable.

Data Availability Statement

Not applicable.

Conflicts of Interest

The authors declare no conflict of interest.

References

  1. Noorvand, H.; Karnati, G.; Underwood, B.S. Autonomous vehicles: Assessment of the implications of truck positioning on flexible pavement performance and design. Transp. Res. Rec. 2017, 2640, 21–28. [Google Scholar] [CrossRef]
  2. Chen, F.; Song, M.; Ma, X.; Zhu, X. Assess the impacts of different autonomous trucks’ lateral control modes on asphalt pavement performance. Transp. Res. Part C Emerg. Technol. 2019, 103, 17–29. [Google Scholar] [CrossRef]
  3. Wang, Z.; Bian, Y.; Shladover, S.E.; Wu, G.; Li, S.E.; Barth, M.J. A survey on cooperative longitudinal motion control of multiple connected and automated vehicles. IEEE Intell. Transp. Syst. Mag. 2019, 12, 4–24. [Google Scholar] [CrossRef] [Green Version]
  4. Xia, X.; Meng, Z.; Han, X.; Li, H.; Tsukiji, T.; Xu, R.; Ma, J. An automated driving systems data acquisition and analytics platform. Transp. Res. Part C: Emerg. Technol. 2023, 151, 104120. [Google Scholar] [CrossRef]
  5. Xia, X.; Hashemi, E.; Xiong, L.; Khajepour, A. Autonomous Vehicle Kinematics and Dynamics Synthesis for Sideslip Angle Estimation Based on Consensus Kalman Filter. IEEE Trans. Control. Syst. Technol. 2022, 31, 179–192. [Google Scholar] [CrossRef]
  6. Meng, Z.; Xia, X.; Xu, R.; Liu, W.; Ma, J. HYDRO-3D: Hybrid Object Detection and Tracking for Cooperative Perception Using 3D LiDAR. IEEE Trans. Intell. Veh. 2023, 1–13. [Google Scholar] [CrossRef]
  7. Gkartzonikas, C.; Gkritza, K. What have we learned? A review of stated preference and choice studies on autonomous vehicles. Transp. Res. Part C Emerg. Technol. 2019, 98, 323–337. [Google Scholar] [CrossRef]
  8. Leiva-Padilla, P.; Blanc, J.; Hammoum, F.; Salgado, A.; Chailleux, E.; Mateos, A.; Hornych, P. The impact of truck platooning action on asphalt pavement: A parametric study. Int. J. Pavement Eng. 2022, 1–11. [Google Scholar] [CrossRef]
  9. Neubauer, M.; Schauer, O.; Schildorfer, W. A scenario-based investigation of truck platooning acceptance. In Advances in Human Factors of Transportation, Proceedings of the AHFE 2019 International Conference on Human Factors in Transportation, Washington DC, USA, 24–28 July 2019; Springer International Publishing: Berlin/Heidelberg, Germany, 2020; pp. 453–461. [Google Scholar] [CrossRef]
  10. Doan, T.L.; Nguyen, T.G. Dynamic Analysis of the Laminated Composite Plate Resting on Two-Parameter Elastic Foundation Subjected to Moving Mass Using Finite Element Method. J. Sci. Tech. 2019, 14. [Google Scholar] [CrossRef]
  11. Mallik, R.B.; El-Korchi, T. (Eds.) Pavement Engineering: Principles and Practice, 2nd ed.; CRC Press: Boca Raton, FL, USA, 2013. [Google Scholar] [CrossRef]
  12. Darter, M.I.; Titus-Gl, O.L.; Von Quintus, H.; Bhattacharya, B.B.; Jagannath, M. Calibration and Implementation of the AASHTO Mechanistic-Empirical Pavement Design Guide in Arizona (No. FHWA-AZ-14-606); The Arizona Transportation Research Center: Phoenix, AZ, USA, 2014. [Google Scholar]
  13. Litman, T. Autonomous Vehicle Implementation Predictions; Victoria Transport Policy Institute: Victoria, BC, Canada, 2017; p. 28. [Google Scholar]
  14. Gungor, O.E.; Al-Qadi, I.L. All for one: Centralized optimization of truck platoons to improve roadway infrastructure sustainability. Transp. Res. Part C Emerg. Technol. 2020, 114, 84–98. [Google Scholar] [CrossRef]
  15. Browand, F.; McArthur, J.; Radovich, C. Fuel Saving Achieved in the Field Test of Two Tandem Trucks; Report No. UCB-ITS-PRR-2004-20. California Path Research Report; University of Soutehrn California: Los Angeles, CA, USA, 2004. [Google Scholar]
  16. Gungor, O.E.; She, R.; Al-Qadi, I.L.; Ouyang, Y. One for all: Decentralized optimization of lateral position of autonomous trucks in a platoon to improve roadway infrastructure sustainability. Transp. Res. Part C Emerg. Technol. 2020, 120, 102783. [Google Scholar] [CrossRef]
  17. Fagnant, D.J.; Kockelman, K. Preparing a nation for autonomous vehicles: Opportunities, barriers and policy recommendations. Transp. Res. Part A Policy Pract. 2015, 77, 167–181. [Google Scholar] [CrossRef]
  18. Kawa, I.; Zhang, Z.; Hudson, W.R. Evaluation of the AASHTO 18-Kip Load Equivalency Concept; Center for Transportation Research, Bureau of Engineering Research, University of Texas at Austin: Austin, TX, USA, 1998; Volume 7. [Google Scholar]
  19. Gungor, O.E.; Al-Qadi, I.L. Wander 2D: A flexible pavement design framework for autonomous and connected trucks. Int. J. Pavement Eng. 2022, 23, 121–136. [Google Scholar] [CrossRef]
  20. Ahammed, M.A.; Kass, S.; Hilderman, S. Implementing the AASHTOWare pavement ME design guide: Manitoba issues and proposed approaches. In Proceedings of the 2013 Conference and Exhibition of the Transportation Association of Canada-Transportation: Better-Faster-Safer, Ottawa, ON, Canada, 22–25 September 2013. [Google Scholar]
  21. Rana, M.M.; Hossain, K. Simulation of autonomous truck for minimizing asphalt pavement distresses. Road Mater. Pavement Des. 2022, 23, 1266–1286. [Google Scholar] [CrossRef]
  22. Kassem, H.A.; Chehab, G.R.; Najjar, S.S. Quantification of the inherent uncertainty in the relaxation modulus and creep compliance of asphalt mixes. Mech. Time-Depend. Mater. 2018, 22, 331–350. [Google Scholar] [CrossRef]
  23. Bose, A.; Ioannou, P.A. Analysis of traffic flow with mixed manual and semiautomated vehicles. IEEE Trans. Intell. Transp. Syst. 2003, 4, 173–188. [Google Scholar] [CrossRef] [Green Version]
  24. Hamdar, Y.; Kassem, H.; Srour, I.; Chehab, G. Performance-based specifications for sustainable pavements: A lean engineering analysis. Energy Procedia 2015, 74, 453–461. [Google Scholar] [CrossRef] [Green Version]
  25. Joumblat, R.; Al Basiouni Al Masri, Z.; Al Khateeb, G.; Elkordi, A.; El Tallis, A.R.; Absi, J. State-of-the-Art Review on Permanent Deformation Characterization of Asphalt Concrete Pavements. Sustainability 2023, 15, 1166. [Google Scholar] [CrossRef]
  26. Pierce, L.M.; McGovern, G. Implementation of the AASHTO Mechanistic-Empirical Pavement Design Guide and Software; No. Project 20-05, Topic 44-06; The National Academies of Sciences, Engineering, and Medicine: Washington, DC, USA, 2014. [Google Scholar]
  27. Gungor, O.E. Final Report: A Literature Review on Wheel Wander; Illinois Asphalt Pavement Association: Springfield, IL, USA, 2018. [Google Scholar]
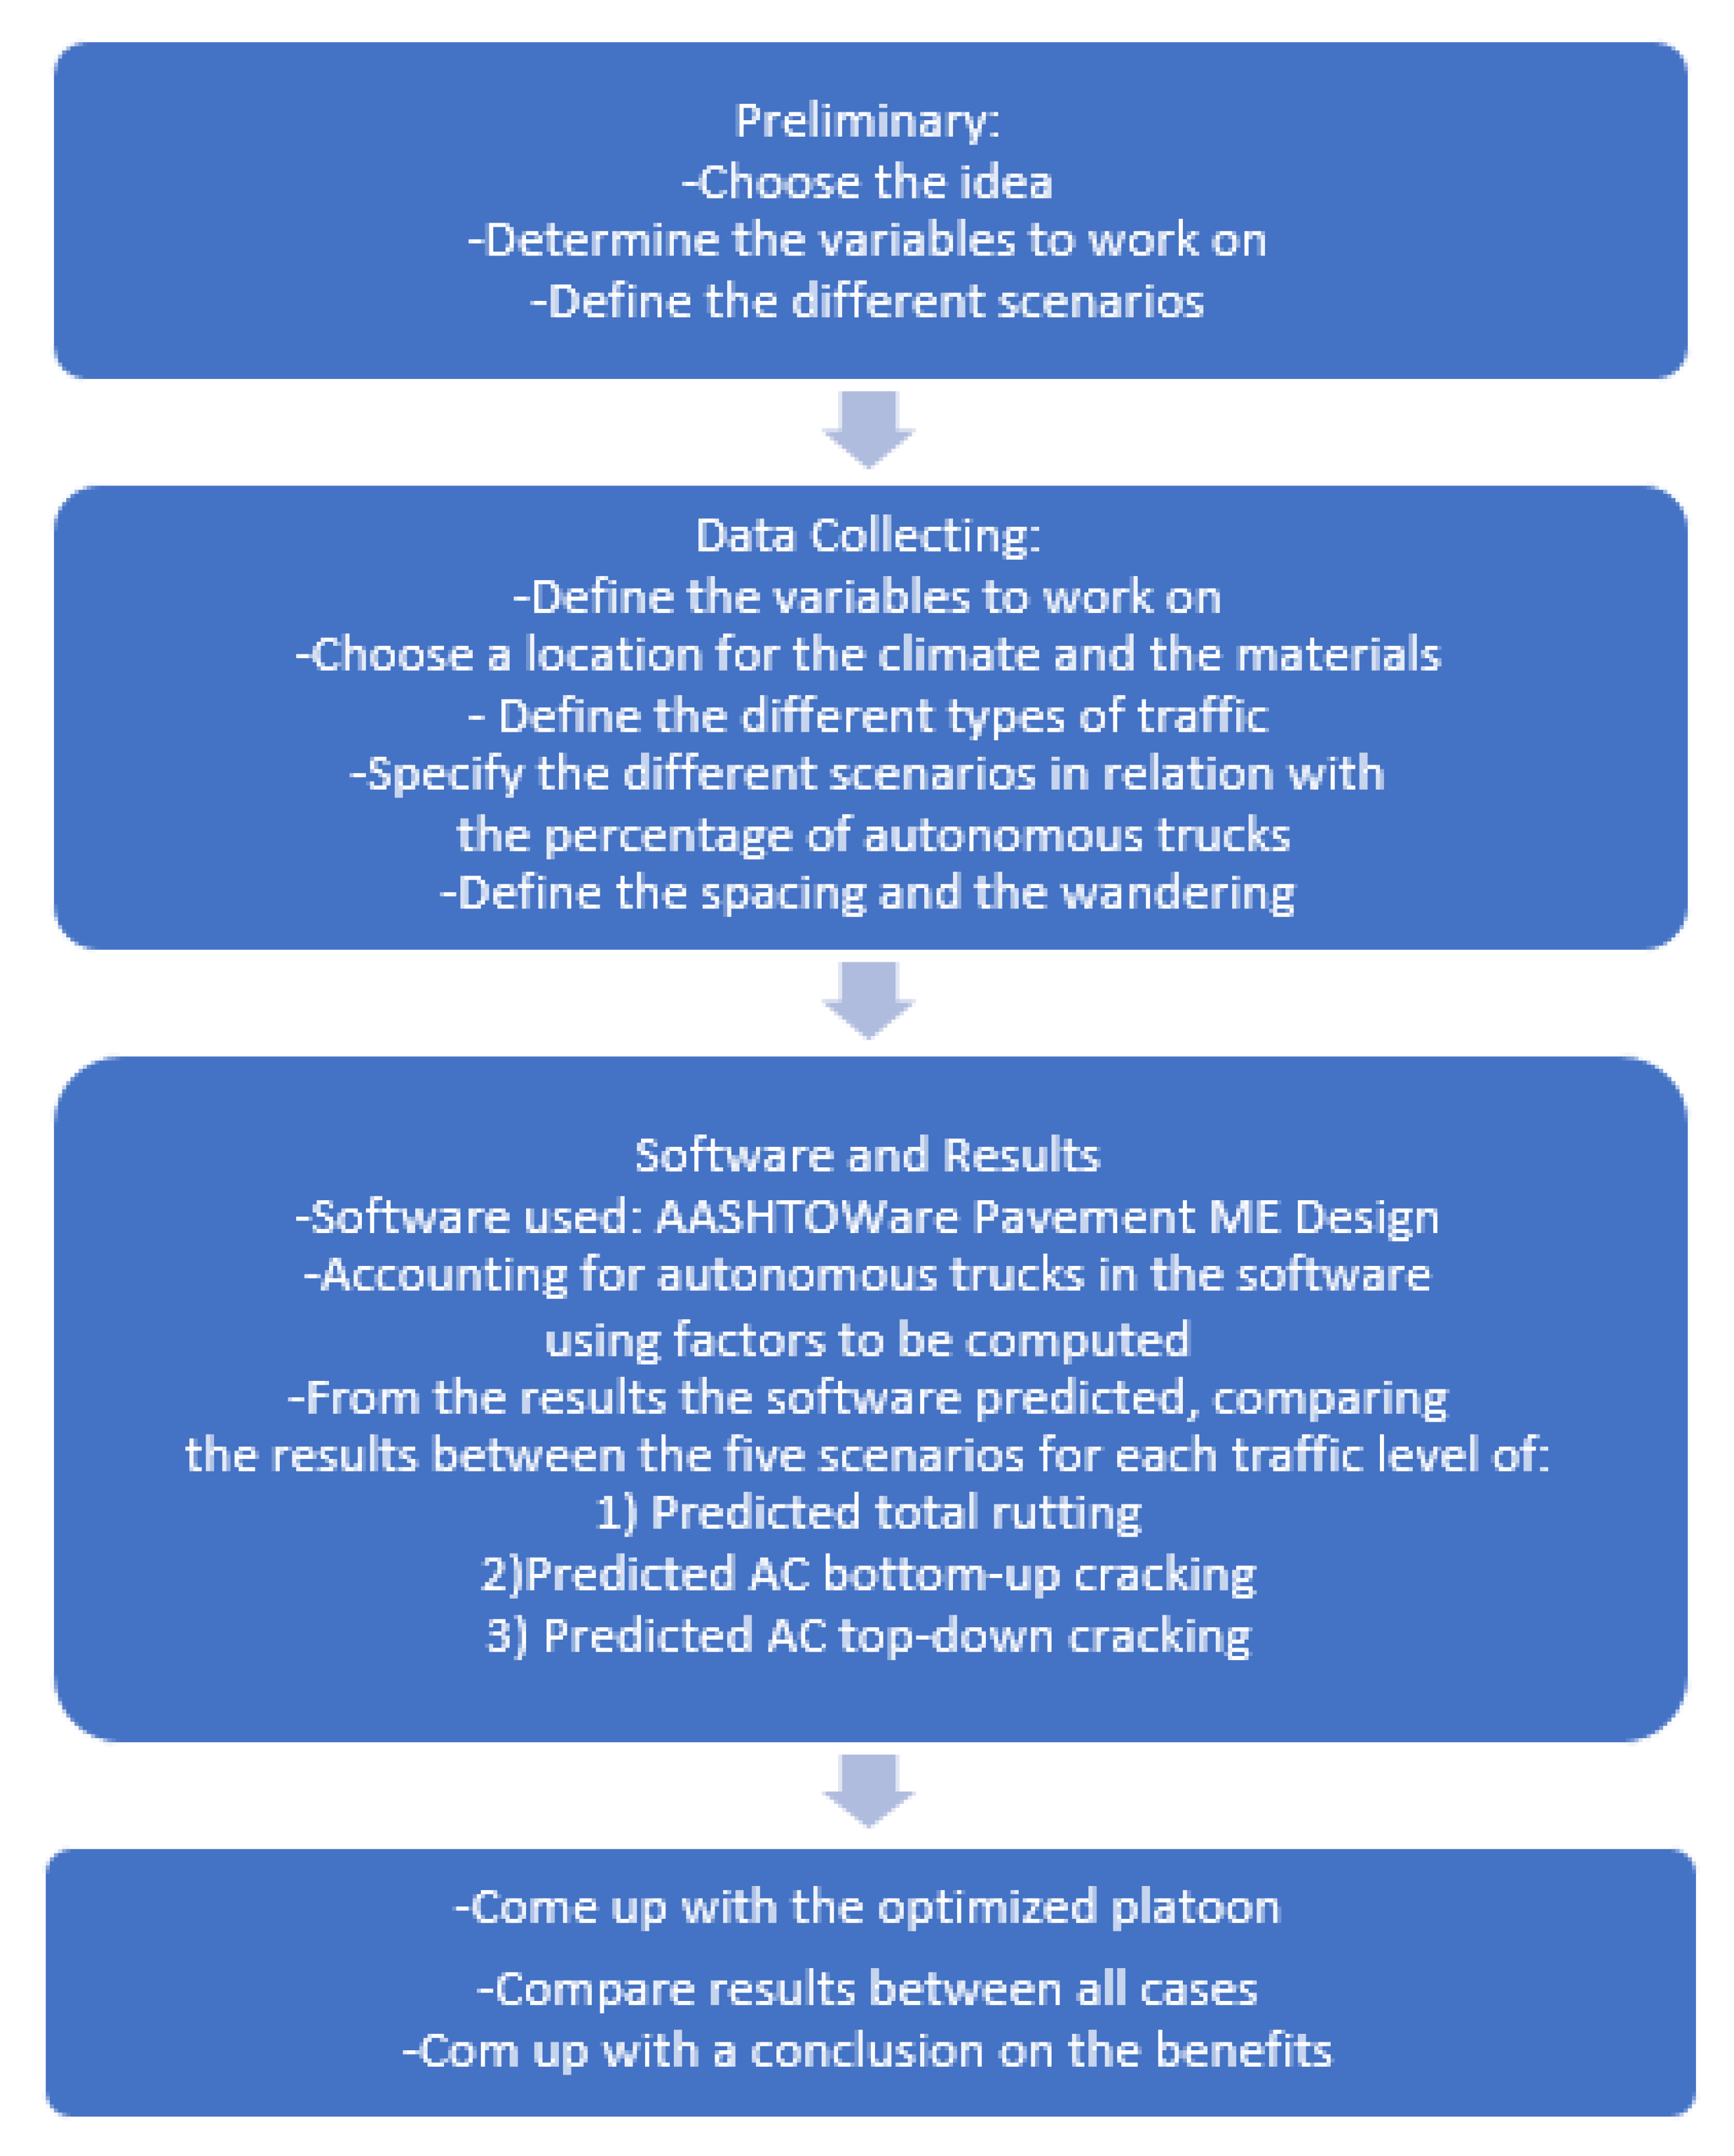
Figure 1. Methodology program.
Sustainability 15 10805 g001
Figure 2. Pavement section from AASHTOWare Pavement ME Design.
Sustainability 15 10805 g002
Figure 3. (a) Predicted total rutting for AADTT = 500 trucks/day of the reference scenarios. (b) Predicted total rutting for AADTT = 500 trucks/day of the integrated scenario where LD = 70%. (c) Predicted total rutting for AADTT = 500 trucks/day of the integrated scenario where LD = 33.3%. (d) Predicted total rutting for AADTT = 500 trucks/day of the segregated scenario where AT < 50%. (e) Predicted total rutting for AADTT = 500 trucks/day of the segregated scenario where AT > 50%.
Sustainability 15 10805 g003
Figure 4. (a) Predicted total rutting for AADTT = 1000 trucks/day of the reference scenarios. (b) Predicted total rutting for AADTT = 1000 trucks/day of the integrated scenario where LD = 70%. (c) Predicted total rutting for AADTT = 1000 trucks/day of the integrated scenario where LD = 33.3%. (d) Predicted total rutting for AADTT = 1000 trucks/day of the segregated scenario where AT < 50%. (e) Predicted total rutting for AADTT = 1000 trucks/day of the segregated scenario where AT > 50%.
Sustainability 15 10805 g004
Figure 5. (a) Predicted total rutting for AADTT = 2000 trucks/day of the reference scenarios. (b) Predicted total rutting for AADTT = 2000 trucks/day of the integrated scenario where LD = 70%. (c) Predicted total rutting for AADTT = 2000 trucks/day of the integrated scenario where LD = 33.3%. (d) Predicted total rutting for AADTT = 1000 trucks/day of the segregated scenario where AT < 50%. (e) Predicted total rutting for AADTT = 1000 trucks/day of the segregated scenario where AT > 50%.
Sustainability 15 10805 g005
Figure 6. (a) Predicted AC bottom-up cracking for AADTT = 500 trucks/day of the reference scenarios. (b) Predicted AC bottom-up cracking for AADTT = 500 trucks/day of the integrated scenario where LD = 70%. (c) Predicted AC bottom-up cracking for AADTT = 500 trucks/day of the integrated scenario where LD = 70%. (d) Predicted AC bottom-up cracking for AADTT = 500 trucks/day of the segregated scenario where AT < 50%. (e) Predicted AC bottom-up cracking for AADTT = 500 trucks/day of the segregated scenario where AT < 50%.
Sustainability 15 10805 g006aSustainability 15 10805 g006b
Figure 7. (a) Predicted AC bottom-up cracking for AADTT = 1000 trucks/day of the reference scenarios. (b) Predicted AC bottom-up cracking for AADTT = 1000 trucks/day of the integrated scenario where LD = 70%. (c) Predicted AC bottom-up cracking for AADTT = 1000 trucks/day of the integrated scenario where LD = 70%. (d) Predicted AC bottom-up cracking for AADTT = 1000 trucks/day of the segregated scenario where AT < 50%. (e) Predicted AC bottom-up cracking for AADTT = 1000 trucks/day of the segregated scenario where AT < 50%.
Sustainability 15 10805 g007aSustainability 15 10805 g007b
Figure 8. (a) Predicted AC bottom-up cracking for AADTT = 1000 trucks/day of the reference scenarios. (b) Predicted AC bottom-up cracking for AADTT = 1000 trucks/day of the integrated scenario where LD = 70%. (c) Predicted AC bottom-up cracking for AADTT = 1000 trucks/day of the integrated scenario where LD = 70%. (d) Predicted AC bottom-up cracking for AADTT = 1000 trucks/day of the segregated scenario where AT < 50%. (e) Predicted AC bottom-up cracking for AADTT = 1000 trucks/day of the segregated scenario where AT < 50%.
Sustainability 15 10805 g008aSustainability 15 10805 g008b
Figure 9. (a) Predicted AC top-down cracking for AADTT = 500 trucks/day of the reference scenarios. (b) Predicted AC top-down cracking for AADTT = 500 trucks/day of the integrated scenario where LD = 70%. (c) Predicted AC top-down cracking for AADTT = 500 trucks/day of the integrated scenario where LD = 33.3%. (d) Predicted AC top-down cracking for AADTT = 500 trucks/day of the segregated scenario where AT < 50%. (e) Predicted AC top-down cracking for AADTT = 500 trucks/day of the segregated scenario where AT > 50%.
Sustainability 15 10805 g009
Figure 10. (a) Predicted AC top-down cracking for AADTT = 1000 trucks/day of the reference scenarios. (b) Predicted AC top-down cracking for AADTT = 1000 trucks/day of the integrated scenario where LD = 70%. (c) Predicted AC top-down cracking for AADTT = 1000 trucks/day of the integrated scenario where LD = 33.3%. (d) Predicted AC top-down cracking for AADTT = 1000 trucks/day of the segregated scenario where AT < 50%. (e) Predicted AC top-down cracking for AADTT = 1000 trucks/day of the segregated scenario where AT > 50%.
Sustainability 15 10805 g010
Figure 11. (a) Predicted AC top-down cracking for AADTT = 2000 trucks/day of the reference scenarios. (b) Predicted AC top-down cracking for AADTT = 2000 trucks/day of the integrated scenario where LD = 70%. (c) Predicted AC top-down cracking for AADTT = 2000 trucks/day of the integrated scenario where LD = 33.3%. (d) Predicted AC top-down cracking for AADTT = 2000 trucks/day of the segregated scenario where AT < 50%. (e) Predicted AC top-down cracking for AADTT = 2000 trucks/day of the segregated scenario where AT >50%.
Sustainability 15 10805 g011
Figure 12. Optimum skeleton for a platoon with 10 trucks.
Sustainability 15 10805 g012
Figure 13. Modified pavement section.
Sustainability 15 10805 g013
Figure 14. Predicted Rutting (a), bottom-up cracking (b), and top-down cracking (c) for the modified pavement section for a traffic level of 2000 trucks/day.
Sustainability 15 10805 g014
Table 1. Materials and properties used in the analysis.
PropertiesAsphalt BinderCement MixBaseSub-Base
Type of the MaterialsNominal Maximum Aggregate size = ¾″
Fines % in the mix = 4
Air Voids Content (%) = 5
Asphalt Content (%) = 10
¾″ maximum limestone aggregate size¾″ maximum size of crushed limestone1½″ maximum size of gravel
Physical PropertiesPerformance Graded
PG 58-34
28-day compressive strength = 32 MPaResilient Modulus of 140 MPa Resilient Modulus of 120 MPa
Strength Properties
(acc. to AASHTO 1993)
layer coefficient = 0.42 layer coefficient = 0.14layer coefficient = 0.12
Design Lane Width= 4.3
Table 2. Design of the flexible pavement structure.
Subgrade Type and Resilient ModulusDesign (20-Year)
ESALs × 106
(Truck Factor = 3.25)
Bituminous
Layer
Thickness
(Inches)
Granular A
Base Thickness
(Inches)
Granular C
Base
Thickness
(Inches)
Fine Sand (A-2-4), Mr = 150 MPa28.86.5810
Table 3. Percentage distribution of vehicle class.
Vehicle ClassDistribution (%)Growth Rate (%)
Class 43.31
Class 5341
Class 611.71
Class 71.61
Class 89.91
Class 936.21
Class 1011
Class 111.81
Class 120.21
Class 130.31
Table 4. Three different scenarios for lane distribution of autonomous trucks.
Reference Scenario (a)Integrated Scenario (b)Segregated Scenario (c)
Only non-autonomous trucks use the highway(AT) and (NAT) share the same lanes simultaneously. Both operate in the same way following the same traffic rules.(AT) and (NAT) use a dedicated lane. When the (AT) volume is >50%, it is allocated to two lanes, whereas when the (AT) volume is <50%, it is allocated to only a single lane.
b-1b-2c-1c-2
The rules of lane distribution for (NAT) are applied to (AT), e.g., (AT) would disproportionately position themselves in one lane of the highway.(AT) will equally distribute themselves across all lanes of the road.
Analysis proposes distributing (AT) across all lanes; in this way, it could significantly smooth traffic during congestion [19].
The lane distribution of (AT) is the same as the lane distribution of (NAT).When the (AT) occupy more than one lane, they are equally split across lanes, which is the case only when (AT) volume is higher than 50%.
Table 5. Design lane distribution of autonomous and non-autonomous trucks.
ab-1b-2c-1c-2
AT < 50%AT > 50%
Lane Distribution70%70% for AT33.3% for AT100%50%
NAT < 50%NAT > 50%
100%90%
Table 6. Adjusted inputs of the AADTT for the different scenarios.
Scenarios
AADTT
Reference
(a)
Integrated (b)Segregated (c)
b-1b-2c-1c-2
500 trucks/day500Fatigue811400405452
Rutting680387325412
1000 trucks/day1000Fatigue1623801810905
Rutting1361775.65650825
2000 trucks/day2000Fatigue3246160316201810
Rutting2723155113001650
Disclaimer/Publisher’s Note: The statements, opinions and data contained in all publications are solely those of the individual author(s) and contributor(s) and not of MDPI and/or the editor(s). MDPI and/or the editor(s) disclaim responsibility for any injury to people or property resulting from any ideas, methods, instructions or products referred to in the content.