Article

Voltage Control Strategy for Low-Voltage Distribution Network with Distributed Energy Storage Participating in Regulation under Low-Carbon Background

1
College of Information and Electric Engineering, Shenyang Agricultural University, Shenyang 110866, China
2
Anshan Power Supply Company of State Grid, Anshan 114003, China
*
Author to whom correspondence should be addressed.
Sustainability 2023, 15(13), 9943; https://doi.org/10.3390/su15139943
Submission received: 11 May 2023 / Revised: 30 May 2023 / Accepted: 20 June 2023 / Published: 22 June 2023

Abstract

:
With the gradual advancement towards the goal of carbon neutrality, photovoltaic power generation, as a relatively mature zero-carbon power technology, will be connected to the grid in an increasing proportion. A voltage control strategy, involving distributed energy storage, is proposed in order to solve the voltage deviation problem caused by the high proportion of PV connected to the low voltage distribution network (LVDN). A voltage calculation method of the LVDN node with a high proportion of PV is proposed. According to the voltage distribution of the LVDN nodes running throughout the day, fuzzy cluster analysis was used to partition the nodes in the LVDN. A two-objective mathematical model for optimizing distributed energy storage in a partition was constructed, and a particle swarm optimization algorithm was used to solve the model. A voltage control strategy based on sensitivity analysis is proposed, and a mathematical model is established to analyze the relationship between the node current increment and the node off-limit voltage. The mathematical relationship among the node off-limit voltage, node off-limit power and energy storage exchange power is derived, and the voltage deviation of the distribution network can be suppressed by adjusting the injected power of the distributed energy storage. Through case analysis, it is verified that the proposed voltage control strategy can reduce the voltage deviation of the distribution network nodes, effectively solve the problem of the distribution network voltage deviation, and reduce the active power loss.

1. Introduction

Under a low-carbon background, photovoltaic power generation, as a mature zero-carbon power supply technology, will play an important role in achieving the dual-carbon goal, and the proportion of access to the power grid will continue to increase [1]. After a high proportion of photovoltaic (PV) is connected to the distribution network, the distribution network will generate reverse power flow, which will lead to the node voltage exceeding the limit, and the voltage control strategy of the distribution network will face challenges [2,3,4,5]. The authors of [6] used the method of strengthening the network structure of the power system in order to improve the voltage deviation, but the cost was high [7]. In reference [8], reactive power regulation was carried out by changing the tap of the on-load voltage regulating transformer, so as to restrain the voltage from exceeding the limit, but this was limited by the terminal voltage at the end of distribution network. As explored by the authors of [9], according to the high R/X ratio of the low-voltage distribution network, the voltage is controlled by controlling the output power of photovoltaic power generation in the overvoltage period, but the active power of photovoltaic power generation output is reduced. In reference [10], the authors propose a new distributed voltage control strategy, which realizes low-cost and fast voltage control through reactive power coordination compensation and active power optimization reduction in the photovoltaic system. The authors of reference [11] proposed to improve the voltage curve by combining the reactive capacity of the photovoltaic inverter with the distributed energy storage system. However, these methods adopt a decentralized structure and need to be equipped with energy storage devices at each photovoltaic system, so it is difficult to realize the coordination of the distributed energy storage [12]. In reference [13], the authors develop a centralized controller in order to coordinate the voltage control of the generators connected with the inverter, but the reliability of the control system is highly dependent on the performance of the central controller. In reference [14], an intelligent charge/discharge control strategy of energy storage battery is proposed by the authors that uses the storage capacity to alleviate voltage deviation. The authors of [15] propose a control strategy of a balanced energy storage battery to maintain a unified state of charge (SOC) during operation, but the calculation method of exchange power is not given.
Aiming at the problem of the voltage exceeding the limit caused by a high proportion of distributed photovoltaic access to the low-voltage distribution network, this paper proposes a voltage control strategy based on sensitivity analysis. Firstly, the energy storage equipment is configured in the distribution network, the configuration nodes and capacity of energy storage are determined, and the node overlimit power and energy storage exchange power are calculated. By controlling the injection power of energy storage, the voltage deviation of the LVDN node can be adjusted and the voltage overlimit can be suppressed. Finally, the effectiveness of the proposed method is verified by the actual high proportion of photovoltaic LVDN. The specific contributions of this paper are as follows:
(1)
A mathematical model for calculating node voltage deviation and active power loss is established by taking a high proportion of photovoltaic LVDN as the research object;
(2)
Based on fuzzy clustering analysis, the nodes in the LVDN are divided into two levels;
(3)
Considering multiple constraint equations, a mathematical model of the optimal allocation of distributed energy storage in each partition is proposed, and the model is solved by particle swarm optimization;
(4)
Based on sensitivity analysis, the mathematical model describing the relationship between the node voltage increment and the node injection current increment is derived, and the mathematical formulas for calculating the node out-of-limit active power, and the distributed energy storage exchange power, are proposed, and the voltage control strategy based on sensitivity analysis is proposed.

2. Calculation of Voltage and Loss of Low-Voltage Distribution Network with High Proportion of Photovoltaic

2.1. Definition of High-Proportion Photovoltaic

High proportion photovoltaic is defined as the ratio of the total installed capacity to the peak load of the photovoltaic system [16,17], namely:
η = S pv S max . load × 100 %
where η is photovoltaic ratio, η ≥ 40% is defined as a high proportion; Spv is the total installed capacity of photovoltaic, kVA; and Smax.load is the apparent power of peak load, kVA.

2.2. Calculation of Node Voltage of Low Voltage Distribution Network

Suppose the total number of independent nodes in the low-voltage distribution network is N, the total number of nodes is N + 1, and the total number of branches is b. For the branch n(m,n), the first node is numbered m, the last node is numbered n, and n > m, n = 1…N.
Let the power of the outgoing node be positive and the power of the incoming node be negative. The equivalent load current of node i is calculated according to its injected power:
I ˙ i = ( P i + j Q i + Δ P i + j Δ Q i ) 3 U ˙ i
where I ˙ i is the equivalent load current of the node i (i = 1, 2…N), A; Pi and Qi are the active power (kW) and reactive power (kvar) of the node i load, respectively; Δ P i and Δ Q i are, respectively, the active power (kW) and reactive power (kvar) emitted by the PV at node i; and U ˙ i is the voltage of node i, kV.
The branch current of the distribution network is as follows [18]:
I · l = A 1 I ·
where I · l is the branch current column vector of the N × 1 distribution network, A; A is the node–branch association matrix, which is an N × N matrix; and I · is the column vector composed of the equivalent load current of each node, I ˙ = [ I ˙ 1 , I ˙ 2 , , I ˙ N ] T , A. In this paper, the current outflow node is positive and the inflow node is negative.
The voltage of distribution network nodes is as follows:
U · = U · r [ 3 × 10 3 × ( A 1 ) T Z I · l ]
where U · is the N × 1 node voltage column vector, kV; U · r is the N × 1 order reference node voltage column vector, and the same values of elements are node 0 voltage; and Z is the diagonal matrix composed of branch impedance, Ω.

2.3. Calculation of Active Power Loss in Low-Voltage Distribution Network

Branch active power loss can be expressed as:
P S = 3 × 10 3 × I · L R I · l
where P S is the column vector of branch active power loss, kW; I · L is the diagonal matrix composed of the conjugate of each branch current of the order N × N; and R is a diagonal matrix composed of N × N branch resistors, Ω.

2.4. Calculation of Voltage Deviation

The calculation of the voltage deviation of the low-voltage distribution network nodes is as follows:
μ i = U i U N U N × 100 %
where μi is the voltage deviation of node i, i = 1, 2… N; Ui is the voltage value of node i, kV; and UN is the rated voltage of the node and its value is 0.38 kV.
The node voltage deviation calculation steps are as follows:
(1)
Set the initial voltage of the node as the rated voltage;
(2)
Calculate the equivalent load current I · , and use Formula (3) to calculate the branch current of the distribution network I · l
(3)
Calculate the node voltage U · according to Formula (4);
(4)
If the voltage difference of each node in the calculation of two adjacent iterations is not within the allowed error range (1 × 10⁻⁵), then go back to step (2), otherwise go to step (5);
(5)
Calculate the node voltage deviation according to Formula (6), and output the voltage deviation value of each node.

3. Configuration of Distributed Energy Storage

In order to make better use of the distributed energy storage in order to regulate voltage, it is necessary to configure the distributed energy storage in zones to regulate the voltage of the distribution network nodes. Then, PSO was used to determine the location of the distributed energy storage access nodes and energy storage capacity, and the flexible and dynamic real-time adjustment function of the energy storage batteries was used to change the active power of the distributed photovoltaic injection system.

3.1. Zoning of Low-Voltage Distribution Network

The low-voltage distribution network generally operates in open loop [19,20]. The low-voltage distribution network is divided into two levels. The first-level division is carried out by lines, and each line is an area. Each line is partitioned at the second level. According to the fuzzy clustering analysis [20,21], the distribution line nodes are partitioned at the second level based on the time point voltage of the distribution line running throughout the day. The steps for level 2 partitioning are as follows:
(a) Data standardization
Let the total number of independent nodes of each distribution line be N1, Γ is the set of independent nodes of each distribution line, X = { x i , i Γ } is the set corresponding to the voltage deviation of independent nodes; standardize the data in X and transform xit into xit’:
x i t = x i t min { x j t } max { x j t }   ,   ( j Γ )
where xjt is the voltage deviation of the node j at time period t, t = 0, 2,…, 23.
(b) Fuzzy similarity matrix is established
In the time period t, the similarity degree between the classified objects xi and xj is expressed by the similarity coefficient rij:
r i j = t = 0 23 min ( x i t , x j t ) t = 1 23 max ( x i t , x j t )   ( i , j Γ )
The fuzzy similarity matrix is R ˜ = ( r i j ) N 1 × 24 .
(c) Establish fuzzy equivalent matrix
Using the square method to obtain the fuzzy equivalent matrix of R ˜ :
R ˜ = t ( R ˜ ) = R ˜ k = R ˜ 2 k = ( r ˜ i j ) N 1 × 24
where k is the smallest positive integer that makes Equation (9) valid and k ≥ 1.
(d) Clustering
Suppose that 0.4 ≤ λ ≤ 1. The matrix R ˜ λ = ( r ˜ i j ) N 1 × 24 is obtained by the cluster analysis of R ˜ with the λ cut matrix method. r ˜ i j is calculated according to the following formula. For any i, jΓ, ij, if r ˜ i t = r ˜ j t   t = 0 , 2 , , 23 , then xi and xj belong to the same class.
r ˜ i j = 1     λ r ˜ i j 1 0     0 r ˜ i j < λ

3.2. Mathematical Model of Distributed Energy Storage Configuration

After the distributed energy storage is configured, the voltage deviation and power loss of all nodes in the distribution network are minimal, namely:
min f 1 = i = 1 N t = 0 23 ( U i , t ( 1 ) U N U N U i , t ( 0 ) U N U N ) × 100 %
min f 2 = t = 0 23 l = 1 b P s . l t t 1
The constraint conditions are:
5 % μ i 5 %
I l I l . max
SOC min SOC ( t ) SOC max
1 ε d , t 1
where U i , t ( 0 ) and U i , t ( 1 ) are node voltages before and after the optimized configuration of the distributed energy storage; UN is the rated voltage of the node, kV; N is the total number of independent nodes; t is time, h; b is the number of branches; P s . l t is the active power loss of branch l in time period t, kW; t1 is a period length, h; I l and I l . m a x are the current of branch l and its maximum allowable value, A; SOCmin, SOCmax, and SOC(t) are the minimum and maximum allowable SOC values of the energy storage battery and the values of time period t, respectively; and ε d , t is the power adjustment function.

3.3. Solution Method

In this paper, PSO is adopted to solve the mathematical model in Section 3.2 and determine the location and capacity of distributed energy storage [22]. The specific process is shown in Figure 1. In PSO, multiple particles in the search space guide the updating of velocity and position according to global and individual optimality, and coevolution finds the optimal solution to the problem. The velocity updating formula is as follows [23]:
V i , d t + 1 = ω V i , d t + r 1 c 1 ( P i , d t x i , d t ) + r 2 c 2 ( G i , d t x i , d t )
where V i , d t is the velocity of the i particle at the t iteration; r1 and r2 represent random numbers uniformly distributed within (0,1); c1 is self-learning factor; c2 is the global learning factor; and ω is the inertia weight coefficient.
The position update formula is as follows:
X i , d t + 1 = X i , d t + V i , d t + 1
where X i , d t is the position of the i particle at the t iteration.

4. Voltage Control Strategy

Based on sensitivity analysis, the node off-limit power, and the energy storage exchange power, are calculated, and the node voltage is improved by the bidirectional regulation of the active power of the distributed energy storage injection system.

4.1. Sensitivity Analysis

According to Equation (4), the relationship between the node voltage increment and the branch current increment can be seen as follows:
Δ U · = 3 × 10 3 × ( A 1 ) T Z   Δ I · l
where Δ U · is the column vector of voltage increment of the N × 1 order node, kV and Δ I · l is the column vector of the increment of branch current of the order N × 1, A.
The relationship between the branch current increment and node injection current increment is shown in Equation (20):
Δ I · l = A 1 Δ I ·
where Δ I · is the column vector of the injected current increment at N × 1 order node, A.
According to Equations (19) and (20), the relationship between the node voltage increment and node injection current increment, based on sensitivity analysis, can be obtained:
Δ U · = M   Δ   I ·
where M is the sensitivity coefficient matrix of order N × N, M = 3 × 10 3 × ( A 1 ) T Z ( A 1 ) .

4.2. Power Calculation of Distributed Energy Storage Exchange

When the voltage of the node i in the low-voltage distribution network exceeds the limit, the off-limit active power of the node i is calculated based on the sensitivity analysis. The off-limit active power of the node i is as follows:
P e , i = Re ( U · S × Δ I · i + Δ U · i × I · s + Δ U · i × Δ I · i )
where P e , i is the off-limit active power of node i; U · S is the threshold voltage of the node i; I · s is the conjugate value of the equivalent load current in the critical state of the node i; Δ U · i is the overstepping voltage of the node i, calculated according to Equation (23); and Δ I · i is the conjugate value of the load current increment of the node i.
Δ U · i = Δ U · i                                                           0     t < 18 Δ U · i = k 1 × Δ U · i                                           18 t 23
where k1 is the correction coefficient.
The formula for calculating the total off-limit active power of the distribution network at a certain time is as follows:
Δ P Σ = i = 1 N P e , i
The goal of distributed energy storage control adopted in this paper is that the exchanged power of each energy storage battery is positively correlated with its own capacity. The calculation formula is as follows:
P ess , d = H k 2 k 3 i = 1 N P e , i d = 1 g C ess , d C ess , d
where H is the energy storage exchange power coefficient, and takes the maximum value of the ratio between the energy storage exchange power and the off-limit power of the distribution network; k2 is the error coefficient; k3 is the efficiency coefficient of the energy storage battery; Pess,d is the exchange power of the d energy storage battery, kW; Cess, d is the capacity of the d energy storage battery, kWh; and g is the number of distributed energy storage installations.
According to Formulas (21) and (22), the mathematical model of the energy storage battery exchange power and node overlimit voltage can be obtained, and the calculation formula is as follows:
P ess , d = H k 2 k 3 C ess , d d = 1 g C ess , d i = 1 N Re U · S × M - 1 Δ U · * ( i ) + Δ U · i × I · s + Δ U · i × M - 1 Δ U · * ( i )

4.3. Voltage Control Strategy Based on Sensitivity Analysis

The voltage control strategy, based on sensitivity analysis, is shown in Figure 2, where the solid line represents the power flow signal of the distribution network and the dashed line represents the control signal. In Figure 2, Pn is the rated power of the energy storage battery and ε(d,t) is the power adjustment function. When the distributed photovoltaic output is greater than the load demand, the power regulation function ε(d,t) is within the range of [–1, 0], and the energy storage system is charged. When the distributed PV output is less than the PV output or, at night, the PV output is 0, the energy storage system discharges when ε(d,t) is in the range [0, 1]. The power of the energy storage battery injection system is used to suppress the voltage deviation and realize voltage control, while satisfying the constraint conditions (13)~(16).

5. Example Analysis

In this paper, the low-voltage distribution network of a region is selected as an example, as shown in Figure 3, where N = 46, b = 46, 0~46 are node numbers. The busbar at the secondary side of the transformer is set as the reference node, whose number is 0. It is assumed that the voltage at node 0 is constant. The district has 1 non-industrial user, 40 residential lighting households, 4 agricultural production households, and 1 commercial electricity consumption household. Use JKLV-25 mm2 for the main line and JKLV-35 mm2 for the branch line. The power supply radius of this area is 649 m.
Figure 4 shows the typical daily load curve of different seasons in this area, and residents’ electricity consumption time is mainly concentrated from 8:00 to 12:00 and from 18:00 to 23:00. The photovoltaic capacity of each household is the same, and the photovoltaic output is basically the same.
Table 1 shows the distribution network zoning and distributed energy storage configuration nodes shown in Figure 3. A vanadium redox battery [24,25] is selected for the energy storage system; SOCmin and SOCmax are 10% and 90%, respectively.
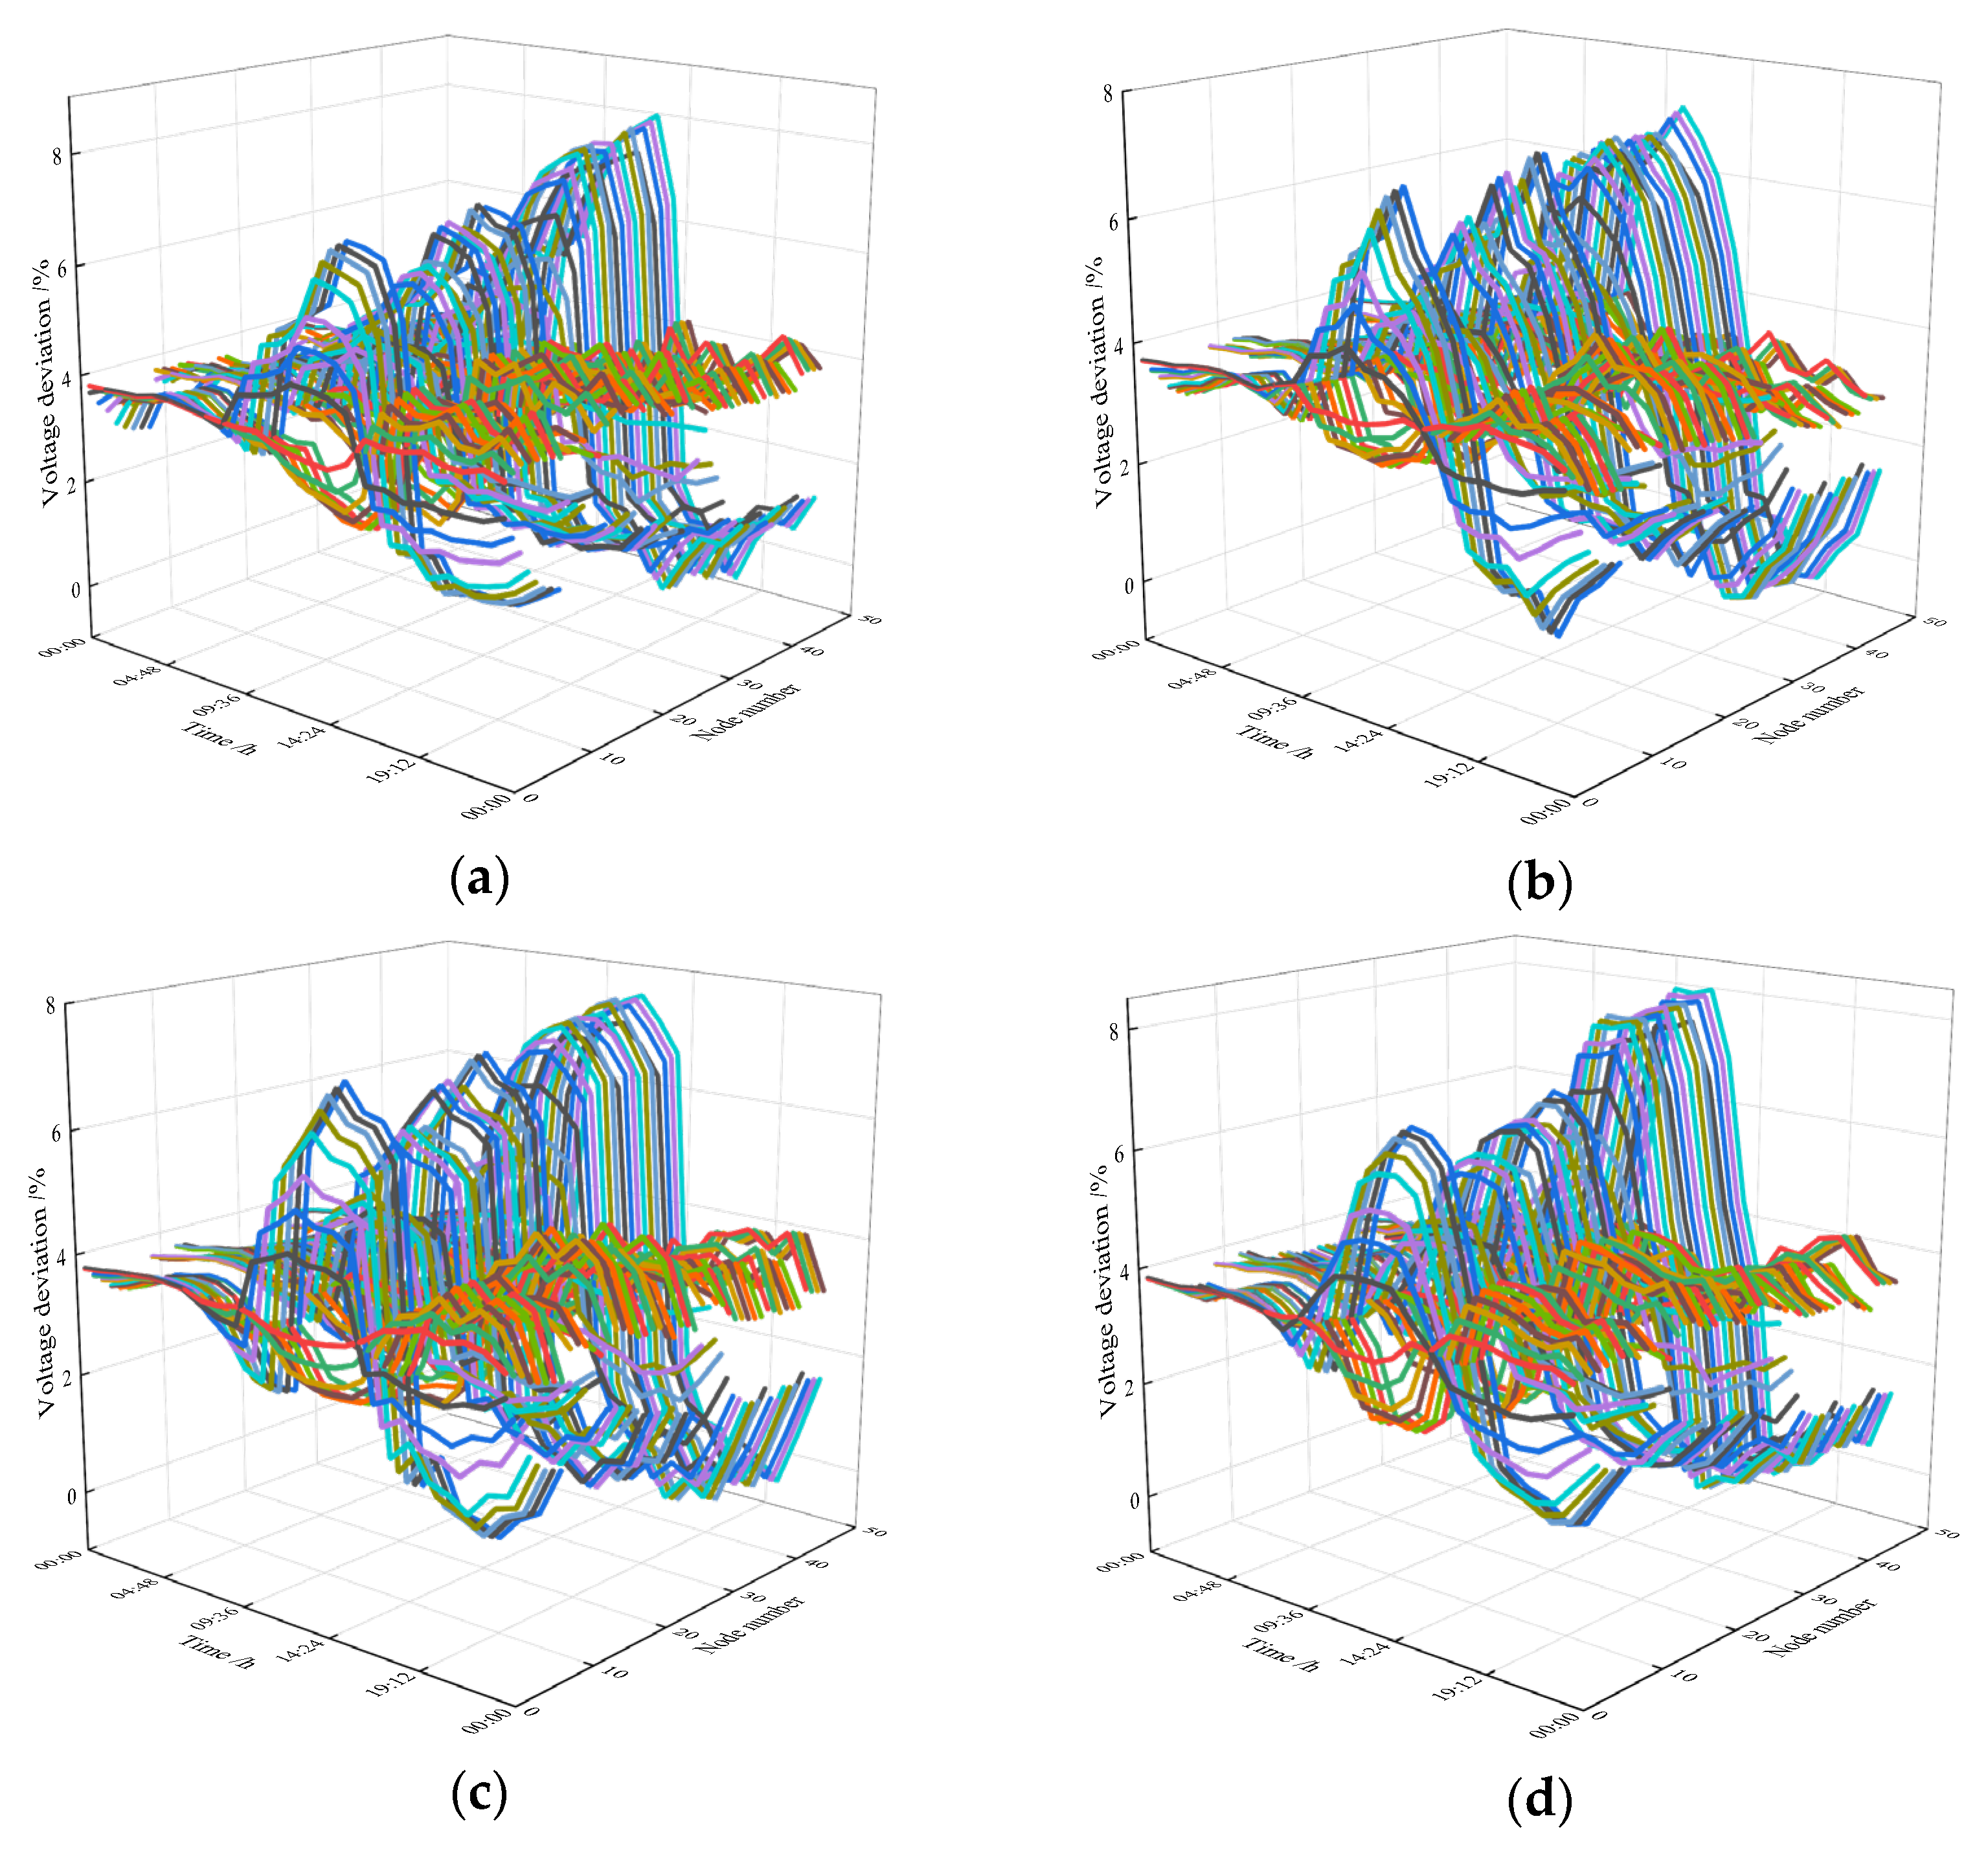
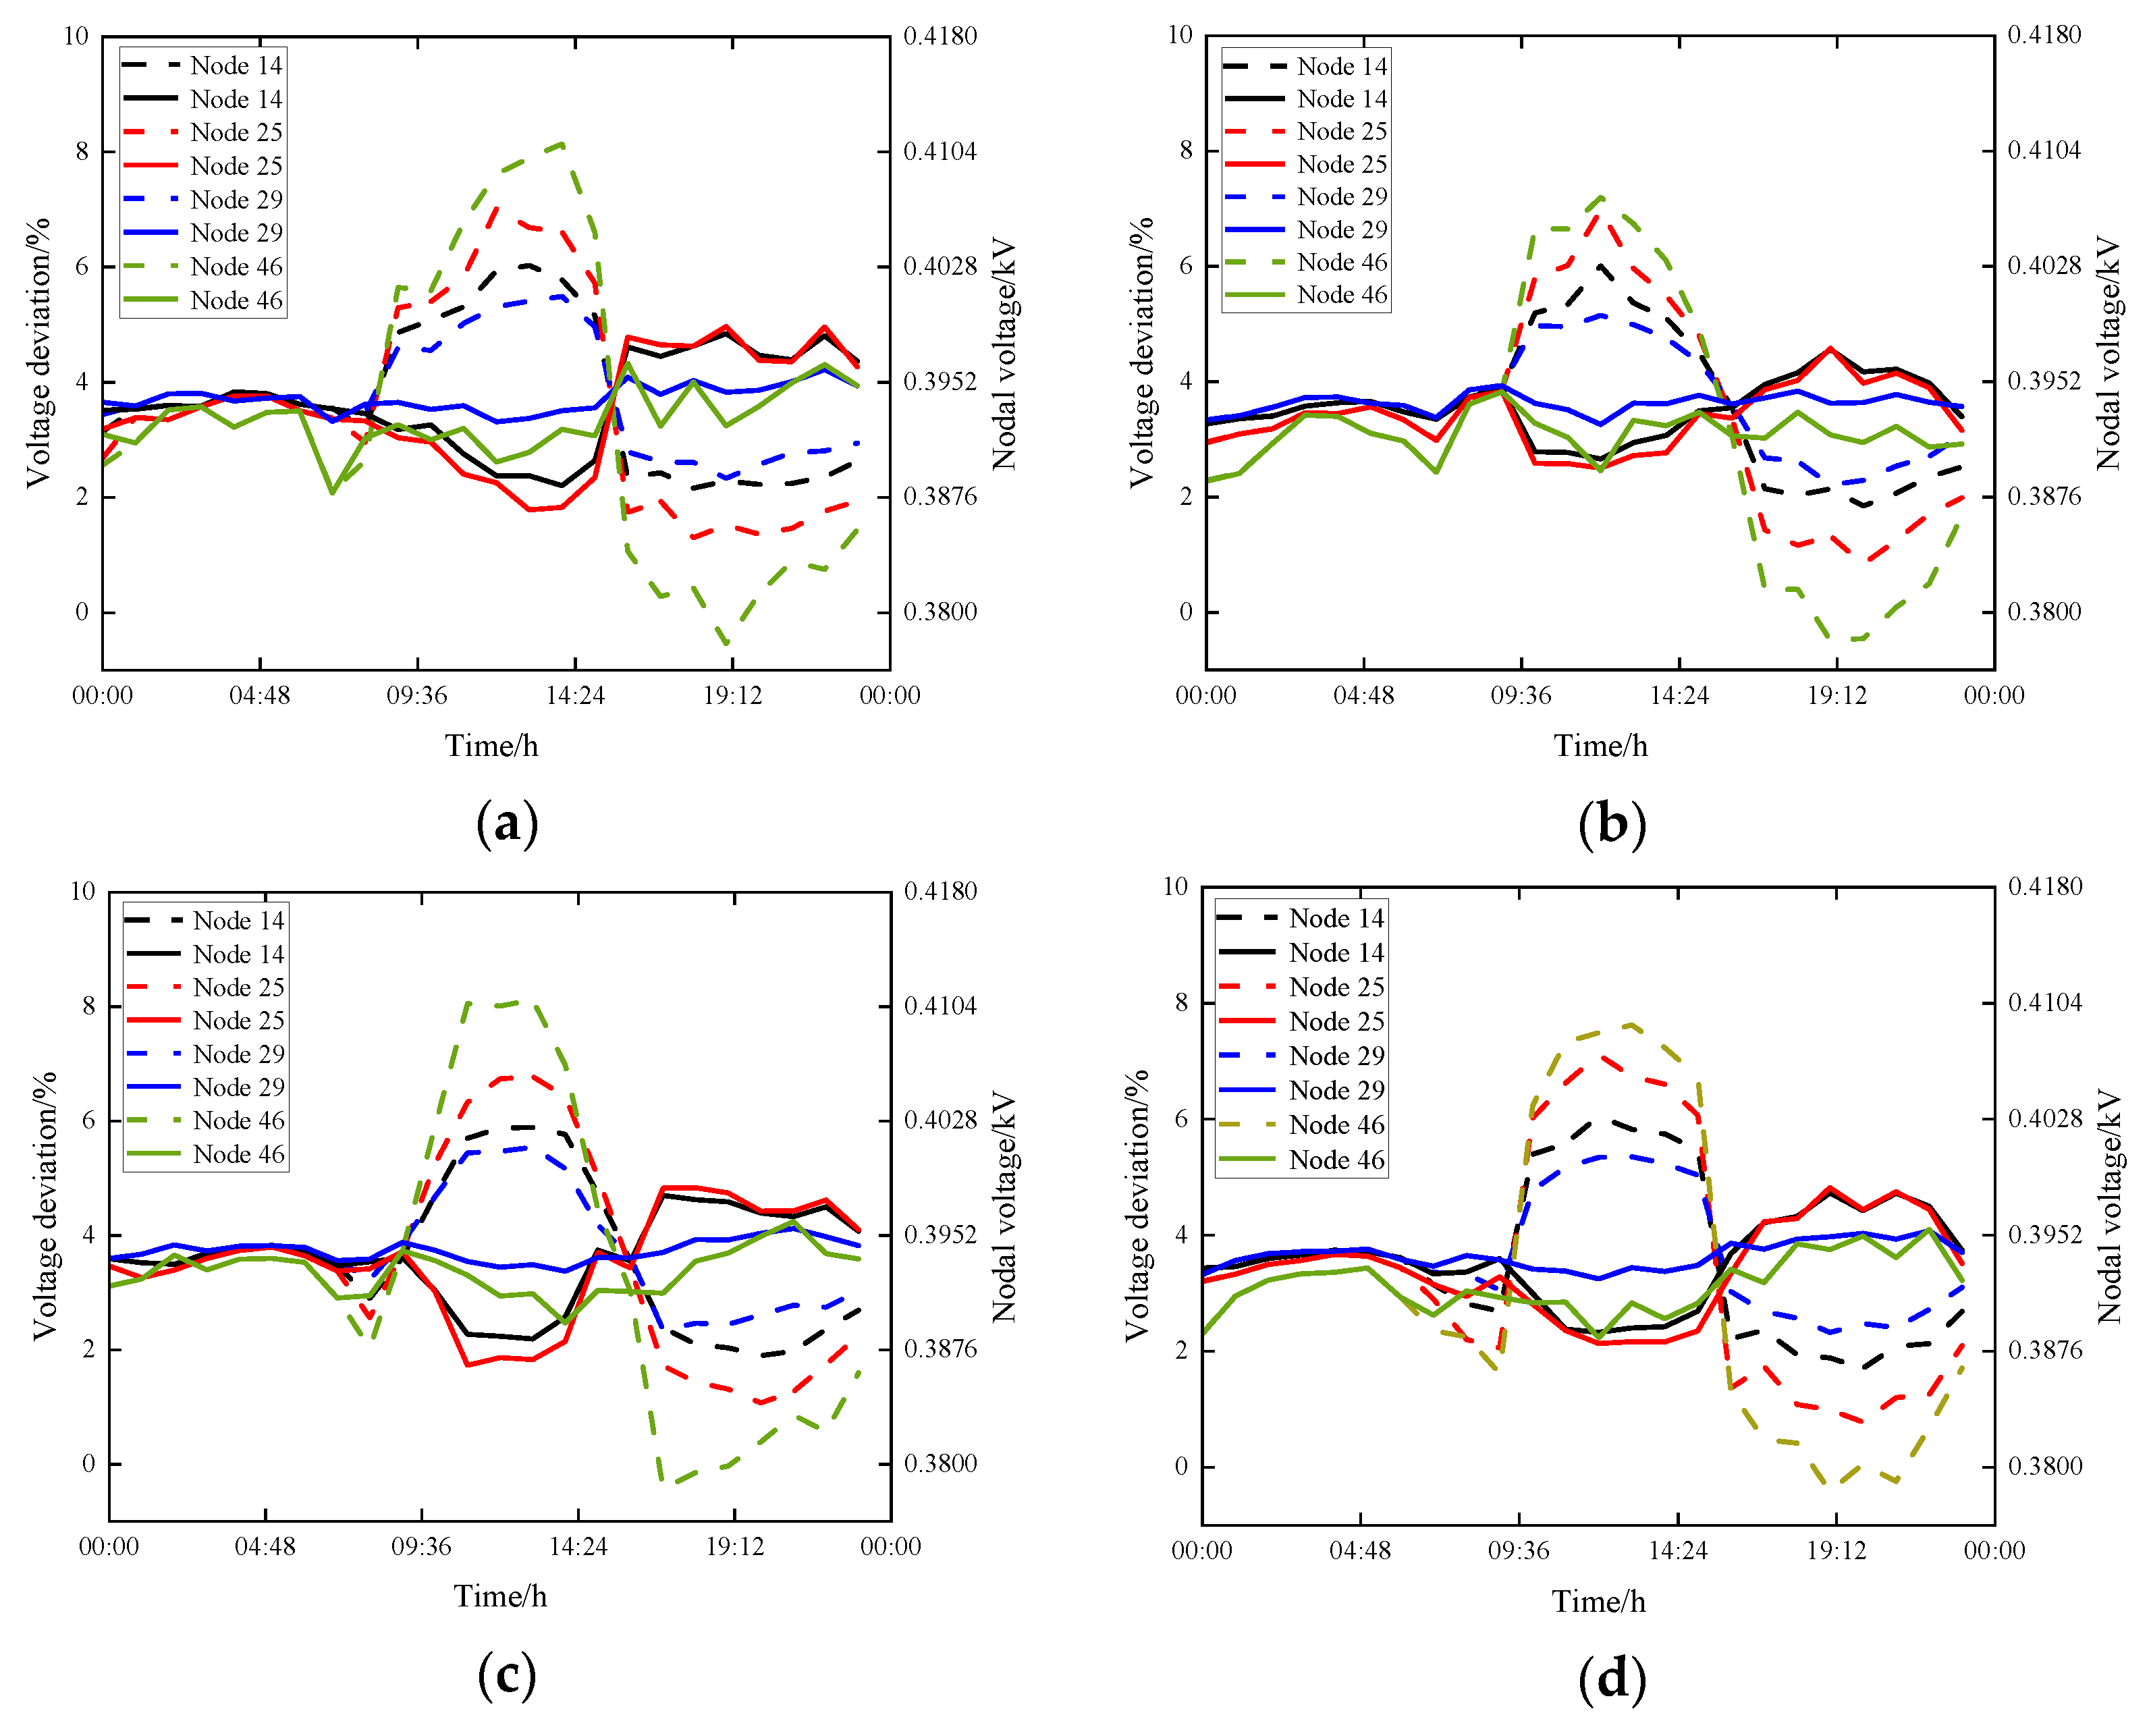
Figure 5 shows the 3D comparison of the node voltage deviation before and after adopting the proposed control strategy, in which the proportion of photovoltaic is 100%. Figure 5 shows the overall situation of the node voltage changes before and after optimization. In order to improve readability and more clearly represent the change trend of node voltage migration, typical load nodes (node 14, node 25, node 29, and node 46) are selected for further explanation. Other node changes are within the range. As shown in Figure 6, the dotted line represents the voltage deviation curve of the distribution network nodes before the control strategy is adopted, while the solid line represents the voltage deviation curve of the distribution network nodes after the control strategy is adopted. As can be seen from Figure 6, from 0:00 to 9:00, the voltage is in the normal range, and the energy storage does not move. From 10:00 to 16:00, the node voltage deviation is serious, which exceeds the voltage deviation range specified by the low-voltage distribution network +7% [26], and the maximum value of the node voltage offset reaches 8.14%. After adopting the control strategy in this paper, the node voltage deviation is controlled within the specified range. From 17:00 to 23:00, the voltage of some nodes is lower than the lower voltage threshold, and the energy storage sends out power to raise the voltage, so that the node voltage becomes stable and the SOC of the energy storage battery decreases.
The overlimit node voltage and voltage deviation pairs, before and after energy storage control at 12:00 in different seasons, are shown in Table 2. Node 29 is the minimum node voltage deviation point at this moment, and node 46 is the maximum node voltage deviation point. In the comprehensive consideration of energy storage battery storage power loss, the active power loss before and after the energy storage control branches and the energy storage battery exchange power are shown in Table 3. As can be seen from Table 2 and Table 3, the node voltage control strategy proposed in this paper based on sensitivity analysis has a good adjustment effect on all the nodes exceeding the limit, and reduces the active power loss of the distribution network branches.
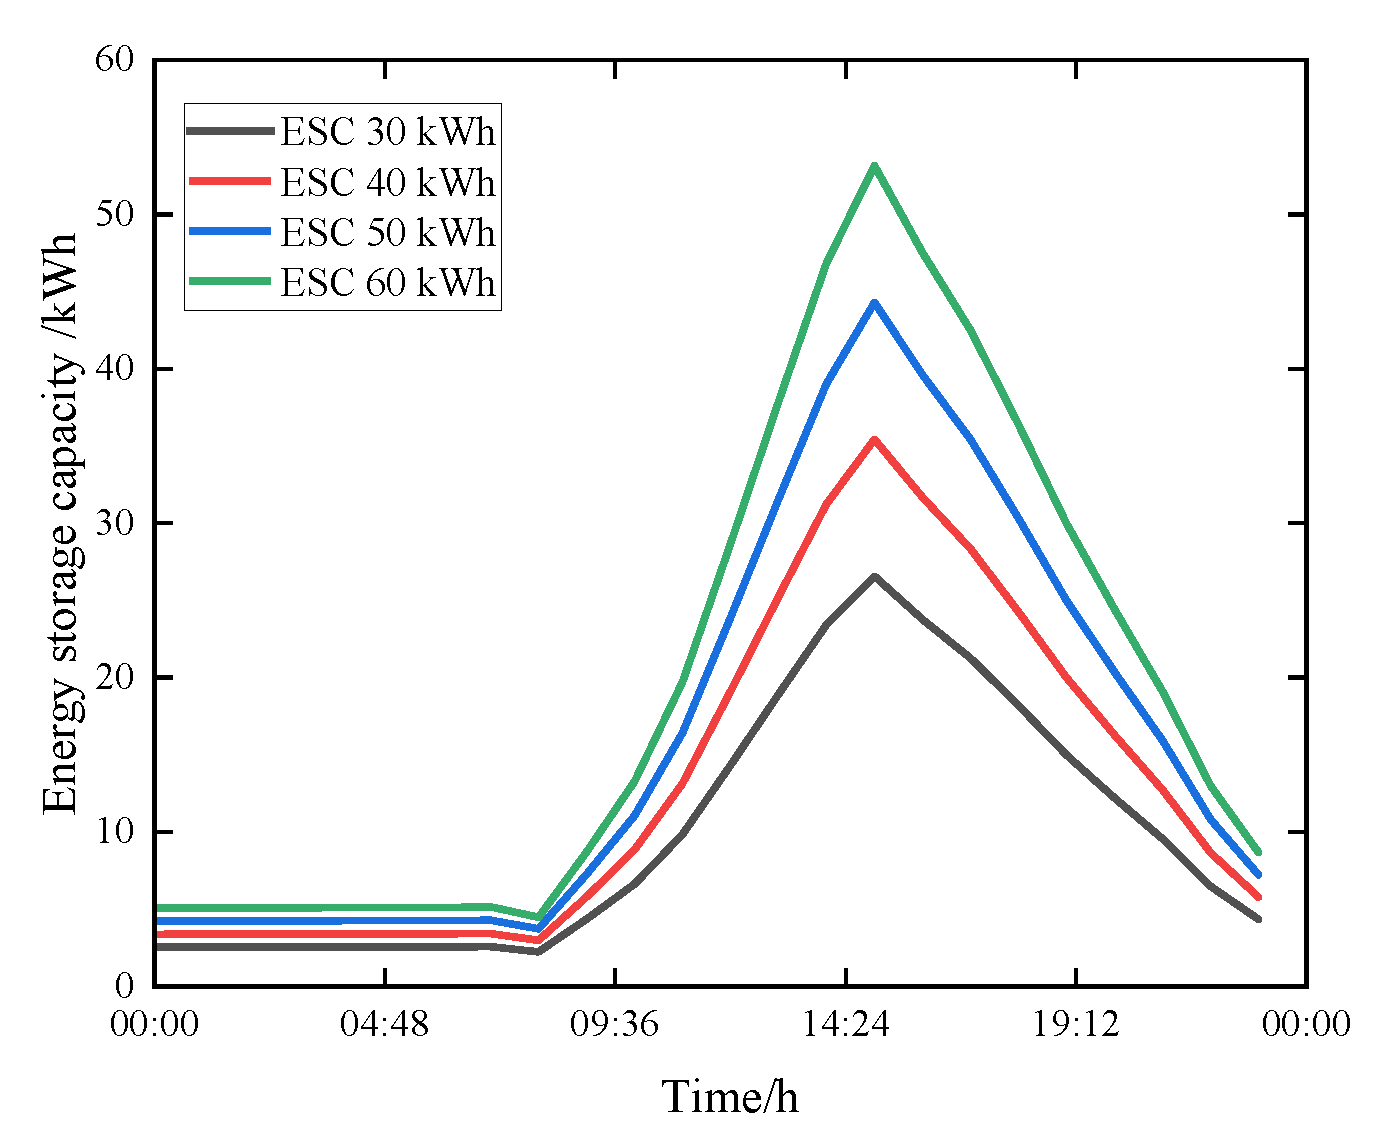
The comparison of the LVDN active power loss is shown in Figure 7. PVR stands for photovoltaic ratio. It can be seen from Figure 7 that the LVDN active power loss decreases after the energy storage system is added. Figure 8 shows the variation curve of SOC of the energy storage battery in autumn. ESC stands for energy storage capacity. From 0:00 to 9:00, the SOC of the energy storage battery does not change. From 10:00 to 16:00, the energy storage starts to move and reaches its peak with the increasing output of distributed photovoltaic. From 17:00 to 23:00, the energy storage battery releases energy to raise the node voltage, and the SOC of the energy storage battery decreases.
According to the example analysis, when the photovoltaic access ratio is 100%, the maximum node voltage deviation reaches 8.14%. By adopting the voltage control strategy based on sensitivity analysis proposed in this paper, the overall node voltage drops below 0.4 kV, the voltage deviation drops below 5%, the active power loss of the branch of the distribution network decreases by 62.37%, and the node voltage is within the specified range.
The above analysis is mainly aimed at the access ratio of distributed PV of 100%. In order to further explain this, the voltage control strategy proposed in this paper based on sensitivity analysis has good adaptability in accessing PV of different proportions. The maximum voltage offset of the LVDN nodes and the maximum daily active power loss of the branches were analyzed under different proportions of distributed PV. As shown in Table 4, when different proportions of distributed PV are accessed, the voltage control strategy proposed in this paper can effectively suppress the voltage overlimit of the nodes. When PV ratio is 40%, the LVDN node voltage is in a critical state, and the branch active power loss increases slightly. As the access proportion of distributed PV further increases, the active power loss of the branch has an obvious decreasing trend after the control is taken.

6. Conclusions

In the low-voltage distribution network with a high proportion of PV, the voltage of the distribution network nodes increases, and some nodes exceed the limit during the photovoltaic output period, because the PV output is not synchronized with the load demand. In this paper, a voltage control strategy is established to solve the voltage deviation problem, and the effectiveness of the proposed method is verified by a LVDN with a high proportion of PV. The conclusion is as follows:
(1)
For a LVDN containing high proportion PV, the LVDN partition is completed according to fuzzy cluster analysis based on the time point voltage of the distribution lines running throughout the day. It is more conducive to reflecting the influence of the power supply and load imbalance on the node voltage. Nodes with similar node voltage characteristics can be divided into the same zone.
(2)
Considering the improvement in node voltage and a reduction in power loss, a mathematical model for the optimal allocation of distributed energy storage in partitions is established. By controlling the injected power of the distributed energy storage, the LVDN voltage is adjusted, which is more conducive to dealing with the voltage exceeding the limit caused by the imbalance of the internal load in the partitions.
(3)
The voltage control strategy based on sensitivity analysis can effectively solve the voltage deviation problem caused by the high proportion of PV connected to the low-voltage distribution network, ensure the voltage deviation of all nodes within the allowable range, and reduce the LVDN active power loss.

Author Contributions

Conceptualization, L.Z. and X.M.; methodology, X.M.; software, L.Z.; validation, L.Z., X.M. and L.W.; formal analysis, X.M.; investigation, L.W. and N.Z.; resources, L.W.; data curation, N.Z. and H.W; writing—original draft preparation, L.Z.; writing—review and editing, X.M.; visualization, N.Z. and H.W.; supervision, X.M.; project administration, N.Z. and H.W; funding acquisition, N.Z. All authors have read and agreed to the published version of the manuscript.

Funding

This research was funded by the Youth Program of the National Natural Science Foundation of China (Grant number 61903264).

Informed Consent Statement

Informed consent was obtained from all subjects involved in the study.

Data Availability Statement

Not applicable.

Conflicts of Interest

The authors declare no conflict of interest.

References

  1. Wang, C.; Zhang, J.T. Carbon Peak Carbon Neutrality Towards a New Development Path; Party School Press of the CPC Central Committee: Beijing, China, 2021; pp. 115–117. [Google Scholar]
  2. Chen, W.; Ai, X.; Wu, T.; Liu, H. A review of the impact of photovoltaic grid-connected power generation systems on the power grid. Electr. Power Autom. Equip. 2013, 33, 26–32. [Google Scholar]
  3. Zhang, L.M.; Tang, W.; Zhao, Y.J.; Wang, S.L. Analysis of DG influences on system voltage and losses in distribution network. Power Syst. Prot. Control 2011, 39, 91–96. [Google Scholar]
  4. Pei, Z.Y.; Ding, J.; Li, C.; Zhou, C.; Liang, Z.F.; Yu, H.; Xu, X.C.; Zhang, J. Analysis and suggestions on distributed photovoltaic grid-connected problems. Electr. Power 2018, 51, 80–87. [Google Scholar]
  5. Hu, X.K.; Zhang, Q.; Hu, W.P.; Meng, L.; Wang, L. Analysis of the influence of distributed photovoltaic on automatic reclosing. Power Syst. Prot. Control 2019, 47, 75–82. [Google Scholar]
  6. Wang, Y.; Zhang, P.; Li, W.; Xiao, W.; Abdollahi, A. Online overvoltage prevention control of photovoltaic generators in microgrids. IEEE Trans. Smart Grid 2012, 3, 2071–2078. [Google Scholar] [CrossRef]
  7. Wang, Y.; Tan, K.T.; Peng, X.Y.; So, P.L. Coordinated control of distributed energy-storage systems for voltage regulation in distribution Networks. IEEE Trans. Power Deliv. 2016, 31, 1132–1141. [Google Scholar] [CrossRef]
  8. Olivier, F.; Aristidou, P.; Ernst, D.; Van Cutsem, T. Active management of low-voltage networks for mitigating overvoltages due to photovoltaic units. IEEE Trans. Smart Grid 2016, 7, 926–936. [Google Scholar] [CrossRef] [Green Version]
  9. Li, Q.R.; Zhang, J.C. The solution of voltage overrun of distribution network with distributed photovoltaic power source. Autom. Electr. Power Syst. 2015, 39, 117–123. [Google Scholar]
  10. Chai, Y.Y.; Guo, L.; Wang, C.S.; Liu, J.Y.; Lu, C.; Jin, W.; Pan, J. Distributed voltage control in distribution networks with high penetration of PV. Power Syst. Technol. 2018, 42, 738–746. [Google Scholar]
  11. Kabir, M.N.; Mishra, Y.; Ledwich, G.; Dong, Z.Y.; Wong, K.P. Coordinated control of grid-connected photovoltaic reactive power and battery energy storage systems to improve the voltage profile of a residential distribution feeder. IEEE Trans. Ind. Inform. 2014, 10, 967–977. [Google Scholar] [CrossRef]
  12. Zeraati, M.; Golshan, M.E.H.; Guerrero, J.M. Distributed control of battery energy storage systems for voltage regulation in distribution networks with high PV penetration. IEEE Trans. Smart Grid 2018, 9, 3582–3593. [Google Scholar] [CrossRef] [Green Version]
  13. Caldon, R.; Turri, R.; Coppo, M. A network voltage control strategy for LV inverter interfaced users. In Proceedings of the 8th Mediterranean Conference on Power Generation, Transmission, Distribution and Energy Conversion (MEDPOWER 2012), Stevenage, UK, 1–3 October 2012; pp. 1–5. [Google Scholar]
  14. Alam, M.J.E.; Muttaqi, K.M.; Sutanto, D. Mitigation of rooftop solar PV impacts and evening peak support by managing available capacity of distributed energy storage systems. IEEE Trans. Power Syst. 2013, 28, 3874–3884. [Google Scholar] [CrossRef] [Green Version]
  15. Wang, C.; Yin, G.; Lin, F.; Polis, M.P.; Zhang, C.; Jiang, J. Balanced control strategies for interconnected heterogeneous battery systems. IEEE Trans. Sustain. Energy 2016, 7, 189–199. [Google Scholar] [CrossRef]
  16. Wang, Y.; Wen, F.S.; Zhao, B.; Zhang, X.S. Analysis and countermeasures of voltage violation problems caused by high-density distributed photovoltaics. Proc. CSEE 2016, 36, 1200–1206. [Google Scholar]
  17. Zhu, L.; Fu, D.; Zhai, J.W.; Chen, D. Analysis of influence of distributed photovoltaic generation upon node voltage of the distribution network. Power Syst. Autom. 2018, 40, 74–77. [Google Scholar]
  18. Meng, X.F.; Liu, W.Y.; Piao, Z.L.; Wang, L. A nodal analysis method of load flow in distribution network based on network topology analysis. Power Syst. Technol. 2010, 34, 140–145. [Google Scholar]
  19. Piao, Z.L.; Meng, X.F. Distribution Network Planning; Electric Power Press: Beijing, China, 2015; pp. 180–197. [Google Scholar]
  20. Meng, X.F.; Wang, J.; Wang, Y.N.; Liu, R.; Wang, H.; Zhang, H. Low-voltage control method for 10 kV distribution network considering distributed generation capability of local voltage regulation. Power Syst. Prot. Control 2019, 47, 65–72. [Google Scholar]
  21. Cao, B.Y. Application of Fuzzy Mathematics and Systems; Science Press: Beijing, China, 2005; pp. 165–170. [Google Scholar]
  22. Meng, X.F.; Wang, L.D.; Wang, X.N.; Wang, Y.N.; Liu, R.; Wang, H. Improved operation characteristics of three-phase four-wire low-voltage distribution network using distributed power supply. Power Grid Technol. 2018, 42, 4091–4100. [Google Scholar]
  23. Zheng, F.F.; Meng, X.F.; Wang, L.D.; Zhang, N.N. Power Flow Optimization Strategy of Distribution Network with Source and Load Storage Considering Period Clustering. Sustainability 2023, 15, 4515. [Google Scholar] [CrossRef]
  24. Fang, B.M.; Li, H.Z.; Kong, X.P.; Yang, Y.B. Research on long-term distributed energy storage configuration with a high proportion of photovoltaic output. Power Syst. Prot. Control 2021, 49, 121–129. [Google Scholar]
  25. Yu, H.J.; Li, G.J.; Yang, B.; Zhu, S.J. Research on the active control technology of grid voltage based on a distributed photovoltaic/flywheel energy storage combined generation system. Power Syst. Prot. Control 2021, 49, 48–56. [Google Scholar]
  26. Zheng, P.F.; Liu, X.C. Description of power quality standard system. Electr. Meas. Instrum. 2010, 47, 123–127. [Google Scholar]
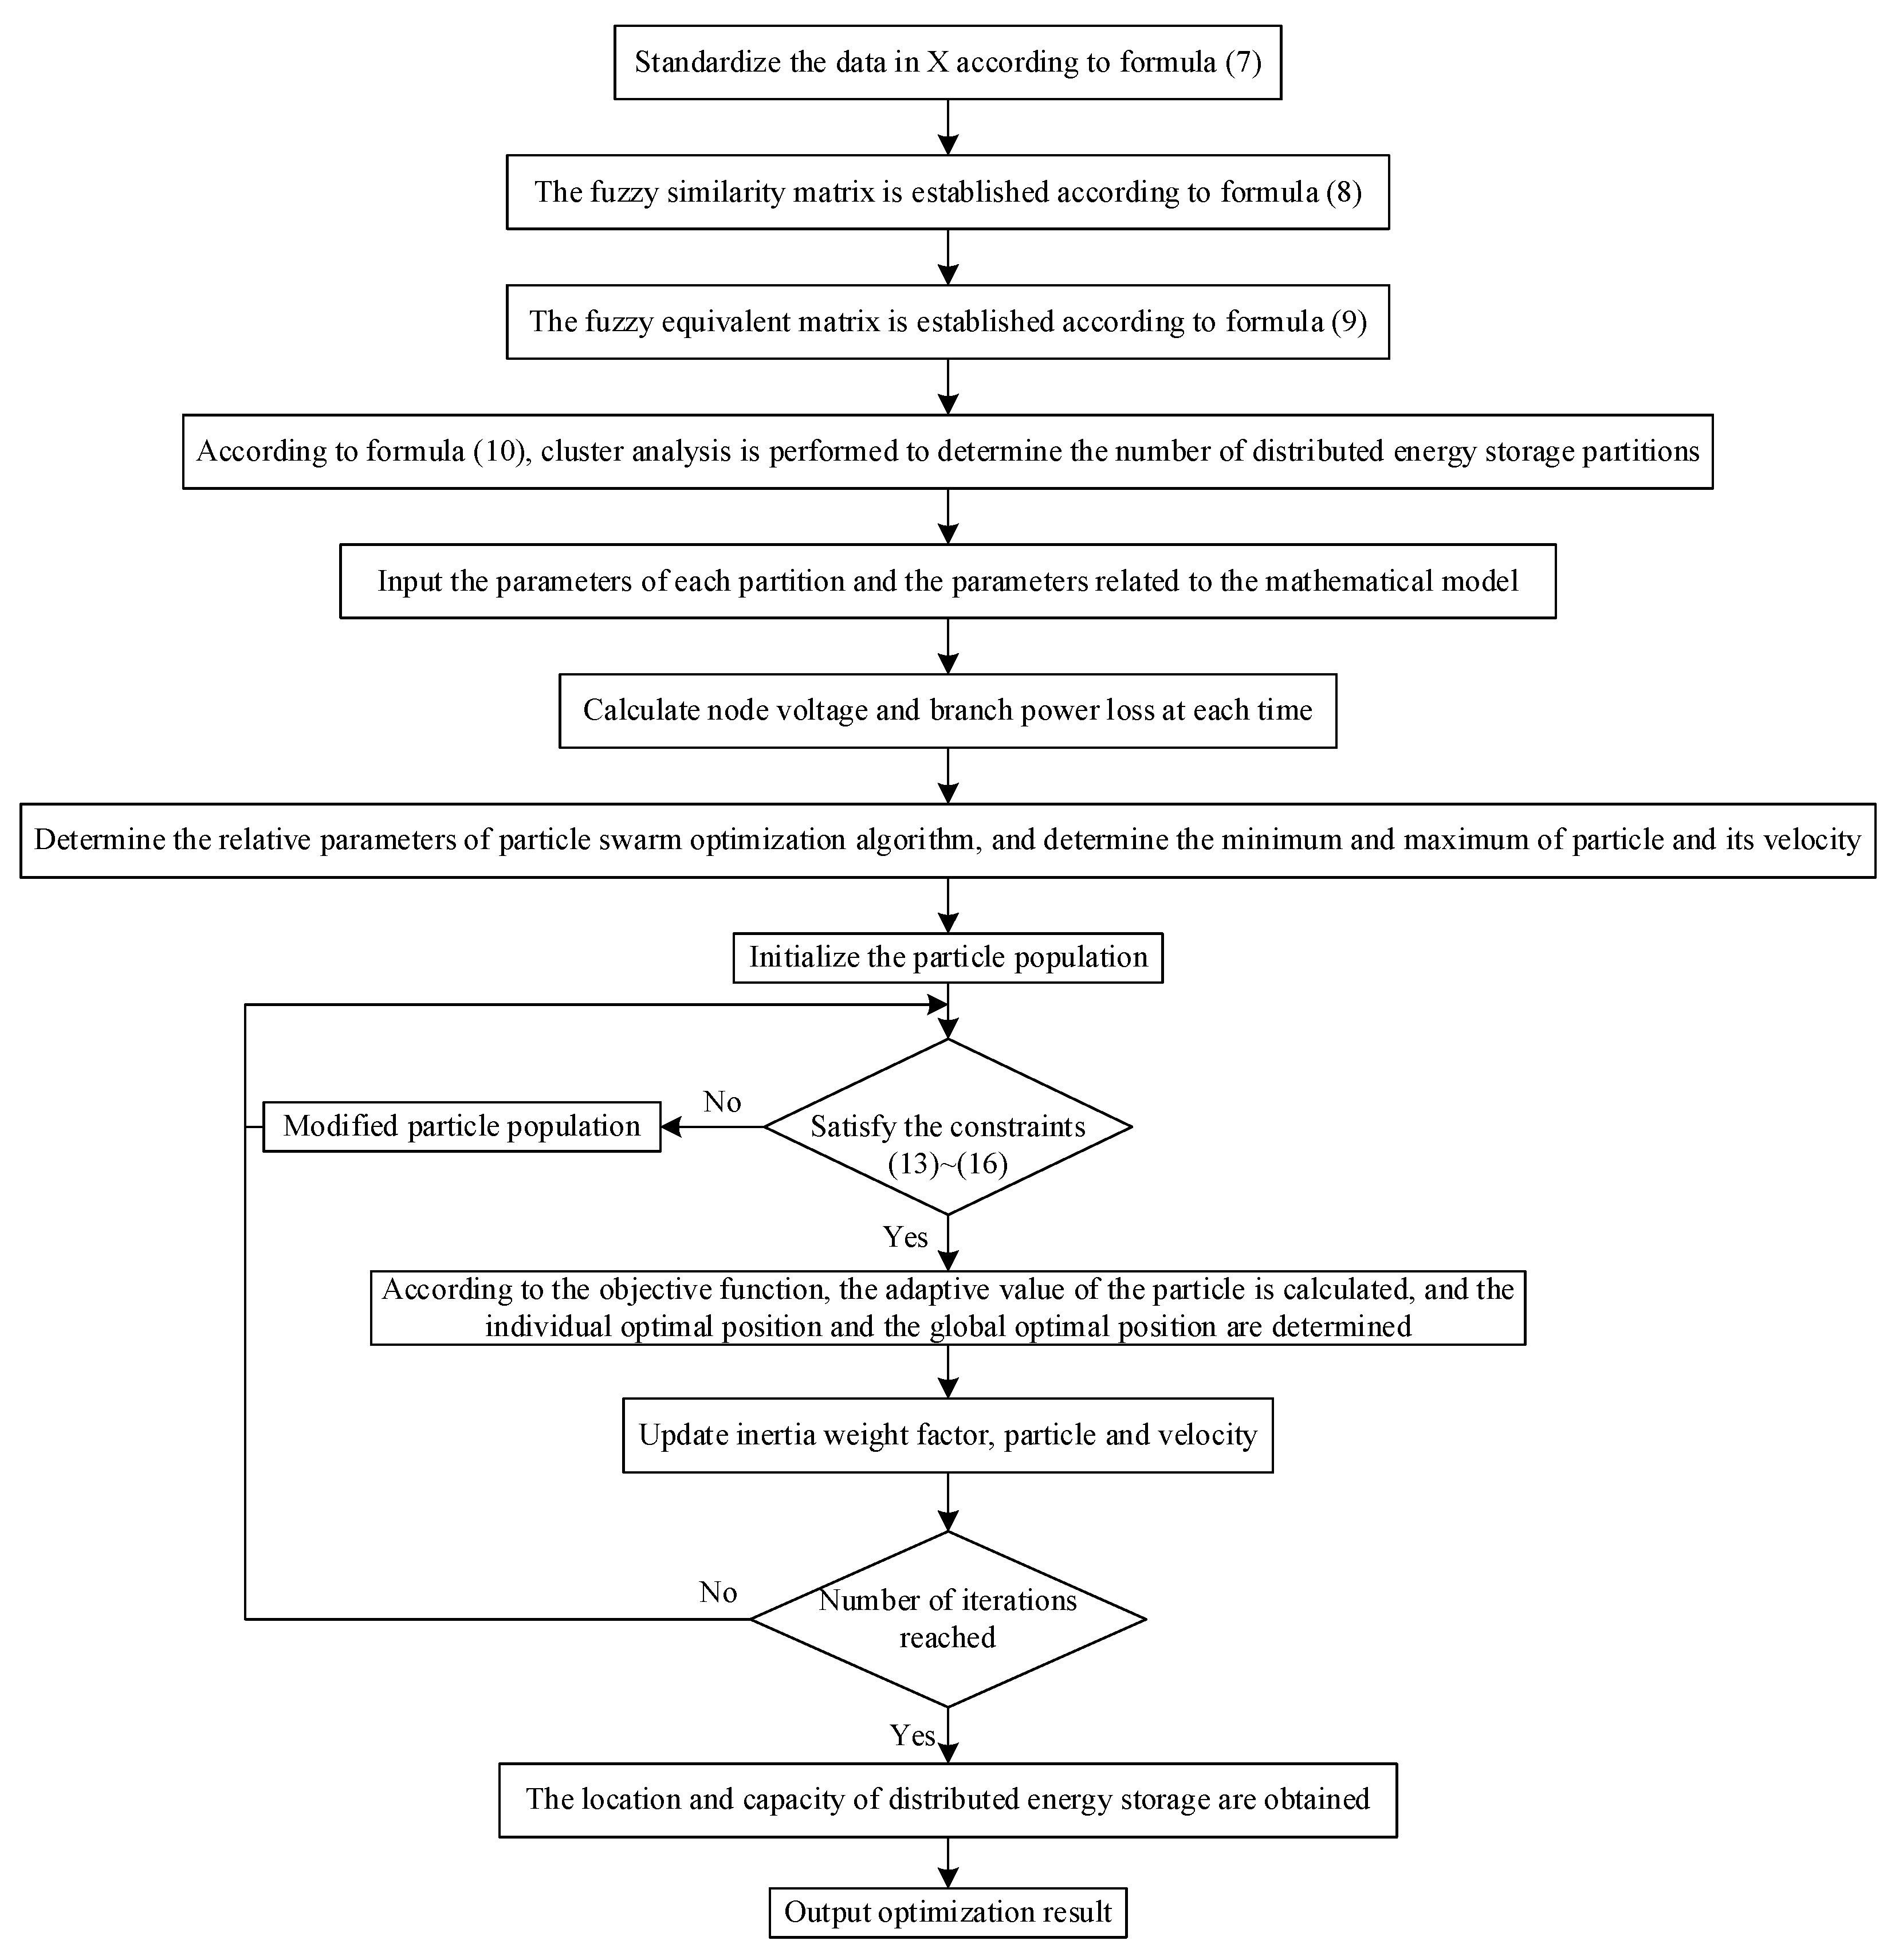
Figure 1. Model solving flow chart.
Sustainability 15 09943 g001
Figure 2. Voltage control strategy based on sensitivity analysis.
Sustainability 15 09943 g002
Figure 3. A 0.38 kV radiant network diagram.
Sustainability 15 09943 g003
Figure 4. Typical daily load curves.
Sustainability 15 09943 g004
Figure 5. Three-dimensional comparison of node voltage deviation in different seasons: (a) spring; (b) summer; (c) autumn; and (d) winter.
Sustainability 15 09943 g005
Figure 6. Comparison of voltage deviation of typical nodes in different seasons: (a) spring; (b) summer; (c) autumn; and (d) winter.
Sustainability 15 09943 g006
Figure 7. Comparison of active power loss in branches.
Sustainability 15 09943 g007
Figure 8. State of charge curve.
Sustainability 15 09943 g008
Table 1. Distribution network zoning and distributed energy storage configuration.
Partition NumberNumber of a Node in a ZoneDistributed Energy Storage Configuration NodeDistributed Energy Storage Configuration Capacity/kW
134 35 36 44 45 464450
24 5 22 23 24 252440
31 2 3 12 13 17 181760
433 40 41 42 434350
528 29 30 313050
69 10 11 271060
76 7 8 26740
819 20 212050
914 15 161560
1032 37 38 393830
Table 2. Node voltage comparison before and after energy storage control.
Node NumberNode 8Node 17Node 29Node 46
TypeNode Voltage/kVVoltage Deviation/%Node Voltage/kVVoltage Deviation/%Node Voltage/kVVoltage Deviation/%Node Voltage/kVVoltage Deviation/%
springpre-control0.40636.920.40316.080.40025.320.40897.61
after control0.38912.390.38822.160.39263.320.38992.61
summerpre-control0.40636.920.402860.40035.340.40747.21
after control0.39012.660.38872.290.39243.260.38932.45
autumnpre-control0.40586.790.40255.920.40085.470.41048
after control0.38832.180.38731.920.39313.450.39122.95
winterpre-control0.40727.160.40326.110.40035.340.40857.5
after control0.38922.420.387620.39233.240.38852.24
Table 3. Active power loss of branches and energy storage battery exchange power.
Time20 March21 June23 September22 December
Active loss of branch before control/kW15.42614.62515.015417.9742
Active loss of branch after control/kW6.05495.71785.64967.1382
Energy storage battery exchange power/kW748.65549.99647.32704.31
Table 4. Comparison of maximum node voltage and maximum branch active power loss before and after optimization under different photovoltaic ratios.
Photovoltaic RatioBefore OptimizationAfter Optimization
Maximum Node Voltage Offset/%Maximum Daily Active Power Loss of a Branch/kWMaximum Node Voltage Offset/%Maximum Daily Active Power Loss of a Branch/kW
40%5.650712.60914.08413.3042
60%5.859612.98773.78889.5478
80%7.755814.68234.47276.5039
100%8.141417.97424.847.1382
Disclaimer/Publisher’s Note: The statements, opinions and data contained in all publications are solely those of the individual author(s) and contributor(s) and not of MDPI and/or the editor(s). MDPI and/or the editor(s) disclaim responsibility for any injury to people or property resulting from any ideas, methods, instructions or products referred to in the content.