Abstract
Recently, due to the great need to promote environmentally sustainable maritime transport, alternative energy sources to traditional fossil fuels have been proposed to reduce ship emissions. Among few alternative scenarios, most experts recognize Liquefied Natural Gas (LNG) as the most promising solution in the short to medium term. However, there are still some critical issues related to the future expansion of bunkering stations and the LNG-fuelled fleet. Firstly, there is the need for a sufficiently extensive international network of bunkering facilities. Secondly, the layout and location of bunkering stations impact the efficiency of ship bunkering operations, cost reduction and the safety of the surrounding areas. Last, the in-progress Russian-Ukrainian conflict is causing serious unbalances in gas supply and prices, especially for Europe. Specifically, in the case of Italy, gas imports represent the seventh most imported commodity. Due to the changed geopolitical scenarios, interest has arisen in investigating the technical and operational characteristics of LNG bunkering stations and comparing different configurations with a view to increasing Italy’s independence from other foreign countries, focusing on degasifies that could promote new infrastructures that make available LNG in ports. In this paper we highlight the importance of reducing ship emissions and investigate some technical and operational characteristics of LNG bunkering stations. We present a simulation study to analyse quantitatively the operating performance of different LNG bunkering technologies in a port terminal and their impact on the efficiency and overall cost within the whole goods’ supply chain. In particular, we evaluate and compare bunkering time, throughput and refuelling costs in alternative layouts, referring to marine terminals located near urban areas. The aim of this research is to verify whether ports with infrastructure embedded in metropolitan areas could provide, safely, a valuable contribution to the green transition by efficiently handling an adequate level of LNG supply, especially referring to the present Italian interest in increasing independence from foreign countries. For this purpose, we present four dynamic discrete event simulations of all the main LNG bunkering configurations and present their dynamic performance sampled over two consecutive years after a warmup period of 6 months. The simulation conceptual models have been created by the authors based on analyses of those configurations and then processed and implemented within the simulation software Witness Horizon 23®, used for experimentation. This is the first time that a simulation study is presented for comparing different configuration of LNG bunkering stations. The results presented here confirm that simulation is a key science to address these complex problems and it represents a major added value for the development of new infrastructures embedded in supply chains and able to favour green transition. Concerning the present study, the simulation output reveals that, although the increase in the price of LNG over the past year has had a strong negative impact on the propensity to activate LNG refuelling stations at maritime terminals, Truck-To-Ship, or Ship-to-Ship with small feeder ships, and Port-To-Ship configurations appear to be flexible and particularly suitable for port terminals located near urban areas. However, the final the choice of the most suitable LNG bunkering station requires further and specific inside investigation as well as considerations on the Decision Maker Strategies and Attitudes.
1. Introduction
Starting in the first decade of this century, the rapid increase in traffic and naval gigantism has facilitated commercial maritime traffic, leading to an increase in fuel consumption and, at the same time, contributing to massive emissions of impacting pollutants into the air as well as into waterways and seas. Indeed, the International Maritime Organization (IMO) in 2011 estimated that maritime transport is responsible for 3.7% of total CO2 emissions in Europe and its emissions account for about 13% of the greenhouse gases emitted in the entire transport sector and that these emissions could increase from 50% to 250% by 2050 [1]. To mitigate this important phenomenon on the environment, International Organizations, together with the relevant bodies of individual states, approved the International Convention for the Prevention of Pollution from Ships, issued by IMO in 2020 [2], which imposes a limit on emissions of pollutants into the atmosphere from ships. More specifically, from 2020 the sulphur percent content of fuel oils used for ship propulsion cannot exceed 0.5.
These pollutant emission reduction targets are driving a new way of thinking and a range of technological solutions within the shipping and port sectors.
Among many alternatives recognized as feasible scenarios to reduce air pollution from ships, most experts recognise LNG as the most suitable fuel solution, both in the short term and in the medium term (see, e.g., the work proposed by Livaniou and Papadopoulos in [3] among others). Furthermore, the “Guidance on LNG Bunkering”, compiled by the European Maritime Safety Agency (EMSA) in 2018, recognizes LNG as a fuel or energy source that is suitable to replace, at least partially, fossil oil sources in the supply of energy to transport and that has the potential to contribute to its decarbonisation and improve the environmental performance of the transport sector [4].
Following this trend, since 2020, the LNG-powered fleet has been gradually increasing, and many of which are the ships currently under construction, although the green transition process of the current world commercial fleet requires time and proper assessment of sustainability with respect to costs and different regions affected by different economic and social development plans [5,6]. New regulatory frameworks have been the main drivers. Sheng et al. in [7] investigated how carriers adapt to the sulphury regulation by choosing between sulphury scrubber and fuel switching. European ports are expanding considerably their LNG bunkering capacities too, establishing expansion plans for LNG handling and storage facilities.
In this paper, we consider different configurations of LNG ports, analysing LNG bunkering activities through a discrete-event dynamic simulation study. Specifically, the aim of this study is to evaluate LNG bunkering technologies’ impact on efficiency and cost. We compare the performance of alternative LNG station layouts to evaluate them in terms of the number of ships served, bunkering time and cost. The focus is on those situations where port and city closely coexist, as in the case of the port network of the Liguria region (Italy).
Dynamic discrete event simulation models have been used successfully throughout the last decades to tackle the dynamics behaviour of maritime terminals. Among others, Cimpeanu et al. in [8] present a discrete event simulation model for the analysis of bulk carrier handling operations and evaluate the efficacy in terms of performances of long-term investment. In [9], Steinbacher et al. perform several simulation experiments to analyse possible power savings of autonomous lighting control systems by varying the utilization rate of a container terminal. A simulation study for analysing the impact of mega ships’ arrivals in a terminal of the Ligurian port system on the dwell time of the containers is proposed by Musso and Sciomachen in [10]. In [11], the authors present a simulation approach to evaluate the impact of maritime transport on the inventory levels of an oil supply chain, being able to reduce their variance. Simulation models have also been used to assess environmental impacts as well as sustainability in port operations correlated with efficiency, as the study reported in [12].
Other simulation studies concerning LNG bunkering systems have recently been presented. In particular, from the LNG bunkering terminal point of view, Park and Park in [13] analysed the port of Busan and considered two different bunkering methods and developed a simulation model to forecast the future LNG fuel demand in order to define the size of required supporting facilities. A simulation of emergency evacuation of a floating LNG bunkering terminal is proposed in [14].
More prevalent in the recent literature are other quantitative approaches proposed in relation to LNG bunkering systems. Among others, an interesting multi-criteria decision-making approach based on fuzzy logic for measuring the sustainability of marine fuels is proposed by Rean and Liang in [15]. In [16], the authors proposed a mathematical model to evaluate and compare, among other components, the environmental costs of intermodal chains with different fleets in terms of sizing and technologies of the vessels and road transport. Wang et al. in [17] proposed a decision model based on some social, economic, political and technological factors for the evaluation of the development level of LNG fuelling ships in different regions and countries.
In this paper we present four dynamic discrete event simulation models, implemented with the software environment Witness Horizon 23®, related to different bunkering configurations. The aim of this research is to verify whether ports with infrastructure embedded in metropolitan areas, since the ones in the Ligurian (Italy) port network with limited draughts and heavily congested hinterland connections can provide a valuable contribution to the green transition by efficiently handling an adequate level of LNG supply. In this direction, this study could be relevant in relation to the present Italian need to increase independence from foreign countries. At least to the authors’ knowledge, this simulation study is the first one aimed at analysing the performance of bunkering stations at port terminals from a logistics perspective.
The organization of the remaining part of the paper is as follows. Section 2 gives a brief overview of the main sea transport methods and LNG bunkering operations. Section 3 presents an analysis of the LNG supplies and related costs following the conflict in Ukraine. These costs constitute the input data of the proposed simulation models. Section 4 describes in detail the simulation study, together with the main components of the proposed models, their dynamics and the different scenarios aimed at evaluating the refuelling performance depending on the chosen configuration of the LNG plant. The simulation results are synthetized in Section 5. Finally, conclusions and outlines for future works are presented in Section 6.
2. LNG Sea Transport and Bunkering Operations
In this section, we give a brief overview of the LNG supply chain and LNG bunkering methods to better understand the main components and the dynamics of the simulation models, and their related results are presented in Section 4 and Section 5.
2.1. LNG Supply Chain
Natural gas is as a mixture of hydrocarbons, among which methane clearly stands out (about 85%), followed by ethane (about 10%), as well as propane, butane and nitrogen, albeit in much smaller quantities [18]. It is found enclosed in the different layers of the earth’s mantle or embedded in rocks underground. Consequently, a specific procedure must be followed to extract it. Through a chemical transformation, which takes place inside the re-gasification plant, natural gas passes from the gaseous state (NG) to the liquid one (LNG) and the other way around. This happens, in the case of the passage from the gaseous to the liquid state, to favour its transport and storage in port areas, since the LNG occupies 600 times less volume than the NG. It can be noted that the natural gas industry is capital intensive, especially regarding the investments that ship owners must make to transport natural gas in its liquid state through their ships. Natural gas can be routed to consumer markets either by pipeline, in its gaseous state or by ship, in its liquid state; in the latter case, liquefaction and regasification plants will then be required upstream and downstream of the maritime transport, respectively, to transform it into the required state.
The path that takes LNG from its source to the end user, which is the LNG Supply Chain, is organized in different structures according to the needs, the infrastructures and the territories; however, a common sequence of phases is proposed in the diagram in Figure 1. It is worth noting that a high portion of the LNG path takes place inside the port’s boundaries and, clearly, on the bases of the laws of the involved country in which the exploration or production plant is located, there will be different aspects to take in consideration.

Figure 1.
The LNG Supply Chain.
Indeed, the LNG Supply Chain has different configurations related to the supply route and such configurations strongly depend on the layout choices, on the available infrastructures, on volumes and boundary conditions.
In the supply phase, it is possible to use the existing pipeline network for the gas transfer, or a storage tank, depending on the available technology. These two possible configurations lead to different organizational approaches, as presented in Figure 2. In both cases, the LNG-fuelled ship is the end user of the process.
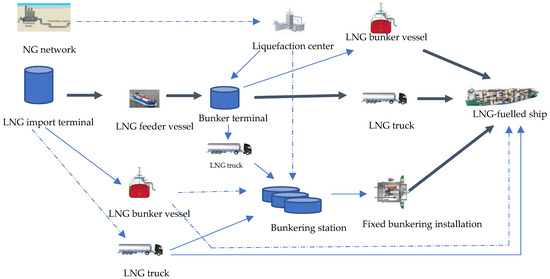
Figure 2.
Different configurations of the supply phase.
2.2. LNG Bunkering Methods
Referring in detail to LNG bunkering, the procedure differs based on the chosen layout. Interested readers can find a detailed review of LNG bunkering stations in [19], which establishes that the global LNG bunkering network planning and LNG bunkering method selection, together with risks quantification and safety evaluation, require further investigation. In [4], LNG Bunkering is defined as the transfer of LNG from a bunkering facility to a receiving vessel, taking place over a well-defined period where the beginning, transfer and end of operations follow a particular specified and documented procedure. From the operational point of view, the modality designated for the LNG delivery phase has a crucial importance. This decisional phase encompasses both the regulatory sphere and the technical one. Specific technical needs must be considered for the refuelling procedure to be carried out safely. Therefore, all procedures to carry out, simultaneously and not, must be performed within the port structure without causing delays or damages and while minimizing inefficiencies. It is easy to understand that several aspects must be examined in the design of an LNG terminal, such as the arrival process of the LNG at the facility, as analysed in Section 2.1 and depicted in Figure 2, and if it is stored inside the port area, how the bunkering procedure is performed. Depending on these choices, different international, national and local regulations or standards are applied. LNG bunkering clearly involves many stakeholders such as LNG suppliers, ports, safety personnel, administrations and policymakers.
In terms of the concerns of the bunkering facility, EMSA defines it as an LNG storage and transfer installation, which can be a stationary shore-based installation, or a mobile facility, as an LNG bunker ship or a tank truck [4]. Subsequently, the presence of areas dedicated to the LNG storage must be considered. From a storage capacity point of view, LNG facilities are classified as follows.
- Large-scale plants include liquefaction plants and receiving terminals, which are usually located in coastal areas. In fact, the most favoured way for their supply is represented by large-scale LNG carriers, with capacity ranging usually from about 120,000 m3 (54,000 tonnes) for older vessels to up 266,000 m3 (120,000 tonnes) for the largest Q-max vessels, which reach the hub where the gas’ unloading operations will be carried out. Many hubs include LNG storage facilities, with capacity from 120,000 m3 or larger, designed to receive full capacity of the LNG carrier. LNG is degasified in the hub and distributed through the main distribution channel, which normally is a high-pressure natural gas pipeline.
- Medium-scale LNG facilities are supplied by small-scale LNG carriers, which are characterised by a capacity of 1000–40,000 m3. This was a quite rarely applied solution, but being favoured in the case of decentralized systems, where large-scale LNG carriers would not be feasible, it is growing in diffusion with expected growth of LNG use for bunkering and for other uses.
- Small-scale LNG facilities are used for the distribution to local users and usually these are supplied by trucks or by small-scale LNG carriers.
In the LNG bunkering procedure, it is possible to identify three main methods which allow to carry out this activity: Truck-to-Ship (TTS), Ship-to-Ship (STS) and Port/Terminal-to-Ship (PTS) [13].
In the TTS method, the LNG truck is connected to the receiving vessel, which is located on the quay, through a flexible pipe. The flow of LNG that goes from the truck directly to the ship can vary from 40 to 60 m3/h, and the volume of LNG that can be transported by the truck ranges from 50–100 m3. This solution has both advantages and disadvantages; in terms of advantages, it offers a high level of operational flexibility and limited investments due to the absence of an effective infrastructure, and it is possible to adapt the volumes of LNG according to the customer needs. In contrast to the great flexibility of this method, on the other hand it is also necessary to consider the limited capacity, which implies the use of several trucks (multi-truck operations). Furthermore, a major aspect arises from safety; indeed, for the whole duration of the refuelling, the quay is unusable for safety reasons due to the restriction of passage, causing interference with normal port operations. For these reasons, TTS is more feasible in the case of tugs, coastal vessels, or relatively small passenger ships if allowed by local regulations.
To reduce the level of dock occupancy, the STS method can be used. With this method, the LNG is delivered to the receiving ship from another ship, vessel or barge, moored alongside the ship on the opposite side of the quay. The flow of LNG that goes from the fuelling ship, directly to the receiving one, goes from 150 to 5000 m3/h and the volume of LNG that can be transported by the truck ranges from 100 to 6500 m3. The fact that the supply ship operates on the opposite side of the quay offers the benefit of not interfering with the operations that are carried out in the port, unlike the TTS. This favours the performance of simultaneous operations, such as handling of cargo or passengers’ embankment. According to EMSA [4], simultaneous operations, referred to as SIMOPS, are two or more operations taking place simultaneously, one of which involves LNG bunkering operations, the combination of which may present safety, environmental and security issues. The large capacity of the supplying ships makes it possible to carry out the operation at once, without resorting to the use of more ships. The STS is suggested in the case of ships with a very short turnaround time. In addition, and in this case too, a strong level of operational flexibility must be considered, given that the operation, as already mentioned above, does not interfere with the port activity. In view of the benefits analysed, the application of this methodology requires high initial investments, related to the design, construction and operation of an LNG-fuelled ship. Finally, it must be considered that the size of the refuelling vessels is strictly dependent on the port infrastructure, its size and its draft. The last methodology that needs to be analysed is the PTS one, where the LNG can be supplied to the receiving ship by means of import/export terminals or by small storage units. The main benefit lies in the fact that it offers the possibility of delivering large volumes of gas, at high rates. In fact, in this case the flow of LNG goes from 5500 to 10,000 m3/h and the volume of the tank’s ranges from 200 to 20,000 m3. Considering that the investments necessary for the construction of this terminal are huge, they must be justified by a high and stable supply demand. Note that to complete the bunkering operation, the receiving ship must approach the terminal. It is therefore necessary for this to take place only before or after the handling of passengers or cargo, which greatly reduces operational flexibility.
It must be underlined that the more the system is complex the more LNG accidental or operational spills are possible. These represent a debated topic because while on one hand it is important to consider the environmental impact that comes from methane emissions, on the other hand it is important to consider safety and security to make the plant and the whole supply chain work properly. For this reason, extensive attention has been recently paid to the optimization of various subsystems and their safety evaluation, mainly focusing of the LNG-powered ships, both from a quantitative and economic point of view. Among others, in [20] a Markov decision approach is used to evaluate the effect of LNG power transformation of containerships, while in [21] an optimization design of cryogenic pipe system in LNG-powered ships is proposed. Choi and Park present a study for the optimization of the LNG-powered ship’s energy supply system [22]. Ge and Wang proposed an economic evaluation of the LNG diesel dual fuel power technology, comparing it with other solutions and focusing on the energy recovery system [23]. In [24], the authors estimated the global port-based LNG transport model from a database of ship movements and used this model to examine the components of the LNG supply chain. Utku and Soyöz in [25] propose a mathematical model for the LNG supply chain, which minimizes the costs that may occur in the LNG supply chain with uncertain demand. More recently, different cost-effectiveness alternatives, including LNG, are investigated in [26] for the most frequently calling ships to Irish ports. A heuristic algorithm for the bunkering operation problem in an LNG bunkering station in inland waterways is presented in [27], where the authors determine both the optimal combination of bunkering and refuelling modes and the optimal truck fleet. In [28] the authors focus on the LNG bunkering configuration station deployment problem and identify their optimal location.
3. Actual LNG Supplies
At present, LNG-powered ships are more common in the liner market than in the tramp one. The reason for this is mainly that there are still few ports equipped with gas filling stations and, as a result, only ships with regular routes can leverage this advantage. In contrast, ship-owners offering services on demand (tramp vessels) with variable voyages from time to time are exposed to the risk of calling at ports where LNG refuelling is not possible, or not having to accept cargoes for some destinations. Therefore, the choice of a ship-owner to purchase LNG-fuelled ships or to convert one already in use to this fuel is a strategic decision that has a significant impact on his business; this is also in view of possible incentives from international organisations or certain ports that can benefit, for example, from port tax concessions.
Referring to the Italian situation, gas imports represent the seventh most imported commodity in Italy in terms of quantity. Before the war in Ukraine broke out in February 2022, 43.3% of the gas used in Italy came from Russia. Due to the changed geopolitical scenarios, interest has arisen in investigating the technical and operational characteristics of LNG bunkering stations and comparing different configurations with a view to increasing Italy’s independence from other foreign countries, focusing on regasification.
For decades, Russia has been a major supplier of gas to Europe, accounting for about 40% of the continent’s total imports. This shows how heavily dependent the European Union (EU) is on this country. Following the conflict that broke out in February 2022, the EU established a series of restrictions on Russian gas imports to Europe, up to a total ban. This decision is crucial for the future of economic equilibrium and gas import/export to and from all over the world. To reduce the dependence on Russian gas, there have been many offers from foreign countries to help the EU.
As reported in [29], in the first half of 2022, the USA became the world’s largest LNG exporter, with a 12% increase over the previous year. This is significant because, due to the Russian-Ukrainian war, a large part of this exported gas was destined for the EU and Great Britain to overcome dependence on Russian gas. This data also shows how investment in degasifies are crucial within the present geopolitical scenario, to be able to accommodate large ships carrying huge quantities of LNG that need to be transformed back into a gaseous state before reaching the final consumers. Furthermore, Lee and Kin in [30] present an interesting study aimed at analysing possible changes in the bargaining power of LNG supply by changing the export routes of Russian natural gas and the volume and inflow of LNG from the United States of America to the European natural gas market.
To understand better which will be the best scenario, is important to note that after the explosion of the Ukrainian conflict the LNG market is highly volatile and the quantities that are imported by countries are sensibly variable. It should be emphasized that gas is a necessity not only for the transport sector, but also for everyday life. Therefore, the need for gas undoubtedly implies having a stable supply that does not lead to large price fluctuations, as is the case with Russian gas, which would affect the end user. For this reason, combined with a general disincentive to trade with Russia for geopolitical reasons, many European countries are trying to find a solution to make LNG imports more stable.
However, the current scenario of the LNG market is very complex and strongly influenced by geopolitical components, which in the recent months have been intensifying relations with other foreign gas producers. There are currently many solutions that can be applied, and it is necessary to understand which is the most feasible one to purchase foreign gas without damaging end users and the market.
In addition to geopolitical aspects that push to create new large marine LNG infrastructures to supply gas, the above mentioned decision to increase the LNG-powered ships goes quite over the European dynamics and western world green policies and will strongly rely on ship owners and ports’ strategies that usually are driven by a very competitive and individual agenda; competitors to these initiatives in ports include Cold Ironing, Scrubbers, AFIR (Alternative Fuel Infrastructure), H2 and New Fuels (e.g., FuelEU), etc. Currently, as anticipated, the LNG bunkering results are reasonably promising for its economic–environmental sustainability and for its short-to-medium term feasibility, but global fleets and ports’ evolution will be well known in the next years and will clarify the real trend [1,2,3]. Certainly, new LNG power ships represent highly valuable and strategic vessels that could drastically increase the competitivity of ports by creating LNG bunkering infrastructures. Finally, the reduction of environmental impacts through LNG bunkering is very high, erasing practically all factors affecting pollution, including greenhouse gas emissions; therefore it is crucial to properly estimate the quantity of the fleet, including old ships, that will operate over the total of sea trades and to evaluate safety/security risks. However, it is important here to note that the goal of this paper is not to finalize forecasts on future fleet/port evolution or marine environmental impact reductions, but to provide new models and experimental analysis to create new infrastructures for LNG bunkering in case the decision-makers decide to implement these services.
4. The Proposed Simulation Study for Evaluating LNG Bunkering Configurations
After presenting in detail the different methods used for refuelling LNG ships, in this section we analyse what performance, such as bunkering time and throughput, can be achieved under different possible configurations of onshore infrastructures and examine whether such infrastructures, which are still in the design phase, can be a viable solution for improving sustainability by analysing the trade-off between these performance indices and costs. For this reason, we conducted a dynamic discrete-event simulation study and developed and compared different main scenarios which represent the combinations expected to be most feasible, flexible and performing among those expected to be realized nowadays. No other simulation study has been previously performed in this direction. For our purpose, the use of dynamic discrete event simulation models is justified, as most simulation studies are [31], by the complexity of the scenario and the high investments required for the construction of the bunkering facilities, regardless of the type of technology chosen. The proposed simulation models also include elements related to the stochastic components in terms of interval of arrivals and port equipment efficiency and availability based on the author’s experience. The models and their results have been subjected to validation and verification along their whole development cycle, including dynamic methods on its implementation. Therefore, the adoption of the proposed a priori analysis based on simulation models allows assessment in advance of the impacts of these scenarios in terms of performance, reliability, return of investments, etc.
The proposed simulation experimentations focus on two main scenarios and two variants applicable to the second scenario. The respective models were implemented and executed using the Witness 23 Horizon® software environment. The first scenario represents an onshore infrastructure able to refuel LNG ships through the Truck-to-Ship (TTS) and the Port-to-Ship (PTS) methods. This scenario is described in Section 4.1. The second scenario (see Section 4.2) considers the refuelling operation performed by the Ship-to-Ship (STS) and Port-to-Ship (PTS) methods. Regarding the variants related to the second scenario, the first considers the inclusion of an onshore regasification plant in the model. This plant would serve to distribute the LNG within the system. The second variant, as illustrated in Section 4.2, is characterised by a different organisation of the ships to be fuelled. The scenarios proposed and analysed in this study were chosen for their feasibility and operational characteristics in port terminals in the vicinity of urban areas, based on what is discussed in Section 2.2. Moreover, the choice to develop and analyse these two scenarios was mainly dictated by the current potential and availability of the LNG market and its actual application in the real world. In addition, it was essential to consider the management of space to be devoted to the bunkering operations which would be able to refuel ships of different sizes without causing any restriction or constraint on other port terminal activities.
Despite the variability of the proposed scenarios, in all simulation experiments we used the same three types of ships asking for bunkering operations, which were of different size, fuel capacity and filling rate, according to the refuelling strategy. More precisely, small-size ships can represent the pilot ships used to carry out technical–nautical services within the port, which have a capacity of 200 cubic meters. Medium-size and large-size ships can be, respectively, ferries and offshore support vessels and containerships and have a capacity of 400 and 2400 cubic meters. In this way, we had the opportunity to analyse the actual performance of the LNG facility on ships of different sizes, also considering the volume of newbuilding orders in the market and the needs of ship-owners. Moreover, in all models there is an LNG feeder vessel.
The LNG vessel carriers currently in operation, or under construction, are double-hulled LNG carriers with a capacity ranging from 125,000 to 200,000 cubic meters. In our models we fix its capacity at 150,000 cubic meters. Moreover, in the simulation models, we referred to the filling flow rate data from the Italian Ministry of Economic Development (see [32]) for each type of ship with respect to the corresponding bunkering methodology, namely STS, PTS and TTS, and the considered scenario reported in Table 1.

Table 1.
Filling flow rate (in cubic meters per hour).
The purpose of the proposed simulation models was to analyse and discuss not only the operational performance of an LNG terminal facility, but also its economic competitiveness. In fact, in the scenario analysis we compared different time series, corresponding, respectively, to the LNG prices from January 2021 to January 2023. In our simulation experiments we considered the LNG prices data derived from [33] and reported in Table 2, expressed in thousand cubic meters. The average price of LNG in the first half of 2021, at 0.178 USD/M cm, is about 72% lower than that in the same half of 2022, whose value is 0.306 USD/M cm. Moreover, from Table 2, we can note the significant increase in the average price of LNG in the last half of 2022 (i.e., 0.395 USD/M cm), although there is currently a downward trend in the price, as in the price between January and March 2023. These values confirm the high volatility of LNG prices due to various factors, both infrastructural and supply-related, but also geopolitical, as analysed in the previous section.
Table 2.
LNG price (in USD/thousand cubic meters.
We considered the average prices of these reference periods within the simulation scenarios to be able to carry out a further evaluation in terms of refuelling costs. In fact, another objective of our study is to see how the high volatility of the LNG price over the considered time horizon has had, has, and will have on economic impact and, consequently, if this alternative fuel can be competitive in terms of efficiency of the considered scenarios. Starting from the last decade, other authors outlined the high volatility of the LNG price and the uncertainty generated by it (see the works by Acciaro [34] and Zhen and Chen [35], among others).
4.1. First Scenario: Port-to-Ship and Truck-to-Ship
Figure 3 reports the graphical representation of the layout of the main simulation components of the referring bunkering terminal related to the first scenario. It is worth noting that the used simulation tool is a general-purpose software environment for discrete event simulation studies; therefore, the graphical elements are pre-defined and do not correspond to the real configuration of the modelled systems, but just play the twofold role of providing an idea of their functionality and reflecting the dynamics of their main component.
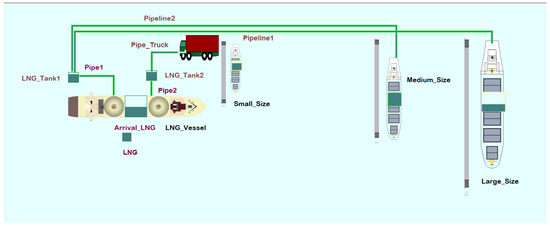
Figure 3.
First scenario: TTS and PTS.
The first step in the implementation of the simulation model was the definition of the main elements, namely tanks, pipes, pipelines, processors, machines and fluids. Further, three variables were used to count the number of small, medium and large-size ships, respectively, served in the considered time horizon.
The dynamic of the system is as follows. The bunkering operation starts with the arrival process of the LNG at the terminal through an LNG vessel. Once the LNG vessel is berthed, the fluid stored inside tanks is then transferred via specialized cryogenic equipment to tankers or bunker ships to allow refuelling. Tanks and quay loading arms are modelled by pipes and pipelines, respectively. More precisely, through two pipelines the LNG goes toward two different inland tanks. The first one, split into two different pipelines, serves the bunkering of the medium and the large-size ships, while the other inland tank fills the truck that serves the small-size ship, as depicted in Figure 3.
Note that LNG carriers are generally used for regional transport, as in our case. Several factors have a strong influence on the use and size of these ships. The main ones are related to the physical characteristics of the ports, such as the berthing site or the draft at the refuelling point, and the actual demand for LNG bunkering.
As already stated, in this first simulation model, a tanker refuels the small ships, as it is generally used for the local transport. Note that to use tankers properly, a relevant constraint related to the distance between the loading and the discharge point must be taken into a proper account. However, in our case, the tanker collects LNG inside the port area and the distance is less than the related constraint, which is 500 m. In our model, we fix the capacity of the tanker at 55 cubic meters.
The decision to use this configuration for the first scenario was dictated by the need to combine two bunkering modes that would allow small and larger ships to be served simultaneously and thus there was a need to evaluate the performance of this configuration. Note that the TTS mode is generally more rigid than the PTS mode, due to the need to refuel the truck once the gas has run out. In contrast, the PTS is operationally the solution that best allows for the continuity of LNG delivery, as more gas is available for delivery.
From the point of view of port operations, this proposed scenario allows for SIMOPS, as loading and unloading of cargo and passengers can be carried out simultaneously with refuelling. However, a clearer evaluation can only be made after introducing the second scenario.
4.2. Second Scenario: Port-to-Ship and Ship-to-Ship
As can be seen from Figure 4, the second scenario differs from the first one for the presence of the Ship-to-Ship refuelling mode that has replaced the Truck-to-Ship mode. Once the carrier arrives at the terminal, the LNG is stored inside two inland tanks. The first one connects the bunker ship, denoted LNG Feeder in our model, for LNG bunkering of the small-size ships. LNG Feeder is a small vessel used to directly refuel LNG-fuelled ships located either inside or outside the port. In the present study we set its capacity at 350 cubic meters. The other tank, as in the previous scenario, is split into two different pipelines to serve the bunkering of the medium- and the large-size ships, respectively.
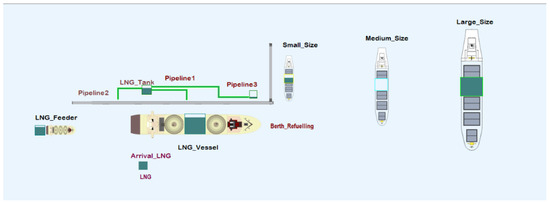
Figure 4.
Second scenario: STS and PTS.
For this second scenario, the simulation study led to the analysis of two different variants of the terminal configuration. In both configurations, a regasification plant replaces the LNG carrier. This implies that the LNG comes from the land and not from the sea. In our model, we set the re-gasifier capacity at that of the vessel carrier, that is, 150,000 cubic meters.
The two proposed variants, depicted in Figure 5 and Figure 6, respectively, differ in the type of ship berthed. More precisely, in the first case, both large-size and medium-size ships are refuelled directly from the berth, while in the second case only the large-size ships are berthed. First, note that a relevant aspect to consider is the port draft. In fact, in the first variant (see Figure 5), the draft must allow for the bunkering of large-size ships. Moreover, the key point of the model representing the first variant lies in the fact that the pipeline representing the quay loading arm is completely dedicated to the large-size ships, making operations faster and more agile than in the second scenario.
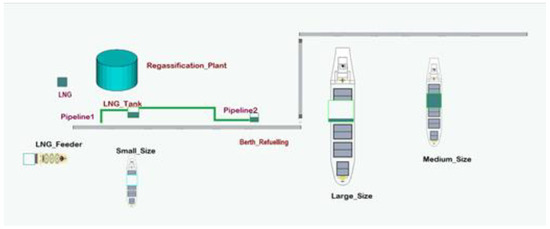
Figure 5.
First variant: second scenario with a regasification plant and only the small-size ship served by a vessel.
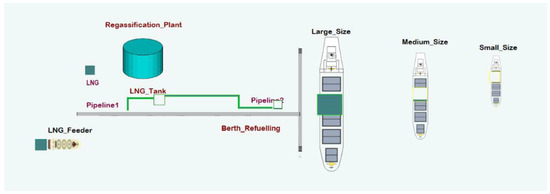
Figure 6.
Second variant: second scenario with a regasification plant and the berthed large-size ship.
Finally, the reader can easily see from Figure 6 that the last configuration differs from the first scenario only in the presence of the regasification plant.
5. Simulation Tests and Discussion
As discussed in Section 4, we executed different runs of the proposed simulation models to analyse the behaviour of the selected configurations for LNG bunkering stations. The focus is on the number of served ships, bunkering time and cost resulting from the steady state behaviour of the related system within the chosen time horizon of one semester. The six-month length of each run was chosen both based on the operational timing of the chosen terminal configurations, and in particular the inter-arrival time of the feeder ship, and the variability of LNG prices, while also considering the minimum time required to obtain meaningful steady-state values. Further, for the comparison of the refuelling and operational cost due to LNG price volatility, we considered four different periods, corresponding to the four semesters from January 2021 to December 2022. Then, we fixed the length of each simulation run to 181 working days of one semester and associated with each run a warm-up period of one month. The warm-up time allowed us to be sure the initial setup period was nullified and to avoid having all the ships empty waiting for the first arrival of the LNG carrier in the initial state of the simulation experiments. We set the time unit of the simulation clock to 1 h. Moreover, in all simulation experiments we introduced in the related model a working shift that ranges from 6 a.m. to 8 p.m. every day. In this way, we implemented in the model the existing regulations in terms of LNG bunkering, avoiding the execution of the required operations in the night hours, thus measuring the terminal operability in a realistic daily time schedule. As usual in port terminals with similar configurations, we also assumed that the small LNG feeder is always available at the terminal, and that it is filled and empty according to the relative flow rate and the time arrival of the LNG vessel. Finally, according to operational statistics, the arrivals of the trucks and of the LNG vessel follow a Poisson process, with an average inter-arrival time, of 6 and 504 h, respectively.
Note that in our simulation experiments the aim was to evaluate the operational effectiveness of bunkering operations and their application together with the economical pros and cons of the terminal configuration represented by the model under analysis in the whole supply chain. For this reason, only operational costs at the terminal have been taken into account, without considering both the costs of the LNG conventional terminal configuration and its setup as well as the LNG transportation cost to the port terminal.
The first test concerned the number of ships served within the considered time horizons in the different proposed configurations. This test was mainly aimed at assessing the operativity considering the refuelling operation carried out by the carrier bunkering ship. Table 3 reports a comparison of this performance measure, expressed in term of average number of ships of each type served in each scenario in one semester. The total operational cost is also given, in reference to the LNG price in the last semester of the considered simulation running time (i.e., from July 2022 to December 2022). Moreover, we considered a refuelling unit cost from the tank at 0.276 USD/mc and a fixed flat-rate cost associated with the small-, medium-, and large-size ships, of 88,000, 120,000 and 177,000 USD, respectively.
Table 3.
Number of served ships of each type (small, medium and large) and total cost observed in each scenario.
It is worth noting that we did not consider in this study the time spent by the ships during their navigation. However, we include the cleaning and service time since this is necessary for the safety and security of the terminal. In all scenarios, this time is set at 4, 8 and 16 h, respectively, for the three different types of ships, namely small, medium and large.
The number of served ships split into their typologies is reported in Figure 7.
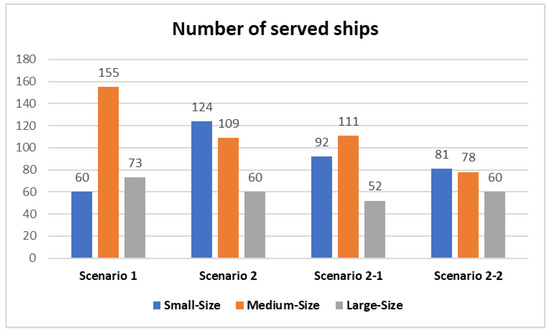
Figure 7.
Comparison of the number of ships served in the different considered scenarios.
It is worth noting that the values reported in Table 3 and represented in Figure 7 are the average number of served ships obtained, executing n = 19 independent simulation runs by just changing the random seeds. The number n of independent runs to be performed satisfies the tn−1-Student confidence interval of the mean values of the relative ship-size types, with a 99% degree of confidence in all scenarios. For example, referring to the number of served small-size ships in the first scenario, from the sampled observations we had the standard deviation s = 4.706; we derived from the table of the t-Student distribution the critical value t18;0.05 = 1.734. Therefore, the confidence interval for the mean value reported in Table 3 is ∗ S/ = 60 . Further, referring to the first scenario, note that the standard deviation of these values is, respectively, 4.702, 8.944 and 5.011, corresponding to a dispersion of 8%, 6% and 7% from the average values, respectively. To give an idea of the values sampled in each run and their dispersion, Figure 8, Figure 9 and Figure 10 report the number of served ships of small, medium and large size, respectively, in the 19 runs of the first scenario.
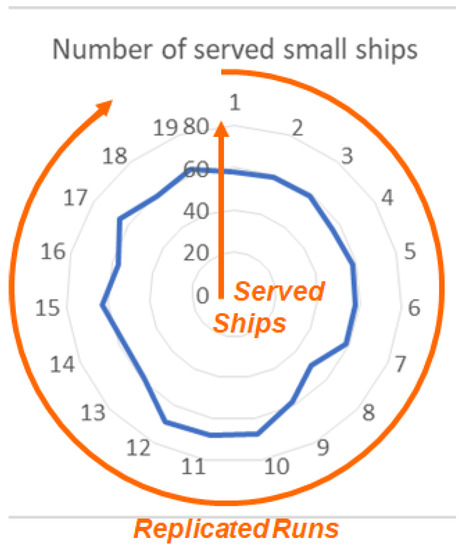
Figure 8.
Number of observed served small-size ships in each of the 19 executed runs.
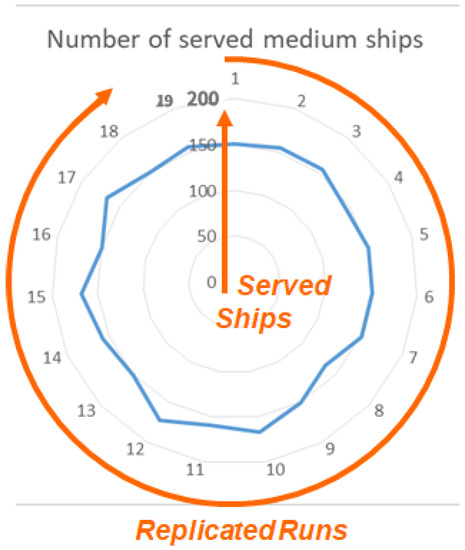
Figure 9.
Number of observed served medium-size ships in each of the 19 executed runs.
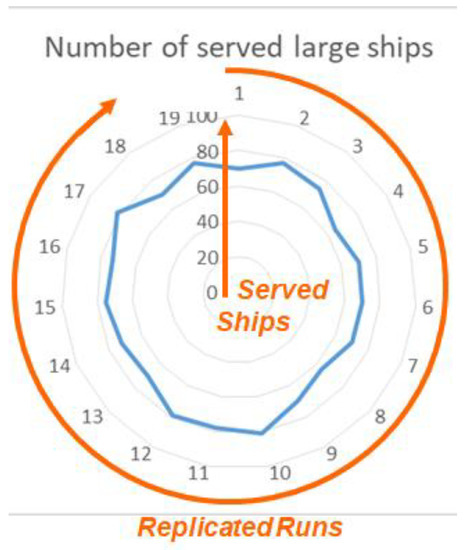
Figure 10.
Number of observed served large-size ships in each of the 19 executed runs.
As a further comparison, Table 4, Table 5, Table 6 and Table 7 report useful information about the volume of LNG arrived, served and used in the main elements of the four proposed models, corresponding to the four different scenarios represented in Figure 3, Figure 4, Figure 5 and Figure 6, respectively. The data refer to the output results of the first generated run in each simulation experiment.
Table 4.
LNG volume of fuelled LNG in the first scenario.
Table 5.
LNG volume of fuelled LNG in the second scenario.
Table 6.
LNG volume of fuelled LNG in the first variant of the second scenario.
Table 7.
LNG volume of fuelled LNG in the second variant of the second scenario.
Readers can easily note that looking at both Table 3 and Figure 7 the first proposed scenario is the most expensive one; however, at the same time it is the best performing one, since it provides the highest volume of LNG to the ships, managing the small-size ships by the trucks and the others by the port bunkering system. The second scenario results in the best trade-off between the total operational cost and the number of served ships. From these aspects, it could be interesting to further investigate the case when the bunkering activity is performed by a combination of TTS and PTS methodologies as well as with respect to other gas price and operation evolutions in the future.
The next computational set of experiments aimed at evaluating the trend of the overall operational cost due the volatility of the average price of LNG in the four semesters from the beginning of 2012 to the end of 2022, as reported in Table 2. This test has been performed by considering the first scenario, described in Section 4.1. The results are reported in Table 8.
Table 8.
Comparison of the LNG cost for ship refuelling in the 4 semesters from January 2021 and December 2022 (referring to the first scenario).
From Table 8, it is quite evident that the increase in the LNG price by more than double in the last two years strongly impacts the entire supply chain of goods. However, looking at Table 2, we can conclude that it is possible to hope that the peak in LNG prices, which happened in 2022 mainly due to the crisis between Russia and Ukraine, is coming to an end, as shown by the prices between January and March 2023, thus favouring the choice of LNG as a less polluting fuel.
6. Conclusions
In this paper, we conducted a case study based on a simulation approach for the evaluation of different LNG bunkering stations in a port terminal located near an urban area, characterizing each one based on the emerging concepts under experimentation in ports. Although previous studies which have been cited in this article and which analyse LNG bunkering stations and the entire LNG supply-chain, have already been conducted, no work prior to this study has been proposed in the literature using a discrete-event dynamic simulation approach, with the objective of evaluating the performance of different LNG station configurations in port terminals in terms of bunkering time, number of ships served and costs. The conducted simulations represent crucial elements to consider as the safety and operational constraints affect the performance based on different solutions and configurations in a quantitative way; it is evident that results proposed in this paper strongly rely on the hypotheses with respect to cost evolution and other boundary conditions. Therefore, the simulation model could be reused based on different assumptions to correct the selection of the most promising alternative solutions with respect to updates on market evolution and/or different port activities and traffics. In reality, it is evident that nowadays a major driver is related to the diffusion of LNG-powered ships; the potential is significant based on actual trends and new ship orders as well as based on the evolution of market and environmental regulations; from another point of view, the big inertia and conservative nature of shipping is well known. However, the growing activations of these facilities (e.g., Yantan & Singapore during the last 6 months) suggest that this solution could have a great potential especially in attracting new and highly profitable ships. Based on this general consideration and considering the specific characteristics of the port and its traffics, the presented simulation allows us to conduct experiments to identify the most promising solutions and related risks and requirement.
In the experimental case proposed in this paper, the results demonstrate that the combination of PTS and STS seems to be very promising in terms of productivity and costs, but obviously these results should be tuned on the hypotheses related to the traffic to be served in a port and the behaviour of prices and operational costs. Therefore, one of the important achievements of this research is the development of a simulation framework, validated and verified in specific configurations, that could serve as a reference for further configurations and different specific engineering and operational variation with respect to proposed processes.
The steady-state results have been sampled by running the simulation over a time horizon of six months to obtain valid results with respect to the stochasticity present in the system and coupled in the models; these results confirm a simulation approach as the main investigation technique for these complex system, as well as a real added value for the development of new infrastructures embedded in supply chains, capable of favouring green transition by considering even operational, safety and economic issues that affect the comprehensive sustainability of future ports.
The experimental results and the capability of extensively conducting quantitative analysis on the different scenarios confirm that a simulation approach is most effective to support decision-makers in the development of new infrastructures embedded in supply chains, and it is able to favour competitiveness, safety, operation efficiency and green transition.
Currently, the authors are conducting further research on the use of LNG in ports, also including models devoted to identifying and simulating vulnerabilities to increase resilience and reduce risks.
Author Contributions
Methodology, A.B. and A.S.; Software, A.S.; Validation, A.B. and A.S.; Writing—review & editing, A.B. and A.S. All authors have read and agreed to the published version of the manuscript.
Funding
This research received no external funding.
Institutional Review Board Statement
Not applicable.
Informed Consent Statement
Not applicable.
Data Availability Statement
Not applicable.
Acknowledgments
This research work has been developed within the “Robotics and AI for Socio-economic Empowerment (RAISE) Project of the University of Genoa, Italy, Spoke 4 “Smart and sustainable ports”, Project 11 “Digital twins and advanced simulators of port activities”.
Conflicts of Interest
The authors declare no conflict of interest.
References
- International Maritime Organization (IMO). IMO and the Environment. 2011. Available online: https://wwwcdn.imo.org/localresources/en/OurWork/Environment/Documents/IMO%20and%20the%20Environment%202011.pdf (accessed on 1 April 2023).
- International Maritime Organization (IMO). Resolution MEPC.320 (74)–2019 Guidelines on Consistent Implementation of 0.50% Sulphur Limit under MARPOL Annex VI; International Maritime Organization: London, UK, 2020; Available online: https://www.imo.org/en/MediaCentre/PressBriefings/pages/34-IMO-2020-sulphur-limit-.aspx (accessed on 1 April 2023).
- Livaniou, S.; Papadopoulos, G.A. Liquefied Natural Gas (LNG) as a Transitional Choice Replacing Marine Conventional Fuels (Heavy Fuel Oil/Marine Diesel Oil), towards the Era of Decarbonisation. Sustainability 2022, 14, 16364. [Google Scholar] [CrossRef]
- European Maritime Safety Agency (EMSA). Guidance on LNG Bunkering to Port Authorities and Administrations, 31 January 2018, emsa.europa.eu. Available online: https://www.emsa.europa.eu/publications/inventories/item/3207-guidance-on-lng-bunkering-to-port-authorities-and-administrations.html (accessed on 1 April 2023).
- Johansson, L.; Jalkanen, J.P.; Kalli, J.; Kukkonen, J. The evolution of shipping emissions and the costs of regulation changes in the northern EU area. Atmos. Chem. Phys. 2013, 13, 11375–11389. [Google Scholar] [CrossRef]
- Li, K.; Wu, M.; Gu, X.; Yuen, K.F.; Xiao, Y. Determinants of ship operators’ options for compliance with IMO 2020. Transp. Res. Part D Transp. Environ. 2020, 86, 102459. [Google Scholar] [CrossRef]
- Sheng, D.; Jiang, J.; Wang, H.; Tan, Z.; Wang, Y. Optimal compliance choices for ocean carriers under the sulphur regulation. Transp. Res. Part D 2023, 116, 103639. [Google Scholar] [CrossRef]
- Cimpeanu, R.; Devine, M.T.; O’Brien, C. A simulation model for the management and expansion of extended port terminal operations. Transp. Res. Part E 2017, 98, 105–131. [Google Scholar] [CrossRef]
- Steinbacher, L.M.; Trapp, M.; Klockgether, K.; Freitag, M. Development of autonomous light control algorithm with a simulation model of a container terminal. Procedia Manuf. 2020, 52, 221–227. [Google Scholar] [CrossRef]
- Musso, E.; Sciomachen, A. Impact of megaships on the performance of port container terminals. Marit. Econ. Logist. 2020, 22, 432–445. [Google Scholar] [CrossRef]
- Carotenuto, P.; Giordani, S.; Zaccaro, A. A Simulation Based Approach for Evaluating the Impact of Maritime Transport on the Inventory Levels of an Oil Supply Chain. Transp. Res. Procedia 2014, 3, 710–719. [Google Scholar] [CrossRef]
- Bruzzone, A.; Massei, M.; Madeo, F.; Tarone, F. Modeling environmental impact and efficiency in maritime logistics. In Proceedings of the Summer Computer Simulation Conference, Ottawa, ON, Canada, 11–14 July 2010; pp. 433–438. [Google Scholar]
- Park, N.K.; Park, S.K. A study on the estimation of facilities in LNG bunkering terminal by simulatio Busan port case. J. Mar. Sci. Eng. 2019, 7, 354. [Google Scholar] [CrossRef]
- Kim, I.; Kim, H.; Chang, D.; Jung, D.H.; Sung, H.G.; Park, S.K.; Cho, B.C. Emergency evacuation simulation of a floating LNG bunkering terminal considering the interaction between evacuees and CFD data. Saf. Sci. 2021, 140, 105297. [Google Scholar] [CrossRef]
- Rean, J.; Liang, H. Measuring the sustainability of marine fuels: A fuzzy group multi-criteria decision-making approach. Transp. Res. Part D Transp. Environ. 2017, 54, 12–29. [Google Scholar] [CrossRef]
- Martínez-López, A.; Caamaño Sobrino, P.; Chica González, M.; Trujillo, L. Optimization of a container vessel fleet and its propulsion plant to articulate sustainable intermodal chains versus road transport. Transp. Res. Part D Transp. Environ. 2018, 59, 134–147. [Google Scholar] [CrossRef]
- Wang, C.; Yan, X.; Zhang, D.; Yang, Z. A novel policy-making aid model for the development of LNG fueled ships. Transp. Res. Part A 2019, 119, 29–44. [Google Scholar]
- Naturalgas.org. Available online: http://naturalgas.org/overview/background/ (accessed on 9 February 2014).
- Peng, Y.; Zhao, X.; Zuo, T.; Wang, W.; Song, X. A systematic literature review on port LNG bunkering station. Transp. Res. Part D 2021, 91, 102704. [Google Scholar] [CrossRef]
- Kana, A.A.; Harrison, B.M. A Monte Carlo approach to the ship-centric Markov decision process for analysing decisions over converting a containership to LNG power. Ocean Eng. 2017, 130, 40–48. [Google Scholar] [CrossRef]
- Guan, G.; Lin, Y.; Chen, Y. An optimisation design method for cryogenic pipe support layout of LNG-Powered ships. J. Mar. Eng. Technol. 2017, 16, 45–50. [Google Scholar] [CrossRef]
- Choi, J.; Park, E.Y. Comparative study on fuel gas supply systems for LNG bunkering using carbon dioxide and glycol water. J. Mar. Sci. Eng. 2019, 7, 184. [Google Scholar] [CrossRef]
- Ge, J.; Wang, X. Techno-economic study of LNG diesel power (dual fuel) ship. WMU J. Marit. Aff. 2017, 16, 233–245. [Google Scholar] [CrossRef]
- Shibasaki, R.; Kanamoto, K.; Suzuki, T. Estimating global pattern of LNG supply chain: A port-based approach by vessel movement database. Marit. Policy Manag. 2020, 47, 143–171. [Google Scholar] [CrossRef]
- Utku, D.H.; Soyöz, B. A mathematical model on liquefied natural gas supply chain with uncertain demand. SN Appl. Sci. 2020, 2, 1496. [Google Scholar] [CrossRef]
- Gore, K.; Rigot-Müller, P.; Coughlan, J. Cost assessment of alternative fuels for maritime transportation in Ireland. Transp. Res. Part D 2022, 110, 103416. [Google Scholar] [CrossRef]
- Liu, B.; Li, Z.-C.; Wang, Y. A branch-and-price heuristic algorithm for the bunkering operation problem of a liquefied natural gas bunkering station in the inland waterways. Transp. Res. Part B Methodol. 2023, 167, 145–170. [Google Scholar] [CrossRef]
- Qi, J.; Wang, S. LNG Bunkering Station Deployment Problem—A Case Study of a Chinese Container Shipping Network. Mathematics 2023, 11, 813. [Google Scholar] [CrossRef]
- Cedigaz Report. 2022. Available online: https://www.cedigaz.org/ (accessed on 1 April 2023).
- Lee, A.; Kim, J. Analysis of Bargaining Power between the EU and Russia by Altering Gas Supply Network Structure. Sustainability 2023, 15, 4655. [Google Scholar] [CrossRef]
- Banks, J.; Carson, J.; Nelson, B.; Nicol, D. Discrete-Event System Simulation, 4th ed.; Pearson: London, UK, 2005. [Google Scholar]
- Italian Ministry of Economic Development. LNG Supply and Storage Document. Available online: https://www.mise.gov.it (accessed on 1 April 2023).
- Ychart. Available online: https://ycharts.com/indicators/us_natural_gas_liquefied_exports_price (accessed on 1 April 2023).
- Acciaro, M. Real option analysis for environmental compliance: LNG and emission control areas. Transp. Res. Part D Transp. Environ. 2014, 28, 41–50. [Google Scholar] [CrossRef]
- Zheng, S.; Chen, S. Fleet replacement decisions under demand and fuel price uncertainties. Transp. Res. Part D Transp. Environ. 2018, 60, 153–173. [Google Scholar] [CrossRef]


Disclaimer/Publisher’s Note: The statements, opinions and data contained in all publications are solely those of the individual author(s) and contributor(s) and not of MDPI and/or the editor(s). MDPI and/or the editor(s) disclaim responsibility for any injury to people or property resulting from any ideas, methods, instructions or products referred to in the content. |
© 2023 by the authors. Licensee MDPI, Basel, Switzerland. This article is an open access article distributed under the terms and conditions of the Creative Commons Attribution (CC BY) license (https://creativecommons.org/licenses/by/4.0/).