Article

Prevalence of Enterovirus in Water Consumed in Rural Areas in a State in the Midwest Region of Brazil

by
Graziela Picciola Bordoni
1,
Lucas Candido Gonçalves Barbosa
2,
Thais Reis Oliveira
2,
Fernando Santos Lima
1,
Viviane Monteiro Goes
3,
Mariely Cordeiro Estrela
3,
Priscila Zanette de Souza
3,
Mônica de Oliveira Santos
2,
Guilherme Rocha Lino de Souza
4,
José Daniel Gonçalves Vieira
1,
Paulo Sérgio Scalize
5 and
Lilian Carla Carneiro
1,*
1
Institute of Tropical Pathology and Public Health, Federal University of Goiás, 235 Street, Goiânia 74605-050, Brazil
2
Medicine College, Federal University of Goiás, 235 Street, Goiânia 74690-900, Brazil
3
Paraná Institute of Molecular Biology (IBMP), Professor Algacyr Munhoz Mader Street, 3775—Industrial City of Curitiba, Curitiba 81350-010, Brazil
4
Institute of Biological Sciences, Federal University of Goiás, Chácaras California Avenue, Goiânia 74690-612, Brazil
5
School of Civil Engineering, Federal University of Goiás, Q University Street, lt. 1488, bl. A, sl. 7, Goiânia 74605-010, Brazil
*
Author to whom correspondence should be addressed.
Sustainability 2023, 15(13), 9886; https://doi.org/10.3390/su15139886
Submission received: 18 May 2023 / Revised: 6 June 2023 / Accepted: 15 June 2023 / Published: 21 June 2023

Abstract

:
Individuals in rural communities often obtain water from surface and groundwater sources, where the microbial quality is often unknown. Enteric viruses are among the main pathogenic microorganisms responsible for waterborne disease outbreaks. Thus, the objective of this work was to search for enterovirus in water samples from 25 rural communities. For this, 160 water samples were collected. Detection and quantification of the enterovirus (EV) were performed through molecular tests using the two main amplification reagents for qPCR. The prevalence of EV was identified in 4.4% (7/160) of the samples when Sybr Green® was used, all in groundwater sources. Additionally, EV was found in 9.7% of shallow tubular wells, 3.8% of deep tubular wells, 4.3% of shallow dug wells and 5.9% of spring water. When using TaqMan®, there was no amplification of the EV cDNA. Conclusions: Sybr Green®, being a more accessible reagent, has a greater predilection for molecular tests, but the study showed that Taqman® could suffer less interference from environmental samples, resulting in more reliable values of viral quantification. In this context, the detection of EV in groundwater can help in monitoring the virus in this source, in addition to helping managers of these communities in decision making.

1. Introduction

Groundwater and surface water are the two types of water sources available for human consumption [1]. Groundwater is found below the surface of the soil, filling the pores of rocks and sediments completely, constituting the aquifers. It is extracted from springs, shallow wells and tubular wells [1,2]. Surface waters are water bodies formed by water flowing over the soil surface, such as streams, rivers, lakes, reservoirs and/or oceans [2,3].
Access to sanitation is seen as the fundamental condition for human dignity and survival, as well as is the adequate supply of water in quantity and quality [4]. The quality of surface and groundwater is conditioned by linked natural variables, such as rainfall, surface runoff, geology and vegetation cover, and by anthropological impacts, such as the disposal of domestic or industrial sewage (treated or not), leaks from septic tanks, disposal of animal waste from agricultural areas, disposal of polluted rainwater and urban solid waste and poor soil management [5,6]. The direct consequence of the loss of water quality falls not only on the population that consumes it or is in direct contact with it, but also on the lives of all living beings, putting them at risk [5,6].
Approximately 75% of the global population, who live in rural areas, do not have access to clean water sources and basic sanitation [7]. Recent World Health Organization/United Nations Children’s Fund (WHO/UNICEF) data on access to safe water, inadequate sanitation and hygiene (WASH) show that eight out of every ten people do not have access to safe water, and seven out of every ten people without access to basic sanitation live in rural areas [8,9,10].
Rural communities are often located far from urban centers, where the ability to provide a centralized potable water system is drastically reduced, making them isolated. This is due to the difficult access, the great distance and separation between households and from households to the municipal seat, the low population density, and the situation of land irregularity. Thus, individuals obtain water from surface and groundwater sources, where the microbial quality is often unknown [11,12].
The inefficiency or lack of protection in water resources can introduce numerous pathogens, such as viruses, bacteria and other microorganisms, making them inappropriate for consumption and causing outbreaks of waterborne transmission [13]. Enteric viruses are among the main pathogenic microorganisms [14,15,16,17] and they are transmitted by the fecal–oral route, directly or indirectly, either when there is direct person-to-person contact, through fomites, droplets and human contact, when the host becomes contaminated through the ingestion of contaminated water or food or through recreational activities in aquatic environments contaminated by feces [15,18]. It is primarily in the gastrointestinal tract of patients that viruses will infect and replicate [15,18].
Waterborne diseases can cause various effects on human health varying in severity from mild to severe [19,20]. Although self-limited gastroenteritis and diarrhea are the main manifestations caused by enteric virus infection, they are also capable of causing respiratory infections, hepatitis, and conjunctivitis, in addition to high-mortality diseases such as encephalitis, aseptic meningitis and paralysis in immunocompromised patients [18]. Factors such as the strain and virulence of the virus, the immune status, age of the host, and the route of infection influence the development of clinical disease [13,15,21,22,23].
In general, enteric viruses have great potential to be used as water quality indicators, as well as to identify the dominant source of fecal contamination in water [15,22]. There are more than 200 enteric viruses distributed in nature [23], and of all, those that are most frequently proposed as indicators of contamination in the aquatic environment include enterovirus (EV), rotavirus (RV) and adenovirus (HAdV) [13,24,25,26,27].
Human enteroviruses (hEV) cause outbreaks and isolated cases in developed and low- and middle-income countries [18]. In the United States, it is estimated that there are 30 to 50 million new infections of enterovirus per year, of which only 5 to 15 million are symptomatic [28]. Between 2008 and 2012, an outbreak of hand, foot and mouth disease caused great alarm in China, with an estimated 7.2 million people infected [29]. Due to rumors that polio vaccination could lead to sterility, Nigeria decided to extend the ban on immunization in the 2000s, which caused an increase from 50 cases to 250 in 2003 and the poliovirus was exported to 25 other countries that had been declared polio-free [29]. Since 2006, four countries have become endemic for the presence of the wild strain of poliovirus: Afghanistan, which in 2005 had 9 confirmed cases of poliomyelitis, Nigeria with 799 cases, India with 66 cases and Pakistan with 28 cases [28]. In Afghanistan, in 2009–2010, the first case of vaccine-derived poliovirus (VDPV) infection was reported. of the VP1 capsid. In 2012, 11 cases were reported [29].
Research on Enterovirus has resulted in the pathogen being found in various types of both surface and groundwater [18,30]. They can be found in rivers, sewage, fresh water, marine water, wells and even in drinking water, post-conventional treatment [18,30]. They can infect millions of people around the world [18]. The enterovirus genus, belonging to the Picornaviridae family, has 15 species, of which seven are associated with human infection, including EV-A to EV-D and rhinovirus (RV)-A, B and C [15,18,23]. They are among the smallest known viruses, measuring between 20 nm to 30 nm in diameter [15,18,23,24]. They are non-enveloped viruses and have in their genome a positive-sense single-stranded RNA that is inserted into an icosahedral capsid [15,18,23]. They can cause a wide range of diseases, such as hand, foot and mouth disease, myocarditis, encephalitis and acute facial paralysis, which tend to be more severe in neonates and immunocompromised individuals, although infections are usually asymptomatic [15,18,23].
The techniques developed in molecular biology enabled the growth of environmental virology, due to the fact that the polymerase chain reaction (PCR) became a technique of choice for being faster, less expensive, and more specific than is the method of detection by culture of cells [31,32]. The emergence of PCR enabled the detection of human enteric viruses in environmental water, even when they could not be detected via routine cell culture [33]. Cell culture was the most commonly used method to detect and isolate infectious enteric viruses, in the first studies on the occurrence of human enteric viruses in the aquatic environment [15,34]. Methods such as complement fixation, enzyme immunoassay and radioimmunoassay were also used for viral detection in clinical samples, but they were expensive and lacked the sensitivity to detect them in water samples [7].
Unlike conventional PCR, real-time quantitative PCR allows the detection of the concentration of the target DNA cycle by cycle, with high sensitivity and specificity of the emitted fluorescence intensity [35,36]. It is possible to obtain the results qualitatively (presence or absence), or quantitatively [35,36]. The instrument for carrying out the qPCR consists of a thermal cycler that must have an integrated excitation light source (a lamp, a laser or LED—light emitting diode), a fluorescence detection system or fluorimeter and a software that will show the fluorescence data from the generation of a DNA amplification curve. For this, it is necessary to add a dsDNA intercalating dye or fluorophore-labeled probe to the reaction mixture [35].
DNA detection in qPCR can be carried out using several methods and can be divided based on the fluorescent agent used and its specificity in detection, into two groups. The first group is represented by Sybr Green I® and Eva Green®, known to be dsDNA intercalator agents and to be capable of detecting both specific and non-specific amplification products [35]. The second group is able to detect only specific PCR products using fluorophores that are linked to oligonucleotides [35]. This same group can be further divided into three subgroups according to the type of fluorescent molecule that is added to the reaction: (1) primer-probes, which are probes that act as primers; (2) hydrolysis probes, which in the extension phase are degraded, emitting a fluorescent light and hybridization probes that give a fluorescent signal when they bind to the DNA target during the amplification reaction; and finally (3) nucleic acid analogues [35,37].
Sybr Green® and TaqMan® are the most commonly used fluorescent reagents for detecting enteric viruses by qPCR [34,35,36,37,38]. Sybr Green® is an asymmetrical cyanine dye, and has a high dsDNA binding affinity due to its two positive charges under standard PCR reaction conditions [35,37]. Its structure is formed by (2-[N-(3-dimethylaminopropyl)-N-propylamino]-4-[2,3dihydro-3-methyl-(benzo-1,3-thiazol-2-yl)-methylidene]-1-phenyl-quinolinium) [35]. Its mechanism of action works from the binding of the dye to the minor groove of dsDNA [35,37]. When binding to double-stranded DNA, the dye undergoes changes in its molecular structure, being able to absorb blue light and emit intense green light [35,37]. As more DNA is formed in the qPCR, more dye molecules bind to the DNA, thus increasing the fluorescence, which can be measured in the extension phase of each qPCR cycle [35,37]. Its main advantage is related to the lower cost when compared to that of dyes that require fluorescent probes [37]. However, due to its non-specificity, it is necessary to perform a melt curve analysis after each qPCR round for the selective detection of multiplex PCR amplicons [35,37].
There are two types of probes: hydrolysis and hybridization [35]. The probes are oligonucleotides with an attached donor (reporter) and/or acceptor fluorophore (quencher) [25]. The probe’s mechanism of action will depend on the 5′-3′ exonuclease activity of the Taq polymerase enzyme, which degrades the probe during dsDNA amplification [35,37]. Fluorescence will only be detected at the end of the strand extension phase, being proportional to the amount of specific products formed in the amplification reaction [35,37]. Taqman® probes are probes that have a fluorescent donor moiety at their 5′ end, which is quenched by the acceptor moiety at the 3′ end, due to their proximity [35,37]. As a hydrolysis probe, Taqman® binds to specific target regions of DNA. As shown before, the donor fluorophore is quenched by the acceptor fluorophore [35,37].
However, Sybr Green® binds to all double-stranded DNA (including dimers) and water samples contain organic and inhibitors substances that can be co-concentrated during sample processing, affecting qPCR, thus causing nonspecific reactions, and this has been identified as one of the problems in the use of Sybr Green® [34]. TaqMan® has the advantage of being more sensitive when compared to Sybr Green® in virus detection [39,40,41]. For the detection of environmental viruses in different matrices, the TaqMan® probe is widely preferred [39,40,41].
The identification of enterovirus through water analysis is essential for EV identification and monitoring, allowing for the necessary actions to eliminate these micro-organisms, before the water is distributed for human consumption, as well as in the construction of mechanisms to avoid its contamination, or even the recovery of already contaminated sites [13].The aim of the study was to perform the detection and quantification of enterovirus through molecular tests, comparing the two main amplification reagents for qPCR, Sybr Green® and TaqMan®, since Sybr Green® can suffer interference from organic or inorganic components present in water samples, causing unspecific amplifications, in samples from different water sources used for consumption in rural communities in the interior of the State of Goiás, Brazil.

2. Materials and Methods

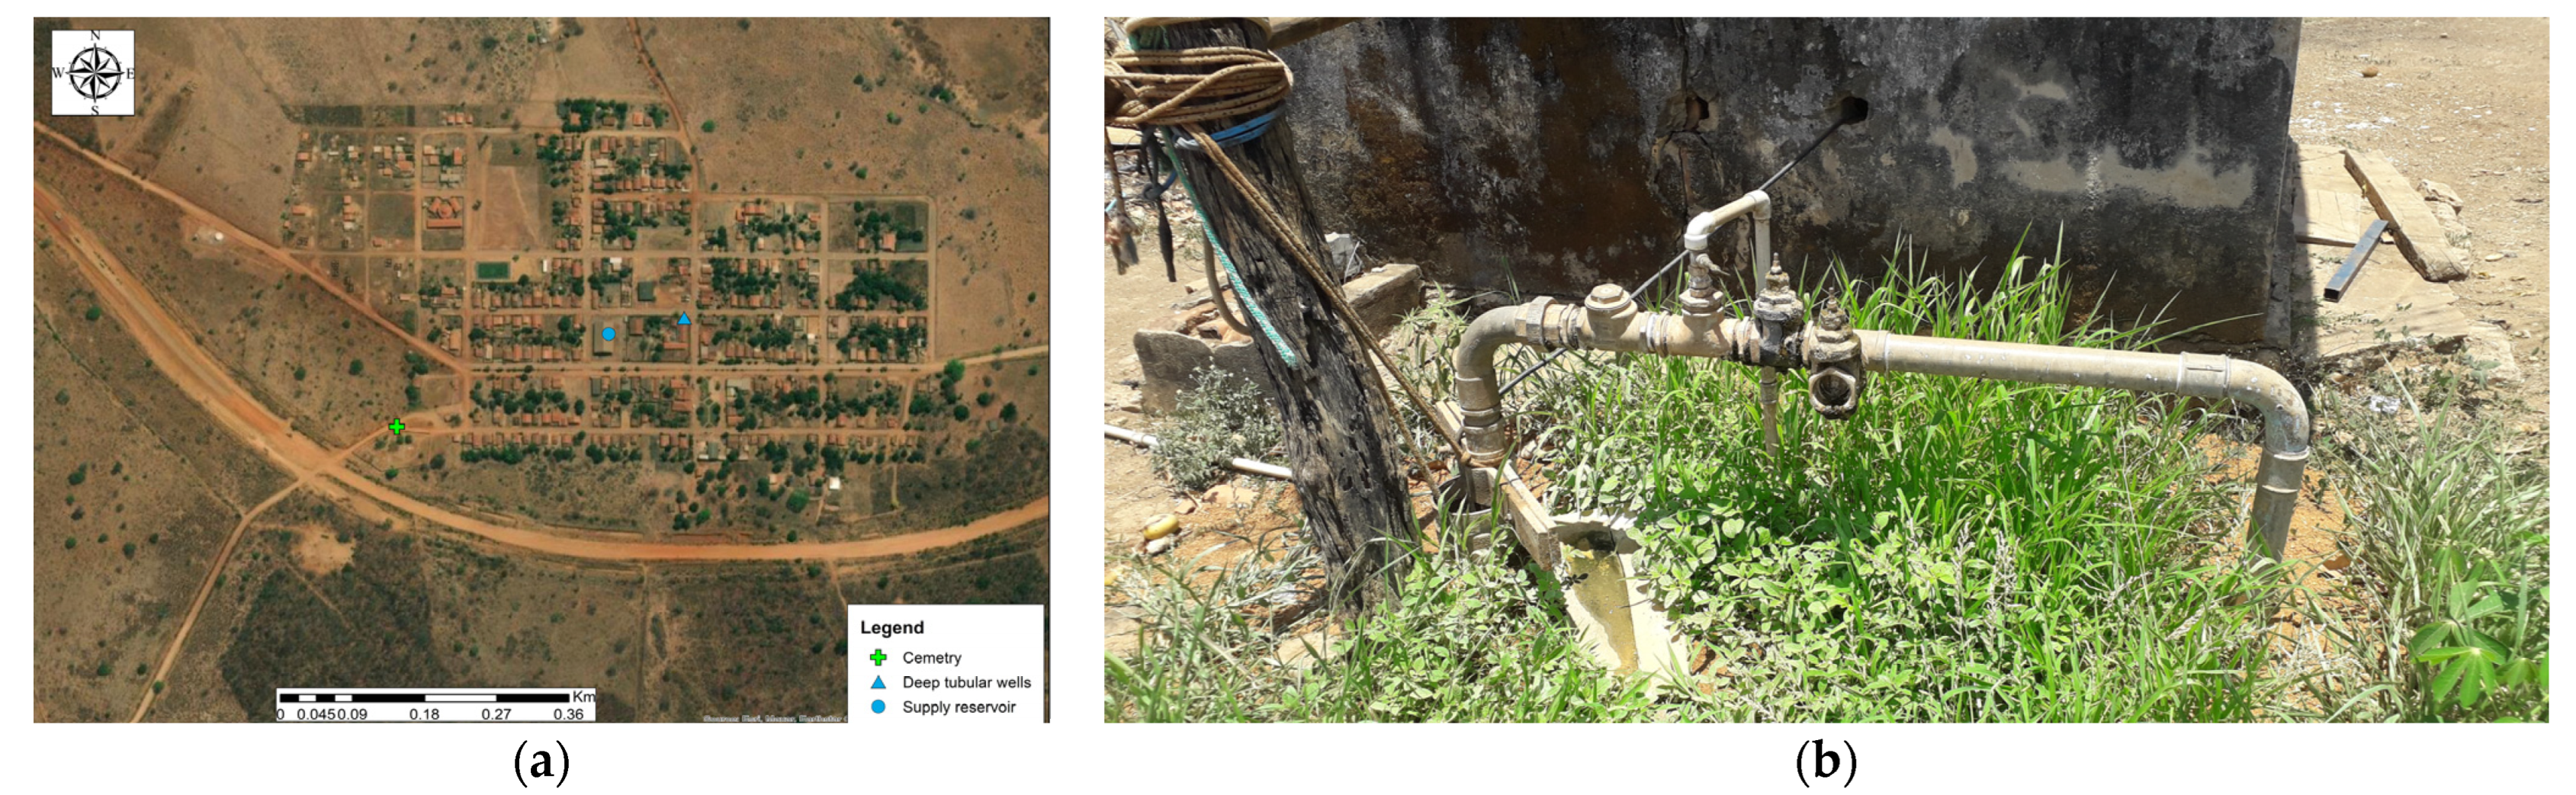
2.1. Sampling Methodology and Site Description

The study was carried out from water samples collected in rural and traditional communities in different municipalities in the State of Goiás, Brazil (Figure 1). The settlement, quilombola and riverside communities, their municipalities and the geographic coordinates of the respective collection points that were part of the research are detailed in Table S1 (Supplementary Materials).
The samples used in the study were collected between October and December 2021. Viral concentration and quantification were performed on samples with a volume of 500 mL of water collected in sterilized bottles. A total of 160 water samples were collected, whose sources were groundwater, represented by 31 shallow tubular wells, 27 deep tubular wells, 47 shallow dug wells and 17 springs, in addition to 17 forms of surface water, 19 forms of rainwater stored in cisterns and 2 water trucks (that were collected from surface water). Samples were collected from 15 water supply systems (WSS), which collectively serve the population through a distribution network, two samples were from a collective alternative solution (CAS) that serves the population collectively without a distribution network and 143 were from an individual alternative solution (IAS). In this research, the CAS was considered a WSS, since it serves the population collectively. After collection, the samples were kept in a thermal box that was refrigerated and transported to the laboratory, and then we proceeded with the viral analyses. In the laboratory, the samples were kept refrigerated at 4 °C until the following analyses.

2.2. Viral Concentration and Molecular Analysis

For the concentration of water samples, the adsorption–elution methodology described by Katayama et al. (2002) [42] was used with modifications, similarly to what was carried out by Vecchia et al. (2012) [43]. Initially, 0.6 g of MgCl2.6H2O was mixed with the water sample and the pH was adjusted to 5 ± 0.5 using 10% HCl and/or a 1 M NaOH solution. Samples were vacuum-filtered through a 47 mm diameter membrane with a 0.45 μm pore composed of mixed cellulose esters (Millipore HAWP04700), which gave the membrane a negative electrical charge. After, 87.5 mL of a 0.5 mM H2SO4 solution (pH 3) was passed through the membrane, using the same filtration system, to release the adsorbed cations.
Following this, the membrane was transferred to a 5 mL sterile centrifuge tube containing 2.5 mL of NaOH at a 1 mM (pH 10.5) concentration, and the sample was shaken for 5 min to elute the virus particle potentially adsorbed on the membrane. After, the membrane was removed from the tube and the remaining mixture was neutralized with 12.5 μL of 50 mM H2SO4 and 12.5 μL of a 100× concentrated Tris-EDTA (TE) buffer. The concentrated samples were frozen at −80 °C until the nucleic acid extraction step.
All reagents were provided and purchased by our laboratory through funding from FAPEG (Research Support Foundation of the State of Goiás) and PPSUS (Research Program for SUS).

2.2.1. Extraction of Viral Nucleic Acids—Sybr Green®

Viral nucleic acid was extracted using the Mini Spin Virus DNA/RNA (KASVI®) extraction kit, following the manufacturer’s instructions. Briefly, 250 μL of the sample was extracted and the nucleic acid adsorbed on the kit column was eluted in 30 μL of nuclease-free water. The extraction product was stored at −80 °C until the reverse transcriptase–qPCR (RT-qPCR) step.

2.2.2. Extraction of Viral Nucleic Acids—Taqman®

A volume of 200 μL of nucleic acids was extracted. The extraction was performed using the Biospin Virus DNA/RNA Extraction Kit (BIOFLUX®). A total of 50 µL of nucleic acids adsorbed on the kit column were eluted in nuclease-free water. The extraction product was stored at −80 °C until the qPCR step.

2.2.3. Viral Controls

For the absolute quantification of viral particles in the samples, five-point standard curves were obtained for the Sybr Green® and TaqMan® system. In the Syber Green® system, the standard curves were generated from the EV RNA, and the positive cDNA control was synthesized. Regarding the TaqMan® system, the standard curves were also generated from the amplification of the EV standard control through qPCR. The cDNA synthesis step of the EV positive control was performed before the qPCR step using a commercial kit, not requiring RT-qPCR. All standard curves points were carried out in a factor 10 serial dilutions.
The EV positive control was poliovirus type 1 isolated in Sabin vaccine cells (enterovirus species C).

2.2.4. Detection and Quantification of Enterovirus Using the Sybr Green® System

For EV detection and quantification, RT-qPCR steps were performed using the double-stranded DNA intercalator Sybr Green® as a fluorophore. The samples, when detected by the Sybr Green® reagent, had not gone through the cDNA synthesis step, as the kit was unavailable for use. Therefore, for EV detection, the RT-qPCR step was performed in a single step. The RT-qPCR cycles were performed using the LightCycler® 480 Real-Time PCR System (Roche Molecular Systems, Inc., Pleasanton, CA, USA) with 96-well plates and analyzed using Light Cycler® 480 software, version 1.5. RT-qPCR results were given in genomic copies per liter (GC/L). Primers for EV are from the highly structured 5’ region shared by enteroviruses. The primer used is described in Table 1.

RT-qPCR

The reaction was proceeded using a 15 μL final volume reaction. The volume was composed of 7.5 μL of a real-time PCR mastermix solution, SybrGreen/ROX 2x (QuatroG®), provided and purchased by our laboratory through funding from FAPEG (Research Support Foundation of the State of Goiás) and PPSUS (Research Program for SUS), 0.5 μL of each oligonucleotide (10 pmol/μL), 0.5 μL of the reverse transcriptase enzyme, provided by researchers from the Institute of Molecular Biology of Paraná (IMBP), Viviane Monteiro Goes, Mariely Cordeiro Estrela and Priscila Zanette de Souza, 5 μL of the sample and 1 μL of DNAse/RNAse-free ultrapure water. The RT-qPCR cycle consisted of only one cycle of 15 min at 45 °C and one cycle of 2 min at 95 °C, to activate the RT enzyme. After this initial step, 40 cycles followed, consisting of a step of 15 s at 95 °C for denaturing the strand and a step of 1 min at 62 °C for annealing the oligonucleotides to the strand and extending them. Fluorescence acquisition is always generated in the last step. To generate the standard curve, a factor 10 serial dilution of the enterovirus standard control was used, from the 10−1 to the 10−5 dilution, starting from 3.5 × 10⁸ genomic copies per reaction. In each round of RT-qPCR, a negative control was applied while performing the reaction without the cDNA.
The standard curves were validated by observing the correlation coefficient parameters (≥0.98), reaction efficiency (between 90 and 110%) and slope (between −3.44 and −3.26). In order to consider detections, the limit considered for positivity (threshold—T) equal to 2.2 for EV was considered, taking into account the increase in specificity and reduction in sensitivity of the RT-qPCR technique of the Sybr Green® type. Positive amplifications up to cycle 40 (CT—threshold cycle) or lower were considered.

2.2.5. Detection and Quantification of Enteric Viruses Using the TaqMan® System

When the TaqMan® fluorophore was used for viral load detection and quantification, only the qPCR reaction was performed, as the cDNA synthesis kit was already available. The set of primers used in the reaction were purchased by Thermofisher Scientific® through the TaqMan™ Gene Expression Assays® (FAM) product from Applied Biosystems™. The qPCR cycles were performed using the StepOnePlus™ Real-Time PCR System (Applied Biosystems™) with 96-well plates and analyzed using the StepOne software, version 2.3. The qPCR results were given in genomic copies per liter (GC/L). The EV primers used in this study are specific for all enterovirus species.

cDNA Synthesis for the TaqMan® System

Due to the genetic material of the enterovirus being RNA, for the analysis and quantification of EV, it was necessary to carry out the synthesis step of the complementary DNA strand (cDNA) of the samples and standard positive control of EV, after extracting the nucleic acids. For this purpose, high-capacity cdna reverse transcription kits (Applied Biosystems©) were used, provided by the SanRural project (FUNASA and Ministry of Health), following the manufacturer’s instructions. According to the manual, all reagents must be kept on ice for the preparation of the 2× Reverse transcription master mix. In a nuclease-free 1.5 mL tube, 2.0 µL of 10× RT buffer, 0.8 µL of 25× dNTP mix (100 mM), 2.0 µL of 10× RT random primers, 1.0 µL of MultiScribe™ reverse transcriptase and 4.2 µL of nuclease-free water were added to prepare the 2× reverse transcription master mix. Soon after, the master mix was left on ice and shaken slightly. Then, 10 μL of the 2× RT reverse transcription master mix was pipetted into a 200 μL PCR microtube, 10 μL of the extracted samples was pipetted and the mixture was homogenized. The final mixture was incubated according to the following sequence: 10 min at 25 °C, 120 min at 37 °C, 5 min at 85 °C and a final HOLD step at 4 °C, ∞. Incubation was performed in Eppendorf® Vapo.protect Mastercycler® Pro (Eppendorf®, Germany). The synthesis product was frozen at −80 °C until the quantitative real-time polymerase chain reaction (qPCR) was performed.

2.2.6. qPCR

The final volume of the reaction was 10 µL. In a nuclease-free 1.5 mL tube, 5 μL of MasterMix Taqman FioCruz®, provided by researchers from the Institute of Molecular Biology of Paraná (IMBP), Viviane Monteiro Goes, Mariely Cordeiro Estrela and Priscila Zanette de Souza, 0.5 μL of TaqMan™ Gene Expression Assay (20×), provided by the SanRural project (FUNASA and Ministry of Health), 0.1 μL of ROX and 3.4 μL of nuclease-free water were pipetted. The mix was then homogenized in a vortex and centrifuged at 10,000 rpm for 2 s, to remove droplets from the lid of the tube. Right after, 9 μL of the mix was transferred to a 96-well qPCR plate and 1 μL of the sample containing cDNA was added to the respective wells of the qPCR plate. The reaction consisted of 1 cycle of 95 °C for 10 min to activate the polymerase enzyme, followed by 40 cycles consisting of a denaturation step for 15 s at 95 °C and an annealing/extension step for 1 min at 60 °C.
In each round of qPCR, a negative sample was used (nuclease-free water in the place of the sample). The absolute quantification of the viral particle in the samples was performed using a five-point standard curve, which was obtained in each round of qPCR, amplifying the standard control using a 10-fold serial dilution. For EV, the dilutions started with 6.2 × 10⁸ GC per reaction. Standard curves were validated by looking at correlation coefficient parameters (≥0.98), efficiency of reaction (between 90 and 110%) and inclination (between −3.44 and −3.26). In terms of the detections, the limit considered for positivity (threshold—T) equal to 2.0 was considered, taking into account the increase in specificity and sensitivity of the TaqMan® qPCR technique, considering positive amplifications up to cycle 40 or less (CT—threshold cycle).

2.3. Statistical Analysis

To assess the association between the type of source of collection and the presence of the type of virus, a logistic regression test was performed, and it was possible to determine the odds ratio (OR) for estimating the effect size. For the acceptance of the association hypothesis and rejection of the null hypothesis (H0), the significance limit of 5% was considered. The presence of the virus was considered the dependent variable, and the types of sources were considered the independent variables. To increase sensitivity, considering the sample size, we considered the chi-square test and Fisher’s exact test to confirm or rule out this association. Statistical analyzes and graphics were performed using Jamovi® version 2.2, Minitab® version 19 and GraphPad Prism® version 9.0.

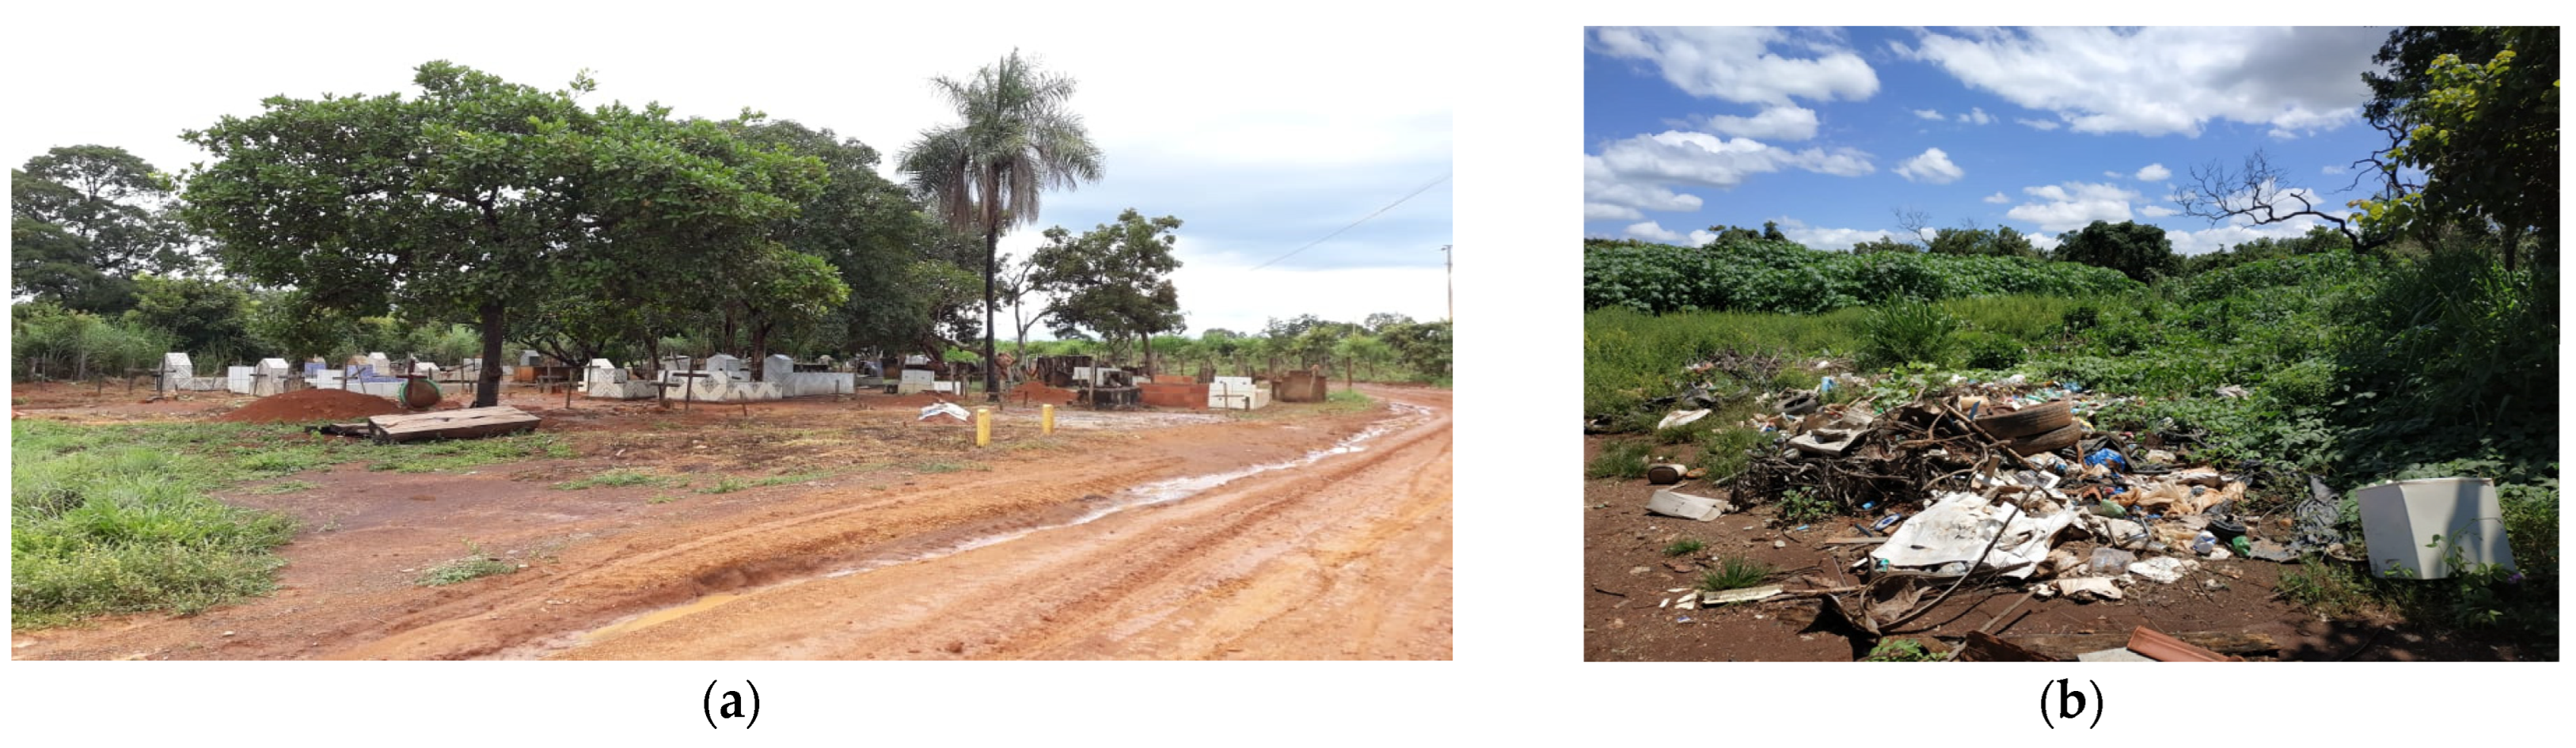
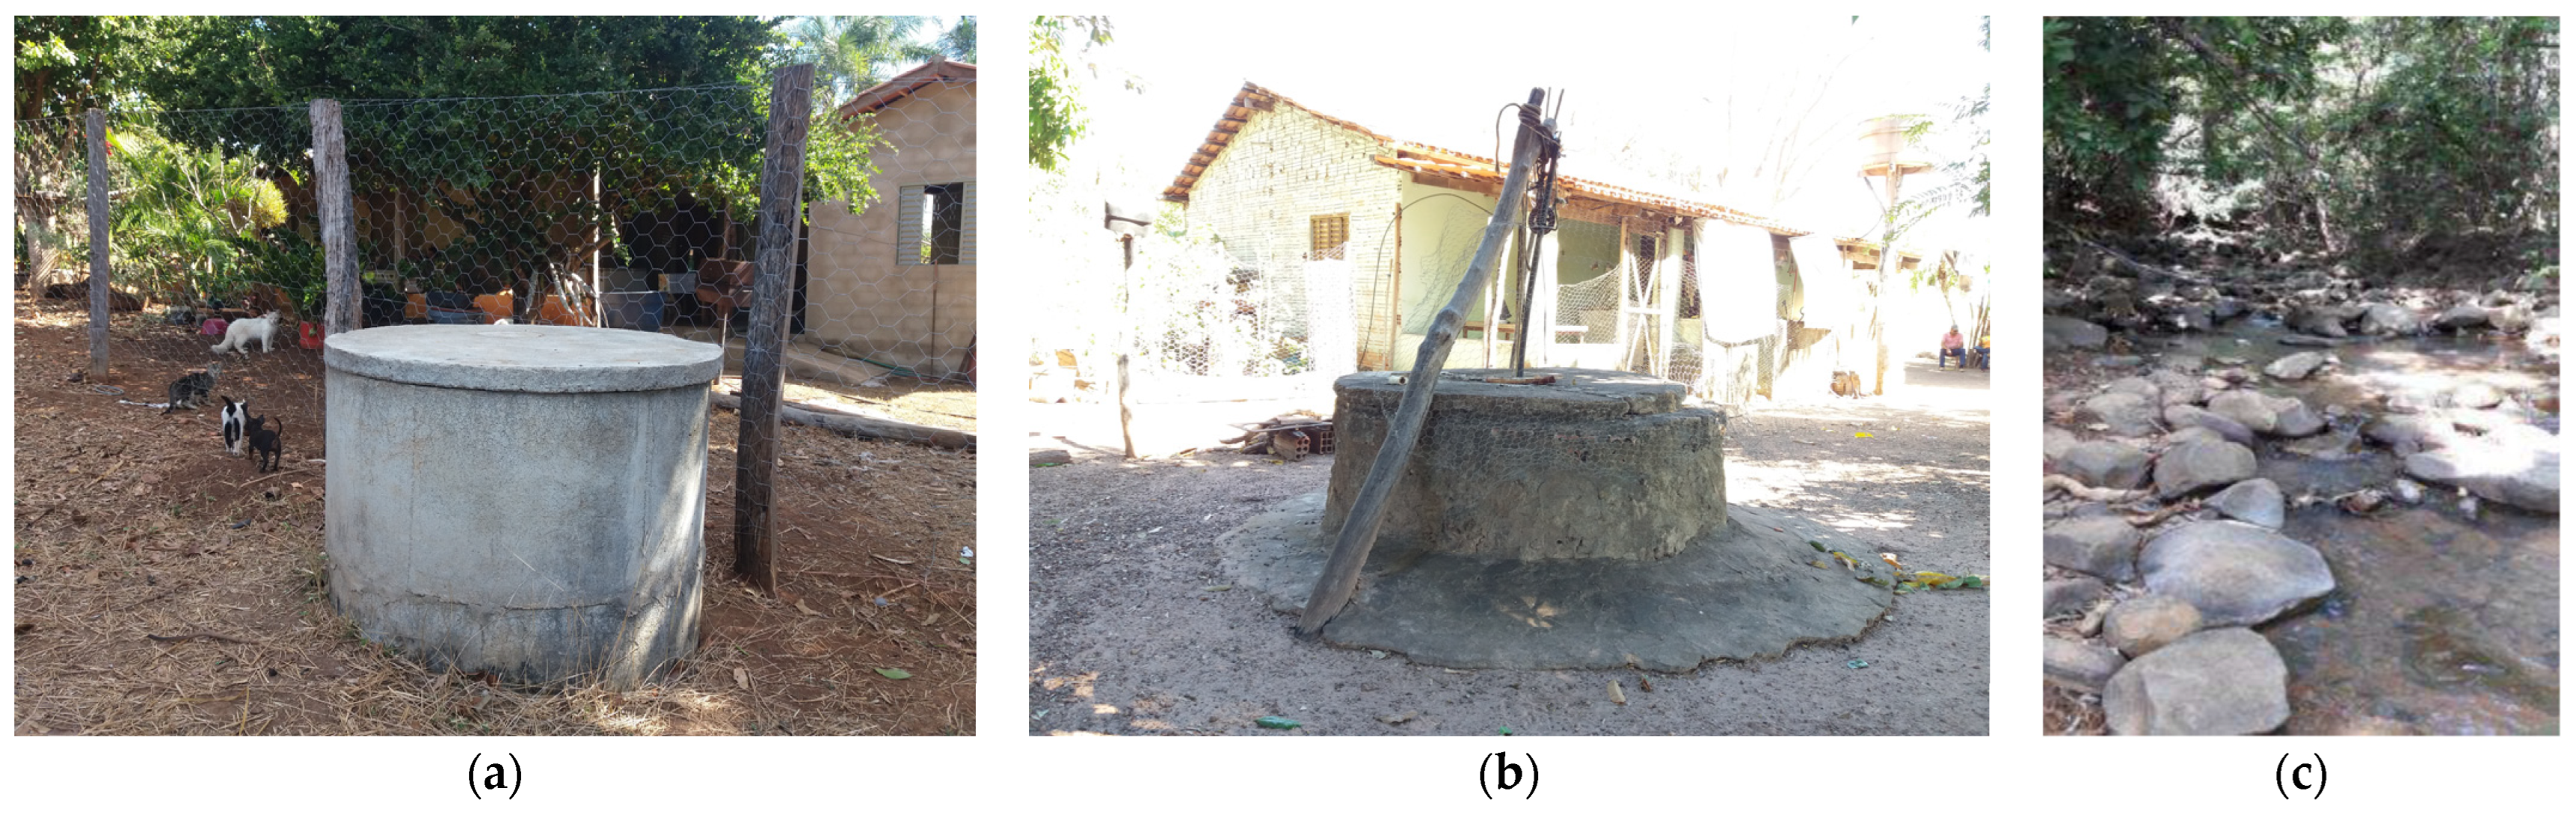
2.4. Sanitation Conditions

In households where the presence of EV was found in the water supply, using any of the methods applied, data collection was carried out in the field, relating to the source of water supply and possible sources of contamination. For this, data were collected regarding the presence of places for the disposal of domestic sewage, as well as pigsties, corrals and chicken coops, in addition to verifying the distances from these contaminating sources to the source of water supply. Structural conditions such as the way of removing water, the presence of a wall, protection fence and roof were verified. The data obtained were plotted and the results were analyzed descriptively with the presence of EV.

3. Results

A total of 160 water samples from collective and individual sources, acquired from rural properties, were analyzed. The amount of enteroviruses found in each type of source is shown in Table 2.
When the Sybr Green® fluorophore was used, the prevalence of EV was identified in 4.4% (7/160) of the samples. It is observed that only one positive sample for EV was found in a WSS (3.7%; 1/27). In the case of IAS, there were six positive samples for EV, three in shallow tubular wells (9.7%; 3/31), two in shallow dug wells (4.2%; 2/47) and one in spring (5.9%; 1/17). In Table 2, it is possible to notice that all positive samples for EV were found only in groundwater sources, with a prevalence of 5.7% (7/122). When comparing the subtypes of groundwater sources, EV had the highest prevalence in shallow tubular wells, with 9.7% (3/31).
The geometric mean concentration of the viral indicator was 7.4 × 10⁵ CG/L, with its minimum concentration found being 1.6 × 10² CG/L, and its maximum concentration being 5 × 10⁶ CG/L, found in a shallow dug well.
When statistical analyses were performed (Table 3), there were no statistically significant associations, for both the logistic regression test and the chi-square tests as well as the Fisher’s exact test (X2 = 3.91, p-value = 0.68 and Fisher’s p-value = 0.70, respectively), between the presence of the virus and water sources. Logistic regression was considered to verify possible biased results; although there was no statistical significance, through the odds ratio it was possible to verify which group the prevalence pertains to. Fischer’s exact test and the chi-square test are more sensitive; however, they do not present a result that quantifies the difference or prevalence, presenting only the p-value. The three tests were considered, despite the chi-square and Ficher’s exact test not being significant, and logistic regression was applied for analysis of central trends.
In contrast, when using the TaqMan® method, the results obtained showed that there was no amplification of the EV cDNA in the analyzed water samples.
The data collected in the field regarding the possible sources of contamination and the conditions regarding the existing protection for the supply sources are presented separately for the WSS, which collectively serves a population for the IAS; that is, where each household had its own source. In all situations, the water is removed by pumping, with no handling, as occurs when using a rope and bucket.
As for the WSS, using the Sybr Green® method, EV was found only in a single source, a deep tubular well (approximately 130 m deep), without protection, which feeds an elevated metallic reservoir that partially supplies the community of Vazante (Figure 2a,b). The rest of the community is supplied by another WSS, also consisting of a deep tubular well (120 m deep), but with no evidence of the presence of EV. It is noteworthy that the water delivered to the population does not undergo disinfection or any other treatment.
Around of the well there is a rudimentary cesspool that receives sewage from the Gregório Batista dos Passos State School (Figure 3). In addition, the community has a local cemetery (Figure 4a), open-air garbage disposal (Figure 4b) and has 72.9% of households’ (Figure 2a) disposing domestic sewage into a rudimentary cesspool [45], that does not have waterproofing.
As for the individual alternative solutions (IAS), in Table 3 are shown the forms of disposal of domestic sewage, with 83.3% being disposed in a rudimentary cesspool and 16.7% in a septic tank, as well as the presence of barn, pigsty and chicken coop, informing the distances from these possible sources of contamination to the source of water supply.
Figure 5 and Figure 6 show the water supply sources, allowing the visualization of their conditions. The residences in the João de Deus and Olhos D’Água communities are supplied by a shallow tubular well, and in all cases there is a bricklaying structure with a cover to protect the well’s installations. In João de Deus, the structure is located in a pasture area, but far from the rudimentary cesspool, as well as near the creation and confinement of animals (Figure 5a,b). In Olhos D’Água, there is only a chicken coop in household ID 07 (Figure 5e,f) and, in both cases, they are more than 30 m away from the rudimentary cesspool.
With regard to the shallow dug wells, it was observed that the distance to the septic tank, in Itajá 2, and to the rudimentary cesspool, in Lageado, were greater than 15 m (Table 3 and Figure 6a,b). Its structures were in good condition, with, in the first case, no paving around and animals near the well. In the case of Lageado, the well had all the structures and a partial enclosure.

4. Discussion

The frequency of enteric viruses present in the environment represents their prevalence in the local population [46,47]. On dairy farms in southern Brazil, research carried out to find enteric viruses in water sources only demonstrated the detection of EV in only one positive water sample (6.67%) [48]. When Staggemeier et al. [27] researched EV in water and sediment samples, and found a lower prevalence than in the present study for EV, with 1.8%. In the study by Lima et al. [49], which also investigated the prevalence of enteric viruses in rural areas in a state in the Midwest Region of Brazil, a prevalence of 5.1% was determined for EV.
De Giglio et al. [50], when analyzing the quality of groundwater and the occurrence of enteric viruses present in this water source, in a region of Italy, demonstrated the presence of 14.8% (4/27) of enteroviruses, and similarly to this study, there was no statistical association between the presence of viruses and the wells where they were found. In 2008 and 2009, wells ranging in depth from 220 to 300 m were collected for research on enteric viruses, including enteroviruses [51]. In this research, the presence of virus in the wells corresponded to 47% of positive samples, with enterovirus being one of the viruses found, along with Adenovirus (data on the presence of only enterovirus was not given) [50]. When statistical analysis was performed using logistic regression between the presence of viruses in relation to the well, there was no statistical significance between the virus and its presence in the wells [50,51].
In the present study, the low prevalence found for EV (species C) can be explained by the epidemiology of this virus in the population living in the study area, i.e., it is possible that there is a low circulation of enterovirus in the studied population [49], as well as other interferences such as the diversity of landscapes between the collected sites, climatic factors at the time of collection and the handling of waste and/or animals present at the site [48]. It may also be possible to note that factors intrinsic to the virus, such as its genetic composition of single-stranded RNA, may give the virus less resistance to factors that affect its presence in water sources, such as UV light, temperature and pH [52]. RNA is labile and can be hydrolyzed at an acidic and alkaline pH and destroyed by radiation or enzymatic processes [52].
Around 8.1 million Brazilian homes are located in rural areas, which totals almost 30 million people, according to BIGS (Brazilian Institute of Geography and Statistics) data. Unfortunately, the services provided related to basic sanitation for this population have a large coverage deficit (National Household Sample Survey—NHSS) [53]. The NHSS indicates that only 33.4% of residents in rural areas have a water supply network with or without internal plumbing connected to their homes [53]. Additionally, most of the rural population (66/6%) captures water from wells and fountains, directly from water sources that do not have any type of treatment or from other alternative sources that are generally unsuitable for human consumption. In addition, 49.9% of households in rural areas use a rudimentary cesspool [53].
Pathogens of interest to public health transmitted via waterborne transmission can enter aquifers by various means and mechanisms, such as through the use of septic tanks with operational and leakage problems, the discharge of leaking sewage, a rudimentary cesspool as the final destination of sewage, the disorderly construction of artesian or dug wells that may not have sanitary protection elements, and filters or coatings, serving as a source of contaminants through the percolation of surface runoff and permeable walls, in addition to the direct introduction of wastewater and the percolation of surface water through wells [54,55,56,57,58].
In rural areas, most of the final disposal of sewage can occur in a rudimentary cesspool, septic tanks, ditches or, directly, in the soil or in surface water [55,59,60], which can contaminate water bodies and increasing the risk of waterborne diseases. The successive contamination of the soil by organic animal waste increases the risk of contamination of groundwater sources, as these are reservoirs of various micro-organisms that can migrate through the soil [56].
Groundwater, unlike surface water, is a more stable environment suffering from few changes in its physical–chemical parameters, constituting a favorable matrix for the survival of viruses [61]. Viral presence was not found in surface matrices or with a water truck, which is supplied by superficial matrices. In surface water, most viruses are readily inactivated when exposed to solar radiation (UV light). At a temperature of 4 °C, it takes 671 days to inactivate 90% of the poliovirus present in salt water. At a temperature of 25 °C, the time is reduced to 25 days. However, when the virus is exposed to sunlight for 24 h, it is possible to have 99.9% inactivated poliovirus [30]. Other factors such as temperature, desiccation and the presence of microbiota effectively contribute to the decomposition of the pathogen on the surface [54,62]. In addition, in the study, the surface water source it is an isolated area, without domestic sewage contribution, reducing the chances of contamination.
A smaller opening diameter, wall coverings made of PVC plastic and greater depth, ensuring insulation and durability, are some factors that make tubular wells less subject to contamination [49]. However, these characteristics alone were not enough to guarantee water free of EV contamination, since the virus has only been found in groundwater sources. Unlike this study, that of da Luz et al. [57] did not find any EV when researching samples from artesian wells and dug wells.
EVs are the smallest enteric pathogens and are able to survive for long periods underground, as these places have low temperatures, protection from sunlight and absent microbiota [63,64]. The isoelectric point of viruses and their ability to adsorb to sediments, in addition to other favorable conditions, such as their genetic content (DNA or RNA) and protection of the capsid, increase their survival underground [31,63,64]. In the underground environment, they have greater transport potential, when compared to that of other waterborne pathogens [31,63,64].
In the case of the deep tubular well, which collectively supplies the Vazante community, there is an unhealthy condition verified that can justify the presence of EV in the water. The presence of a rudimentary cesspool in most homes in the community, the cemetery and the dump can contribute to soil contamination, which can reach the aquifer. However, the other very close deep tube well, which supplies the same community, did not show EV, which could be expected, unless the geological formation is different or there are possible mechanisms that could lead to poorer water quality and subsequent ill health due to microbial contamination during the collection, handling and storage of drinking water, even though the water may be relatively safe at the source [65,66]. The installations are not protected, and the access piping to the well is open, which could allow contaminants to enter the well. In addition, the constructive aspect was not analyzed, which could be a problem, since the presence of the rudimentary cesspool of the college less than 11 m from the well could be contaminating the water table, and in the case of the lining of the well, the same may be receiving contaminated water.
Despite the constructive conditions not being ideal in all water sources used individually, some being well-protected and others not so much, it is not possible to obtain the origin of the possible source of contamination. This is located far from the rudimentary cesspool or other sources of contamination. In the case of the water source at the home of the João de Deus community, it was in the middle of the pasture; that is, the cattle were present near the shallow tubular well, but this does not justify the presence of the EV, which is of human origin. Despite that, in the study by Verheyen et al. [67], the presence of latrines within a 50 m radius of the collection sites was a significant risk factor for the viral contamination of wells.
As much as detection has been prevalent in tubular wells, the occurrence of contamination in shallow dug wells should not be ignored. Such wells have smaller depths and often do not have protection factors, so pipe failures and/or an overflow of septic tanks, the presence of animals around and surface contaminants can reach the wells through precipitation, increasing viral contamination in this well [68,69]. In a community that uses a shallow dug well for its water supply and where the presence of enterovirus was detected, it was verified that no well is simultaneously equipped with all the protection mechanisms. Therefore, all protection instruments are essential for the safety of residents and animals that circulate through the place where the wells are installed, in addition to being crucial to hampering water contamination. Each device is responsible for preventing the entry of external agents through the main contamination routes [70].
In a study where a generalized linear model (GLM) was applied to enable the prediction of the probability of contamination by Escherichia coli in a shallow dug well located in rural communities in the State of Goiás, the shallow well diameter, the paving around it, the presence of pigsties and poultry farming were the predictors that best described (or explained) dug shallow well water contamination, and the chance of water contamination was greater in wells with larger diameters when compared to that in dug shallow wells with small diameters [71].
Sample collections in the present study were carried out during the rainy season, which may be a factor that affected the detection of viruses in samples from underground sources. Rainfall can increase the transport of viruses, helping them seep down into groundwater. In addition, low-ionic-strength water, which is characteristic of precipitation, can resuspend the viruses that adhered to the sediment grains, increasing their concentration in aquifers [72].
In Brazil, the water that will be destined for human consumption, being distributed collectively through WWS or CAS, must undergo surveillance and quality control. For the use of well water for human consumption or to supply production processes, it is necessary to undergo treatment processes so that it meets the potability parameters of Annex XX of GM/MS No. 888., which amends Annex XX of Consolidation Ordinance No. 5 of 2017. According to Article 24, of Annex XX of GM/MS No. 888, of 4 May 2021, all water for human consumption, supplied collectively, must undergo a disinfection or chlorination process, and water from surface sources must undergo to the filtration process, before disinfection. However, only about 84.1% of Brazilians consume treated water [73,74].
The conventional treatment consists of the treatment of raw water via the process of applying coagulants in the rapid mixing stage, followed by a slow mixing stage, for the formation of denser flakes, for subsequent sedimentation. After this stage, the water will go to a descending filtration unit with filtered material of appropriate granulometry and finally will pass through the disinfection process, carried out with the addition of chlorine. However, this process becomes impracticable for small communities, as it has a high cost to implement, requiring the development of alternative, low-cost and easy-to-operate technologies that will make drinking water available to the population [75].
Alternative options for water treatment lead the population to resort to home treatments. These are treatments in which the resident himself treats his water using homemade or commercially acquired practices. Filtration using porous ceramics (candle) and electrical appliances or cloth, coagulation with natural products and disinfection with products containing chlorine or boiling are some of the forms of treatment carried out. It is still possible to use the SALTA-z (the alternative water treatment solution; the z refers to zeolite), multi-stage filtration (MSFI), solar distiller or chlorinators, in small communities or family units [76].
As is known, viruses are one of the main causes of outbreaks related to drinking water, although they are less frequently analyzed. Brazilian legislation defines that drinking water must be free of total coliforms and/or E. coli for every 100 mL of analyzed samples [73] and also recommended the inclusion of enteric virus monitoring at the collection points of water from spring supply surfaces. However, the new ordinance of May 2021 removed the recommendation [73,77], despite available studies showing that such indicators are not always correlated with the presence of viruses [78]. The two types of micro-organisms differ in relation to their size, and resistance to environmental factors, in addition to differences in relation to their physical properties, which will result in different destinations in water bodies [78].
For enterovirus research and that of other pathogenic viruses, regardless of the source of the water, the detection process takes place in the following steps: determining the concentration of the water sample and then virus detection using molecular techniques [28,79]. The PCR technique has its main advantage of high specificity and sensitivity, it is capable of detecting viruses that may or may not be cultivated in cells and its results are fast, managing to be completed in hours. However, unlike the cell culture method, this technique does not detect viruses that may be infectious; PCR is able to detect both infectious and non-infectious viruses [18,34,80].
Organic and inorganic compounds such as heavy metals, humic and fulvic acids, nucleases and polyphenols are often found in environmental samples. They are capable of preventing the amplification and quantification of the genetic material present in the sample, through the degradation of nucleic acids, impairing the extraction stage or affecting the polymerase and reverse transcriptase. Therefore, as the water sample is concentrated for virus detection, eventual interferences and inhibitors of the virus detection steps will be concentrated with the sample [30,78,81,82,83].
Due to regions in the humic acid composition that can bind with molecular regions of Sybr Green®, it can lead to quenching process results or increased fluorescence due to interfering complexes that have been formed. A drawback to using this dye is that the oligonucleotide probes used are sometimes not as specific as they should be, causing noise that occurs due to non-viral DNA amplification and/or non-specific amplification. Furthermore, the influence of humic acid may be related to the competitive action of acid binding with Sybr Green® vs. DNA binding to the dye. This competition seems to be based on taking Sybr Green® intercalated or semi-interleaved and bound to the DNA surface. The latter reason strongly undermines the Sybr Green® assay, as surface-bound Sybr Green® is primarily responsible for fluorescence, in contrast to intercalated or semi-interleaved Sybr Green® [84,85].
Due to this, the TaqMan® method was proposed to correct this problem. The method is based on fluorescence through DNA probes, specific for the DNA fragment. This probe contains a fluorophore tag that is released and becomes active when the probe binds to its target. Therefore, as more viral DNA is amplified with each PCR cycle, more fluorophore is released and the signal is increased. Its use is not as widespread, due to its high cost when compared to that of Sybr Green® [86].
Hamza et al. [86] in their study observed that non-enveloped viruses that have an RNA in their genetic structure, which require an additional cDNA transcription step, may be more severely affected by compounds present in water samples that can lead to inhibitions in molecular techniques, unlike non-enveloped DNA viruses that have greater resistance to these inhibitions. Thus, the presence of RNA viruses can be underestimated in positive samples for them [86].
In this study, research was carried out using both methods. Contrary to what was found for Sybr Green®, the TaqMan® probe was unable to detect the Enterovirus species studied in the samples. This difference found in the detection using the two reagents may have come from interference of the organic substances that may have been concentrated in the water samples together, in addition to differences in the commercial kits used for the extraction of the genetic material, since two different kit brands were used, with different protocols and different reagents, and these reagents may have anionic detergents and chaotropic salts in their composition, capable of interfering in the cDNA formation step and in the quantification for EV.
Wurtzer et al. [78] when comparing four commercial EV detection kits, based on the Taqman® probe, differences in their detection were obtained. Three of the four kits are validated for clinical specimens, and only one is validated for environmental specimens. The kits’ performance of the detection methods in environmental samples presented great variation (between 16% and 91%). Some kits demonstrated a high degree of sensitivity related to the inhibition of detection of EV in environmental water matrices and were strongly affected by environmental compounds.
Some justifications of Wurtzer’s work can be used in this study. The differences may have come from the polymerase activity of the Sybr Green® or Taqman® master mixes used, in addition to, as previously mentioned, the two RNA/DNA extraction kits used in this study which are ideal for whole blood, plasma, serum and other biological fluids free of cells other than animal/plant tissue, and none of the kits are validated for environmental samples (specifically water) [78].
The higher detection sensitivity with Sybr Green® may be due to the volume of RNA used for the reaction. In the RT-qPCR reaction (Sybr Green), 5 µL was used, compared to 1 µL of cDNA for qPCR (Taqman®). The larger the volume of RNA pipetted into the reaction, the better the sensitivity could be expected. However, in environmental samples, it is possible that the high RNA input volume may also increase the amount of potential inhibitor and therefore induce nonspecific reactions. The difference may also be possible due to the degradation of the viral RNA during the transport of the samples with probable freezing/thawing cycles or a bad pairing of the oligonucleotides used, with their amplification reagents [78].
Genome amplification enhancers such as bovine serum albumin, dimethyl sulfoxide, DNA carriers and/or amplification with optimized polymerases can be perform to limit the inhibitory effects found in environmental samples [78]. Other factors that can improve the reaction in virus detection would be the use of external controls, which must be similar to the target virus, in the extraction and concentration of samples, as it would validate the first steps of virus detection, since inhibitory compounds are often concentrated or extracted together with targeted viruses [78].
The COVID-19 pandemic was a major limitation to the present study. The study suffered a great delay to start, since the collection of samples could only be carried out when vaccination had already started and/or there was a drastic decrease in contamination/cases of COVID-19, in addition to many reagents that were imported that were delayed in their arrival/receipt and to be available for purchase. Equipment that is used by the college’s academic community was directed toward carrying out SARS-CoV-2 tests, causing us to look for other partnerships to carry out molecular tests.

5. Conclusions

The study demonstrated that individual alternative water sources in rural communities can be contaminated by enteroviruses. As protected as they may be, groundwater sources can be contaminated by viruses. This study emphasizes precautions for interpreting genome amplification from environmental water, which may contain several additional potential inhibitors and/or interferents in qPCR reactions. Therefore, it is necessary to choose the best method for the detection of enteric viruses. The TaqMan® system, due to its high specificity and sensitivity, still remains the gold standard for the detection of viral pathogens, but due to its high cost, it enables a greater predilection for cheaper dyes, such as Sybr Green®. Both methods must have protocols that have good validation and must be reproducible, especially in environmental samples. It is important that future research can use external controls to help better interpret the results. In this context, the detection of EV in groundwater can help in its monitoring, in addition to helping managers in making decisions regarding water sources used by the population that may be contaminated.

Supplementary Materials

The following supporting information can be downloaded at https://www.mdpi.com/article/10.3390/su15139886/s1. Table S1: Location and name of rural communities: settlements, riverside and quilombolas.

Author Contributions

Conceptualization, G.P.B., L.C.G.B., P.S.S. and L.C.C.; methodology, G.P.B., L.C.G.B., T.R.O., F.S.L. and M.d.O.S.; software, L.C.G.B.; validation, G.P.B., L.C.G.B. and L.C.C.; formal analysis, L.C.G.B. and G.R.L.d.S.; investigation, G.P.B.; resources, V.M.G., M.C.E., P.Z.d.S., G.R.L.d.S., J.D.G.V., P.S.S. and L.C.C.; data curation, G.P.B., L.C.G.B., P.S.S. and L.C.C.; writing—original draft preparation, G.P.B., L.C.G.B., P.S.S. and L.C.C.; writing—review and editing, G.P.B., P.S.S. and L.C.C.; visualization, G.P.B., P.S.S. and L.C.C.; supervision, P.S.S. and L.C.C.; project administration, P.S.S. and L.C.C.; funding acquisition, P.S.S. All authors have read and agreed to the published version of the manuscript.

Funding

This research was funded by National Health Foundation, on 05/2017, and the APC was financed by The National Health Foundation.

Institutional Review Board Statement

The study was conducted in accordance with the Declaration of Helsinki and approved by the Institutional Review Board (or Ethics Committee) of Federal University of Goiás (CAAE 87784318.2.0000.5083, 11 September 2018).

Informed Consent Statement

Not applicable.

Data Availability Statement

Not applicable.

Acknowledgments

I would like to thank everyone involved in the Projeto Saneamento e Saúde Ambiental em Comunidades Rurais e Tradicionais de Goiás, SanRural, for promoting scientific research in the State of Goiás.

Conflicts of Interest

The authors declare no conflict of interest.

References

  1. BRASIL. Good Practices in Water Supply: Procedures for Minimizing Health Risks, 1st ed.; Ministério da Saúde: Brasília, Brazil, 2006; pp. 1–251. ISBN 85-334-1243-6. [Google Scholar]
  2. Hirata, R.; Suhogusoff, A.; Marcellini, S.S.; Villar, P.C.; Marcellini, L. Groundwater and Its Environmental and Socioeconomic Importance for Brazil, 1st ed.; Instituto de Geociências/USP: São Paulo, Brasil, 2019; pp. 1–66. [Google Scholar] [CrossRef]
  3. BRASIL. Basic Course on Surveillance of the Quality of Water for Human Consumption: Module II: Water Supply, 1st ed.; Ministério da Saúde: Brasília, Brazil, 2020; pp. 1–43. [Google Scholar]
  4. Fortes, A.C.C.; Barrocas, P.R.G.; Kligerman, D.C. Water quality surveillance and the role of information to ensure access. Saúde Debate 2019, 43, 20–34. [Google Scholar] [CrossRef] [Green Version]
  5. ANA. Situation of Water Resources in Brazil: Annual Report, 1st ed.; Agência Nacional de Águas: Brasilia, Brasil, 2018; pp. 1–88. [Google Scholar]
  6. Mendonça, F.C.; Almeida, R.S.; de Oliveira, D.F.; Santos, A.G. Evaluation of the quality of water for human consumption in an groundwater source in the Recôncavo region of Bahia. Rev. Águas Subterrâneas 2019, 33, 1–8. [Google Scholar] [CrossRef] [Green Version]
  7. Cabral, L.N.; de Araújo, S.M.S. Water quality in rural areas: Bacteriological and physical-chemical analysis of the waters of the stone tanks of the communities KM 21 (Campina Grande) and Pedra Redonda (Pocinhos). Rev. Bras. Geogr. Fís 2016, 9, 1737–1753. [Google Scholar] [CrossRef]
  8. 1 in 3 People Globally Do Not Have Access to Safe Drinking Water—UNICEF, WHO. Available online: https://www.who.int/news/item/18-06-2019-1-in-3-people-globally-do-not-have-access-to-safe-drinking-water-unicef-who (accessed on 25 October 2022).
  9. Calgaro, H.F.; Filho, J.B. Domestic Sewage in Rural. Areas: Treatment and Implications for Human Health, 253rd ed.; Coordenadoria de Desenvolvimento rural Sustentável: São Paulo, Brazil, 2020; pp. 1–61. [Google Scholar]
  10. Global WASH (Water, Sanitation & Hygiene) Fast Facts. US. Centers for Disease Control and Prevention. Available online: https://www.cdc.gov/healthywater/global/wash_statistics.html#:~:text=3.6%20billion%20people%2C%20nearly%20half,million%20people%20practice%20open%20defecation (accessed on 25 October 2022).
  11. Gibson, K.E.; Opryszko, M.C.; Schissler, J.T.; Guo, Y.; Schwab, K.J. Evaluation of Human Enteric Viruses in Surface Water and Drinking Water Resources in Southern Ghana. Am. J. Trop. Med. Hyg. 2011, 84, 20–29. [Google Scholar] [CrossRef]
  12. Tonetti, A.L.; Brasil, A.L.; Madrid, F.J.P.L.; Figueiredo, I.C.S.; Schneider, J.; Cruz, L.M.O.; Duarte, N.C.; Fernandes, P.M.; Coasaca, R.L.; Garcia, R.S.; et al. Treatment of Domestic Sewage in Isolated Communities: Reference for Choosing Solutions, 1st ed.; Biblioteca da Área de Engenharia e Arquitetura: Campinas, Brazil, 2018; pp. 1–153. ISBN 978-85-85783-94-5. [Google Scholar]
  13. Huang, P.N. Microbiota and enteric viruses infection. Med. Microecol. 2020, 3, 100006. [Google Scholar] [CrossRef]
  14. Bouseettine, R.; Hassou, N.; Bessi, H.; Ennaji, M.M. Waterborne Transmission of Enteric Viruses and Their Impact on Public Health. In Emerging and Reemerging Viral Pathogens—Volume 1: Fundamental and Basic Virology Aspects of Human, Animal and Plant Pathogens, 1st ed.; Ennaji, M.M., Ed.; Elsevier: Amsterdam, The Netherlands, 2020; pp. 907–932. [Google Scholar] [CrossRef]
  15. Fong, T.T.; Lipp, E.K. Enteric Viruses of Humans and Animals in Aquatic Environments: Health Risks, Detection, and Potential Water Quality Assessment Tools. Microbiol. Mol. Biol. Ver. 2005, 69, 357–371. [Google Scholar] [CrossRef] [PubMed] [Green Version]
  16. Kiulia, N.M.; Gonzalez, R.; Thompson, H.; Aw, T.G.; Rose, J.B. Quantifcation and Trends of Rotavirus and Enterovirus in Untreated Sewage Using Reverse Transcription Droplet Digital PCR. Food Environ. Virol. 2021, 13, 154–169. [Google Scholar] [CrossRef] [PubMed]
  17. Cioffi, B.; Monini, M.; Salamone, M.; Pellicanò, R.; Di Bartolo, I.; Guida, M.; La Rosa, G.; Fusco, G. Environmental surveillance of human enteric viruses in wastewaters, groundwater, surface water and sediments of Campania Region. Reg. Stud. Mar. Sci. 2022, 38, 101368. [Google Scholar] [CrossRef]
  18. Upfold, N.S.; Luke, G.A.; Knox, C. Occurrence of Human Enteric Viruses in Water Sources and Shellfish: A Focus on Africa. Food Environ. Virol. 2021, 13, 1–31. [Google Scholar] [CrossRef] [PubMed]
  19. World Health Organization. Emerging Issues in Water and Infectious Disease; WHO Library Cataloguing-in-Publication Data: Geneva, Switzerland, 2003.
  20. Marcheggiani, S.; D’Ugo, E.; Puccinelli, C.; Giuseppetti, R.; D’Angelo, A.M.; Gualerzi, C.O.; Spurio, R.; Medlin, L.K.; Guillebault, D.; Weigel, W.; et al. Detection of Emerging and Re-Emerging Pathogens in Surface Waters Close to an Urban Area. Int. J. Environ. Res. Public Health 2015, 12, 5505–5527. [Google Scholar] [CrossRef] [PubMed] [Green Version]
  21. Bosch, A. Human enteric viruses in the water environment: A minireview. Int. Microbiol. 1998, 1, 191–196. [Google Scholar] [PubMed]
  22. de Tavares, M.T.; Cardoso, D.d.D.d.P.; Brito, W.M.E.D. Waterborne enteric viruses: Microbiological and water quality control aspects. Rev. Patol. Trop. 2005, 34, 85–104. [Google Scholar] [CrossRef]
  23. Health Canada. Guidelines for Canadian Drinking Water Quality: Guideline Technical Document—Enteric Viruses, 2nd ed.; Health Canada: Ottawa, ON, Canada, 2019; pp. 1–123.
  24. Faccin-Galhardi, L.C.; Lopes, N.; Espada, S.F.; Linhares, R.E.C.; Pelayo, J.S.; Nozawa, C. Waterborne Viral Pathogens: Detection, Control and Monitoring of Water Quality for Human Consumption. Virus Rev. Res. 2013, 18, 1–9. [Google Scholar] [CrossRef] [Green Version]
  25. Muir, P. Enteroviruses. Medicine 2017, 45, 794–797. [Google Scholar] [CrossRef]
  26. Lin, J.; Ganesh, A. Water quality indicators: Bacteria, coliphages, enteric viruses. Int. J. Environ. Health Res. 2013, 23, 484–506. [Google Scholar] [CrossRef] [PubMed]
  27. Staggemeier, R.; Bortoluzzi, M.; Heck, T.M.S.; da Luz, R.B.; Fabres, R.B.; Soliman, M.C.; Rigotto, C.; Baldasso, N.A.; Spilki, F.R.; Almeida, S.E.M. Animal and human enteric viruses in water and sediment samples from dairy farms. Agric. Water Manag. 2015, 152, 135–141. [Google Scholar] [CrossRef]
  28. Rajtar, B.; Majek, M.; Polánski, L.; Polz-Dacewicz, M. Enteroviruses in water environment—A potential threat to public health. Ann. Agric. Environ. Med. 2008, 15, 199–203. [Google Scholar]
  29. Lugo, D.; Krogstad, P. Enteroviruses in the Early 21st Century: New Manifestations and Challenges. Curr. Opin. Pediatr. 2016, 28, 107–113. [Google Scholar] [CrossRef] [Green Version]
  30. Comerlato, J.; Oliveira, L.K.; Spilki, F.R. Enteroviruses as indicators of water quality. Rev. Bras. Biociênc. 2011, 9, 114–125. [Google Scholar]
  31. Pachepsky, Y.; Shelton, D.; Dorner, S.; Whelan, G. Can E. coli or thermotolerant coliform concentrations predict pathogen presence or prevalence in irrigation waters? Crit. Rev. Microbiol. 2016, 42, 384–393. [Google Scholar] [CrossRef] [PubMed]
  32. Haramoto, E.; Katayama, H.; Oguma, K.; Ohgaki, S. Application of cation-coated filter method to detection of noroviruses, enteroviruses, adenoviruses, and torqueteno viruses in the Tamagawa River in Japan. Appl. Environ. Microbiol. 2005, 71, 2403–2411. [Google Scholar] [CrossRef] [PubMed] [Green Version]
  33. Silva, H.D.; Anunciação, C.E.; Santos, S.F.O.; García-Zapata, M.T.A. Virological analysis of water quality: A review of viral concentration and detection methodologies. Rev. Bras. Biociênc. 2011, 9, 405–415. [Google Scholar]
  34. Haramoto, E.; Kitajima, M.; Hata, A.; Torrey, J.R.; Masago, Y.; Sano, D.; Katayama, H. A review on recent progress in the detection methods and prevalence of human enteric viruses in water. Water Res. 2018, 135, 168–186. [Google Scholar] [CrossRef]
  35. Navarro, E.; Serrano-Heras, G.; Castaño, M.J.; Solera, J. Real-time PCR detection chemistry. Clin. Chim. Acta 2015, 439, 231–250. [Google Scholar] [CrossRef]
  36. Nascimento, S.; Suarez, E.R.; Pinhal, M.A.S. Real-time PCR and RT-PCR technology and its applications in the medical field. Rev. Bras. Med. 2010, 67, 7–19. [Google Scholar]
  37. TaqMan vs. SYBR Chemistry for Real-Time PCR. Thermo Fisher Scientific. Available online: https://www.thermofisher.com/br/en/home/life-science/pcr/real-time-pcr/real-time-pcr-learning-center/real-time-pcr-basics/taqman-vs-sybr-chemistry-real-time-pcr.html (accessed on 30 May 2023).
  38. Tajadini, M.; Panjehpour, M.; Javanmard, S.H. Comparison of SYBR Green and TaqMan methods in quantitative real-time polymerase chain reaction analysis of four adenosine receptor subtypes. Adv. Biomed. Res. 2014, 3, 85. [Google Scholar] [CrossRef] [PubMed]
  39. Guimarães, F.R. Application of Viral concentration Methodology for Astrovirus Detection in Environmental Waters. Master’s Thesis, Instituto Nacional de Controle de Qualidade em Saúde (INCQS/Fiocruz), Rio de Janeiro, Brazil, 2007. [Google Scholar]
  40. Lima, L.R.; de Almeida, P.F.; Matos, J.B.T.L. Prospection of molecular techniques (REal-Time PCR and FISH) to be used in environmental samples for research in the area of biotechnology. Cad. Prospec 2016, 9, 79–91. [Google Scholar] [CrossRef]
  41. Fongaro, G.; Silva, H.D.; Elmahdy, E.M.; Magri, M.E.; Schissi, C.D.; Moreira, M.; Lanna, M.C.S.; Silveira-Lacerda, E.P.; Barardi, C.R.M. Enteric viruses as contaminants and bioindicators in environmental samples. Virus Rev. Res. 2015, 20, 1–20. [Google Scholar] [CrossRef] [Green Version]
  42. Katayama, H.; Shimasaki, A.; Ohgaki, S. Development of a virus concentration method and its application to detection of enterovirus and Norwalk virus from coastal seawater. Appl. Environ. Microbiol. 2002, 68, 1033–1039. [Google Scholar] [CrossRef] [Green Version]
  43. Vecchia, A.D.; Fleck, J.D.; Comerlato, J.; Kluge, M.; Bergamaschi, B.; da Silva, J.V.S.; da Luz, R.B.; Teixeira, T.F.; Garbinatto, G.N.; Oliveira, D.V.; et al. First description of Adenovirus, Enterovirus, Rotavirus and Torqueteno virus in water samples collected from the Arroio Dilúvio, Porto Alegre, Brazil. Braz. J. Biol. 2012, 72, 323–329. [Google Scholar] [CrossRef] [PubMed]
  44. Tsai, Y.L.; Sobsey, M.D.; Sangermano, L.R.; Palmer, C.J. Simple method of concentrating enteroviruses and hepatitis A virus from sewage and ocean water for rapid detection by reverse transcriptase-polymerase chain reaction. Appl. Environ. Microbiol. 1993, 59, 3488–3491. [Google Scholar] [CrossRef] [Green Version]
  45. Scalize, P.S. Participatory Technical Diagnosis of the Vazante Community: Divinópolis de Goiás, 1st ed.; Cegraf UFG: Goiânia, Brazil, 2020; pp. 1–225. [Google Scholar]
  46. Apostol, L.N.G.; Imagawa, T.; Suzuki, A.; Masago, Y.; Lupisan, S.; Olveda, R.; Oshitani, H. Genetic diversity and molecular characterization of enteroviruses from sewage-polluted urban and rural rivers in the Philippines. Virus Genes 2012, 45, 207–217. [Google Scholar] [CrossRef] [Green Version]
  47. Tiwari, S.; Dhole, T.N. Assessment of enteroviruses from sewage water and clinical samples during eradication phase of polio in North India. Virol. J. 2018, 157, 157. [Google Scholar] [CrossRef] [Green Version]
  48. Spilki, F.R.; Luz, R.B.D.; Fabres, R.B.; Soliman, M.C.; Kluge, M.; Fleck, J.D.; Rodrigues, M.T.; Comerlato, J.; Cenci, A.; Cerva, A.; et al. Detection of human adenovirus, rotavirus and enterovirus in water samples collected on dairy farms from Tenente Portela, Northwest of Rio Grande do Sul, Brazil. J. Microbiol. 2013, 44, 953–957. [Google Scholar] [CrossRef] [PubMed]
  49. Lima, F.S.; Scalize, O.S.; Gabriel, E.F.M.; Gomes, R.P.; Gama, A.R.; Demoliner, M.; Spilki, F.R.; Vieira, J.D.G.; Carneiro, L.C. Escherichia coli, Species C Human Adenovirus, and Enterovirus in Water Samples Consumed in Rural Areas of Goiás, Brazil. Food Environ. Virol. 2021, 14, 77–88. [Google Scholar] [CrossRef]
  50. De Giglio, O.; Caggiano, G.; Bagordo, F.; Barbuti, G.; Brigida, S.; Lugoli, F.; Grassi, T.; La Rosa, G.; Lucentini, L.; Uricchio, V.F.; et al. Enteric Viruses and Fecal Bacteria Indicators to Assess Groundwater Quality and Suitability for Irrigation. Int. J. Environ. Res. Public Health 2017, 14, 558. [Google Scholar] [CrossRef] [PubMed] [Green Version]
  51. Bradbury, K.R.; Borchardt, M.A.; Gotkowitz, M.; Spencer, S.K.; Zhu, J.; Hunt, R.J. Source and Transport of Human Enteric Viruses in Deep Municipal Water Supply Wells. Environ. Sci. Technol. 2013, 47, 4096–4103. [Google Scholar] [CrossRef]
  52. Carter, M.J. Enterically infecting viruses: Pathogenicity, transmission and significance for food and waterborne infection. J. Appl. Microbiol. 2005, 98, 1354–1380. [Google Scholar] [CrossRef]
  53. FUNASA. Funasa’s Manual of Good Practices in Sanitation Management in Rural Areas, 1st ed.; Ministério da Saúde: Brasilia, Brazil, 2019; pp. 1–77. [Google Scholar]
  54. John, D.E.; Rose, J.B. Review of Factors Affecting Microbial Survival in Groundwater. Environ. Sci. Technol. 2005, 39, 7345–7356. [Google Scholar] [CrossRef] [PubMed] [Green Version]
  55. Amaral, L.A.; Filho, A.N.; Junior, O.D.R.; Ferreira, F.L.A.; Barros, L.S.S. Drinking water as a health risk factor in rural properties. Rev. Saude Publica 2003, 37, 510–514. [Google Scholar] [CrossRef]
  56. Piranha, J.M.; Pacheco, A. Viruses in groundwater used to supply rural communities in the municipality of São José do Rio Preto (SP). Águas Subterrâneas 2004, 1–15. Available online: https://repositorio.usp.br/item/002131611 (accessed on 15 November 2022).
  57. da Luz, R.B.; Staggemeier, R.; Fratta, L.X.S.; Longo, L.; Schutz, R.; Soliman, M.C.; Kluge, M.; Fabres, R.B.; Schenkel, G.C.; Bruni, F.P.; et al. Viral and bacterial contamination in groundwater in the outcropping portion of the Guaraní Aquifer, municipality of Ivoti, RS. Rev. Ambient. Agua 2017, 12, 871–880. [Google Scholar] [CrossRef] [Green Version]
  58. One Health Office Fact Sheet. Available online: https://www.cdc.gov/onehealth/who-we-are/one-health-office-fact-sheet.html?CDC_AA_refVal=https%3A%2F%2Fwww.cdc.gov%2Fonehealth%2Fmultimedia%2Ffactsheet.html (accessed on 5 December 2022).
  59. IBGE. 2017 Agricultural Census—Preliminary Results, 1st ed.; Instituto Brasileiro de Geografia e Estatística: Rio de Janeiro, Brazil, 2017; pp. 1–108. [Google Scholar]
  60. Vale, G.B.d.; Junior, H.C.R.; Scalize, P.S. Service and precariousness of sanitary sewage in rural communities in the state of Goiás, Brazil. Eng. Sanit. Ambient. 2022, 27, 1067–1074. [Google Scholar] [CrossRef]
  61. Panizzolo, M.; Gea, M.; Carraro, E.; Gilli, G.; Bonetta, S.; Pignata, C. Occurrence of human pathogenic viruses in drinking water and in its sources: A review. J. Environ. Sci. 2023, 132, 145–161. [Google Scholar] [CrossRef]
  62. Krauss, S.; Griebler, C. Pathogenic Microrganims and Viruses in Groundwater, 1st ed.; Acatech: Munich, Germany, 2011; pp. 1–70. [Google Scholar]
  63. Borchardt, M.A.; Bradbury, K.R.; Gotkowitz, M.B.; Cherry, J.A.; Parker, B.L. Human enteric viruses in groundwater from a confined bedrock aquifer. Environ. Sci. Technol. 2007, 41, 6606–6612. [Google Scholar] [CrossRef]
  64. Sorensen, J.P.R.; Aldous, P.; Bunting, S.Y.; McNally, S.; Townsend, B.R.; Barnett, M.J.; Harding, T.; Ragione, R.M.L.; Stuart, M.E.; Tipper, H.J.; et al. Seasonality of enteric viruses in groundwater-derived public water sources. Water Res. 2021, 207, 117813. [Google Scholar] [CrossRef]
  65. Field, E.; Glennerster, R.; Hussam, R. Throwing the Baby out with the Drinking Water: Unintended Consequences of Arsenic Mitigation Efforts in Bangladesh; Working Paper; Department of Economics, Harvard University: Cambridge, MA, USA, 2011. [Google Scholar]
  66. Goel, V.; Islam, M.S.; Yunus, M.; Ali, M.T.; Khan, A.F.; Alam, N.; Faruque, A.S.G.; Bell, G.; Sobsey, M.; Emch, M. Deep tubewell microbial water quality and access in arsenic mitigation programs in rural Bangladesh. Sci. Total Environ. 2019, 659, 1577–1584. [Google Scholar] [CrossRef] [PubMed]
  67. Verheyen, J.; Timmen-Wego, M.; Laudien, R.; Boussaad, I.; Sen, S.; Koc, A.; Uesbeck, A.; Mazou, F.; Pfister, H. Detection of adenoviruses and rotaviruses in drinking water sources used in rural areas of Benin, West Africa. Appl. Environ. Microbiol. 2009, 75, 2798–2801. [Google Scholar] [CrossRef] [PubMed] [Green Version]
  68. Gotkowitz, M.B.; Bradbury, K.R.; Borchardt, M.A.; Zhu, J.; Spencer, S.K. Effects of Climate and Sewer Condition on Virus Transport to Groundwater. Environ. Sci. Technol. 2016, 50, 8497–8504. [Google Scholar] [CrossRef] [PubMed]
  69. Murphy, H.M.; McGinnis, S.; Blunt, R.; Stokdyk, J.; Wu, J.W.; Cagle, A.; Denno, D.M.; Spencer, S.; Firnstahl, A.; Borchardt, M.A. Septic Systems and Rainfall Influence Human Fecal Marker and Indicator Organism Occurrence in Private Wells in Southeastern Pennsylvania. Environ. Sci. Technol. 2020, 54, 3159–3168. [Google Scholar] [CrossRef]
  70. Liddle, E.S.; Mager, S.M.; Nel, E.L. The suitability of shallow hand dug wells for safe water provision in sub-Saharan Africa: Lessons from Ndola, Zambia. Appl. Geogr. 2015, 57, 80–90. [Google Scholar] [CrossRef]
  71. Lopes, H.T.L.; Baumann, L.R.F.; Scalize, P.S. A Contamination Predictive Model for Escherichia coli in Rural Communities Dug Shallow Wells. Sustainability 2023, 15, 2408. [Google Scholar] [CrossRef]
  72. Allen, A.; Borchardt, M.A.; Kieke, J.B.A.; Dunfield, K.; Parker, B.L. Virus occurrence in private and public wells in a fractured dolostone aquifer in Canada. Hydrogeol. J. 2017, 25, 1117–1136. [Google Scholar] [CrossRef] [Green Version]
  73. BRASIL. Annex XX of Consolidation Ordinance No. 5 of October 3, 2017: Control and Surveillance of the Quality of Water for Human Consumption and Its Potability Standard; Ministério da Saúde: Brasília, Brazil, 2017. [Google Scholar]
  74. National Sanitation Information System (SNIS). Thematic Diagnosis: Water and Sewage Services, 1st ed.; Ministério do Desenvolvimento Regional: Brasília, Brazil, 2021; pp. 1–91. [Google Scholar]
  75. dos Santos, W.B.; Bernardino, F.G.; Silva, L.L.S.; Ferreira, W.B. Alternative collective water supply systems in Brazil. In CONAPESC, 5th ed.; Realize Editora: Campina Grande, Brazil, 2021; pp. 1047–1061. [Google Scholar]
  76. Scalize, P.S.; Bezerra, N.R. Rural basic sanitation. In Specialization Course in Sanitation and Environmental Health: Rural Basic Sanitation, 1st ed.; CEGRAF UFG: Goiânia, Brazil, 2020; pp. 1–254. [Google Scholar]
  77. BRASIL. GM/MS Ordinance No. 888, of May 4, 2021: Amends Annex XX of Consolidation Ordinance GM/MS No. 5, of September 28, 2017, to Provide for Water Quality Control and Surveillance Procedures for Human Consumption and Its Potability Standard; Diário Oficial da União, Ministério da Saúde: Brasília, Brazil, 2021. [Google Scholar]
  78. Wurtzer, S.; Prevost, B.; Lucas, F.S.; Moulin, L. Detection of enterovirus in environmental waters: A new optimized method compared to commercial real-time RT-qPCR kits. J. Virol. Methods 2014, 209, 47–54. [Google Scholar] [CrossRef] [PubMed]
  79. Wen, X.; Zheng, H.; Yuan, F.; Zhu, H.; Kuang, D.; Shen, Z.; Lu, Y.; Yuan, Z. Comparative Study of Two Methods of Enteric Virus Detection and Enteric Virus Relationship with Bacterial Indicator in Poyang Lake, Jiangxi, China. Int. J. Environ. Res. Public Health 2019, 16, 3384. [Google Scholar] [CrossRef] [Green Version]
  80. Hsu, B.M.; Chen, C.H.; Wan, M.T.; Chang, P.J.; Fan, C.W. Detection and identification of enteroviruses from various drinking water sources in Taiwan. J. Hydrol. 2009, 365, 134–139. [Google Scholar] [CrossRef]
  81. Muller-Wegener, U. Interaction of humic substances with biota. In Humic Substances and Their Role in the Environment; John Wiley and Sons: Hoboken, NJ, USA, 1988; pp. 179–192. [Google Scholar]
  82. Radstrom, P.; Lofstrom, C.; Lovenklev, M.; Knutsson, R.; Wolffs, P. Strategies for overcoming PCR inhibition. CSH Protoc. 2008, 3. [Google Scholar] [CrossRef]
  83. Soler, M.; Lobos, S.; Lorca, M.; Navarrete, E. Enterovirus in natural waters of Valparaíso: A methodological proposal for its analysis. Rev. Biol. Mar. Oceanogr. 2009, 44, 511–516. [Google Scholar] [CrossRef] [Green Version]
  84. Zipper, H.; Buta, C.; LaÈmmle, K.; Brunner, H.; Bernhagen, J.; Vitzthum, F. Mechanisms underlying the impact of humic acids on DNA quantification by SYBR Green I and consequences for the analysis of soils and aquatic sediments. Nucleic Acids Res. 2003, 31, e39. [Google Scholar] [CrossRef] [Green Version]
  85. Ibrahim, Y.; Ouda Kadadou, D.; Banat, F.; Naddeo, V.; Alsafar, H.; Yousef, A.F.; Barceló, D.; Hasan, S.W. Detection and removal of waterborne enteric viruses from wastewater: A comprehensive review. J. Environ. Chem. Eng. 2021, 9, 105613. [Google Scholar] [CrossRef]
  86. Hamza, I.A.; Jurzik, L.; Stango, A.; Sure, K.; Uberla, K.; Wilhelm, M. Detection of human viruses in rivers of a densily populated area in Germany using a virus adsorption elution method optimized for PCR analyses. Water Res. 2009, 43, 2657–2668. [Google Scholar] [CrossRef] [PubMed]
Figure 1. Map of the State of Goiás, Brazil, locating the municipalities where the collections were carried out in the rural communities participating in this study. The settlements are located in the municipalities São Miguel do Araguaia (Lageado—1); Mineiros (Pouso Alegre—2); Uruaçu (São Lourenço—3); Goianésia (Itajá II—4); Professor Jamil (Rochedo—5); Silvânia (São Sebastião da Garganta—6; João de Deus—7). Riverside communities include Nova Crixás (Landi—8); Água Limpa (Arraial da Ponte—9); Goiandira (Po-voado Veríssimo—10); Gameleira (Olhos D’Água—11). The quilombola communities include Padre Bernardo (Sumidouro—12); Barro Alto (Santo Antonio da Laguna—13); Niquelândia (Povo-ado Vermelho—14); Cavalcante (São Domingos—15); Monte Alegre de Goiás (Pelotas—16); Campos Belos (Taquarussu—17); Divinópolis de Goiás (Vazante—18); Alto Paraíso de Goiás (Povoado Moinho—19); Iaciara (Extrema—20); Posse (Baco Pari—21); Simolândia (Castelo, Retiro e Três Rios—22); Flores de Goiás (Canabrava—23).
Sustainability 15 09886 g001
Figure 2. Vazante community with the location of the deep tube well, the cemetery and their dwellings (a) and the deep tube well with exposed external piping (b).
Sustainability 15 09886 g002
Figure 3. Location of the deep tube well in relation to the rudimentary cesspool, within the area of Gregório Batista dos Passos State School.
Sustainability 15 09886 g003
Figure 4. Local cemetery (a) and area for open-air garbage disposal; dump (b).
Sustainability 15 09886 g004
Figure 5. Shallow tube well at the João de Deus community home, ID 09 (a,b), and at the Olhos D’Água community homes, ID 04 (c,d) and ID 07 (e,f).
Sustainability 15 09886 g005
Figure 6. Shallow dug well from a home in Itajá community 2, ID 15 (a), and a home in the Lageado community, ID 07 (b), as well as a photo of the spring used by the residents of the home in the Canabrava community (c).
Sustainability 15 09886 g006
Table 1. Primers used for EV amplification in RT-qPCR.
VirusTarget GeneNameSequencePolarityPositionTa * (°C) Amplicon (pb)
EV5’UTRENT-F15′-GATGAACCGCAGCGTCAA-3′Sense443–459 a62116
ENT-F25′-ACACGGACACCCAAAGTAG-3′Reverse541–559 b
Note: (a) = sequence of primers described by Tsai et al. [44]; (b) = sequence of primers described by Vecchia et al. [43]; (*) = annealing temperature used in the study.
Table 2. Description of the number of samples collected, the type of water sources collected and subtypes of water sources.
Source TypeSource SubtypeQuantity of SamplesEnterovirus
Sybr Green®TaqMan®
WSSIASTotalWSSIASTotalWSSIASTotal
GroundwaterShallow tubular wells13031033000
Deep tubular wells111627101000
Shallow dug wells04747022000
Spring31417011000
Total15107122167000
Surface waterRivers, streams01717000000
Water truck (river) (1)202000000
Total21719000000
CisternRainwater01919000000
Total17143160167000
Note: Water supply system = (WSS); individual alternative solution = IAS; (1) = solution collected by means of a tank truck, representing a collective alternative solution (CAS).
Table 3. Data collected in the field about the forms of disposal of domestic sewage in the communities with positive results for enterovirus.
Community NameIDWater Supply SourceDomestic Sewage Disposal SiteDistance from the Source of Contamination to the Source of Water Supply
Domestic SewageBarnPigstyChicken Coop
João de Deus9Shallow tubular wellRudimentary cesspool10013277128
Olhos D’Água4Shallow tubular wellRudimentary cesspoolLDNANANA
Olhos D’Água7Shallow tubular wellRudimentary cesspool30NANA24
Itajá 215Shallow dug wellSeptic tank24432839
Lageado4Shallow dug wellRudimentary cesspool187288
Canabrava 21SpringRudimentary cesspoolLDNANANA
Note: NA = not applicable, as there is no possible source of contamination; ID = household identification number; LD = lost data.
Disclaimer/Publisher’s Note: The statements, opinions and data contained in all publications are solely those of the individual author(s) and contributor(s) and not of MDPI and/or the editor(s). MDPI and/or the editor(s) disclaim responsibility for any injury to people or property resulting from any ideas, methods, instructions or products referred to in the content.

