Article

Impact of Customer Predictive Ability on Sustainable Innovation in Customized Enterprises

1
School of Economics and Management, Harbin Engineering University, Harbin 150001, China
2
School of Economics and Management, Guangzhou City Construction College, Guangzhou 510925, China
*
Author to whom correspondence should be addressed.
Sustainability 2023, 15(13), 10699; https://doi.org/10.3390/su151310699
Submission received: 17 May 2023 / Revised: 15 June 2023 / Accepted: 30 June 2023 / Published: 7 July 2023

Abstract

:
Customer-centric service innovation performance has become a common businesses goal to pursue, particularly for service-oriented manufacturing companies. However, the continuous focus on the impact of enterprise resources and capabilities in service innovation fails to truly consider market orientation and customer capabilities as core influencing factors of service innovation performance at an individual level. This article explores new service behaviors driven by market orientation and customer predictive abilities, revealing the process of customer-driven value creation for sustainable innovation within enterprises. Ships are typical representatives of customized enterprises. This study examines the role of customer predictive capabilities in the sustainable innovation of shipbuilding companies, starting from a 20-year historical analysis of the global shipping and shipbuilding markets. By exploring the market orientation characteristics of the shipbuilding and shipping markets, this study investigates the behavioral impact of customer predictive abilities on sustainable innovation within shipbuilding enterprises. Employing time series and panel data in machine learning algorithms, specifically the random forest model, reveals a strong and statistically significant correlation between new ship deliveries and the Baltic dry index (BDI), with larger value ships having a more pronounced impact on the consumer market. The correlation analysis confirms that these two variables, in combination, can comprehensively reflect customer predictive ability and serve as crucial decision criteria for customer investment in new ship production. Furthermore, based on the principal component analysis of customer predictive ability and ship innovation levels Granger causality tests, this study demonstrates that customer predictive ability is a Granger cause of sustainable innovation in customized production. Customer predictive ability influences sustainable innovation in customized enterprises to varying degrees. This research provides valuable insights for shipbuilding companies regarding engaging in sustainable innovation in international markets and understanding the value of international market customers.

1. Introduction

With the advent of the on-demand economy driven by digital technology, customers are exhibiting new behavioral patterns, indicating that the provision of new services to meet diverse customer needs has become a crucial path for the survival and development of businesses. The theory of service innovation has transformed thinking patterns. Scholars have constructed the theory of service innovation from an empirical perspective, mainly focusing on internal perspectives of the enterprise, such as the resource-based view, dynamic capability view, absorptive capability view, knowledge-based view, relationship networks, and service-dominant logic. Some studies have also considered the external environment faced by the enterprise, such as market orientation and open innovation, emphasizing the ability of enterprises to integrate market orientation and customer resources to gain sustainable innovation advantages.
The market orientation perspective explicitly emphasizes that service innovation places greater emphasis on market-driven initiatives, customer relationships, and value creation. The market and customers play a catalytic role in the service innovation process, including the impact of service innovation performance, including product innovation capabilities. This perspective has been widely used in the context of service innovation. Although scholars have conducted extensive research on the drivers and inhibiting factors of service innovation, there is still insufficient research on the effects of service innovation, particularly the role of customer predictive capabilities in driving sustainable innovation development for enterprises.
Existing research not only overlooks the role of customer prediction and its impact on the service interaction process between the customer and the enterprise but also fails to consider the influence of the interaction-oriented market and customer prediction. Since service innovation involves multiple groups, its impact effects are also multi-level. From the perspective of sustainable innovation, especially in providing customized products and services to customers and in the context of ongoing digital transformation for continuous value creation, service innovation will have a certain degree of influence on employees, customers, and even competitors [1]. Therefore, future research on service innovation should pay more attention to the effects at the individual level.
Although research has found that customization strategies can enhance service innovation performance by meeting customer needs [2], whether it is the third industrial revolution or the widely discussed German Industry 4.0 strategy, customization strategies have been identified as an essential trend for the future development of service-oriented manufacturing companies, especially in terms of their impact on sustainability development [3].
Unfortunately, it is rare to find research that thoroughly explores and integrates how customer predictive ability affects the process of sustainable innovation practices in customized enterprises, hereafter referred to as innovation. In an era where the role of customer participation in innovation is becoming increasingly important and urgent [4], it is necessary to analyze and explore the relationship between customer predictive ability and innovation in customized production, as well as systematically discuss the mechanism and process by which customer predictive ability affects a company’s customized innovation.
Based on existing research on customer-oriented customized production, the focus has been on customer participation [5], customer value [6], and factors influencing customer acceptance of customization [7]. Few studies involve the influence of customer ability on the customized production process, especially from the market-oriented perspective; impact on innovation has not been sufficiently qualitatively studied. If such an influence exists, a company’s in-depth and leading understanding of customer ability can not only help the company determine the scope and advantages of new technologies earlier but also test the commercial value of the technology earlier [8].
It is widely recognized that customer orientation is not a new concept [9]. Customer engagement significantly impacts brand management and sustainable behavior [10]. As a result, companies focus on meeting customers’ needs; providing products/services to customers is a complex decision-making process, which must fully consider the preferences and non-preferences of customers to achieve customer satisfaction and the optimization of company resources [11]. However, Lengnick-Hall broke the narrow boundaries of solely relying on customers and believed expanding the customer role was the first step towards developing sustainable competitive quality [12]. Subsequent research supplemented customer capabilities, such as customers’ strong service recovery ability in self-service technology environments [13]. In participating in production services, customer loyalty, customer expertise, customer communication skills, customer emotional commitment, and interaction became factors that could potentially improve the level of joint production [14]. As the role of customers in different services is dynamic, Chervonnaya proposed the “chameleon” characteristic of customers and built a framework for customer capability resources by seeking objective rules through the trajectory of customer roles and skills [15].
This study links customer predictive ability to innovation. Previous scholars have explained the value of customer predictive ability. De Haan systematically compared different customer feedback indicators to test customers’ predictive ability for companies and industries [16]. The test results showed that customers who ranked higher performed better in predictive ability, and focusing on extreme cases was better than using the full-scale predictive ability. Based on similar studies, understanding the impact of customer predictive ability on corporate innovation research has important strategic value, especially when leading customer predictive ability provides useful information as a strategic management reference tool for industry managers.
In the context of the digital transformation and innovation of the manufacturing industry, it is crucial to maintain a balance between the shipping industry (a consumer market) and the shipbuilding industry (a production market). Stopford believes that the challenge facing the shipping industry concerning future demand is to find a strategic way to retain the best and most effective shipbuilding capabilities while promoting a global transportation system that meets regulatory, environmental, and shipowner requirements [17]. Therefore, unlike other traditional industries, the shipbuilding industry continues to focus on providing more differentiated customized products and services for shipping.
The shipbuilding industry is a typical representative of the manufacturing industry centered on customized production, emphasizing the personalized development of customers. The design, supervision, and acceptance of ship products are based on the requirements of ship owners. In the late 1980s, customer demands for various products led to the development of “customized production” [18]. Due to the short history of the development of customized production and the lack of typical research objects, there are few studies on innovation in customized production. The significant characteristics of small-batch customization, high unit value, and long construction cycles inherent in the shipbuilding industry determine the connotation of “service-oriented manufacturing” in the shipbuilding industry.
Moreover, the shipbuilding industry relies heavily on the operating environment of the shipping market. Customers care about product quality and hope to have products and put them into operation promptly [19]. Therefore, this study excavates the innovation problem of customer predictive ability (ship owners) in customized production through the historical laws of shipbuilding and shipping. This study addresses the following two questions:
Question 1: Does customer predictive capability have an impact on the sustainable innovation of customized enterprises?
Question 2: How does customer predictive capability influence the sustainable innovation of customized enterprises?
To address the issues mentioned above, we utilized panel data from 1999 to 2019, including new ship deliveries, the BDI, and the number of patents. A random forest model, an algorithm from machine learning, was employed to investigate the impact of customer forecasting ability on the sustainable innovation of customizing firms. Principal component analysis (PCA) and the Granger causality test were employed to identify the behavioral role of customer forecasting ability on sustainable innovation in customizing firms.

2. Literature Review

2.1. Service Innovation

The concept of service innovation originated from Barras, and through the critical examination and development of the research paradigm on the integration of manufacturing and service industries, scholars generally believe that service innovation has become an important point of convergence between the service and manufacturing industries and a key driving force for high-quality development. Service innovation involves continuously changing the new concepts of existing products and services and focuses on improving customer experience management through continuous production technology, investment, and operational improvements [20]. The groups that influence service innovation include customers, competitors, producers, etc., with customers being considered the most important driving factor for enterprise service innovation, driven by customer demands [21]. It is far from being as simple as previous innovation research has revealed, as it includes the development of new services and the innovation of customer roles in the service delivery process [22]. It constantly blurs the boundaries of productization while expanding resources for customers and other stakeholders, pushing internal innovation activities into the market [23].
It is worth noting that regardless of how companies emphasize the novelty of new technologies and products in their services, customers innovation service still can adopt or reject innovation [24]. Therefore, it is necessary to introduce market sensing capabilities and customer linking capabilities into the service innovation performance model [25]. Meng Pei’s research on 30 years of foreign service innovation studies found that service innovation focuses no longer on product and process innovation but on customer involvement [26]. Identifying and managing the role of customers in the service innovation process, considering customers as active participants and co-creators of value in innovation [27], aligns more with the changing patterns of complex networks and digital ecosystems in the digital age. In future research on innovation implementation, it is crucial to study how customer and market individual factors interact with innovation implementation and the process and outcomes of mutually satisfactory interactions, which are key to sustainable innovation.

2.2. Predictive Ability

Executives consider some form of prediction with almost every decision they make. Prediction is no longer a luxury but a necessity [28]. Therefore, making as detailed predictions as possible about various possible development paths and events is beneficial and essential. Boucher was the first to conduct predictive analysis research and found that 100 organizations engaged in long-term forecasting activities, with more than 60% belonging to industrial enterprises [29]. Rexer believes that one-third of predictive analytics applications focus on customer targeting and segmentation, customer acquisition, customer churn, and customer lifetime value management [30]. It is known that predictive technology has become commonplace in industrial enterprises, especially for customer prediction.
Chamlibers believes that the first task of prediction is to carefully select the appropriate correct prediction method. The wider the range of known predictive possibilities, the more significant the predictive outcome will be [31]. It depends on the characteristics and types of applications. Three basic methods are proposed for prediction: qualitative techniques, time-series analysis and speculation, and causal relationship methods. Among them, the second method mainly relies on historical data, focusing on development and trend changes to achieve the prediction purpose. Time-series analysis is a more descriptive and purposeful prediction activity aimed at effectively utilizing past data (especially for more than five years) to seek to understand potential stochastic processes and patterns to predict future values [32].

2.3. Innovation in Manufacturing

To measure the innovation performance of manufacturing, it is essential to understand innovation in manufacturing. Tidd and Bessant defined manufacturing innovation as something that neither changes the product nor the basic process but only changes some elements, trying to identify the factors that affect innovation [33]. At the same time, the scope of manufacturing innovation covers the entire product life cycle, and manufacturing innovation has diversity and dynamics [34]. Based on this, Roger believes that the standard for manufacturing innovation should focus on the number and types of new ideas that manufacturing attempts [35]. Therefore, innovation has been identified as a key research issue in production [36]. Innovation research is still a manufacturing focus in most developed and developing economies but is poorly understood [37,38]. Many manufacturing companies are more customer-oriented and use innovation research, such as mass customization, to meet customers’ special customization needs [39].
Currently, the escalating pressures of technological change and global challenges [40] have driven the high-level integration of technology with increasingly complex customer demands [41]. Successful companies respond to current customer or organizational needs and their own needs and must predict future trends. The ability to predict through the development of ideas, products, or services to quickly and effectively meet future needs is a necessary condition for development and can maintain a competitive advantage [42]. Therefore, the ability to predict innovation and increase the ability of companies to enter or create new markets becomes the key factor that ultimately affects success [43].
In the late 1980s, customer demands for various products led to the development of “mass customization” [27]. We are experiencing the fourth industrial revolution (known as “Industry 4.0”), in which new technologies and innovative ideas are emerging and being widely used to meet growing consumer demand. The contradiction between customer demand for personalized products and the relative scarcity of such products is becoming increasingly prominent [44], and customized production has become an important means for enterprise digital transformation and upgrading. Blecker believes that customization is the future paradigm, and the goal is to provide personalized products and services for customers, involving systemic customization in marketing, design, manufacturing, after-sales, and so on [45]. In other words, a customized production strategy is a customer-oriented and innovative value-creation process.

2.4. The Impact of Customers on Innovation

Through investigating the main subjective and environmental factors affecting customer participation in corporate innovation, Wang proposed that active participation can increase a company’s knowledge storage and improve the efficiency of enterprise innovation [46]. Analysis of the past literature on customer participation in innovation shows that the situational conditions for customer participation in innovation have not been clearly defined, but some of the literature has studied the impact of customer ability on innovation; customers prefer the value of integration with digital capabilities, which gives them many choices in digital innovation [47]. We expect that in the rapidly developing on-demand economy (in which organizations are particularly prone to the capability trap), obtaining customers with diverse experiences is particularly valuable. And the effect of organizational learning on performance depends on variations in the customer-focused strategy [48]. Based on earlier research on customer experience diversity, actively participating customers are an important driving force for the production process. They can greatly enhance a company’s innovation ability but with strict limitations. Only “lead users” can be the object of cooperation with enterprises [49]. Those with more diverse product experiences and more related technical knowledge are known as lead users [50]. Based on this, most researchers believe working with “lead users” can encourage companies to discover and innovate [51]. Other studies have found that clients or consultants from international markets are crucial to innovation [52]. On the contrary, customers’ short-term perspectives may mean a disaster for a company’s innovation ability [53].
Therefore, a key challenge businesses face is prediction, and innovation must be based on a more forward-looking understanding of demand prospects [54]. In this study, the scholars developed and tested theories about customer types that help organizations obtain timely and preferential access to information about customers’ changing preferences and adjust their market positioning accordingly to enhance their innovation capability [55].

3. Empirical Study

3.1. Research Background

This passage discusses the relationship between customer prediction ability and innovation in customized production. The research examines whether this relationship is causal and uses the shipping industry as an example to demonstrate the theme. The decision-making process of shipowners in investing in new ships involves a significant amount of capital investment, and they are primarily interested in economic advantages that can be generated by using new or improved methods and technology in new ships. In the shipping market structure, the dry bulk cargo market accounted for 44.8% of the global shipping structure in 2021, and its prosperity is highly correlated with global economic development. The dry bulk cargo market fees are the “barometer” of the entire market. Hughes proposed that shipowners believe profits are determined by how much income the ship can earn, and transportation costs are constant. Therefore, freight is called the “profit potential” of shipping [56]. The BDI is a robust indicator of the shipping market situation, which displays the demand for freight capacity and the supply of dry bulk ships. When supply exceeds demand, shipowners may decide to increase new ship orders to seek more profits, leading to an oversupply of capacity, breaking market equilibrium, and causing the BDI to decline. Conversely, when demand exceeds supply, shipowners may build new ships to increase capacity and improve earnings, causing the BDI to rise.
Therefore, we believe that the shipping market can provide good information for shipowners when deciding to customize the production of new ships. The BDI has been widely used as a world trade economic indicator. Many stakeholders try to predict accurately to make wise investments and trading decisions. Most customers will take similar ship investment behaviors, namely the investment selection of new ships, representing the size of customer prediction ability. Therefore, the collective investment behavior of customers is a true reflection of the shipbuilding market, and the size of customer prediction ability largely affects the shipbuilding market. Therefore, the BDI and new ship delivery volume can reflect customer prediction ability well. Of course, shipowners typically consider many issues when making investment decisions about ships, such as ship speed, hull strength, ship design styles, seaworthiness, etc. They also consider whether it meets common interests, whether future sustainability meets environmental requirements, and, most importantly, whether the ship’s stable reliability and service life can create economic benefits, that is, the economic profit brought by the ship entering the market. Gu Jianzhou, Vice Chairman of the Hong Kong Shipowners Association, pointed out that quality, technology, and service are particularly important factors in the eyes of shipowners [57].
Therefore, shipowners pay close attention to the value advantages brought by new methods and technological innovations in the new ship production process, that is, the innovation value in the ship production process. When shipowners predict that the market is good, they will pay more attention to innovative production factors. Conversely, shipowner behavior will be more conservative, and innovative enthusiasm will be affected.
In customized production, researchers often use patents to measure the innovation level for the innovation variable. Much research has found a positive correlation between patents and innovation [58,59,60], using patent data to evaluate the source of breakthrough innovation. Therefore, using patents to analyze innovation performance has become a recognized method, and here innovation is measured by the number of ship patents.
Due to the time required for information flow between markets and the construction time of ships, there is a time lag relationship between the shipping market and the shipbuilding market, manifested very subtly. This article identifies three key variables, freight rates, new ship delivery volume, and the number of patents, and Figure 1 shows the dynamic relationship between the three, which is the research model of this article.
Based on the above analysis, this paper uses the BDI and new ship delivery volume to reflect customer forecasting ability and the number of ship patents to reflect innovation in customized production, proposing two research hypotheses:
H1: 
New ship delivery volume has a certain degree of impact on freight rates.
H2: 
There is a causal relationship between customer forecasting ability and innovation in customized production.

3.2. Data Source

The dry bulk shipping market is generally considered a close-to-perfectly competitive market with intense competition, so the study focuses on the dry bulk market. The BDI is an indicator of the dry bulk shipping market. It comprises four freight rate indices (Capesize BCI, Panamax BPI, Supramax BSI, and Handysize) according to their importance and weight in the shipping market. Considering the nature and scale factors of the BDI itself, dry bulk carriers with a DWT of over 20,000 tons were selected as the research sample, Capesize bulk carriers (over 100,000 tons), Panamax bulk carriers (60,000–75,000 tons), Handymax bulk carriers (40,000–59,000 tons), and Handysize bulk carriers (20,000–50,000 tons), to analyze the relationship between the delivery volume of these four types of new ships and freight rates. For this study, we selected the BDI and delivery volume data for the four types of new ships from 1999 to 2019 as the sample for econometric analysis. All data were obtained from the UK Clarkson database with no missing values. In addition, we chose ship patent data to reflect the innovation level in customized production. Patent data were obtained from the US Patent Database, using “ship/shipping/shipbuilding” as the search keywords, removing duplicate data, and obtaining the number of patents for each keyword from 1999 to 2019, represented by SP1, SP2, and SP3, respectively.

3.3. Method

This paper explores the relationship between shipping and shipbuilding in time series analysis, so the widely used machine learning algorithm, the random forest model, is employed. Random forest is an ensemble learning algorithm proposed by Breiman in 2001 and is considered a typical success story in ensemble learning algorithms.
The random forest model constructed in this paper focuses on the correlation between variables. The model selects or averages the classification results of several weak learners to form a strong classifier, thereby improving the prediction accuracy by aggregating multiple models while preventing overfitting and ensuring the high accuracy and generalization performance of the overall model. At the same time, it has good adaptability to data. It can provide a ranking of the importance of each independent variable to the dependent variable, which has a high reference value for subsequent statistical regression analysis and provides statistical test efficiency.
This paper uses the BDI value as the sample label, and four categories of new ships are used as sample features. A random forest model is constructed using Python language for empirical analysis, which can effectively reflect the relationship between the two, and the importance of the delivery volume of new ships to freight rates (BDI) is obtained.
At the same time, the SHapley Additive ExPlanations (SHAP) value is introduced to explain the model. The Shapley value is a game theory concept proposed by the economist Lloyd Shapley. It clearly shows how much each feature contributes to the model’s prediction, and this method can help us explain the model. By calculating the SHAP value of each feature for each of the four samples in the random forest model and performing this operation for each subset of features, the absolute average value of all samples on different features can be obtained, which calculates the marginal contribution of adding the feature to the model and then considers the average marginal contribution of the feature under different feature sequences. This is the Shapley value of the feature.
After determining the relationship between the BDI and delivery volume of new ships, it is necessary to further study whether there is a causal relationship between the two and innovation in customized production. First, we use principal component analysis to reduce the dimensionality of the BDI and delivery volume of new ships, and we determine the variance contribution rate by selecting two principal components. Then, the two principal components are tested for unit root and Granger causality with the four categories of ship patent values to determine whether there is a causal relationship between the variables, “which causes the change of whom.” The Granger causality test formula is as follows:
Y t = C 2 + j = 1 p r j Y t j + j = 1 q δ j X t j + μ 2 t
Granger causality test formula.

4. Results

The experiment of this study was divided into two parts. The first experiment analyzed the relationship between H1: the impact of new ship delivery on freight rates using the random forest model with machine learning algorithms. The second experiment used principal component analysis and the Granger causality test to analyze H2: whether a causal relationship exists between customer prediction ability and innovation in customized production.

4.1. Random Forest Experiment

4.1.1. Descriptive Statistical Analysis

The BDI is an authoritative index that measures the international shipping situation and is a leading indicator reflecting international trade conditions. Figure 2 shows the time series of the BDI, indicating that the BDI began to show a growth trend in 2003 and broke through 6000 points in 2007, reaching its historical high point in freight rates. At the same time, global new ship orders began to grow in 2003. They reached a historical high of 270 million DWT in 2007, indicating that speculative capital flooded into the capacity of the shipbuilding and downstream shipping industry.
Shipbuilding differs from other manufacturing industries due to its long cycle and complex influencing factors. This study focuses on large bulk carrier cargo, which takes about 3–5 years from order to delivering new ships. Figure 3 shows that the delivery of new ships for the four ship types began to increase sharply in 2008, reached the highest value in 2011, and then began to decline but remained higher than the level before 2008, which is consistent with the trend of the growth in new ship orders since 2003. Under this circumstance, the shipping industry’s capacity level performed well. However, the outbreak of the subprime mortgage crisis 2008 led to a decline in demand, gradually forming a mismatch with the abundant supply side (new ship delivery volume), resulting in a large amount of idle shipping capacity in the shipping industry. The excess production capacity of shipbuilding brought about supply pressure, which entered a period of capacity adjustment. Therefore, the BDI plummeted in 2009 and remained low, causing a long period of low freight rates in the shipping industry. The shipbuilding industry went through deep integration, and overall production capacity remained surplus. It can be seen that there is a significant relationship between the BDI and new ship delivery volume.

4.1.2. Building A Random Forest Model

Based on the data in Figure 2 and Figure 3, it was found that there is a significant relationship between freight rates and the delivery volume of the four types of new dry bulk carriers. As it is difficult to discover linear correlations, this paper uses a random forest model to analyze the relationship between freight rates and the delivery volume of the four types of new dry bulk carriers. The experiment used the Python toolkit scikit learn (sklearn). The number of decision trees and the number of variables in the binary tree involved in this toolkit are the most important parameters affecting the model-fitting effect. After parameter optimization, the main parameter values are the number of decision trees, Nestimators = 100, and the maximum tree depth, MaxDepth = 5. Since the data used in this paper span 21 years, and the focus is on explaining the model itself, only the performance of the constructed model on the training set is considered. When constructing the model, the features of the four types of new ship delivery volume are renamed, and the renaming results are shown in Table 1.
The prediction and visualization results of the actual situation obtained by the random forest prediction model calculation are shown in Figure 4. After training, the model’s prediction accuracy on the training set is 89%, and the accuracy is high. The predicted freight rate is roughly the same as the actual freight rate, which can be considered relatively accurate for constructing the relationship model between freight rates and the delivery volume of the four types of new dry bulk carriers. Therefore, hypothesis 1 is validated, and there is a correlation between the delivery volume of new ships and freight rates.

4.1.3. SHAP Values for Model Interpretation

Global SHAP Interpretation

SHAP values are an effective method for interpreting predictions from machine learning models. As shown in the importance ranking of SHAP values in Figure 5, DWT2 has the highest importance for the model prediction, followed by DWT1, DWT4, and DWT3. The impact rankings are in the order of Panamax type > Capsize type > Handysiz type > Handymax type, indicating that different ship types impact the BDI differently. This suggests that the mutual impact of freight rates among large dry bulk carriers is smaller than that of small dry bulk carriers. This has a very important role in enabling shipowners to analyze the relationships between various sub-markets in the dry bulk shipping market, as well as to make investment and shipbuilding decisions by configuring the capacity of each market with new ship deliveries, guiding fluctuations in the BDI, and enjoying premiums from the shipbuilding and shipping markets.

Individual SHAP Explanation

Figure 6 shows that an increase in DWT1 leads to a decrease in the BDI, and the effect of DWT1 on the BDI tends to stabilize when DWT1 is greater than 15,000. The impact trajectory of DWT2 on the BDI (Figure 7) is similar to that of DWT1. An increase in DWT2 leads to a decrease in the BDI, and the effect of DWT2 on the BDI tends to stabilize when DWT2 is greater than 10,000. The impact of DWT3 on the BDI is overall a reverse U-shape (Figure 8); that is, when DWT3 is less than 7500, an increase in DWT3 leads to an increase in the BDI. When DWT exceeds 7500, an increase in DWT3 leads to a decrease in the BDI. Figure 9 shows that DWT4 has a positive correlation with the BDI. An increase in DWT4 leads to an increase in the BDI, and the effect of DWT4 on the BDI becomes more volatile when DWT4 is greater than 4000.
Therefore, the random forest experiment proves a correlation between new ship deliveries and the BDI, and different ship types influence the BDI differently. Large dry bulk carriers have a greater impact on the BDI than small dry bulk carriers.

4.2. Granger Causality Experiment

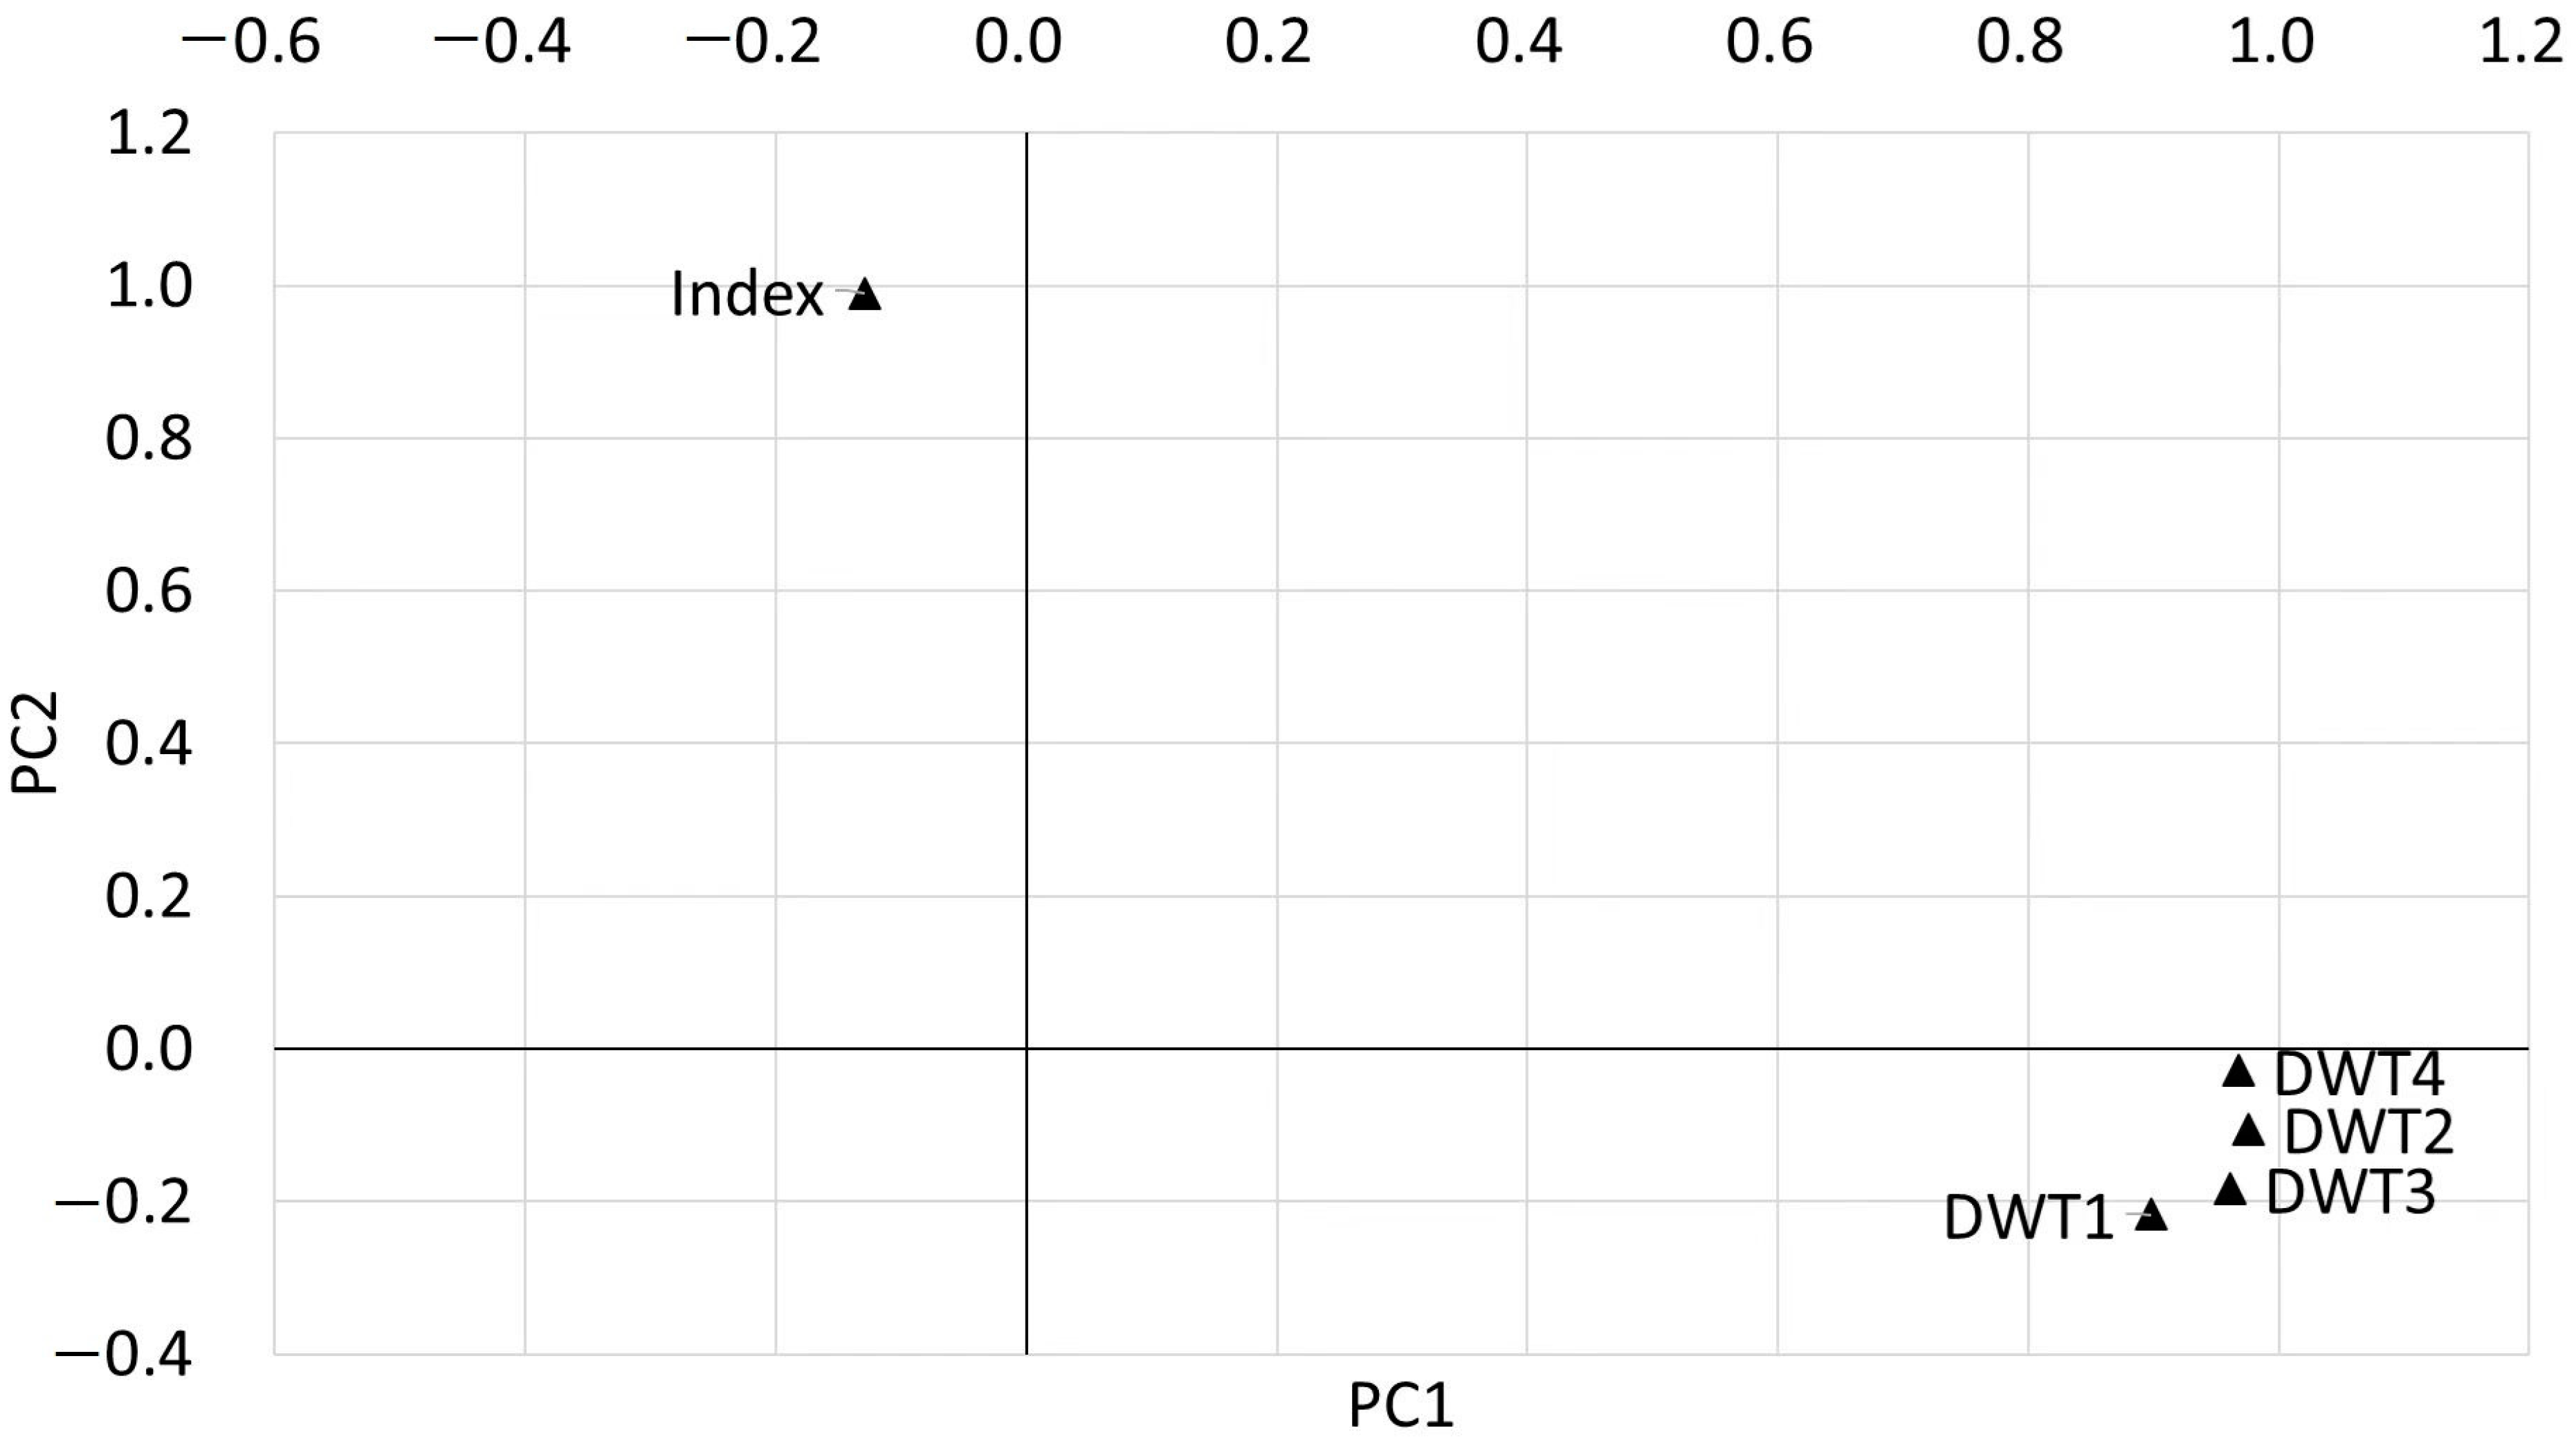
4.2.1. Principal Component Analysis

Due to the large number of variables, analyzing causality is cumbersome. Therefore, principal component analysis is first used to reduce the dimensionality of the five variables. The scree plot is obtained using SPSS analysis.
Based on Figure 10, the cumulative variance contribution rate reaches 94.16%. Two principal components are extracted, which can explain most of the information in the original data. Figure 11 shows that the first principal component mainly consists of four types of new ship deliveries, while the second principal component represents the BDI. The line chart of standardized values for the first and second principal components is shown in Figure 12.

4.2.2. Granger Causality Test

To ensure the stationarity of the time series, the ADF unit root test is first performed on two principal components and four patent quantities. Still, as they failed to pass the unit root test, they must be first-order differenced. After first-order differencing, all data can pass the unit root test (Table 2), indicating that the differenced data are a stationary sequence and can be subjected to regression analysis.
We used Stata14.0 software to conduct Granger causality test experiments, regressing variables at lag one, lag two, etc., and determining the optimal lag period based on the AIC and BIC values. We found that when p = q = 3, the AIC and BIC values were the smallest in our study. Therefore, we determined the lag period to be three and analyzed the causal relationships between PC1 and PC2 and SP1, SP2, SP3, and SP4 separately. The results of the lag three regression are shown in Table 3.
According to Table 3, hypotheses 1–8 all have p-values less than 0.01, indicating their significance at the 99% confidence level. Therefore, the original hypothesis is accepted, and PC1 is the Granger cause of SP1-SP4, while PC2 is also the Granger cause of SP1-SP4. New ship delivery and freight rates cause changes in innovation to varying degrees. From the data, the larger the chi-square value, the smaller the p-value and the stronger the significance. Therefore, PC1 has a larger chi-square value than PC2, indicating that new ship delivery has a greater impact on innovation. In addition, for hypotheses 13–16, SP1-SP4 are the Granger causes of PC2, and innovation has a certain impact on the fluctuation in freight rates. However, for hypotheses 9–12, the p-value is greater than 0.1, indicating a lack of significance. The original hypothesis is rejected, and SP1-SP4 is not the Granger cause of PC1, indicating that innovation does not impact new ship delivery.

5. Conclusions

Research has found that customers, by observing the market trends reflected in the rise or fall of the Baltic dry index (BDI), tend to adopt similar ship investment behaviors, specifically in the decision-making process regarding the successful delivery and operation of new ships. Therefore, the collective investment behavior of customers serves as a true reflection of the shipbuilding market conditions. The influx of new ship deliveries contributes to fluctuations in the BDI, indicating a clear correlation between the two, demonstrating the development of customers’ predictive abilities. Customers’ predictive abilities are sensitive to environmental and market factors, focusing primarily on how to obtain returns through ship operations in the freight market. Customers make choices regarding ship investments by analyzing and predicting changes in specific attribute values within a certain range.
This study empirically examines the relationship between market-oriented antecedents and customer predictive abilities. It adopts a customer-firm dyadic perspective to highlight the value of customer predictive abilities. Previous research has predominantly focused on identifying customers’ perceived value from the firm’s perspective, considering customer satisfaction and loyalty as important influencing factors of customer value. However, the generation of customer value expectations, satisfaction, and loyalty through customer value predictive abilities remains unclear, lacking consideration of the dynamism of customer value. This study proposes a new research perspective that focuses on the impact of customer predictive abilities on customer value. It highlights the dynamic capability that reflects the utilization of composite operational resources. Developing customer predictive abilities enables firms to identify customer value effectively, and this exceptional customer linking capability is considered a key source of competitive advantage [25]. This capability is derived from an overall understanding and anticipation of market demand potential.
In addition, the study made another important finding: customer predictive abilities are a crucial driver of innovation in customized production. Customer predictive abilities can influence innovation in customized production, and the ability of customers to predict based on market conditions greatly impacts the product innovation and scale of enterprises. This conclusion effectively validates the new connotation of service innovation, where innovation is a core concept, referring to introducing new products, processes, or services that are technologically driven and significantly different from previous offerings. These new services bring about transformative changes for enterprises or customers, with a heightened emphasis on the central role of customers. Consequently, they are launched into the market and form new value co-creation models.
Furthermore, innovation has a certain impact on market price fluctuations. Service companies must design resource integration mechanisms to support customers and enhance sustainable innovation. They should leverage their perception of customer innovation value to create driving forces or constraints for innovation. At the same time, companies must simultaneously optimize their value creation and customer-perceived value creation. Therefore, the effectiveness of innovation largely depends on the implementation and sustained efficiency of customer service innovation. Establishing new market sensing and customer value prediction capabilities is crucial for the long-term benefits of service innovation.
In future research on sustainable innovation implementation, attention should be paid to the potential changes that may occur during the innovation implementation process. Currently, research on dynamic capabilities focuses on developing new services by enterprises and transforming service ecosystems. In the future, the dynamic capabilities theory should be further applied to deepen our understanding of service innovation implementation. For example, it can help explore dynamic capabilities, such as customer predictive abilities, required for enterprises to implement a sustained series of incremental innovations and breakthrough innovations in the long term. This will provide solid theoretical guidance and scientific decision support for improving service innovation capabilities.

Author Contributions

H.S. and K.B. jointly designed the research ideas and contents. H.S. was responsible for the text writing, Y.G. and K.B. was responsible for the demonstration of research methods and models, Z.O. was responsible for data collection and processing, and H.S. and Z.O. were responsible for the revision and editing of the article. All authors finish the proofreading. All authors have read and agreed to the published version of the manuscript.

Funding

This work was supported by a generous grant provided by Characteristic innovation projects of colleges and universities in Guangdong Province, Guangdong Provincial Department of Education No.: 2022WTSCX339.

Informed Consent Statement

Not applicable.

Data Availability Statement

BDI and delivery volume data were obtained from the UK Clarkson database with no missing values. Patent data were obtained from the US Patent Database.

Conflicts of Interest

The authors do not have any conflicts of professional, financial, and personal interests relating to the research described in this paper.

References

  1. Daradkeh, F.M.; Hassan, T.H.; Palei, T.; Helal, M.Y.; Mabrouk, S.; Saleh, M.I.; Salem, A.E.; Elshawarbi, N.N. Enhancing Digital Presence for Maximizing Customer Value in Fast-Food Restaurants. Sustainability 2023, 15, 5690. [Google Scholar] [CrossRef]
  2. Terziovski, M. Innovation practice and its performance implications in small and medium enterprises (SMEs) in the manufacturing sector: A resource-based view. Strateg. Manag. J. 2010, 31, 892–902. [Google Scholar] [CrossRef]
  3. Martínez-Olvera, C. An Entropy-Based Formulation for Assessing the Complexity Level of a Mass Customization Industry 4.0 Environment. Math. Probl. Eng. 2020, 2020, 6376010. [Google Scholar] [CrossRef]
  4. Cui, A.S.; Wu, F. Utilizing Customer Knowledge in Innovation: Antecedents and Impact of Customer Involvement on New Product Performance. J. Acad. Mark. Sci. 2016, 44, 516–538. [Google Scholar] [CrossRef]
  5. Nambisan, S. Designing virtual customer environments for new product development: Toward a theory. Acad. Manag. Rev. 2002, 27, 392–413. [Google Scholar] [CrossRef]
  6. Remy, E.; Kopel, S. Social linking and human service sector. Serv. Ind. J. 2002, 22, 35–55. [Google Scholar] [CrossRef]
  7. Nordin, F.; Kowalkowski, C. Solutions Offerings: A Critical Review and Reconceptualization. J. Serv. Manag. 2010, 21, 441–459. [Google Scholar] [CrossRef] [Green Version]
  8. Cooper, R.G.; Kleinschmidt, E.J. New product performance: Keys to success, profitability & cycle time reduction. J. Mark. Manag. 1995, 11, 315–337. [Google Scholar]
  9. Dean, J.W., Jr.; Bowen, D.E. Management theory and total quality: Improving research and practice through theory development. Acad. Manag. Rev. 1994, 19, 392–418. [Google Scholar] [CrossRef]
  10. Jang, Y.-J.; Kim, E. Social and Personal Norms in Shaping Customers’ Environmentally Sustainable Behavior in Restaurants’ Social Media Communities. Sustainability 2023, 15, 6410. [Google Scholar] [CrossRef]
  11. Martínez-Torres, M. Customer preferences versus managerial decision-making in open innovation communities: The case of Starbucks. Technol. Anal. Strateg. Manag. 2015, 27, 1226–1238. [Google Scholar] [CrossRef]
  12. Lengnick-Hall, C.A. Customer contributions to quality: A different customer-oriented firm. Acad. Manag. Rev. 1996, 2l, 791–824. [Google Scholar] [CrossRef]
  13. Beibei, D.; Kenneth, R.E.; Zou, S. The effects of customer participation in co-created service recovery. Orig. Empir. Res. 2008, 36, 123–137. [Google Scholar]
  14. Auh, S.; Simon, J.B.; Colin, S.M.; Shih, E. Co-production and customer loyalty in financial services. J. Retail. 2007, 83, 359–370. [Google Scholar] [CrossRef]
  15. Chervonnaya, O. Customer Role and Skill Trajectories in Services. Int. J. Serv. Ind. Manag. 2003, 14, 347–363. [Google Scholar] [CrossRef]
  16. De Haan, E.; Verhoef, P.C.; Wiesel, T. The predictive ability of different customer feedback metrics for retention. Int. J. Res. Mark. 2015, 32, 195–206. [Google Scholar] [CrossRef]
  17. Stopford, M. Maritime Economics 3e; Routledge: London, UK, 2009. [Google Scholar]
  18. Pine, B.J. Mass Customization: The New Frontier in Business Competition; Harvard Business Press: Brighton, MA, USA, 1993. [Google Scholar]
  19. Alptekin, U.; Gabrijela, P.; Pavle, R.; Dragisa, S.; Darjan, K. A new hybrid fuzzy psi-piprecia-cocoso mcdm based approach to solving the transportation company selection problem. Technol. Econ. Dev. Econ. 2021, 27, 1227–1249. [Google Scholar]
  20. Enz, C.A. Strategies for the implementation of service innovations. Cornell Hosp. Q. 2012, 53, 187–195. [Google Scholar] [CrossRef]
  21. Liu, L. Research on the Driving Factors of Interaction Orientation and the Mechanism of Its Effect on Enterprise Service Innovation Performance. Ph.D. Thesis, Jilin University, Changchun, China, 2022. [Google Scholar]
  22. Kindström, D.; Kowalkowski, C.; Sandberg, E. Enabling service innovation: A dynamic capabilities approach. J. Bus. Res. 2013, 66, 1063–1073. [Google Scholar] [CrossRef] [Green Version]
  23. Rubalcaba, L.; Michel, S.; Sundbo, J.; Brown, S.W.; Reynoso, J. Shaping, organizing, and rethinking service innovation: A multidimensional framework. J. Serv. Manag. 2012, 23, 696–715. [Google Scholar] [CrossRef]
  24. Witell, L.; Snyder, H.; Gustafsson, A. Defining service innovation: A review and synthesis. J. Bus. Res. 2016, 69, 2863–2872. [Google Scholar] [CrossRef] [Green Version]
  25. Day, G.S. The capabilities of market driven organizations. J. Mark. 1994, 58, 37–52. [Google Scholar] [CrossRef]
  26. Meng, P. A Multi-Level Research on the Impact of Employee-Customer Value Co-Creation on Service Innovation. Ph.D. Thesis, Jilin University, Changchun, China, 2020. [Google Scholar]
  27. Ostrom, A.L.; Bitner, M.J.; Brown, S.W. Moving forward and making a difference: Research priorities for the science of service. J. Serv. Res. 2010, 13, 4–36. [Google Scholar] [CrossRef] [Green Version]
  28. Chamlibers, J.C.; Mullick, S.K.; Smith, D.D. How to Choose the right forecasting technique. Harv. Bus. Rev. 1971, 49, 45–74. [Google Scholar]
  29. Boucher, T.O.; Yalçin, A. Introduction. In Design of Industrial Information Systems; Academic Press: Cambridge, MA, USA, 2006; pp. 1–25. [Google Scholar]
  30. Rexer, K.; De Veaux, R.; Britton, G.; Taylor, J. Endorsements for Practical Text Mining & Statistical Analysis for Non-structured Text Data Applications; Elsevier: Amsterdam, The Netherlands, 2012. [Google Scholar]
  31. Makridakis, S.; Wheelwrighlt, S. Forecasting: Methods and Applications; Wiley: New York, NY, USA, 1978. [Google Scholar]
  32. Bunn, D. Forecasting with more than one model. J. Forecast. 1989, 8, 161–166. [Google Scholar] [CrossRef]
  33. Tidd, J.; Bessant, J.; Pavitt, K. Managing Innovation; Integrating Technological, Market and Organizational Change; John Wiley & Sons: New York, NY, USA, 2001. [Google Scholar]
  34. Moore, W.L.; Tushman, M.L. Managing Innovation over the product life cycle. In Readings in the Management of Innovation; Harpercollins: New York, NY, USA, 1982; pp. 131–150. [Google Scholar]
  35. Roger, G.S.; Gary, D.S.; Dawn, R.E. Innovation in manufacturing. J. Oper. Manag. 1989, 8, 1–15. [Google Scholar]
  36. Wong, H.; Huang, C.-Y. Innovation in production research. Int. J. Prod. Econ. 2014, 147, 1–2. [Google Scholar] [CrossRef]
  37. Chae, B. An evolutionary framework for service innovation: Insights of complexity theory for service science. Int. J. Prod. Econ. 2012, 135, 813–822. [Google Scholar] [CrossRef]
  38. John, E.E.; Stephen, R.R. Service innovation in manufacturing. J. Serv. Manag. 2012, 23, 440–454. [Google Scholar]
  39. MacCarthy, B.; Brabazon, P.G.; Bramham, J. Fundamental modes of operation for mass customization. Int. J. Prod. Econ. 2003, 85, 289–304. [Google Scholar] [CrossRef] [Green Version]
  40. Caputo, A.; Marzi, G.; Pellegrini, M.M. The Internet of Things in manufacturing innovation processes. Bus. Process Manag. J. 2016, 22, 383–402. [Google Scholar] [CrossRef]
  41. Shepherd, C.; Ahmed, P.K. From product innovation to solutions innovation: A new paradigm for competitive advantage. Eur. J. Innov. Manag. 2000, 3, 100–106. [Google Scholar] [CrossRef]
  42. Porter, M.E. Competitive Advantage; Free Press: New York, NY, USA, 1985. [Google Scholar]
  43. Li, Q.; Maggitti, P.G.; Smith, K.G.; Tesluk, P.E.; Katila, R. Top management attention to innovation: The role of search selection and intensity in new products introduction. Acad. Manag. J. 2013, 56, 893–916. [Google Scholar] [CrossRef] [Green Version]
  44. Yang, Y.; Wang, Y.; Sun, G. Research on Recommendation System from the Perspective of Consumers. J. Cent. Univ. Financ. Econ. 2016, 9, 79–85. [Google Scholar]
  45. Blecker, T.; Abdelkafi, N. Mass Customization: State-of-the-Art and Challenges; International Series in Operations Research & Management Science; Springer: Berlin/Heidelberg, Germany, 2006; pp. 1–25. [Google Scholar]
  46. Li, J.; Lin, Z.; Zhang, X. The Study on the Effectiveness of Sustainable Customer Relationship Management: Evidence from the Online Shopping Industry. Sustainability 2023, 15, 5911. [Google Scholar] [CrossRef]
  47. Almunawar, M.N.; Anshari, M. Digital enabler and value integration: Revealing the expansion engine of digital marketplace. Technol. Anal. Strateg. Manag. 2021, 34, 847–857. [Google Scholar] [CrossRef]
  48. Yuliansyah, Y.; Rammal, H.G. Organizational learning, innovativeness and performance of financial service firms in an emerging market: Examining the mediation effects of customer-focused strategy. Bus. Process Manag. J. 2021, 27, 1126–1141. [Google Scholar] [CrossRef]
  49. Von Hippel, E. Lead-Users: A Source of Novel Product Concepts. Manag. Sci. 1986, 32, 791–805. [Google Scholar] [CrossRef] [Green Version]
  50. Lilien, G.; Morrison, P.D.; Searls, K.; Sonnack, M.; von Hippel, E. Performance Assessment of the Lead User Generation Process for New Product Development. Manag. Sci. 2002, 48, 1042–1059. [Google Scholar] [CrossRef] [Green Version]
  51. Urban, G.; von Hippel, E. Lead User Analyses for the Development of New Industrial Products. Manag. Sci. 1988, 35, 569–582. [Google Scholar] [CrossRef] [Green Version]
  52. Odei, S.A.; Stejskal, J. Firms pursuit of innovations through internationalization: A treatment effect estimation. Technol. Econ. Dev. Econ. 2020, 26, 837–866. [Google Scholar] [CrossRef]
  53. Christensen, C.M.; Bower, J.L. Customer Power, Strategic Investment and the Failure of Leading Firms. Strateg. Manag. J. 1996, 17, 197–218. [Google Scholar] [CrossRef]
  54. Gavetti, G.; Levinthal, D. Looking forward and looking backward: Cognitive and experiential search. Adm. Sci. Q. 2000, 45, 113–137. [Google Scholar] [CrossRef] [Green Version]
  55. Hsu, G.; Kovács, B.; Koçak, Ö. Experientially diverse customers and organizational adaptation in changing demand landscapes: A study of US cannabis markets, 2014–2016. Strateg. Manag. J. 2019, 40, 2214–2241. [Google Scholar] [CrossRef]
  56. Hughes, C. Ship Performance; LLP: London, UK, 1996. [Google Scholar]
  57. Gu, J. Standards in the eyes of shipowners. Shanghai Shipbuild. 2006, 16, 10–11+15. [Google Scholar]
  58. Schautschick, P.; Greenhalgh, C. Empirical studies of trade marks—The existing economic literature. Econ. Innov. New Technol. 2016, 25, 358–390. [Google Scholar] [CrossRef] [Green Version]
  59. Kim, B.; Gazzola, G.; Yang, J.; Lee, J.-M.; Coh, B.-Y.; Jeong, M.K.; Jeong, Y.-S. Two-phase edge outlier detection method for technology opportunity discovery. Scientometrics 2017, 113, 1–16. [Google Scholar] [CrossRef]
  60. Chen, L.; Luo, M. Comparative study on technological innovation ability of colleges and universities from the perspective of patent trend analysis. Libr. Inf. Res. 2023, 16, 114–123. [Google Scholar]
Figure 1. Research model.
Sustainability 15 10699 g001
Figure 2. The BDI from 1999 to 2019.
Sustainability 15 10699 g002
Figure 3. New ship delivery volume of four types of dry bulk carriers.
Sustainability 15 10699 g003
Figure 4. Comparison of predicted results and actual freight rates.
Sustainability 15 10699 g004
Figure 5. Global SHAP explanation—feature importance.
Sustainability 15 10699 g005
Figure 6. SHAP explanation of Capesize new ship deliveries on the BDI.
Sustainability 15 10699 g006
Figure 7. SHAP explanation of Panamax new ship deliveries on the BDI.
Sustainability 15 10699 g007
Figure 8. SHAP explanation of Handymax new ship deliveries on the BDI.
Sustainability 15 10699 g008
Figure 9. SHAP explanation of Handysize new ship deliveries on the BDI.
Sustainability 15 10699 g009
Figure 10. Scree plot.
Sustainability 15 10699 g010
Figure 11. The variance contribution rate of principal component analysis.
Sustainability 15 10699 g011
Figure 12. Principal component values.
Sustainability 15 10699 g012
Table 1. Renaming table.
RenameVariable
DWT1Capesize Bulkcarrier Deliveries
DWT2Panamax Bulkcarrier Deliveries
DWT3Handymax Bulkcarrier Deliveries
DWT4Handysize Bulkcarrier Deliveries
Table 2. Unit root test.
VariablesLevel1st DifferencedADF
PC1−1.311−2.608 **YES
PC2−1.792−4.298 ***YES
SP11.770−2.514 **YES
SP20.332−5.156 ***YES
SP31.081−3.25 ***YES
SP4(SP1 + SP2 + SP3)1.362−2.958 ***YES
**. Significant at the 0.01 level (two-tailed); ***. Significant at the 0.001 level (two-tailed).
Table 3. Granger causality test.
Serial NumberNull Hypothesischi-Square Testp
1PC1 is the Granger cause of SP41016.680
2PC2 is the Granger cause of SP421.240.0007
3PC1 is the Granger cause of SP31003.020
4PC2 is the Granger cause of SP3373.690
5PC1 is the Granger cause of SP12.30 × 1050
6PC2 is the Granger cause of SP126.180.0001
7PC1 is the Granger cause of SP2463.860
8PC2 is the Granger cause of SP220.640.0009
9SP4 is the Granger cause of PC15.910.3154
10SP3 is the Granger cause of PC14.10.5352
11SP1 is the Granger cause of PC12.970.7039
12SP2 is the Granger cause of PC18.970.1103
13SP4 is the Granger cause of PC237.940
14SP3 is the Granger cause of PC2989.90
15SP1 is the Granger cause of PC2700
16SP2 is the Granger cause of PC228.810
Disclaimer/Publisher’s Note: The statements, opinions and data contained in all publications are solely those of the individual author(s) and contributor(s) and not of MDPI and/or the editor(s). MDPI and/or the editor(s) disclaim responsibility for any injury to people or property resulting from any ideas, methods, instructions or products referred to in the content.

