Article

Water Inflow Amount Prediction for Karst Tunnel with Steady Seepage Conditions

1
School of Safety Engineering and Emergency Management, Shijiazhuang Tiedao University, Shijiazhuang 050043, China
2
Key Laboratory of Large Structure Health Monitoring and Control, Shijiazhuang 050043, China
*
Author to whom correspondence should be addressed.
Sustainability 2023, 15(13), 10638; https://doi.org/10.3390/su151310638
Submission received: 6 June 2023 / Revised: 3 July 2023 / Accepted: 4 July 2023 / Published: 5 July 2023

Abstract

:
Tunnel engineering is an important aspect of developing and utilizing underground spaces. Tunnel water inrush became a common problem that restricts the safe and efficient construction of tunnels. This paper focuses on a karst water-rich tunnel in Chongqing and establishes a seepage field distribution model around the tunnel, analyzing the evolution law of the seepage field. The water balance method and underground runoff modulus method are used to predict tunnel water inflow. The prediction method for tunnel water inflow in water-rich karst areas is combined with long-term on-site tunnel hydrology observations. The distribution of groundwater in front of the tunnel face is drawn using the software, successfully predicting the larger karst area in front of the face. The prediction of water inrush risk level for karst tunnels is carried out using the SVR model. An expression formula for the water head around the tunnel is established by using the conformal mapping relationship, and the distribution status of the seepage field around the tunnel is ultimately determined. The overall prediction accuracy of the underground runoff modulus method is better than that of the water balance method in predicting the water inrush volume of the tunnel. The prediction of the large karst area ahead of the heading is successfully achieved by using the SVR model. This prediction method can provide reference and guidance for the construction of other karst-rich water tunnels in the region.

1. Introduction

With the rapid development of the economy and society, as well as the sharp increase in population, the limited space resources are increasingly unable to meet human needs. Therefore, the rational and effective development and utilization of underground space became a critical issue in addressing the crisis of human survival [1,2,3,4]. In recent years, tunnel engineering, as an important component of underground space development and utilization, made significant progress [5,6,7,8]. Based on a comprehensive analysis of the construction experience of completed and under-construction tunnel projects in China, it is evident that water inflow in tunnels became a crucial common problem that restricts safe and efficient construction.
The relationship between tunnel construction and sustainable development is closely linked. Tunnel construction can improve transportation efficiency and promote economic development, but it also brings environmental pollution and ecological damage. Therefore, in the process of tunnel construction, the concept of sustainable development should be considered, and sustainable construction methods should be adopted to reduce the impact on the environment and ecology. At the same time, after tunnel construction, environmental protection and ecological restoration should be strengthened to promote sustainable environmental development. The relationship between tunnel construction and sustainable development requires a balance between economic development and environmental protection to achieve sustainable development goals. Tunnel water inflow is a common problem in tunnel engineering, which can greatly affect the use and maintenance of tunnels. In terms of sustainability, tunnel water inflow can cause various environmental problems, such as soil erosion and water pollution, and cause damage to the ecological environment. In this case, measures need to be taken to reduce tunnel water inflow and effectively treat the inflow. For example, in the process of tunnel construction, anti-seepage technology can be used to reduce the occurrence of water inflow; after water inflow occurs, effective treatment measures, such as regulating water flow and purifying water quality, need to be taken to reduce the impact on the environment. By taking these measures, tunnel engineering can become more sustainable, reduce its impact on the environment, and improve its service life and economic benefits.
Tunnel water inflow prediction is an important part of tunnel investigation, design, and construction [9,10,11]. For the problem of tunnel water inflow, some scholars analyze the evolution process of surrounding rock seepage fields during tunnel construction. Zhou Weiyuan and Yang Yanyi [12] established a coupling model of seepage damage in rock mass, and systematically analyzed the coupling process of stress field and seepage field in fractured rock mass. Huang Tao [13] put forward the prediction method of water inflow in mountain tunnels by using the fluid–structure coupling theory, which was applied in the Qinling tunnel with good results. Pei Xianghui [14] took the deep-buried high-stress circular cross-section tunnel as the research object, calculated the analytical solution of the tunnel seepage field, and further predicted the tunnel water inflow.
Ren Shilin [15] conducted numerical simulations using an actual tunnel project as an example, and studied the changes in the seepage field at different stages of the tunnel construction process, including the initial seepage field, the gross cavity seepage field, the seepage field after grouting, and the seepage field after the lining was applied, based on which a new idea for solving the tunnel seepage problem was proposed. Zheng Li [16] conducted a series of experiments to investigate the performance of grouted rings and primary supports at different permeability coefficients by using a tunnel seepage model test system, explored the effect of the support structure on the water influx and water pressure distribution in the tunnel, and proposed a new solution for grouting enclosures in water-rich tunnels with which to reduce groundwater decline. Zheng Li [17] treated the surrounding rock, grouting circle, and lining as a complete system, derived a hydraulic pressure equation for the seepage field of this system, and compared the hydraulic pressure distribution in the surrounding rock of the unlined tunnels and tunnels containing both grouting circle and lining through tests based on Harr’s classical solution for unlined tunnels and taking into account the actual hydrological environment. Liu Guangying [18] took the example of actual tunnel construction and focused on predicting the amount of water inflow in tunnels. By using theoretical analysis and numerical simulation methods, the predicted results of numerical methods and empirical formulas are compared, and the idea of using underground seepage model numerical simulation methods for predicting water inflow in mountain tunnels is proposed. Zhou Wen-jun [19] also used different theoretical calculation methods and numerical simulations to predict the amount of water inflow in the Guan-shan Tunnel and compared it with actual data, providing a reference for calculating water inflow in other engineering projects. Wang Lin-feng et al. [20] proposed a water inflow calculation method that considers the effect of permeable interlayers. Based on the circular island model and mapping principle, indicators such as interlayer thickness and distance between tunnels and water injection layers are used for calculation verification based on the actual situation of the tunnel, providing some ideas for theoretical calculation of water inflow in tunnels. Shi et al. [21], based on actual detection data, constructed a three-dimensional crack network seepage model that combines the Monte Carlo algorithm and the parent—child–ladder correction mode for tunnel water inflow prediction. They used numerical calculations to predict the water inflow situation in the tunnel, providing a reference for corresponding tunnel engineering. Bai et al. [22] proposed a tunnel water inflow prediction modeling method based on the pipeline flow process and considering karst bimodality and boundary conditions for tunnel water inflow problems in karst areas, providing some reference for predicting water inflow in karst tunnels. Mahmoodzadeh et al. [23] used machine learning algorithms such as LSTM, DNN, KNN, SVR, DT, and GPR combined with hundreds of water inflow data to analyze the performance of LSTM and DNN algorithms in predicting tunnel water inflow. They provide a basis for machine learning-based water inflow prediction. Chen et al. [24] proposed a tunnel water inflow evaluation method based on CNN that integrates classification and semantic segmentation steps for rock tunnel faces, providing some research ideas for similar tunnel water inflow prediction. Chen [25] accurately predicted the amount of water inflow in the Liupanshan Tunnel by using the underground runoff model. Liu [26] used the groundwater runoff modulus method to estimate the prediction results for tunnel groundwater inflow.
Many scholars both domestically and internationally conducted studies on water inrush in tunnels, but there are still relatively insufficient studies. In terms of predicting the sudden water inflow in karst tunnels, most scholars used a combination of theory and numerical simulation. Most of these studies focus on predicting the amount of water inflow in karst tunnels, while relatively little research was conducted on predicting the risk level of water inrush in karst tunnels.
Although the issue of tunnel water gushing received significant attention, research on stable seepage water gushing of water-rich karst tunnels is still in its infancy, and further investigation is needed. This study examines a karst water-rich tunnel in Chongqing and establishes a distribution model of the seepage field around the tunnel to analyze its evolution. Water balance and underground runoff modulus methods are used to predict tunnel water inflow, and the suitable prediction method for tunnel water inflow in karst areas is selected based on long-term observation results of tunnel hydrology. Using software, the groundwater distribution in front of the tunnel face is drawn, and the large karst area in front of the tunnel face is successfully predicted. Additionally, a SVR model is used to predict the risk level of water gushing in karst tunnels. The research findings can provide valuable reference and guidance for similar karst water-rich tunnel constructions.

2. Stable Seepage Field Distribution Model of Karst Water-Rich Tunnel

2.1. Basic Assumptions

According to the characteristics of seepage in karst water-rich tunnels, to obtain the analytical solution of stable seepage field distribution in tunnels, the following basic assumptions are put forward:
(1)
The surrounding rock of the tunnel is a homogeneous continuous medium.
(2)
The water head around the tunnel is equal to H1, and the groundwater level line is constant, which is H2.
(3)
The volume of groundwater is incompressible and accords with Darcy’s seepage law.
(4)
To simplify the calculation, the seepage field distribution of the tunnel is solved by conformal mapping and a circular island steady well flow model [27].

2.2. Establishment and Solution of Tunnel Steady Seepage Field Distribution Model

According to the basic assumptions, the calculation area of the tunnel seepage field (shown in Figure 1) is mapped to the origin area (shown in Figure 2) by conformal mapping.
In Figure 1, r represents the radius of the calculated tunnel and h represents the height of the center point of the tunnel from the groundwater level. In Figure 2, the inner circle |δ| = 1 is the unit circle, and the outer circle |δ| = α is the mapped region with the expression x 2 + y + h 2 = r 2 . The radius α is a parameter related to r and h , and the corresponding relationship is:
r h = 2 α 1 + α 2 .  
The water inflow of the tunnel can be obtained from the mapped area as follows:
Q = 2 π r V
where Q is the tunnel water inflow, m3/s.
According to Darcy’s seepage law:
V = φ r = K H r
The expression of water head H at any point can be obtained by combining Formulas (2) and (3) and integrating them:
H = Q 2 π K ln r + C
where K is the permeability coefficient of the tunnel, m/s and C are constants, which can be determined by boundary conditions.
From the groundwater level boundary, it can be known that |δ| = 1 and y = 0; H = H2, which yields C = H2. where: H2 is the groundwater head, m.
By combining this with the condition |δ| = α and H = H1, where H1 is the water head around the tunnel, m. The expression for the water inflow in the tunnel can be obtained by solving Equation (4).
Q = 2 π K H 2 H 1 ln α
When |δ| = ρ (where ρ = ε 2 + η 2 , and 1 < ρ < α), the hydraulic head at that point is:
H = ln ρ ln α ( H 2 H 1 ) + H 2 .  
Then using the mapping relationship to transform into the original coordinate system, we can obtain:
H = H 2 H 2 H 1 2 ln α × ln a 2 ( x 2 + y 2 ) + b 2 h 2 + 2 a b h y a 2 ( x 2 + y 2 ) + b 2 h 2 2 a b h y .  
Among them, a = 1 + α 2 ,   b = 1 α 2 ,   α = h h 2 r 2 r .
When the gravity field and seepage field are superimposed, and then the simultaneous Formula (5) is transformed into the expression of tunnel water inflow, the water head of the tunnel seepage field H is as follows:
H = H 2 + Q 4 π K × ln a 2 ( x 2 + y 2 ) + b 2 h 2 + 2 a b h y a 2 ( x 2 + y 2 ) + b 2 h 2 2 a b h y y .  
When the tunnel radius, water inflow, permeability coefficient, and groundwater level height are known, the water head height at any position of the surrounding rock of the tunnel can be determined. This equation lays a foundation for finally determining the distribution of the seepage field around the tunnel.

3. Engineering Example Analysis

3.1. Project Overview

The authors undertook the tasks of long-term monitoring of tunnel hydrology. The tunnel is situated in Chongqing, where there are no adverse geological phenomena such as landslides, debris flows, or dangerous rocks in the tunnel site area. However, karst phenomena are prevalent and mainly exhibited through surface dissolution depressions, karst lakes, stone buds, dissolution ditches, and sinkholes. Within the base rock strata, karst caves and underground rivers are the primary manifestations of karst phenomena.
The tunnel crosses through a carbonate rock stratum area and the entrance is located at the foot of the hillside on the left side of Shimengou. The natural slope has a slope direction of about 340 degrees, with a gentle slope at the foot of the slope, a moderate slope in the middle, a lower slope angle of 15–27 degrees, and an upper slope angle of 38–42 degrees. The largest gully in the cave is the Maiyin trough (between mileages K6+400–K6+700 m), which is U-shaped with a wide and gentle bottom and nearly self-supporting wings. The tunnel exit is in the middle and lower part of the slope on the right bank of Dixuangou, with an overall direction of about 146 degrees, a slope angle of about 59 degrees, and a steep slope at the foot of the slope.
The groundwater in the tunnel site area is mainly pipeline water, which is mainly found in interlayer fissures, structural fissures, and karst pipelines. Limestone and dolomite in the tunnel site area have high permeability. Based on ground geological mapping, there are numerous water outcrops in the Longyan River on the south side of the tunnel site area during the rainy season. The rock mass in the tunnel area mainly receives recharge from atmospheric precipitation, which infiltrates underground through interlayer planes and structural fissures that develop on the surface. This affects the recharge rate of tunnel groundwater. Based on the hydrologic survey of the area, wells and springs are exposed in the gully section of the tunnel area, with varying discharge rates typically ranging from 0.1 to 4 L/s. The outflow of underground rivers is generally higher, ranging from 10 to 60 L/s. The tunnel is divided into four areas based on groundwater recharge characteristics (see Figure 3): Sanquan District (K5+030–K5+850), Kouzi District (K5+850–K6+600), Long Beach District (K6+600–K7+050), and Tunnel Exit District (K7+050–K8+476). Table 1 shows the main geological conditions.

3.2. Prediction and Evaluation of Tunnel Inflow Calculation

According to the hydrogeological survey on site and the characteristics of the tunnel, two methods, namely the water balance method and the underground runoff modulus method, were chosen to predict the water inflow in the tunnel, based on commonly used methods for predicting water inflow in water-rich karst tunnels. The predicted methods for water inflow were optimized by comparing them with the long-term observation results of water inflow in the tunnel on site. This was conducted to identify the best prediction methods suitable for water inflow in tunnels in karst areas.
(1)
Water balance method
The groundwater recharge is calculated by using the formula of multi-year average recharge (Formula (9)).
Q w a t e r = 1000 × λ × h × F 365 = 2.74 × λ × h × F .
In the equation, Q w a t e r represents the groundwater recharge amount, in m3/d; λ is the infiltration coefficient, where λ = P r P , P r is the rainfall infiltration amount in mm, and P is the rainfall amount during the corresponding water level rise period in mm; h is the average annual rainfall in the area, which is 1124.1 mm; and F represents the exposed area of the aquifer, in km2. Table 2 shows the groundwater recharge amount evaluated using the water balance method for the entire tunnel section.
(2)
Underground runoff modulus method
Calculation formula by underground runoff modulus method:
Q underground = M × F × 3600 × 24 1000 = 86.4 × M × F
where Q is groundwater recharge, m3/d; and M is the modulus of underground runoff, L/(s·km2).
To calculate the underground runoff modulus M, LS25-3A current meter and water level gauge were used to measure the flow rate of each subzone during the dry season and calculate the underground runoff modulus. Table 3 shows the evaluation of groundwater recharge in each subzone using the underground runoff modulus method.

3.3. Discussion on Calculation Methods for Tunnel Inflow

To verify the accuracy of the above two methods in predicting water inflow in water-rich karst tunnels, the authors monitored the tunnel water inflow throughout the entire construction process. Formula (11) is used to calculate the accuracy.
η = 1 Q Q Q × 100 %
where η is the prediction accuracy, Q is the predicted water inflow, m3/d, and Q is the actual water inflow, m3/d.
Table 4 is a comparison table of the prediction accuracy of the two methods and presents the data in the table as a line graph as shown in Figure 4. By comparing Table 4, it is known that the prediction accuracy of the water balance method corresponding to Sanquan zoning, Kouzi zoning, Long Beach zoning, and tunnel exit zoning is 93.53%, 47.02%, 78.85%, and 55.97%; the prediction accuracy of subsurface runoff modulus method is 90.45%, 88.69%, 86.01%, and 89.14%, corresponding to the Sanquan subarea, Kouzi subarea, Long Beach subarea, and tunnel exit subarea. Based on the principle of water balance, the water balance method estimates groundwater runoff by calculating the relationship between precipitation, evaporation, and groundwater recharge. The water balance method is simple and easy to use, does not need much data and complex calculations, and is suitable for the overall water balance estimation, so its prediction accuracy is low [28]. Yet the groundwater runoff modulus method estimates groundwater runoff by calculating the flow rate and storage capacity of groundwater. It requires a lot of geological and hydrogeological data. The established model is more complex. The model parametrizes for different selected regions; so, its prediction accuracy is high. The overall prediction accuracy of the underground runoff modulus method is better than that of the water balance method, and the overall prediction accuracy is over 86%. In the future, the underground runoff modulus method can be used to predict the water inflow of water-rich karst tunnels.

3.4. Field Application Analysis of Water Inflow Prediction

Based on the distribution equation of the seepage field around the tunnel and the water inflow data predicted by the surface runoff modulus method, the groundwater distribution state in front of the tunnel face was plotted using software. Figure 5 shows a cloud picture of the groundwater distribution in front of the tunnel face at K7+000. The central point in the figure represents the central axis of the tunnel face, with the positive direction of the X-axis indicating the right position of the face and the negative direction indicating the left side of the face. The Y-axis represents the front of the tunnel face. Analysis of Figure 4 shows that there is significant water gushing in the tunnel at K7+010–K7+030 in front of the tunnel face and should be given high priority during construction. Figure 6 shows a scene photo of water gushing at the K7+020 tunnel, where a large vertical karst pipeline is present. This karst cave is connected to an underground river, and the water supply is abundant. Measurements indicate that the maximum water gushing from this karst pipeline during a rainstorm can reach nearly 10,000 m3/d.

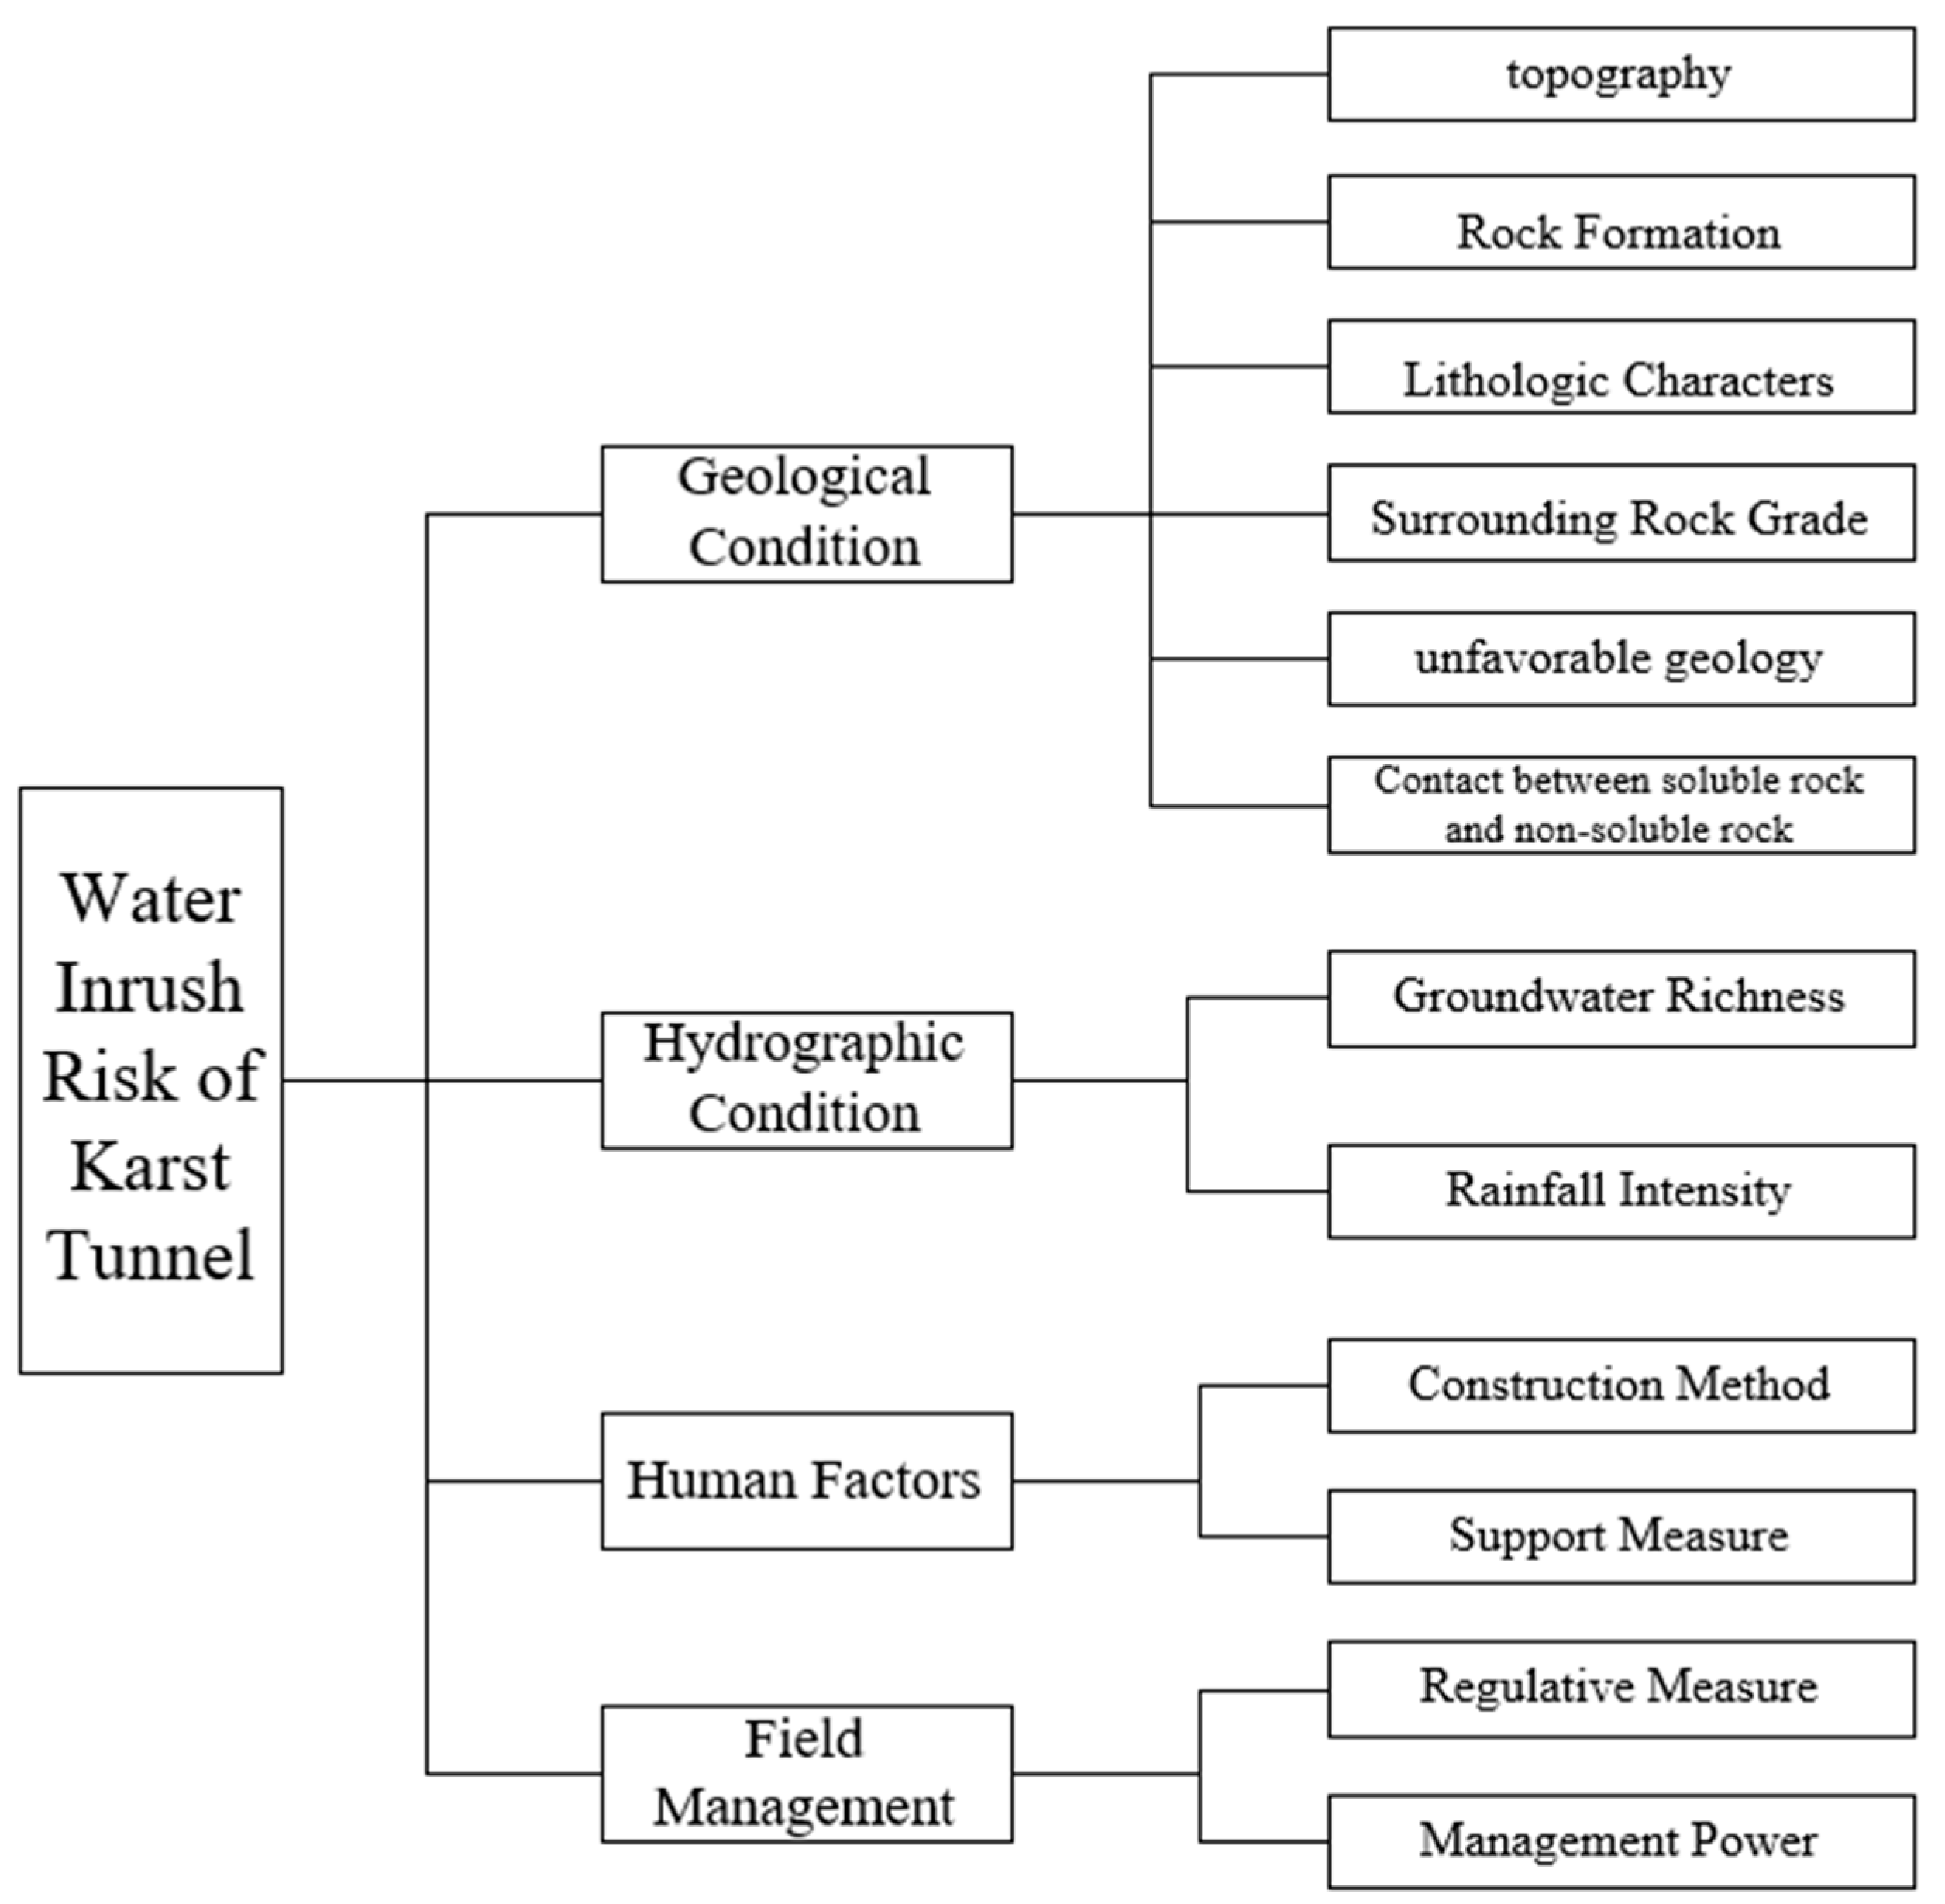
4. Prediction of Water Inrush Risk in Karst Tunnels

4.1. SVR Model

The SVR model is a way of using support vector regression, which establishes a barrier line on each side of the linear function. The distance between the barrier line and the linear function is ε, which is usually given based on experience. The samples that fall within the isolation line are not counted as losses, and only the support vectors will affect the function model. Finally, the optimized model is obtained by minimizing the total loss and maximizing the interval. The model diagram is shown in Figure 7. The circles represent the samples. For nonlinear models, kernel functions are used to map to feature space before regression, similar to SVM. Since the SVR model can perform regression analysis with a small number of samples, it is used to predict the risk level of water inrush in karst tunnels.

4.2. Prediction of Water Inrush Risk in Tunnels Based on the SVR Model

The occurrence of water inrush accidents is closely related to the hydrogeological conditions near tunnels. The topography, geomorphology, lithology, and rock mass conditions provide objective conditions for the accumulation of groundwater and the development of karst. The rationality of construction and support schemes during tunnel construction, and the management of tunnels with water inrush risks are the subjective conditions for the occurrence of water inrush accidents. In the case of abundant groundwater, the consequences of sudden water and mud in karst tunnels cannot be ignored, so the prediction of water inrush risk levels in karst tunnels is carried out.
Referring to relevant standards and literature [29,30], the authors constructed a risk assessment index system for karst water inrush in tunnels, consisting of 4 primary indicators and 12 secondary indicators. These secondary indicators, including topography, lithology, rock mass level, rainfall intensity, construction method, management level, etc., were selected as input layer indicators for karst tunnel water inrush risk, as shown in Figure 8. Relevant information was consulted and experts were consulted to formulate the classification standards for water inrush risk and input layer indicators of karst tunnels. The occurrence of water inrush accidents is closely related to topography and geomorphology, hydrogeological conditions, human factors, and construction management. The geological conditions and lithology of the surrounding rock formations provide favorable conditions for underground water flow, while the contact zone between karstic and non-karstic rocks can facilitate the rapid development of karst. The abundance of groundwater and precipitation in the nearby area is also a necessary condition for the occurrence of water inrush accidents. The correct selection of construction methods and support measures can also affect the likelihood of water inrush accidents. Moreover, construction management practices are also a significant factor that influences the risk of water inrush accidents. The specific standards are shown in Table 5.
By collecting and organizing domestic karst tunnel water inrush accidents, 68 accident cases were summarized and combined with the water inrush situations in the four partition zones mentioned above, for a total of 72 cases. The SVR model was used to predict the water inrush volume of the karst tunnel. Among them, 58 accidents were used as the training set, and the remaining cases were used as the prediction set. The collected data were quantified and scored by relevant experts for the indicators that needed to be assigned values. Specific sample data can be found in the Supplementary Materials.
Referring to the code for hydrological survey and design of railway engineering (TB 10017-2021) [31] and the classification of water inflow in the document [32], the division of risk levels based on the numerical value of water inrush volume is shown in Table 6.
To facilitate model calculations, the risk levels in Roman numerals were converted to Arabic numerals 1–4 and software was used to train the SVR model for sample prediction. The results are shown in Figure 9 and Figure 10.
From Figure 8, the results of predicting the risk level for the training samples are carried out. The prediction results of the model are affected by the quality of the training data. If there are missing or abnormal values in the training data, the learning ability of the model may be affected [33]. As shown in Figure 9, the average absolute percentage error of the SVR model tested is 0.0867. Some individual testing samples have a relative error of more than 0.1, while the maximum error is 0.146. The errors of other samples are not significant. That is, the predicted results using the SVR model have small errors compared with the actual risk level, and the results are reasonable. To verify the accuracy of the SVR model, its prediction results were compared with those of the BP model. The predicted results of the SVR model and BP model, as well as the actual risk level results for Sanquan, Kouzi, Changtan, and export, are shown in Table 7.
As shown in the results in the table, the predicted risk levels for the four regions of water inrush are within a reasonable range. The predicted levels for the Sanquan and Export sections are 1.816 and 2.229, respectively, which are close to Level II and consistent with the actual level. The predicted result for Kouzi is 3.827, which is close to Level IV, and the predicted result for Changtan is 1.091, which is close to Level I and consistent with the actual level. However, the prediction error of the BP model is relatively large. Therefore, using the SVR model to predict the risk level of karst tunnels’ water inrush is more reasonable and can be used for risk level prediction.

5. Conclusions

By utilizing the conformal mapping relationship, an expression formula for the water head around the tunnel was established, and the distribution state of the seepage field around the tunnel was ultimately determined.
Two methods, the water balance method and the underground runoff modulus method, were employed to predict the water inflow of the tunnel. The results were compared with the long-term observation results of the tunnel water inflow, indicating that the prediction accuracy of the underground runoff modulus method was higher than that of the water balance method. Therefore, the underground runoff modulus method can be utilized to predict the water inflow of water-rich karst tunnels in the future.
Using the distribution equation of the seepage field around the tunnel and the water inflow data predicted by the surface runoff modulus method, the groundwater distribution state ahead of the tunnel face was successfully predicted using software. This prediction included a larger karst area, which can provide valuable reference and guidance for the construction of other water-rich karst tunnels in the region.
The incidents of water inflow in karst tunnels were collected, and terrain, landform, and rainfall intensity were selected as input layer indicators. Based on the SVR model, the risk level of water inflow in karst tunnels was predicted. The average absolute error percentage in testing was 0.0867, indicating that the SVR model performed well in predicting the risk level of water inflow in tunnels and can be used for similar water inflow risk level predictions.
In the future, it will be possible to utilize the distribution status of groundwater and the SVR method to successfully predict the large karstic area in front of the tunnel face.

Supplementary Materials

The following supporting information can be downloaded at: https://www.mdpi.com/article/10.3390/su151310638/s1.

Author Contributions

Methodology, X.Z.; Formal analysis, X.Z.; Investigation, D.F.; Data curation, M.W.; Writing—original draft, X.Z.; Writing—review & editing, J.W.; Supervision, J.W. All authors have read and agreed to the published version of the manuscript.

Funding

This research was funded by Science and Technology Project of Hebei Education Department (grant number QN2021128), Key Laboratory of Large Structure Health Monitoring and Control, Shijiazhuang (grant number KLLSHMC2113).

Data Availability Statement

The Supplementary Materials include all data.

Acknowledgments

The authors would like to extend their sincere appreciation to the Science and Technology Project of the Hebei Education Department (Grant Number: QN2021128) and Key Laboratory of Large Structure Health Monitoring and Control, Shijiazhuang, 050043 (Grant Number: KLLSHMC2113).

Conflicts of Interest

The authors declare no conflict of interest.

References

  1. Qian, Q.H. Urban sustainable development and underground space development benefits. Undergr. Space 1998, 18, 69–74. [Google Scholar]
  2. Shi, W.; Li, J.H.; Wang, W.; Wang, C.M. Analysis of the impact of underground space on the groundwater environment and its controlling factors. Chin. J. Undergr. Space Eng. 2022, 18, 893–902+909. [Google Scholar]
  3. Lei, S.X.; Shen, Y.J.; Xiao, Q.H.; Xi, J.M.; Gu, L.J. Status quo and future development concept of urban underground space development and utilization. Chin. J. Undergr. Space Eng. 2019, 15, 965–979. [Google Scholar]
  4. Xie, H.P.; Gao, M.Z.; Zhang, R.; Xu, H.; Wang, Y.; Deng, J. Concept and key technologies of underground ecological city and deep ecology circle strategy. Chin. J. Rock Mech. Eng. 2017, 36, 1301–1313. [Google Scholar]
  5. Editorial Department of China Journal of Highway. Overview of academic research on China’s tunnel engineering in 2022. China J. Highw. 2022, 35, 1–40. [Google Scholar]
  6. Shen, Y.; Zhong, H.W.; Li, L.; Zheng, H.B.; Shi, L.; Li, X.J. Data fusion analysis method and case study of tunnel engineering based on iS3 platform. China Civ. Eng. J. 2022, 55, 103–109+148. [Google Scholar]
  7. Li, Z.R. Application status and analysis of building information modeling technology in tunnel engineering. J. Disaster Prev. Mitig. Eng. 2023, 43, 192. [Google Scholar]
  8. Gao, P. Retrospect of tunnel and underground engineering hotspots in 2018. Sci. Technol. Rev. 2019, 37, 186–195. [Google Scholar]
  9. Fu, H.L.; An, P.T.; Wu, Y.M.; Cheng, G.W. Analysis of sudden water in tunnel considering drainage system. J. Railw. Sci. Eng. 2022, 19, 3335–3342. [Google Scholar]
  10. Fu, H.L.; An, P.T.; Cheng, G.W.; Li, J.; Chen, L.; Yu, X.H. Study on the influence of the spatial position relationship between fault and parallel tunnel on the water influx. J. Railw. Sci. Eng. 2022, 19, 1032–1040. [Google Scholar]
  11. Shi, B.B. Calculation software development and application of water influx in Yueling tunnel. J. Railw. Eng. Soc. 2018, 12, 41–45. [Google Scholar]
  12. Zhou, W.Y.; Yang, Y.Y. Damage and fracture model of jointed rock mass and its validation. Chin. J. Rock Mech. Eng. 1991, 9, 43–54. [Google Scholar]
  13. Huang, T. Study on the coupled effect of seepage-stress-temperature of fractured rock mass. Chin. J. Rock Mech. Eng. 2002, 21, 77–82. [Google Scholar]
  14. Pei, X.H. Study on the Reasonable Permeability of Water-Permeable Lining in Unpressurized Tunnel. Master’s Theses, Northwest A&F University, Xi’an, China, 2013. [Google Scholar]
  15. Ren, S.L. Analysis of the evolution of seepage flow and the influence of parameters in the excavation of a four-line seafront tunnel. J. Railw. Sci. Eng. 2022, 19, 1985–1996. [Google Scholar]
  16. Zheng, L.; Chen, Z.Q.; He, C.; Ma, C.C.; Duan, C.R. Seepage field distribution and water inflow laws of tunnels in water-rich regions. J. Mt. Sci. 2022, 19, 591–605. [Google Scholar]
  17. Zheng, L.; He, C.; Chen, Z.Q.; Yang, S.; Ding, J.; Pen, Y. Study of seepage field distribution and its influence on urban tunnels in water-rich regions. Bull. Eng. Geol. Environ. 2019, 78, 4035–4045. [Google Scholar]
  18. Liu, G.Y. Analysis and comparison of water influx prediction methods in Yanshan tunnel. Railw. Constr. 2021, 61, 67–70. [Google Scholar]
  19. Zhou, W.J. Research on water influx prediction technology of Guanshan tunnel on Tianping line. Mod. Tunneling Technol. 2021, 58, 22–30. [Google Scholar]
  20. Wang, L.F.; Tang, N.; Mo, Q.; Ren, Q.Y. Prediction of water influx in tunnels in water-rich mountainous areas considering the effect of water-permeable interlayer. Sci. Technol. Eng. 2020, 20, 13865–13871. [Google Scholar]
  21. Shi, S.; Guo, W.; Li, S.; Xie, X.; Li, X.; Zhao, R.; Xue, Y.; Lu, J. Prediction of tunnel water inflow based on stochastic deterministic three-dimensional fracture network. Tunn. Undergr. Space Technol. 2023, 135, 104997. [Google Scholar] [CrossRef]
  22. Bai, Y.; Wu, Z.; Huang, T.; Peng, D. A Dynamic Modeling Approach to Predict Water Inflow during Karst Tunnel Excavation. Water 2022, 14, 2380. [Google Scholar] [CrossRef]
  23. Mahmoodzadeh, A.; Mohammadi, M.; Noori, K.; Khishe, M.; Ibrahim, H.H.; Ali, H.F.H.; Abdulhamid, S.N. Presenting the best prediction model of water inflow into drill and blast tunnels among several machine learning techniques. Autom. Constr. 2021, 127, 103719. [Google Scholar] [CrossRef]
  24. Chen, J.; Zhou, M.; Zhang, D.; Huang, H.; Zhang, F. Quantification of water inflow in rock tunnel faces via convolutional neural network approach. Autom. Constr. 2021, 123, 103526. [Google Scholar] [CrossRef]
  25. Chen, X. Study of the prediction method of water yield of the Liupan, mountain tunnel. Railw. Constr. Technol. 2020, 10, 37–41. [Google Scholar]
  26. Liu, X. Predicting tunnel groundwater inflow by geological investigation using horizontal directional drilling technology. Adv. Civ. Eng. 2022, 2022, 6578331. [Google Scholar] [CrossRef]
  27. Chen, C.; Lin, M. Groundwater Dynamics; Geological Publishing House: Beijing, China, 2011. [Google Scholar]
  28. Li, Z.J.; Lei, X.H.; Liao, W.H.; Yang, Q.; Cai, S.; Wang, X.; Wang, C.; Wang, J. Lake inflow simulation using the coupled water balance method and Xin’anjiang Model in an ungauged stream of Chaohu Lake Basin, China. Front. Earth Sci. 2021, 9, 615692. [Google Scholar] [CrossRef]
  29. Du, Y.; Zhu, H.; Li, M. Risk Assessment of Tunnel Mud and Water Inrush Based on AHP-Ideal Point Method. J. Highw. Transp. Res. Dev. 2022, 39, 100–107. [Google Scholar]
  30. Xu, Z.; Deng, H.; Lu, P.; Peng, L.T.; Wan, K.; Lei, P.B. Preliminary Exploration of Risk Assessment System for Water Inrush and Mud Inrush in Tunnel Karst Section. Water Resour. Hydropower Eng. 2018, 49, 127–134. [Google Scholar]
  31. China Railway Corporation. TB10017-2021 Code for Hydrological Survey and Design of Railway Engineering; China Railway Press: Beijing, China, 2021. [Google Scholar]
  32. Zi, X.Y. Study on risk assessment of water inrush disaster in tunnel in fault fracture zone. Highway 2021, 66, 410–416. [Google Scholar]
  33. Liang, Z.; Li, Y.; Hu, Y.; Li, B.; Wang, J. A data-driven SVR model for long-term runoff prediction and uncertainty analysis based on the Bayesian framework. Theor. Appl. Climatol. 2018, 133, 137–149. [Google Scholar] [CrossRef]
Figure 1. Calculation area of tunnel seepage field.
Sustainability 15 10638 g001
Figure 2. Calculation area after mapping.
Sustainability 15 10638 g002
Figure 3. Location of Sanquan tunnel.
Sustainability 15 10638 g003
Figure 4. Comparison between the predicted and the actual results of the two methods.
Sustainability 15 10638 g004
Figure 5. Underground water distribution figure in front of the tunnel portal at K7+000.
Sustainability 15 10638 g005
Figure 6. Tunnel onsite water inrush.
Sustainability 15 10638 g006
Figure 7. SVR model.
Sustainability 15 10638 g007
Figure 8. Karst tunnel water inrush risk indicator system.
Sustainability 15 10638 g008
Figure 9. SVR model prediction results.
Sustainability 15 10638 g009
Figure 10. Relative error of the SVR model.
Sustainability 15 10638 g010
Table 1. Engineering overview in the various areas of the tunnel.
PartitionTopographyRock FormationLithological CharactersKarst FeatureSurrounding Rock Grade
Three springsSurface dissolution depressions, karst lakes, stone buds, ditches, and sinkholes. Mainly karst caves and underground rivers.37~42°Mainly limestone, dolomite, and carbonate rock.Karst development, karst depression, funnel, falling water
cave, karst lake, and karst pipeline development.
The mouthThe surface is characterized by a small gully on the ‘mouth’, which is slow up and steep down.55°Mainly dolomite limestone.Karst is developed, and the surface is a karst trough.
Long BeachMainly for ‘Shangwan’ and ‘Maiyincao’ depressions.60°Mainly carbonate, dolomite.Karst depressions, funnels, and sinkholes.
ExitMainly steep slope short ditch, karst depression, and funnel with no development.58°Mainly limestone, dolomite.Karst is more developed, and individual sinkholes are distributed on the surface.
Table 2. Evaluation of groundwater recharge by water balance method.
PartitionMileageλArea (km2)Groundwater Recharge (m3/d)
SanquanK5+030–K5+8500.351.041121.13
KouziK5+850–K6+6000.150.50231.00
ChangtanK6+600–K7+0500.651.943883.92
ExportK7+050–K8+4760.331.011026.58
Table 3. Evaluation of groundwater recharge by underground runoff modulus method.
PartitionMileageM (L/(s·km2))Area (km2)Groundwater Recharge (m3/d)
SanquanK5+030–K5+85010.601.04952.47
KouziK5+850–K6+6003.100.50133.92
ChangtanK6+600–K7+05033.501.945615.14
ExportK7+050–K8+47623.301.012033.25
Table 4. Comparison of the prediction accuracy of two methods.
PartitionWater Balance Method (m3/d)Underground Runoff Modulus Method (m3/d)Actual Water Inflow (m3/d)Accuracy (%)
Sanquan1121.13952.47105393.5390.45
Kouzi231.00133.9215147.0288.69
Changtan3883.925615.14492678.8586.01
Table 5. Karst tunnel water inrush risk evaluation classification standards.
Classification
Topography
(valuation)
Weak karst development
75–100
Less karst development
50–75
Obvious karst development
25–50
Extremely strong karst development
0–25
Rock formation
(dip angle/°)
0–5°5–10°10–25°>25°
Karst feature
(valuation)
soluble rock <10%
75–100
Interbedded pure carbonates, interbedded impure carbonates
50–75
Homogeneous impure limestone, homogeneous impure carbonate
25–50
Homogeneous pure limestone, homogeneous pure dolomite, homogeneous pure carbonate
0–25
Surrounding rock gradeⅠ, Ⅱ
75–10050–7525–500–25
Unfavorable geology
(valuation)
Fissure
66.6–100
Fault
33.3–66.6
Karst cavity
0–33.3
Contact between a soluble rock and non-soluble rock
(valuation)
Weakly in favor of karst development
75–100
In favor of karst developmentModerately in favor of karst developmentStrongly in favor of karst development
50–7525–500–25
Groundwater richness
(valuation)
Drying up
66.6–100
Water-rich
33.3–66.6
High-pressure and water-rich
0–33.3
Rainfall intensity
(valuation)
No rainfallModerate rainHeavy rainRainstorm
75–10050–7525–500–25
Construction method
(valuation)
Reasonable
75–100
Seems reasonable
50–75
Illogicality
25–50
Extremely illogicality
0–25
Support measure
(valuation)
Reasonable
75–100
Seems reasonable
50–75
Illogicality
25–50
Extremely illogicality
0–25
Regulative measure
(valuation)
Reasonable
75–100
Seems reasonable
50–75
Illogicality
25–50
Extremely illogicality
0–25
Management power
(valuation)
Reasonable
75–100
Seems reasonable
50–75
Illogicality
25–50
Extremely illogicality
0–25
Table 6. Risk levels of water inrush in karst tunnels.
Risk Level
Water inflow (m3/d)>3000600–3000300–600<300
Table 7. Risk levels of water inrush in karst tunnels.
SanquanKouziChangtanExport
SVR predict level1.8163.8271.0912.292
BP predict level1.3993.5340.8252.535
Actual level2412
Disclaimer/Publisher’s Note: The statements, opinions and data contained in all publications are solely those of the individual author(s) and contributor(s) and not of MDPI and/or the editor(s). MDPI and/or the editor(s) disclaim responsibility for any injury to people or property resulting from any ideas, methods, instructions or products referred to in the content.

