Abstract
Rock burst is one of the most serious risks for underground coal mines, and the associated dynamic waves generally cause roof falls and large-scale shrinkage of the roadway. The roadway is often seriously damaged by duplicated rock bursts. Previous research on the propagation and attenuation of shock waves cannot explain well the failure mechanisms of the surrounding rock of the roadway under duplicated dynamic waves. To fill this research gap, this paper presents comprehensive research on the failure and fracturing process of roadways affected by repeated shock waves using field tests and numerical analysis. A numerical model as per UDEC Trigon logic was developed and calibrated using mine earthquake shock waves, during which a user-defined FISH function was adopted to document the quantity characteristics of fractures (i.e., shear-slip and tension). The damage to the roof was assessed based on the quantity of fractures. At the same time, the simulation analysed the evolution trend of the failure zone of the roadway roof and the fracture development area, which agreed well with the field tests. According to the spread and extension characteristics of fractures in the surrounding rock under repeated shock waves, new support materials and schemes were proposed and applied at the mine site. The results show that the scheme has controlled the deformation of the roadway effectively and satisfied the safety and efficiency requirements of the mine.
1. Introduction
As the main basic energy source and raw chemical material, coal accounts for 62% of overall energy consumption in China [1,2], the production of which exceeded 3.5 billion tons per year [3]. As the progressive depletion of shallow coal resources continues, the mining depth of underground mines has gradually increased [4]. The average mining depth of most underground coal mines in central, east, and northeast China is greater than 800 m [5]. Attributed to high in situ stress, rock burst is becoming a common issue for these deep coal mines and has drawn much attention from both coal operators and government managers. In addition, roadways are influenced by multiple rock bursts during mining activities. Because about 85% of rock bursts occur in the roadway [6], how to maintain the integrity of the surrounding rocks during the full service life of the mine is a critical and hot topic.
Many studies have been carried out to investigate roadway damage caused by shock power waves. According to the Voussoir beam hypothesis, roof stress is periodic during working face recovery [7,8]. The excavation process causes dynamic disturbance of the rock surrounding the roadway, and breakage of the hard main roof is an important factor in the initial stage [9,10]. In fact, not all dynamic events will develop into rock bursts or result in roadway damage [11,12]. The relationship between rock burst and roadway damage is closely related to geological formations, roadway layout, and characteristics of horizontal stresses [13,14,15]. Various reasonable treatment techniques have been proposed and applied to reduce or eliminate the pressure applied to the roadway [16,17]. Nevertheless, the relationship between dynamic load disturbance and stress distribution in roadways with hard roofs and unique geological formations (e.g., faults) is still uncertain [18].
Different disturbance stresses, such as high/low and far/near field stresses, will lead to the occurrence of rock bursts. Correspondingly, rock bursts can be classified into nine types [19,20]. From the perspective of quantitative analysis of rock burst energy, the quantitative relationship between the roadway support system and rock burst energy can be systematically calculated, and a variety of support materials to reduce shock waves and absorb energy have been proposed [21,22,23]. A “strong-soft-strong” structural model was developed to guide the control of the surrounding rock. The strength, stress transfer, deformation, and energy dissipation characteristics of the structure were researched [24,25]. Fast Lagrangian Analysis of Continua in 3-Dimensions (FLAC3D) software is generally used to explore surrounding rock deformation and rock burst under different dynamic and static loads. The results show that the larger the dynamic load, the greater the increase in the deformation of the roadway under the same static loading conditions. Stress and energy criteria for rock burst damage of small internal structures used in the design of roadway supports have been derived [26,27,28]. The numerical simulation software CDEM is also used to simulate the morphology of roadway collapse, for which the crack angle, crack length, fracture distance, and spacing on the deformation of surrounding rock will affect the accuracy of the numerical results.
The aforementioned research looks at either macroscopic adjustments to the layout of the roadway or active pressure reduction to quantitatively analyse the shock waves. However, there is limited research considering the fact that the roadway is usually subjected to duplicated shock waves from initial excavation to ultimate damage. This paper thus focuses on the failure and fracture characteristics of the surrounding rocks of thick-roofed coal roadways. The UDEC Trigon model was adopted and validated by field case study. The development, extension, and failure of cracks within the surrounding rock were then investigated from a microscopic perspective. Finally, a suitable support solution was proposed for the mine’s recovery roadway.
2. Mining and Geological Conditions
2.1. General Description
As depicted in Figure 1a, the mine is located in the north western part of Xianyang City, Shaanxi Province at an altitude of 1170–1200 m. The No.4# coal seam was being extracted, the thickness of which varies from 12.8 to 27 m with an average value of 23 m. Considering its mining depth of 592 to 810 m, this mine is representative of deep underground coal mines. The distribution of the strata located near the working face is shown in Figure 1b, in which a thick layer of hard medium sandstone lies upon the coal seam. The recovery roadway shown in Figure 1d is 5.6 m wide and 3.7 m high, along which are 30 mm coal pillars. After extraction of the workface, the rock burst shock waves (Figure 1c) were recorded and strong ground pressure behavior featuring roof subsidence were observed.
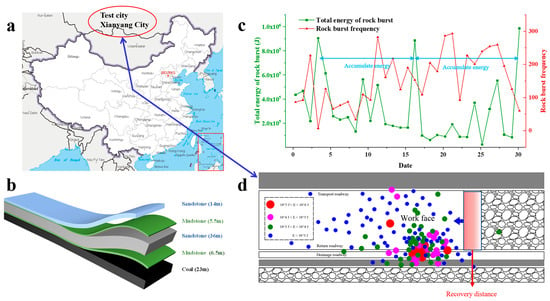
Figure 1.
Mine location and panel layout: (a) location of the test site; (b) rock formation at the test point; (c) microseismic monitoring statistics for a month of testing; (d) location of monitored microseismic activity.
2.2. Microseismic Monitoring and Roadway Deformation
To capture early warnings of rock bursts and identify the location and magnitude of rock burst energy, several microseismic and acoustic emission testing sensors (AE) were set up around the working face. Figure 1c shows the total number and energy of dynamic rock burst events occurring in one month and the energy release periodicity, which agrees well with the identified locations and energy levels shown in Figure 1d. The working face advances 90–96 m/month, and the high-energy release period of mine earthquakes was 45–55 m. Apparently, the transport roadway next to the goaf area was affected by these high-energy rock bursts several times during the recovery process.
As shown in Figure 2a, vertical exploration boreholes with a length of 9 m and a diameter of 30 mm were drilled along the center line of the roadway roof during the excavation and recovery processes. To reduce the side effects of coal extraction, the boreholes were set 50 m behind the excavation working face and 80 m in front of the recovery workings. YTJ20 borehole camera exploration equipment (Figure 2b) was applied, the observations of which are illustrated in Figure 3a. Multiple original joints and fractures in the shallow part (h ≤ 2.8 m) were observed, and the separation area of the rock formation was seen to be distributed around 3 m where the roadway roof was relatively complete. In contrast, a roof crack and fracture developed around a depth of 5~7.52 m, as can be seen in Figure 3b. Most importantly, the roof crack extends through to and appears as annular fractures at 2.8~4 m, and there are a large number of annular fractures and broken zones in the roof around 0~2 m.
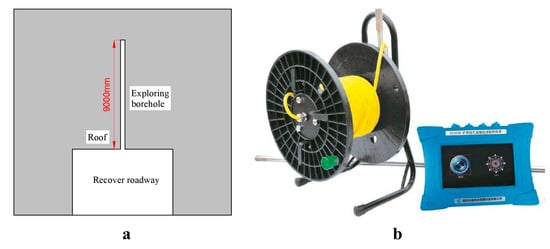
Figure 2.
Borehole monitoring (a) location and (b) observation equipment.
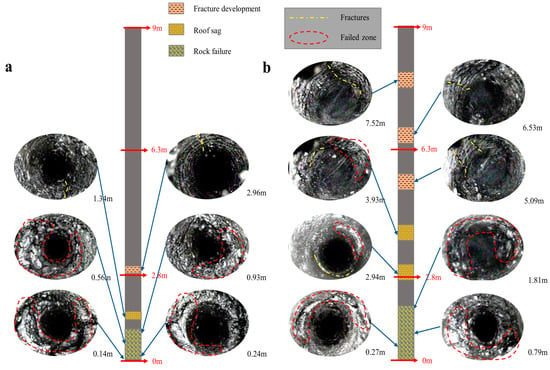
Figure 3.
Monitoring of roof boreholes during excavation and recovery: (a) during excavation; (b) during recovery.
3. Mechanism of Crack Propagation
In rock burst disasters, shock and vibration are important reasons for roadway damage. The effect of duplicated shock waves will accelerate the expansion of cracks. It is very important to study the crack propagation path. Under the action of shock wave and static load stress, the damaged area of the surrounding rock will continue to expand and the cracks continue to evolve. The damage propagation area is mainly at the original crack tip.
In polar coordinates, based on the criterion of maximum circumferential stress, it can be seen that axial tensile stress at the crack tip determines crack growth and also determines its direction. The stress field at the crack tip in polar coordinates is expressed as follows:
where is the radial stress at the tip of the crack, is the circumferential stress at the tip of the crack, is the tangential stress at the tip of a crack, and is the angle of axial direction of the crack. In polar coordinates, when the crack tip extends under external factors, the following equation is satisfied:
where KⅠ and KⅡ represent the intensity factors of mode I and II critical stress, the angle of crack propagation, and represents the maximum circumferential stress of crack propagation in growth direction. When cracks propagate and extend, the following equation is satisfied:
where KIc is the intensity factor of pure mode I critical stress, that is, the fracture toughness of the crack propagation.
According to the criterion of maximum energy release rate, the energy release rate at the crack tip determines the crack propagation direction:
When is satisfied in the equation then , so the maximum circumferential stress in the crack growth direction is consistent with the criterion of maximum energy release rate. The critical condition for obtaining the energy release rate is:
The kinetic energy released at the crack tip is the key to crack propagation and extension. Under dynamic load, the energy release rate at the crack tip is negatively correlated with the crack growth rate. When the energy release rate G is greater than the crack growth resistance (), the crack continues to extend until the speed approaches 0 and the crack stops. The kinetic energy released can be expressed as:
where is the critical size of crack propagation, is the crack displacement, and is the kinetic energy released.
4. UDEC Discrete Element Model
4.1. UDEC Trigon Simulation Method
Universal Distinct Element Code (UDEC) was adopted in the present research to analyse fracture extension and damage. In the UDEC Trigon method, each microelement block is defined as an elastic block. These elastic blocks do not fail under the action of external forces. Contact between the microelement blocks is established, and these Trigon microelement block contacts often fail with rock mass failure. Failure takes the form of tensile fractures along the contact and shear-slip fractures vertical to the contact. Therefore, statistical analysis of and monitoring the trends in these two types of contact fracture during rock deformation can determine the main forms of damage to the roadway surroundings. Rock failure can be captured by FISH language functions, if the monitoring of microcracks is required.
4.2. Setting Up Numerical Model
In order to simulate the roadway damage and fracture spread, a UDEC Trigon model was used to divide the surrounding rocks into small microelement blocks. Figure 4a shows the 2D numerical simulation model measuring 81 m height × 160 m width. Due to the randomness of fractures, a random triangular block is built around the roadway using the Trigon model, as shown in Figure 4b. Different fracture sizes are established at different locations along the roadway to increase the effect of the numerical simulation. The size of the triangular block in the shallow surrounding rock area is 0.3 m and in the deeper part is 0.5 m. In order to reduce the calculation, rectangular blocks of more than 1 m are used for the rock mass far away from the roadway. In the static test, the model boundary between the bottom and both sides is fixed; in the dynamic test, a dynamic boundary is used to eliminate stress reflection. The maximum horizontal stress, minimum horizontal stress, and vertical stress (, , and , respectively) are added to the model boundary according to the in situ stress measured in parallel and perpendicular to the development of the roadway. A gradient vertical stress of 13.16 MPa is applied on the upper boundary of the model.
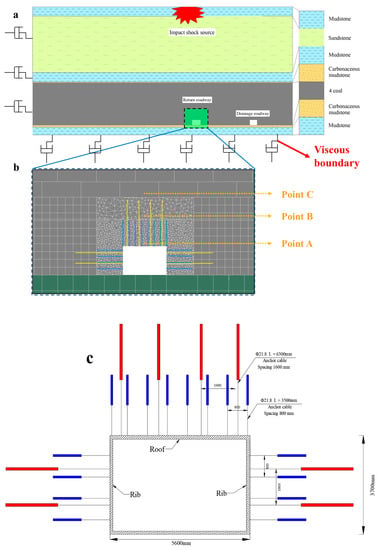
Figure 4.
Roadway support parameters and grading support schematic: (a) global characteristics; (b) local details; (c) original support scheme.
Before the infrastructure was designed, the mine was drilled down from the surface to extract the rock core. Standard test rocks were produced by drilling cores and associated mechanical tests were carried out. Numerical simulations were conducted using the Mohr–Coulomb theory model. The mechanical parameters of the material continued to be calculated for the model using the test results at the time and through the software’s transforming relationships, as shown in Table 1. All physical and mechanical parameters are from the mine field tests.

Table 1.
Characteristics of the mechanical parameters of the mine rock mass.
4.3. Theoretical Calculation of Critical Input Parameters
The accurate calculation of the energy of each monitoring point during the propagation of shock waves is very difficult. The following equation between mine earthquake energy and rank in the event of a mine earthquake was adopted as the theoretical foundation [23]:
where E0 is the dynamic energy of the rock burst shock source and is the Richter magnitude scale.
During the field investigation, a total of four high-energy mine earthquakes in the roadway roof were counted in which the energy magnitude was around with an average energy magnitude of about . Thus, the value of is equal to 1.865 μm.
The peak velocity of the mass movement of the surrounding roadway rock can be evaluated using the following equation [29]:
where R is the distance between rock burst source and monitoring point, the source of the rock burst is a circle of 1 m radius, so , and is the maximum speed at shock vibration source ().
To simplify the calculation, the shock wave at source is set as a sine wave with the waveform function:
where f is the frequency of the shock wave (100 Hz) and is the initial phase angle (0°). A total of four shock waves were applied to the numerically calculated model. The source of the earthquake was located at the model boundary 71.3 m above the roof of the recovery roadway.
The normal and shear stiffness of contacts, Kn and Ks, respectively, were calculated using Equation (4), where K and G are the bulk and shear modulus of the blocks, respectively; ΔZmin is the smallest width of the zone adjoining the contact in the normal direction; n is a multiplication factor (usually set to 10); and m is a multiplication factor (usually set to 0.4).
It is assumed that there is no cohesion, tensile strength, or residual friction angle for failed contacts when the residual version of the Coulomb model was used to simulate joints.
4.4. Calibration of Numerical Model
The same “excavation—stabilisation—recovery” excavation technique and route as the coal mine was used to numerically simulate the stabilisation and recovery periods of the roadway. Low-energy rock bursts were frequent in the ribs during roadway excavation, but there were no high-energy earthquakes. Figure 5a,b show the deformation of the rock surrounding the roadway under field investigation and in the numerical simulation with the shrinkage of roof to floor and between the ribs controlled to within 140 mm. During the recovery of the working face, the roof to floor and two ribs of the roadway were significantly deformed by the high frequency and high energy of the far-field earthquakes. Figure 5c–h show the shrinkage deformation of the roadway under field investigation and in the numerical simulation. Under the influence of the original rock stress and shock wave vibration, the deformation of the roadway is severe: the roof and floor move by 958 mm and the sides by 639 mm. However, the deformation in other roadway sections was far lower than this value. The steel beam of the roadway was violently bent and broken. Due to the requirements of coal mine safety, the floor heave was quickly resolved.
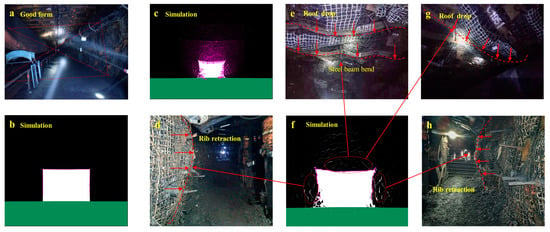
Figure 5.
Comparison between numerical simulation and field results: (a,b) during excavation; (c–h) during recovery.
5. Results and Discussion
5.1. Fracture Characteristics
The crack distribution and fracture characteristics in the rock around the roadway subjected to different earthquake cycles are shown in Figure 6. It can be seen that multiple cracks developed in the surrounding rock within 3.5 m of the roadway roof when the first mine earthquake occurred. During this period, fracture penetration damage is mainly in the form of shear-slip damage (Figure 6a). After the second earthquake, the layer separation of the roof expanded to 4.2 m, all surrounding rock within 3.5 m failed, and the fracture zone extended to 6.3 m above the roof of the recovery roadway (Figure 6b). After the third earthquake, the fracture penetration was damaged at the 6.3 m height range, and the crack area expanded to 9 m above the roof (Figure 6c). When the fourth mine earthquake occurred, the roof failure area reached 8.3 m and cracks extended to 12 m (Figure 6d).
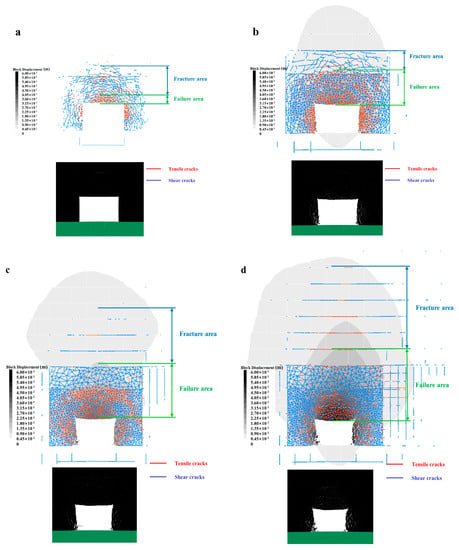
Figure 6.
Fracture patterns and tensile and shear microfractures in four mining earthquakes: (a) after the first earthquake; (b) after the second; (c) after the third; (d) after the fourth.
5.2. Progressive Development of Cracks
It has been well noted that cracks in the surrounding rock will extend progressively after the excavation of a roadway. To monitor the damage and fracture extension of surrounding rock subjected to the combined effect of mining stress and shock waves, a FISH function was developed. Usually, intact rock will continue to collect microfractures in the initial stages, and these fractures will interconnect with each other, eventually producing plastic failure of the rock mass. Figure 7 shows the number of fractures and displacements in the rock surrounding the roadway after the rock burst. It can be classified into different stages as per the time course of the shock waves. In stage Ⅰ, the development of fractures was relatively slow and only limited deformation of the roadway was observed. In stage II, the number of shear-slip fractures rose rapidly, reaching a peak of 1841, while the number of tensile fractures rose briefly to a peak of 127 and then fell rapidly. Although the process stabilised eventually, the speed of roof subsidence exhibited an increase. During stage III, the number of shear-slip fractures in the surrounding rock decreased rapidly and significantly by 47.70%, while the number of tensile fractures continued to fluctuate and then stabilise. Meanwhile, the amount of roof subsidence also increased significantly. Note that the number of shear-slip fractures decreased slowly and tensile fractures were almost unchanged during stage Ⅳ. However, the roadway was rapidly closed due to the total failure of the surrounding rock.
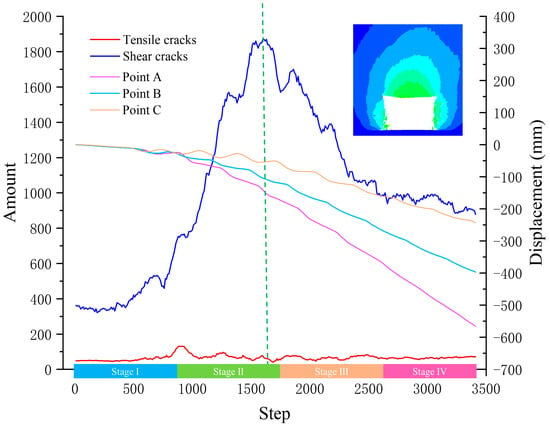
Figure 7.
Number of fractures and roof subsidence trends during the four mine earthquakes.
Figure 8 shows the change in roadway roof height after shock dynamic loading in the failure and fracture areas. The height of the failure zone changed little after the first mine earthquake occurred and rose rapidly thereafter. This observation is essentially the same as the characteristics shown in Figure 7. The four earthquakes contributed to the continuous rise in height of the fracture area. Note that the failure zone of the roadway roof was 8.2 m, which exceeded the effective support zone of the 6.3 m anchor cable being used.
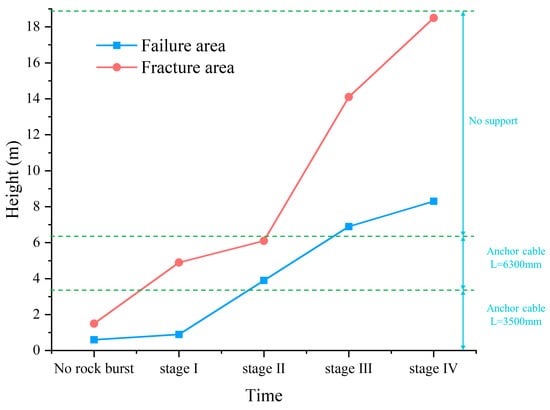
Figure 8.
The height of damage and fracture zone evolutionary characteristics.
6. Case Study
6.1. Modified Support Systems
Based on the damage characteristics of the surrounding rock, the following technical measures were proposed: (1) the combination of high-strength and high-preload bolts and anchor cables to form a stable structure for the surrounding rock to prevent damage to the shallow rock strata and separation of deep rock strata; (2) anchor cables with a 8.2 m free segment were recommended; and (3) effective energy-absorbing devices are required to prevent dynamic damage to the anchor cables. As per these points, the roadway support scheme was optimised and modified.
As shown in Figure 9, high-strength and high-preload left-handed deformed steel bolts with a diameter of 22 mm and length of 2800 mm were used, the spacing of the bolts set to 900 mm × 800 mm. The original 19 steel anchor cables with a diameter of 21.8 mm and length of 6300 mm were used, and new steel anchor cables with a diameter of 21.8 mm and length of 9300 mm were set to strengthen the scheme’s deep anchoring and enhance the suspension effect on the shallow surrounding rock. The spacing of these deep anchoring steel cables in the roadway was set at 2000 mm × 1600 mm with three cables per row. In shock wave failure, the deformation control on both sides of the roadway was relatively ideal. Shallow and combined support techniques were selected for the two sides with 6300 mm anchor cables also used for support to stabilise the rock walls. The spacing of these cables was set at 1100 mm × 1600 mm All of the anchor cables were connected in series with an energy absorption device to absorb impact energy, as shown in Figure 9b–d.
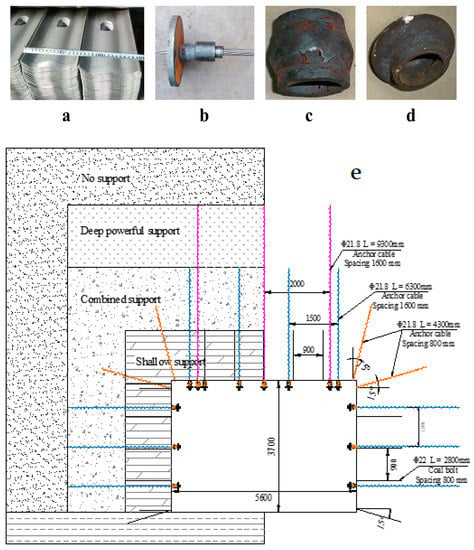
Figure 9.
Types of equipment and rock bolt components: (a) M4 steel band; (b) energy absorbing anchor cable; (c) energy absorbing device; (d) energy absorption effect; (e) roadway support scheme.
6.2. Field Monitoring
The deformation characteristics of the recovery roadway with the above optimised support system are shown in Figure 10, from which it can be seen that the surrounding rock was controlled effectively. It is clear that mine earthquakes and front abutment pressure affected the area within 110 m of the working face. Most importantly, roof-to-floor convergence reached 771 mm and rib-to-rib contraction reached 489 mm, representing respective reductions of 48.90% and 44.24% following the implementation of these support measures. The results demonstrate the effectiveness of the optimised support system in controlling the deformation of the surrounding rock.
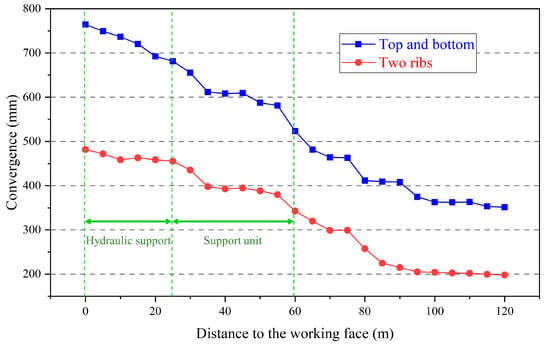
Figure 10.
Convergences measured in the recovery roadway using optimal support measures.
7. Conclusions
- (1)
- Fracture penetration and damage to the shallow surrounding rocks were the main causes of damage to the roadway roof, as shown by the results from the borehole camera.
- (2)
- Shear cracks played a dominant role in the roadway failure, propagating from the shallow to deep support areas. The failure areas in the roof of the roadway reached a height of 8.2 m.
- (3)
- The combination of elongated high-strength bolts and energy-absorbing anchor cables is required to control shallow fracture zones and prevent bed separation from the surrounding rocks. After the implementation of these support measures, contraction of roof and wall monitoring points decreased by 48.90% and 44.24%, respectively, as verified by field investigation.
Note that the initial fractures were not explicitly represented in the UDEC model, and the Trigon method does not consider the heterogeneity of surrounding rock in practice. In-depth research on this topic will be carried out in the future.
Author Contributions
S.Z. conceived the research and wrote the original draft. M.G. revised and reviewed the manuscript. D.X. and X.Y. was responsible for data curation. H.Z. translated and modified the paper. All authors have read and agreed to the published version of the manuscript.
Funding
This research was funded by the National Natural Science Foundation of China (51564044). The authors thank Hujiahe Coal Mine for their support during the field tests.
Institutional Review Board Statement
Not applicable.
Informed Consent Statement
Not applicable.
Data Availability Statement
The data used to support the findings of this study are available from the corresponding author upon request.
Conflicts of Interest
The authors declare no potential conflict of interest with respect to the research, authorship, and/or publication of this article.
References
- Cai, W.; Bai, X.; Si, G.; Cao, W.; Gong, S.; Dou, L. A Monitoring Investigation into Rock Burst Mechanism Based on the Coupled Theory of Static and Dynamic Stresses. Rock Mech. Rock Eng. 2020, 53, 5451–5471. [Google Scholar] [CrossRef]
- Cai, W.; Dou, L.; Si, G.; Hu, Y. Fault-Induced Coal Burst Mechanism under Mining-Induced Static and Dynamic Stresses. Engineering 2021, 7, 687–700. [Google Scholar] [CrossRef]
- Cao, A.; Jing, G.; Dou, L.; Wu, Y.; Zhang, C. Statistical analysis of distribution patterns of coal seams in fold zones in Northwest China. Int. J. Min. Sci. Technol. 2018, 28, 819–828. [Google Scholar] [CrossRef]
- Cao, S.; Qian, M.; Miao, X. Relationship between Support and Surrounding Rock and Support’s Working Resistance in Longwall Top-Coal Caving Face. In Mining Science and Technology; Wang, Y.H., Ge, S.R., Guo, G.L., Eds.; Balkema Publishers: Leiden, The Netherlands, 2004; pp. 101–105. [Google Scholar] [CrossRef]
- Chen, D.; Wang, E.-Y.; Li, N. Rupture process assessment of rock bursts in a coal mine: Inversion of source parameters and the slip distribution on the rupture surface. Eng. Fail. Anal. 2021, 130, 105741. [Google Scholar] [CrossRef]
- Chen, X.; Li, L.; Wang, L.; Qi, L. The current situation and prevention and control countermeasures for typical dynamic disasters in kilometer-deep mines in China. Saf. Sci. 2019, 115, 229–236. [Google Scholar] [CrossRef]
- Chen, Y.; Zhang, J.; Zhang, J.; Xu, B.; Zhang, L.; Li, W. Rockburst Precursors and the Dynamic Failure Mechanism of the Deep Tunnel: A Review. Energies 2021, 14, 7548. [Google Scholar] [CrossRef]
- Dai, L.; Pan, Y.; Li, Z.; Wang, A.; Xiao, Y.; Liu, F.; Shi, T.; Zheng, W. Quantitative mechanism of roadway rockbursts in deep extra-thick coal seams: Theory and case histories. Tunn. Undergr. Space Technol. 2021, 111, 103861. [Google Scholar] [CrossRef]
- Fukun, X.; Men, X.; Dun, L. The Analysis of Stability of Surrounding Rock in Deep Mine Tunnel. In Proceedings of the 3rd International Symposium on Modern Mining & Safety Technology Proceedings, Fuxin, China, 4–6 August 2008; pp. 127–130. Available online: https://www.webofscience.com/wos/alldb/full-record/WOS:000259359900025 (accessed on 11 June 2022).
- Gao, M.; He, Y.; Xu, D.; Yu, X. A New Theoretical Model of Rock Burst-Prone Roadway Support and Its Application. Geofluids 2021, 2021, 5549875. [Google Scholar] [CrossRef]
- Gao, M.; Zhao, H.; Zhao, Y.; Gao, X.; Wang, X. Investigation on the Vibration Effect of Shock Wave in Rock Burst by In Situ Microseismic Monitoring. Shock Vib. 2018, 2018, 8517806. [Google Scholar] [CrossRef]
- Gao, M.; Zhao, Y.; Chen, X.; Lu, Q.; Liu, A. Destruction Mechanism of Rock Burst in Mine Roadways and Their Prevention. Disaster Adv. 2013, 6, 34–43. [Google Scholar]
- Guo, W.; Cao, A.; Hu, Y.; Xue, C.; Liu, Y.; Lv, D. Stress distribution and rockburst characteristics of roadway group under the influence of fault and fold structures: A case study. Geomat. Nat. Hazards Risk 2022, 13, 736–761. [Google Scholar] [CrossRef]
- Han, S.; Chen, H.; Long, R.; Cui, X. Peak coal in China: A literature review. Resour. Conserv. Recycl. 2018, 129, 293–306. [Google Scholar] [CrossRef]
- He, J.; Dou, L.-M.; Cao, A.-Y.; Gong, S.-Y.; Lü, J.-W. Rock burst induced by roof breakage and its prevention. J. Cent. South Univ. 2012, 19, 1086–1091. [Google Scholar] [CrossRef]
- Jiang, L.; Kong, P.; Zhang, P.; Shu, J.; Wang, Q.; Chen, L.; Wu, Q. Dynamic Analysis of the Rock Burst Potential of a Longwall Panel Intersecting with a Fault. Rock Mech. Rock Eng. 2020, 53, 1737–1754. [Google Scholar] [CrossRef]
- Jiang, L.; Wu, Q.; Wu, Q.; Wang, P.; Xue, Y.; Kong, P.; Gong, B. Fracture failure analysis of hard and thick key layer and its dynamic response characteristics. Eng. Fail. Anal. 2019, 98, 118–130. [Google Scholar] [CrossRef]
- Kaiser, P.K.; Vasak, P.; Suorineni, F.T. Hazard Assessment in Burst-Prone Mines—Seismic Data Interpretation with 3D Virtual Reality Visualization. In Eurock 2005: Impact of Human Activity on the Geological Environment; Konecny, P., Ed.; Balkema Publishers: Leiden, The Netherlands, 2005; pp. 239–247. Available online: https://www.webofscience.com/wos/woscc/full-record/WOS:000269972000038 (accessed on 26 May 2022).
- Kong, P.; Yuan, A.; Liu, Y.; Li, Z. Study on fault slip dynamic response and rock burst potential under the influence of different horizontal stresses. Geomat. Nat. Hazards Risk 2022, 13, 1321–1341. [Google Scholar] [CrossRef]
- Li, Z.-L.; Dou, L.-M.; Cai, W.; Wang, G.-F.; Ding, Y.-L.; Kong, Y. Roadway Stagger Layout for Effective Control of Gob-Side Rock Bursts in the Longwall Mining of a Thick Coal Seam. Rock Mech. Rock Eng. 2016, 49, 621–629. [Google Scholar] [CrossRef]
- Ranjith, P.; Zhao, J.; Ju, M.; De Silva, R.V.; Rathnaweera, T.; Bandara, A.K. Opportunities and Challenges in Deep Mining: A Brief Review. Engineering 2017, 3, 546–551. [Google Scholar] [CrossRef]
- Wang, Q.; Li, R. Journey to burning half of global coal: Trajectory and drivers of China’s coal use. Renew. Sustain. Energy Rev. 2016, 58, 341–346. [Google Scholar] [CrossRef]
- Wang, Z.-Y.; Dou, L.-M.; Wang, G.-F. Mechanism Analysis of Roadway Rockbursts Induced by Dynamic Mining Loading and Its Application. Energies 2018, 11, 2313. [Google Scholar] [CrossRef]
- Xiao, F.; Xu, L.; Liu, G.; Hou, Z.; Xing, L. Numerical Simulation and Analysis of Tunnel Failure Mode by Stochastic Fracture Model. Math. Probl. Eng. 2021, 2021, 3759301. [Google Scholar] [CrossRef]
- Xiao, F.K.; Zhang, C.J.; Gao, L.W.; Yue, Y.Y. Numerical Research on the Floor Heave Control of Deep Roadway in Coal Mining. In Natural Resources and Sustainable Development II, Pts 1–4; Wu, J., Yang, J., Nakagoshi, N., Lu, X., Xu, H., Eds.; Trans Tech Publications Ltd.: Durnten, Germany, 2012; pp. 524–527+446. Available online: https://www.scientific.net/AMR.524-527.446 (accessed on 11 January 2022).
- Fang, X.; Qian, M. Mechanical Models of Support-Surrounding Rocks under Different Top Coal Conditions in Fully-Mechanized Top-Coal Caving Face. In Progress in Mining Science and Safety Technology, Pts A and B; Jing, G., Gao, J., Zhou, A., Gou, P., Eds.; Science Press: Beijing, China, 2007; pp. 67–73. Available online: https://www.webofscience.com/wos/woscc/full-record/WOS:000248332000012 (accessed on 13 December 2022).
- Xu, L.; Lu, K.; Pan, Y.; Qin, Z. Study on rock burst characteristics of coal mine roadway in China. Energy Sources Part A Recover. Util. Environ. Eff. 2022, 44, 3016–3035. [Google Scholar] [CrossRef]
- Zhang, F.; Wang, Y.B. China Coal Industry and Sustainable Development. Adv. Mater. Res. 2012, 512–515, 1568–1573. [Google Scholar] [CrossRef]
- Zhao, T.-B.; Guo, W.-Y.; Tan, Y.-L.; Yin, Y.-C.; Cai, L.-S.; Pan, J.-F. Case Studies of Rock Bursts Under Complicated Geological Conditions During Multi-Seam Mining at a Depth of 800 m. Rock Mech. Rock Eng. 2018, 51, 1539–1564. [Google Scholar] [CrossRef]
Disclaimer/Publisher’s Note: The statements, opinions and data contained in all publications are solely those of the individual author(s) and contributor(s) and not of MDPI and/or the editor(s). MDPI and/or the editor(s) disclaim responsibility for any injury to people or property resulting from any ideas, methods, instructions or products referred to in the content. |
© 2023 by the authors. Licensee MDPI, Basel, Switzerland. This article is an open access article distributed under the terms and conditions of the Creative Commons Attribution (CC BY) license (https://creativecommons.org/licenses/by/4.0/).