Article

Spatio-Temporal Evolution and Influencing Factors of the Resilience of Tourism Environmental Systems in the Yangtze River Economic Belt of China

1
College of Tourism and Culture Industry, Guizhou University, Guiyang 550025, China
2
Culture and Tourism Economic Quality Development Operation Center, Guizhou University, Guiyang 550025, China
*
Author to whom correspondence should be addressed.
Sustainability 2023, 15(13), 10527; https://doi.org/10.3390/su151310527
Submission received: 24 May 2023 / Revised: 29 June 2023 / Accepted: 2 July 2023 / Published: 4 July 2023

Abstract

:
The resilience of a tourism environmental system (TESR) is an important aspect of sustainable tourism growth. Based on the construction of an evaluation system for the TESR, this study used 126 prefecture-level cities in the Yangtze River Economic Belt (YREB) as a case study and attempted to explore the spatio-temporal evolution features and influencing mechanism of the TESR. The primary conclusions are as follows: (1) Despite significant improvement in TESR in the YREB, the overall resilience level and growth rate remain relatively low, with ample potential for improvement. (2) Positive spatial correlation and type agglomeration impact are evident in the urban TESR. (3) Relatively frequent transitions of the TESR occur with spatial dependence and spillover effects in the transition paths, i.e., high-level cities can improve the TESR of neighboring cities through positive spillover effects. (4) Several factors, such as city economic, social, industrial, and policy factors, jointly impact the evolution of the pattern of the TESR in the YREB, with heterogeneous effects.

1. Introduction

The urban tourism environment system, an essential constituent of urban complex systems, plays a fundamental role in promoting urban economic growth, driving cultural prosperity, and preserving ecological environments [1]. Nevertheless, the tourism industry is highly vulnerable and sensitive to sudden shocks or cumulative impacts [2,3,4], such as climate change, natural disasters, economic crises, and epidemics, posing a threat to the urban tourism environment system [1,5,6]. Thus, enhancing the resilience and resistance of the urban tourism environment system under these internal and external constraints is a significant challenge in the development of the urban tourism industry.
The concept of resilience, originating from engineering and physics, has broadened its application over time. Ecologist Holling introduced “resilience” to ecology and developed the idea of ecological resilience, which refers to the ability of an ecosystem to withstand shocks and maintain balance [7]. Adger applied resilience theory to sociology and defined social resilience as the ability of a community or group to cope with stresses or disruptions resulting from changes in the external environment [8]. Reggiani et al. applied resilience theory to the study of spatial heterogeneity displayed by different regions when facing external shocks or disturbances [9]. Resilience theory has evolved from focusing on equilibrium resilience to evolutionary resilience [10], which better reflects the dynamic process of system change [11,12].
The tourism sector’s vulnerability has been a constant source of concern, prompting a great deal of academic interest in its resilience [13,14]. Due to its high degree of interconnectedness and susceptibility to a wide range of factors such as political, social, economic, and ecological forces [15,16], research on tourism resilience has generally been focused on crisis or disaster events that can cause sudden shocks to the sector [17,18]. Events such as tsunamis [19], hurricanes [20], major floods [21], and the sudden onset of public health emergencies like COVID-19 have all had significant impacts on the tourism industry. Scholars have looked at different case studies to develop resilience construction strategies [22,23,24], while also proposing crisis management and resilience-building strategies for tourism from the perspectives of tourism enterprises, tourist destinations, and the sector as a whole [25,26,27,28,29,30]. Economic crises such as inflation [31,32,33] and political conflicts such as the “9.11 terrorist attack” [34,35] have also affected international tourist flows, causing losses in the tourism industry. To mitigate against the negative impact of future crises, scholars have primarily focused on how the industry can better recover and adapt from a theoretical perspective or through quantitative analysis of specific factors. The impact of sudden shocks on the tourism industry is rooted in social, economic, and environmental changes [36], with market forces, stakeholder cohesion, and leadership all forming the core elements of tourism industry resilience [37]. Additionally, the cooperation between tourism companies, organizations, and government departments is crucial in alleviating the impacts of crisis events [32,38], with strong intervention measures seen as an important response to the impact of pandemics like COVID-19 [39].
In addition to sudden shocks, attention has also begun to focus on the cumulative changes impacting the resilience of the tourism industry [37]. Zhang et al. delved into the cumulative change characteristics of China’s tourism industry’s economic resilience between 2000 and 2019, examining its resistance and recovery perspectives, and utilizing a geographic detector model to investigate the variables impacting the evolution of the Chinese tourism industry’s economic resilience [13]. Yang et al. simulated a causal relationship model of regional tourism resilience, focusing on 14 cities in Gansu Province as the research object, and revealed the mechanism for optimizing the resilience elements [1]. Qualitative research, such as semi-structured interviews [40] and questionnaire surveys [41], remains the primary approach to evaluating tourism resilience, with scholars measuring the resilience of the tourism economy through various quantitative methods using resilience models [4,42,43]. There are generally two ways to evaluate resilience: the first is to choose a core indicator to measure the size of resilience [13,37,38], and the second is to build an indicator system to comprehensively evaluate the strength of resilience [1,44,45,46]. Although there is no consensus on the selection of evaluation indicators, constructing an indicator system can better reflect the overall situation of a system’s resilience [1].
In summary, current research on tourism resilience emphasizes assessing tourism resilience under sudden shocks and pays relatively little attention to accumulative changes in tourism resilience. Furthermore, this research mostly centers on national, provincial, municipal, and community levels, with scant consideration for the basin level across administrative regions. Research content places greater emphasis on assessing tourism resilience rather than examining the spatio-temporal evolution and influencing mechanisms of tourism resilience. It is essential to evaluate the travel-related, economic, societal, and ecological resilience of tourism environmental system (TESR) in order to achieve sustainable tourism development [13]. Our study aims to answer three questions: how to evaluate the TESR, what the spatiotemporal distribution pattern of the TESR is, and what factors influence the TESR. Based on this, the research idea of this paper is as follows: firstly, to construct a resilience evaluation index system for the complex system of tourism’s economic, societal, and ecological environment based on the perspectives of resistance, adaptation, and recovery, and to comprehensively measure the level of the TESR in the YREB using multi-objective evaluation models and entropy methods. Secondly, our research idea is to use techniques, like spatial autocorrelation and spatial Markov chain (SMC), to look at the spatio-temporal properties and the evolution of the TESR. Finally, our idea is to use a geographical and temporal weighted regression model (GTWR) to identify the primary driving factors and their spatio-temporal heterogeneity in the evolution of the TESR.

2. Research Methods and Data Sources

2.1. Indicator System

The composite system of the urban tourism environment contains economic, social, and ecological subsystems. The TESR refers to the self-organizing process that adjusts and absorbs elements within the system when external disturbances or shocks occur [47]. It also involves the process of recovering from exogenous disturbances and seeking new ways to grow. This resilience encompasses the capacity of the urban tourism environment system to withstand stress, adapt to disturbance, and restore itself to its original state [47,48,49]. Thus, this study establishes an assessment index system for the TESR based on the three aspects of resistance, adaptability, and recovery from the economic, social, and ecological subsystems. The system considers the complexities of human-land relations in the YREB, as well as the risks and disturbances they encounter (Table 1).

2.2. Research Methodology

2.2.1. Multi-Objective Linear Weighting Model

This study employs the multi-objective linear weighting model to gauge the extent of the TESR by combining various evaluation index values into a comprehensive assessment value [55]. Below is the calculation formula for this model [55].
T E S R = i = 1 n W i X i
In this formula, W stands for the index’s weight and X for the index’s standardized value. It should be noted that the calculation formula of the standardized value of the index can be referred to in reference [51]. The entropy weight method can be used to determine the weight of the index [56], and the steps are as follows:
Step 1: The extreme value method is used to standardize each piece of data. For positive indicator:
x i j = x i j x j m i n / x j m a x x j m i n ,
while for negative indicator,
x i j = x j m a x x i j / x j m a x x j m i n .
Step 2: Determine the entropy of the indicator:
P i j = X i j / j = 1 n X i j
e i = k i = 1 n P i j l n P i j , k = 1 / l n n .
Step3: Calculate the weight of the indicator:
w i = d i / i = 1 m d i ,   d i = 1 e i ,
where X j m a x and X j m i n are, respectively, the minimum and maximum values of the indicator i in all years, e i is the entropy of the indicator i , and w i is the weight of indicator i .

2.2.2. Spatial Autocorrelation

The analysis of spatial autocorrelation has two subtypes: global and local. The former is employed to measure the extent of spatial clustering of the study item, while the latter is used to determine whether there is significant spatial clustering of high or low values. The degree of global spatial autocorrelation is typically assessed using the Moran’s I index, while the Local Moran’s I index is used to evaluate the degree of local spatial autocorrelation [57].
(1)
Global spatial autocorrelation. Global spatial autocorrelation is employed to ascertain the existence of noteworthy spatial correlation of the TESR in the YREB. The formula for global Moran’s I index is as follows:
I = i = 1 n i = 1 n w i j x i x ¯ x j x ¯ S 2 i = 1 n i = 1 n w i j
S 2 = i = 1 n x i x ¯ 2 n , x ¯ = i = 1 n x n ,
where n is the number of cities in the YREB, x i and x j are the respective TESR values for each city in the YREB on the corresponding spatial units, and w i j is the weight matrix for spatial proximity, obtained with the help of the Queen neighborhood method, using GeoDA 1.18 to measure the neighborhood of spatial objects.
(2)
Local spatial autocorrelation. Local indicators of spatial association (LISA) are commonly used to investigate the spatial location of agglomeration centers and determine the spatial clustering of elements with high or low values. The local Moran’s I is calculated by the formula:
I = X i X ¯ S 2 i = 1 n ( w i j ( X i X ¯ ) ) .

2.2.3. Spatial Markov Chain

The Markov transition matrix is a Markovian process with discrete time and state, revealing the transition of a spatial cell’s state from i type to j . The spatial Markov chain (SMC) is a method that combines the traditional Markov chain and “spatial lag”. The spatial Markov transition probability matrix is first divided into k × k conditional probability transition matrices M 1 , and M 2 , …   M k by partitioning the initial year’s spatial units into different types of spatial lag conditioned on k . These conditional probability transition matrices constitute the spatial Markov transition probability matrix. For the first k conditional matrix, the m i j k is the t year when in the k context of the type spatial lag, the spatial cell in that year belongs to i type and the next year shifts to j type: the one-step spatial transition probability. By comparing various conditional likelihoods, it is possible to analyze the chances of upward or downward movement between subdivision categories under distinct geographical background conditions [58]. It is also possible to analyze the effect of different geographical contexts on the transition of different spatial unit types [59]. Therefore, this method can be used to test the dynamic evolution process of the TESR in the YREB.
m 1,1 1 m 1 , k 1 m k , 1 1 m k , k 1 k × k m 1,1 k m 1 , k k m k , 1 k m k , k k k × k

2.2.4. Geographical and Temporal Weighted Regression

The GTWR model, which factors in temporal and spatial non-stationarity, offers a more comprehensive grasp of spatio-temporal dynamics in contrast to conventional econometric models. It enhances the comprehension of local parameters in the geospatial and temporal dimensions, therefore resulting in superior explanatory capabilities [60]. In this study, we utilized a GTWR model to explore the influence mechanism of the TESR in the YREB. The model is set as follows:
y 0 = α 0 η i ,   μ i , t i + k = 1 n α k η i ,   μ i , t i × X i k + ε i ,
where η i ,   μ i , t i are the spatio-temporal coordinates; η i ,   μ i represent the longitude and latitude, respectively, of the center of gravity of each study unit; k = 1 n α k η i ,   μ i , t i is the coefficient; α 0 η i ,   μ i , t i is the constant term; X i k is the explanatory variable; and ε i is the random perturbation term.

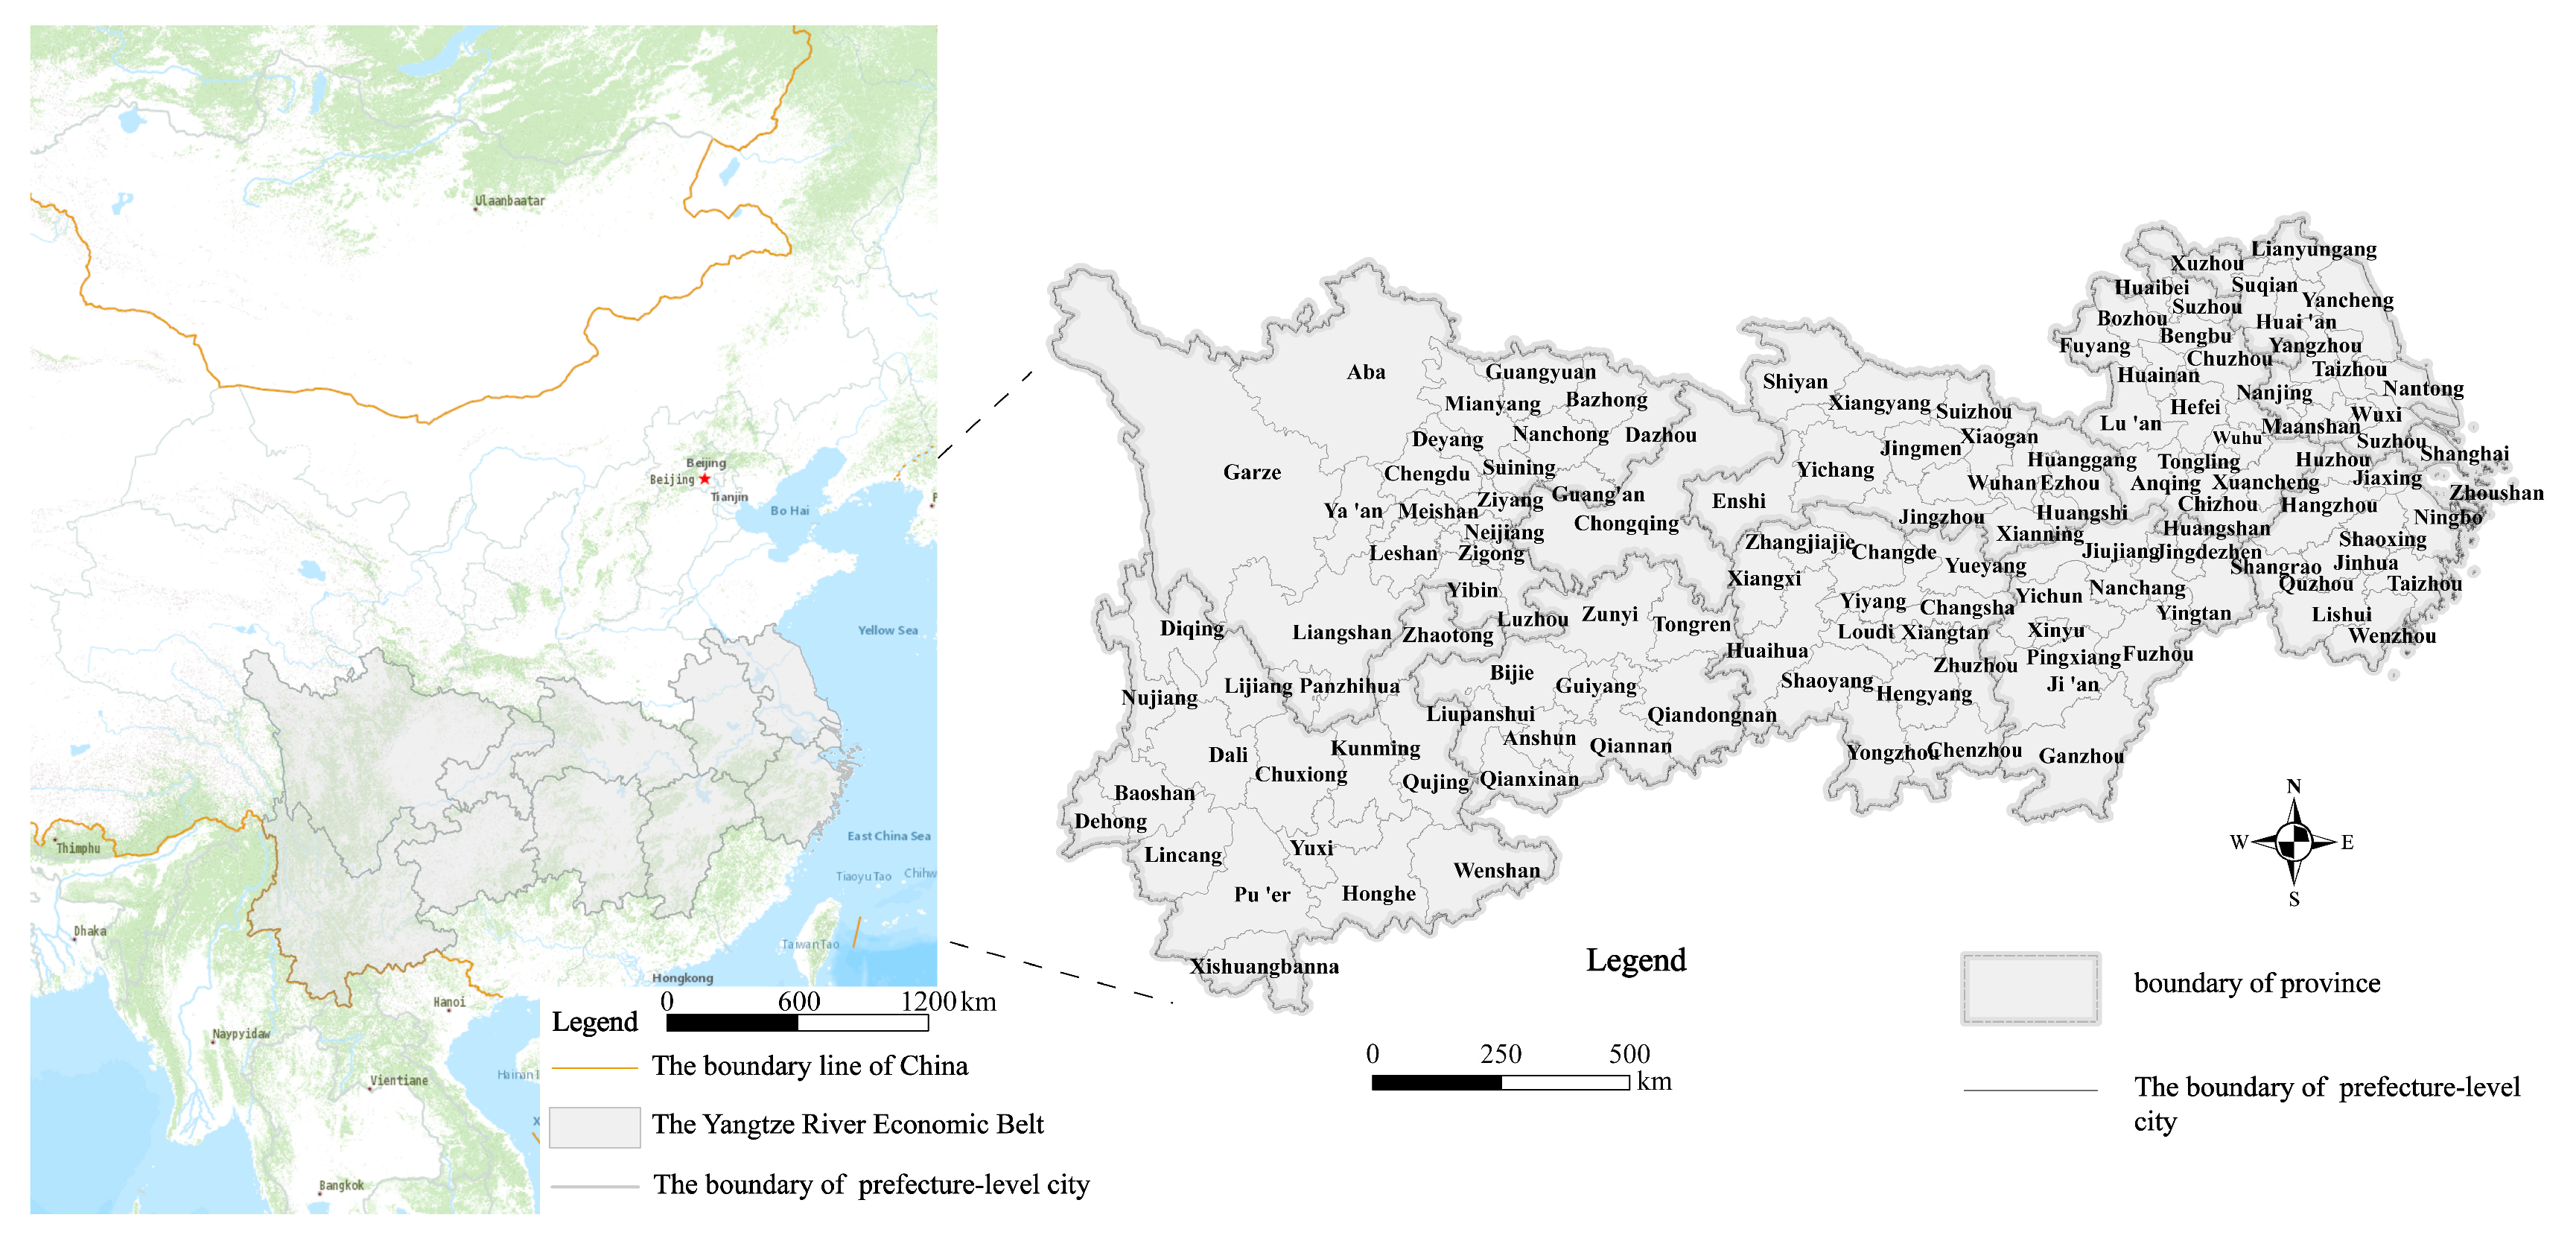
2.3. Case Site Overview

The YREB, which sprawls across 11 provinces, municipalities, and regions of China, encompasses an area of 2,052,300 km2 (Figure 1). It is recognized as the world’s largest basin economic belt, boasting the highest population, largest industrial scale, and most comprehensive urban system. As a result, the YREB has representative and universal value as a research area of the TESR. In 2007, the YREB boasted 1334 Class A scenic spots that welcomed a total of 24.33 million tourists and generated tourism revenue amounting to 96.88 million yuan. By 2013, the number of Class A scenic spots had surged to 2677, welcoming a total of 390 million tourists and generating tourism revenue amounting to 570 million yuan. In 2019, the YREB received a whopping 3.181 billion tourists, accounting for about 49.13% of the national total. However, the rapid tourism and socio-economic growth in the region have imposed immense pressure on the local tourism environmental system. As such, continued enhancement of the TESR is critical to ensure sustainable regional development.

2.4. Data Sources

In 2007, due to the rapid development of the tourism industry, environmental and tourism resources were under a certain pressure, which led to widespread concern about the TESR. In the same year, the Chinese government began to take measures to address environmental pressures. In 2020, the sudden outbreak of the COVID-19 pandemic caused a huge impact on the tourism industry. To eliminate errors in data measurement during the empirical process, and based on the principle of equal intervals between years, this article selected 2007, 2013, and 2019 as the time points. The research area included 126 cities at or above the prefecture level in the YREB, with the exclusion of Tianmen City, Qianjiang City, Xiantao City, and Shennongjia Forest District, which are directly governed by Hubei Province. The research data comes from the corresponding year’s “China Urban Statistical Yearbook”, “China Regional Economic Statistical Yearbook”, and various provincial and municipal statistical yearbooks. Regarding individual missing data, they were supplemented through the official websites of provincial and municipal governments and statistical bulletins on the national economy and social development of each city.

3. Spatial Patterns

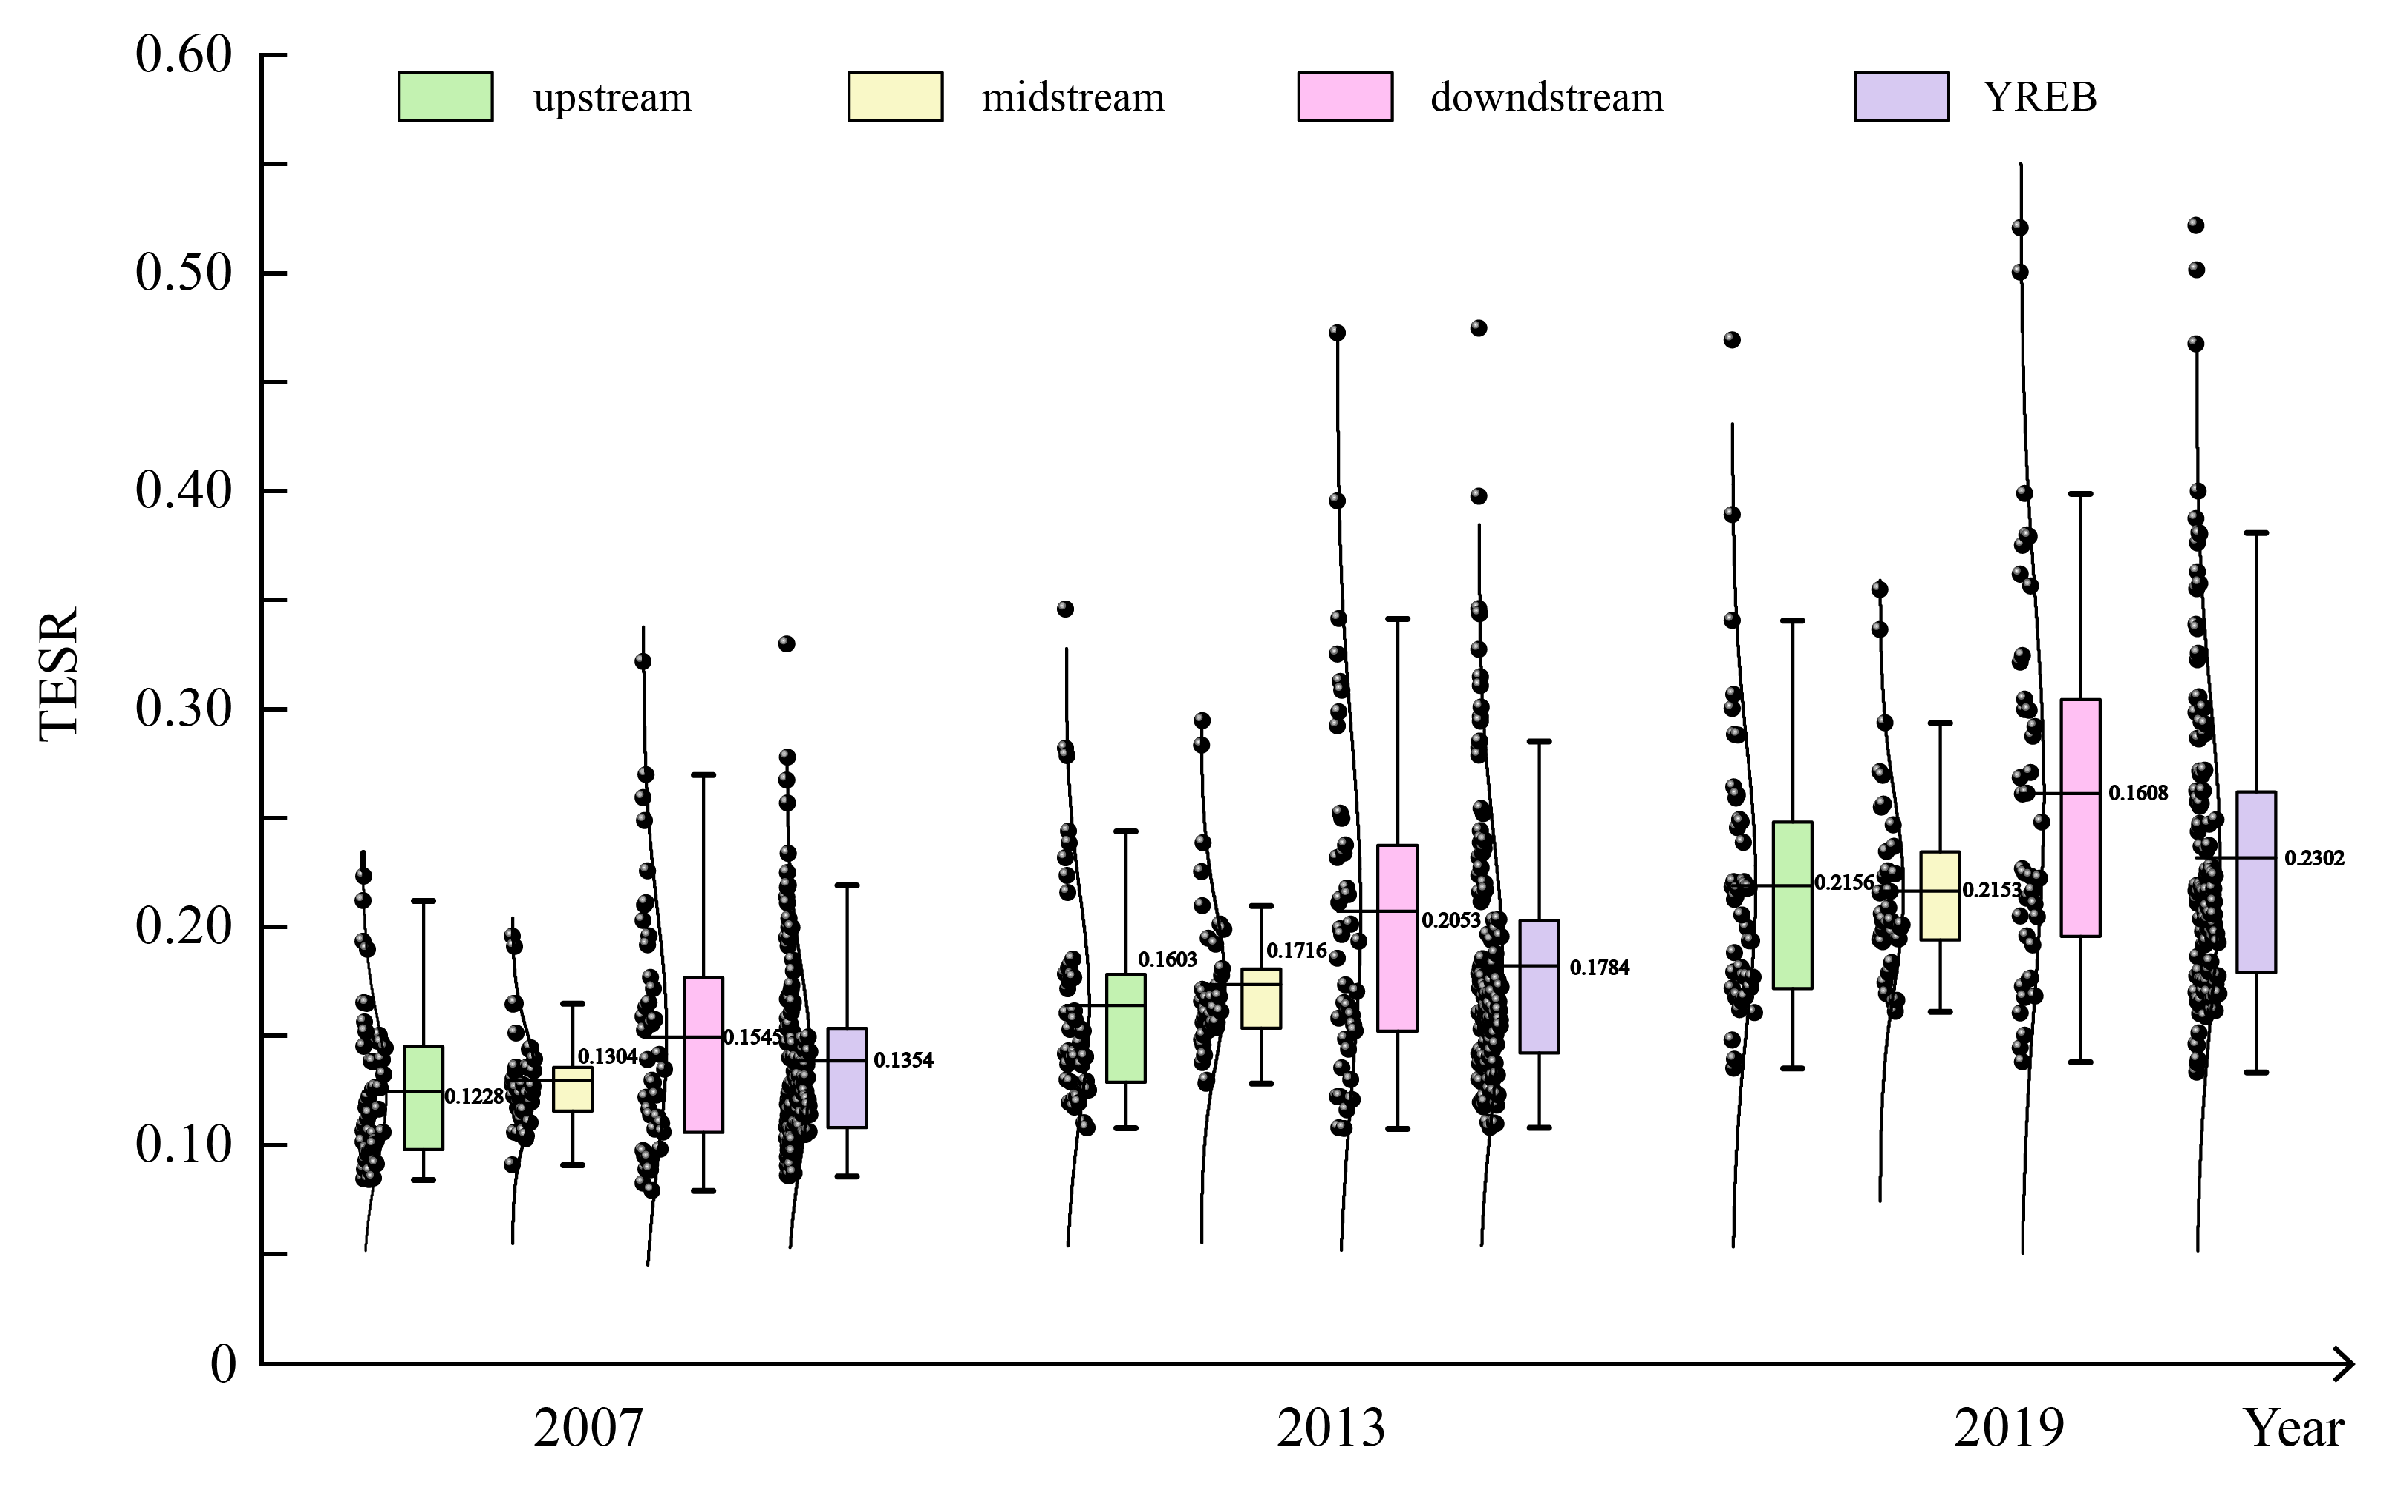
3.1. Temporal Evolution Characteristics

A multi-objective linear weighted model is used to measure the TESR in 2007, 2013, and 2019, as shown in Figure 2. Overall, the TESR in the YREB increased from 0.1354 to 0.2302, indicating a significant upward trend. However, the level of resilience remained relatively low. Over the study period, the TESR saw an increase of 70.015%, corresponding to a 5.835% annual growth rate. The low level and growth rate of the TESR in the YREB suggest that there is considerable room for improvement and development potential.
The mean TESR value varies by region in the YREB, with the upstream ranging between 0.1228 and 0.2155, and showing an average annual growth rate of 5.807%; the midstream ranges from 0.1304 to 0.2153, with an average annual growth rate of 5.008%; and the downstream ranges from 0.1545 to 0.2608, with an average annual growth rate of 5.293%. Generally, the TESR level in the YREB follows the trend of downstream > midstream > upstream. Moreover, the high growth rate in the upstream has enabled it to catch up with the midstream region’s TESR level in 2019.

3.2. Spatial Pattern Characteristics

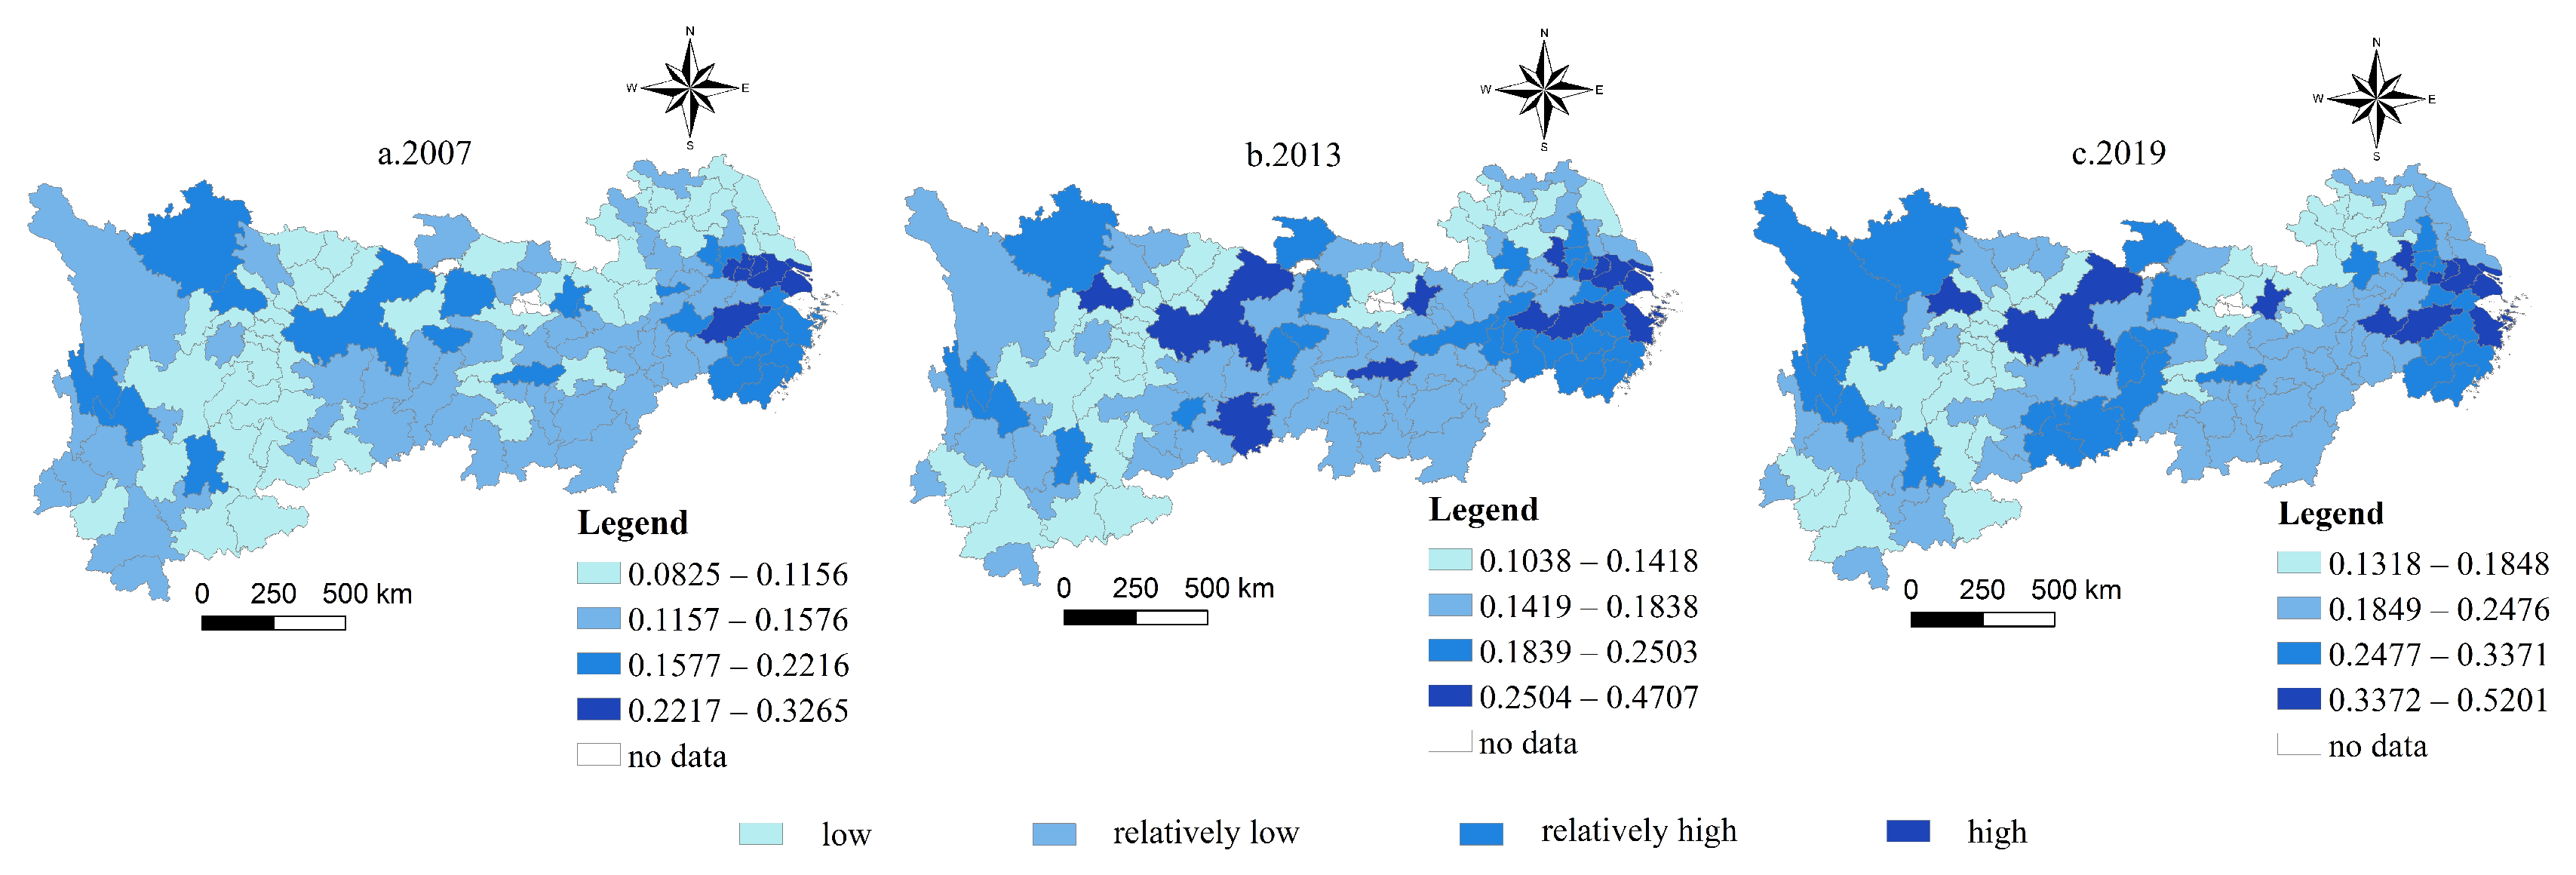
3.2.1. Spatial Distribution Characteristics

In this paper, the TESR index has been classified into four categories, namely high, relatively high, relatively low, and low, using the natural break method in the ArcGIS 10.2 software. The spatial distribution of the TESR in the YREB in 2007, 2013, and 2019 can be observed in Figure 3.
Based on Figure 3, there are noticeable disparities in the spatial distribution and regional balance of the TESR in the YREB. Broadly speaking, there is an observable spatial gradient decline from the Yangtze River Delta to the upstream of the Yangtze River, with a “layered” attribute. Specifically: (1) The TESR’s high-value region is mainly concentrated in the Yangtze River Delta urban cluster, including Shanghai, Hangzhou, Suzhou, Wuxi, and Changzhou, exhibiting a trend of aggregation distribution. In the meantime, regional tourism in central cities such as Chongqing, Chengdu, and Wuhan has also transitioned into the high-value area. (2) Initially, the relatively high TESR value region was rather scattered, primarily concentrated in regional tourism central cities or cities rich in tourism resources located in Zhejiang’s central and southern areas, such as northern Sichuan and northern Yunnan. Due to the regional tourism central cities’ “ripple effect” into the high-value area, the TESR of adjacent cities has improved significantly, resulting in a phenomenon of relatively high TESR levels clustering in some midstream areas. (3) The relatively low TESR value region is primarily focused on the midstream and gradually creates a contiguous cluster area with upstream and downstream. (4) The low-value TESR region is fundamentally located in the areas of northern Jiangsu, northern Anhui, the Wumeng Mountains region, and the Dian-Qian-Gui desertification area. Due to an overall trend of enhancement in the TESR, its spatial extent has kept on shrinking during the research period.
In general, the spatial distribution of the TESR in the YREB demonstrates a significant degree of path dependency. The TESR of the Yangtze River Delta city group and regional tourism central cities is at relatively higher levels. This mainly results from their developed tourism economy, strong tourism-related technological innovation capacity, supportive government policies emphasizing ecological civilization construction, and implementation of eco-friendly regulations. In contrast, regions such as northern Jiangsu, northern Anhui, the Wumeng Mountains area, and the Dian-Qian-Gui desertification area reveal weaker TESR because of the inadequate supply of tourist public services and infrastructure, lack of tourism-related economic development and technological innovation, and inadequate coordination between the development of tourism resources and preservation of the eco-environment.

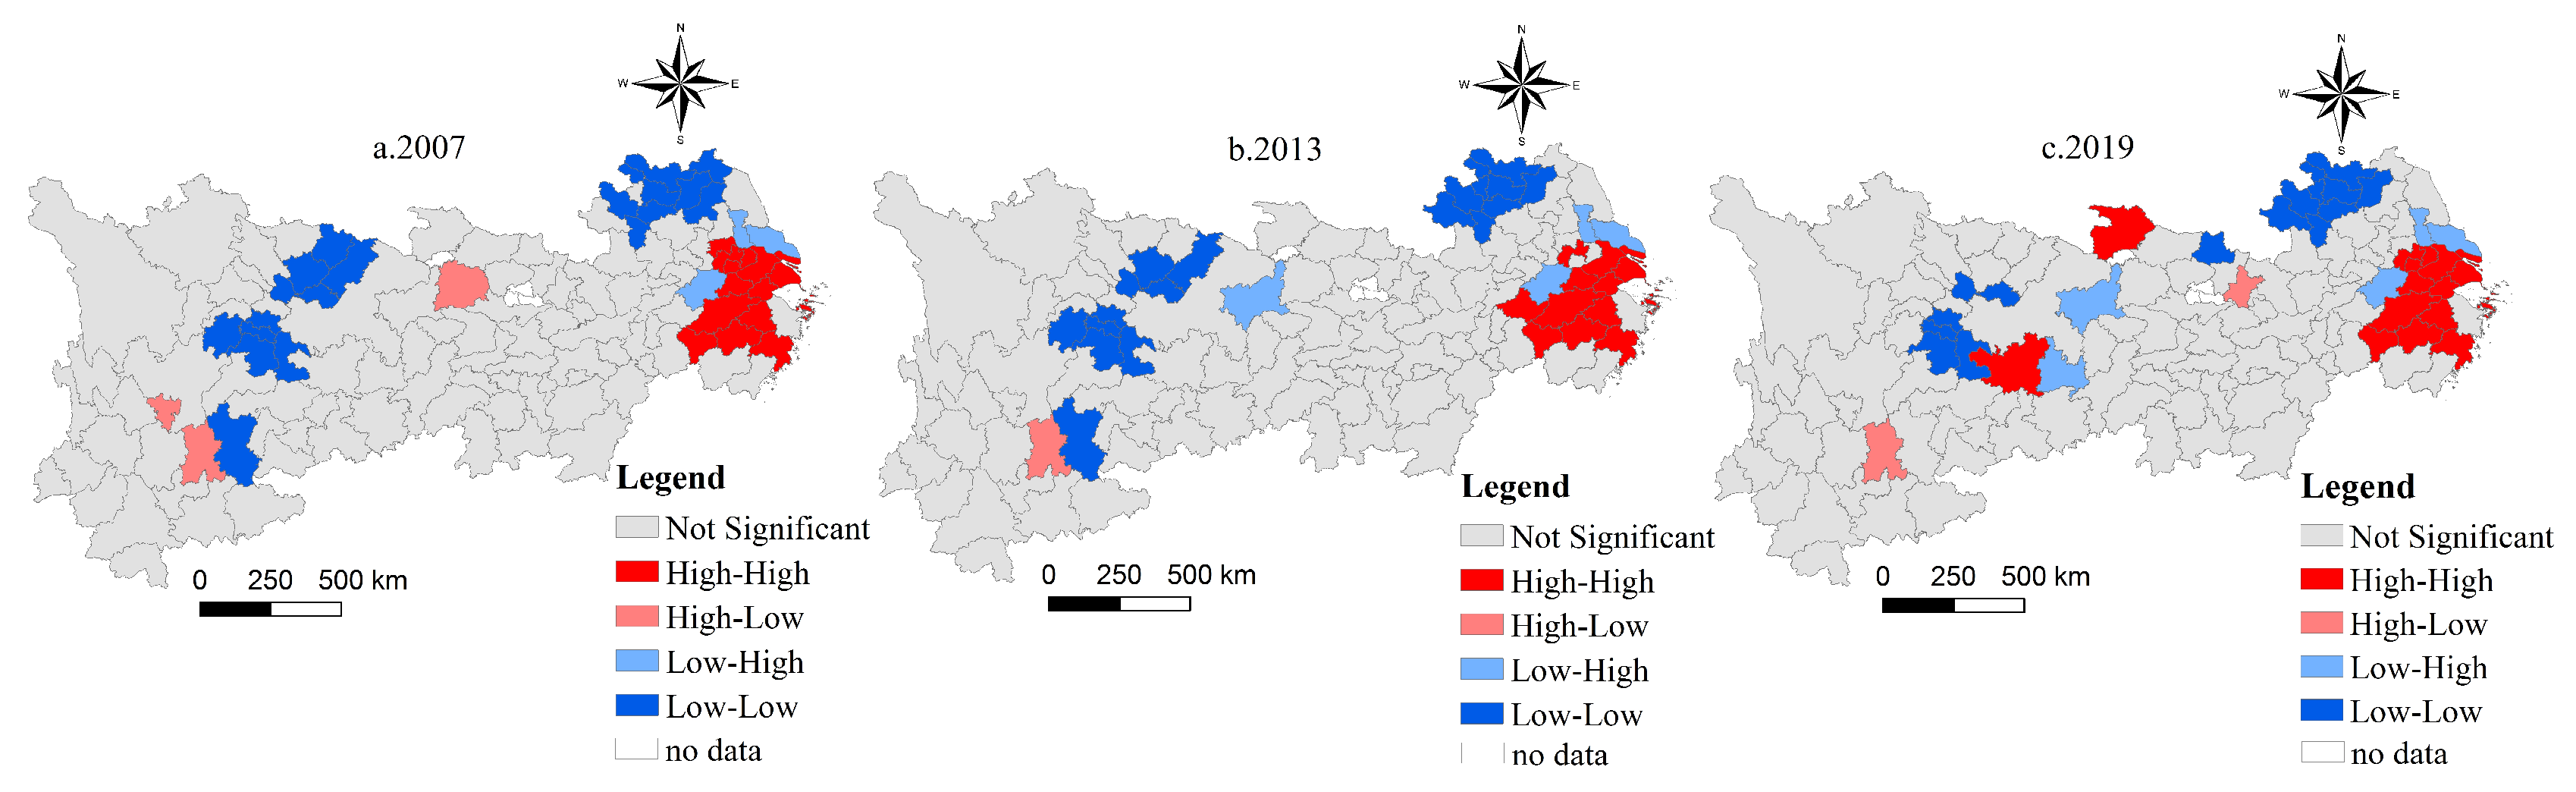
3.2.2. Spatial Correlation Characteristics

(1)
Global Spatial Autocorrelation
In order to analyze the spatial evolution characteristics of the TESR in the YREB, a global spatial autocorrelation measurement of the TESR in 2007, 2013, and 2019 was conducted. The Global Moran’s I value was calculated, and the results are displayed in Table 2.
The value of Global Moran’s I for the TESR in the YREB ranged from 0.340 to 0.361, with p-values lower than 0.01, successfully surpassing the significance level test at 1%, and all Z-values were larger than 2.58. This indicates that the spatial distribution of the TESR is not random, and there exists a significant positive spatial autocorrelation. The Global Moran’s I value demonstrates an increasing trend between 2007 and 2019, suggesting that the spatial positive correlation of urban TESR in the YREB has been continuously rising during the research period. In particular, the Global Moran’s I value rose from 0.340 to 0.341 during 2007–2013, and from 0.341 to 0.361 during 2013–2019. The increase of the Global Moran’s I value is more substantial in the latter period than the former, indicating that the spatial positive correlation of the TESR in the YREB accelerated during the research period, resulting in a closer spatial association.
(2)
Local Spatial Autocorrelation
In order to clarify the spatial clustering distribution of the TESR level in the YREB region, LISA cluster maps for the years 2007, 2013, and 2019 were created using the GeoDA software (Figure 4).
Specifically, the H-H type cities manifest distinct locking effects in their distribution and are primarily situated in the Yangtze River Delta, encompassing cities like Shanghai, southern Suzhou, and central and northern Zhejiang, with significant spatial clustering characteristics. The tourism industry in this area is transitioning towards an intensive and high-quality development mode. The government places significant emphasis on ecological environmental protection, and the social infrastructure development is comprehensive. The methods and measures for ecological environmental protection are at the forefront in China, and excellent ecological environmental conditions exist. These factors contribute to the formation of a highly resilient overall tourism-related environmental system in this region, with the creation of spatial agglomeration.
During the initial research period, L-H type cities were primarily concentrated around H-H type cities, including cities such as Xuancheng, Taizhou, and Nantong. With time, L-H type cites have gradually shown a clustering trend in the midstream. These cities are driven by surrounding regional tourism center cities, which has accelerated the development of the tourism industry in these areas. However, the development of the tourism industry has brought with it tourism projects, a massive inflow of tourists, and other human activities that have exerted great pressure on the tourist environment system.
H-L type cities are relatively rare, with scattered distribution patterns. During the initial research period, they mainly included cities such as Kunming, Yichang, and Panzhihua. Later, the research was focused on cities like Kunming and Wuhan. These cities are mostly regional tourism hubs, with a high degree of tourism industry development, a solid infrastructural foundation for tourism industry development, and a relatively complete ecological environment protection system, possessing high environmental carrying capacity. However, the rapid development of the tourism industry in these cities, under the impetus of the insufficient carrying capacity of the tourist environment system in surrounding areas, has contributed to a low level of TESR in the surrounding cities, leading to the concentration of H-L types.
L-L type cities are mainly concentrated in northern Jiangsu and Anhui, as well as the Wumeng Mountains area. The overall TESR level of these regions is relatively low, due to insufficient coordination between tourism development and ecological environment protection, thus leading to the spatial clustering of L-L types. The clustering of L-L types in the northern Jiangsu and Anhui regions is mainly due to the increasing speed of tourist industry development, which puts great pressure on ecological environment protection, leading to environmental degradation. On the other hand, the Wumeng Mountains area has a slow overall economic development level, complex ecological environment conditions, and inadequate environmental protection measures and infrastructural conditions, resulting in a weak TESR level in the region and forming an L-L spatial clustering.
In addition, the LISA clustering results show that the spatial correlation of the TESR in most cities is not significant, which indicates that the spatially integrated development of the TESR in the YREB has not yet been fully formed and exists only in a small number of areas, such as the Yangtze River Delta and regional tourism hub cities.

3.3. Dynamic Evolution Characteristics

By using the Markov chain method, this study further explores the spatio-temporal evolution characteristics of the TESR in the YREB from 2007–2019. The TESR levels are classified into four categories: low-level, relatively low-level, relatively high-level, and high-level (abbreviated as LW, RL, RH, and HI in the table). In addition, this paper compares and presents the results for two time frames, 2007–2013 and 2013–2019, and calculates the Markov transition probability matrices (Table 3) and spatial Markov transition probability matrices (Table 4) for the TESR of urban areas during the entire study period and two phases.

3.3.1. Markov Transition

Based on Table 3, it is apparent that not all probability values on the diagonal are greater than the values off the diagonal throughout the entire study period, indicating weak stability of the TESR in the YREB. The minimum value on the diagonal is 0.091, which implies that the likelihood of maintaining the original TESR in the region throughout the entire study period is as low as only 9.1%.
The transition of TESR levels in the YREB primarily occurred between adjacent levels, although there were some instances of non-adjacent level transition. In the relatively high-level and high-level categories, the level transition typically occurred between adjacent levels, without any non-adjacent transition phenomena. During the entire research period and two stages, the probabilities of transition from relatively high-level to high-level were 85.1%, 73.7%, and 88.9%, respectively, which accounted for a significant proportion of the probability in each phase. This suggests that the TESR in the YREB has robust potential for the transition from relatively high-level to high-level. In the low-level and relatively low-level categories, transition mostly occurred between adjacent levels, however, there were still some examples of non-adjacent transition. For instance, from 2007–2013, the probability of transition from low-level to relatively high-level reached 36.5%, indicating that the TESR in the YREB also exhibits a strong propensity for upward transition in the low-level and relatively low-level categories, as well as some potential for cross-level development. Additionally, a comparison of the transition matrices during 2007–2013 and 2013–2019 indicated that the upward transition probability of the levels in all categories increased, and the downward transition probability decreased in the latter, thus suggesting that the construction of the urban tourist environment system in the YREB has achieved certain effects.

3.3.2. Spatial Markov Transition

The evolution of the TESR level of cities in the YREB exhibits certain spatial spillover effects. Depending on the spatial lag type of the neighboring cities, the transition probabilities of resilience levels may vary. For low-level cities adjacent to cities that are low-level, relatively low-level, relatively high-level, and high-level, the probabilities of upward transition are 0.678, 0.926, one, and one, respectively. This suggests that higher resilience level cities positively impact cities with lower levels. For relatively low-level cities adjacent to cities of low-level, relatively low-level, relatively high-level, and high-level resilience, the probabilities of upward transition are 0.892, 0.906, one, and one, respectively. At the same time, the probabilities of downward transition are 0.042, 0, 0, and 0, respectively. Thus, it can be concluded that there exists a close relationship between the TESR level in cities and their neighboring cities, and a significant geographical proximity effect. When the TESR level of neighboring cities is the same as or higher than that of one’s own city, the probability of an increase in TESR level also increases. Conversely, when the TESR level of neighboring cities is lower than that of one’s own city, the probability of a decrease in TESR level also increases.
The spillover effects of the TESR exhibit a certain spatio-temporal heterogeneity. When low-level cities are adjacent, the probability of maintaining a low level during the period of 2007–2013 is 0.265, which is higher compared to the probability of 0.192, without considering spatial lag factors during the same period. Similarly, the probability is 0.132 during the period of 2013–2019, which is higher than the probability of 0.105 without considering spatial lag factors during that period. In the case of relatively low-level cities adjacent to relatively low-level cities, the probability of maintaining relatively low-level TESR during the period of 2007–2013 is 0.062, which is lower compared to the probability of 0.081, without considering spatial lag factors during the same period. During the period of 2013–2019, the probability is 0.077, which is higher than the probability of 0.031 without considering spatial lag factors during the same period. Thus, the spillover effects of neighboring cities demonstrate varying differences for cities with different levels during different periods.

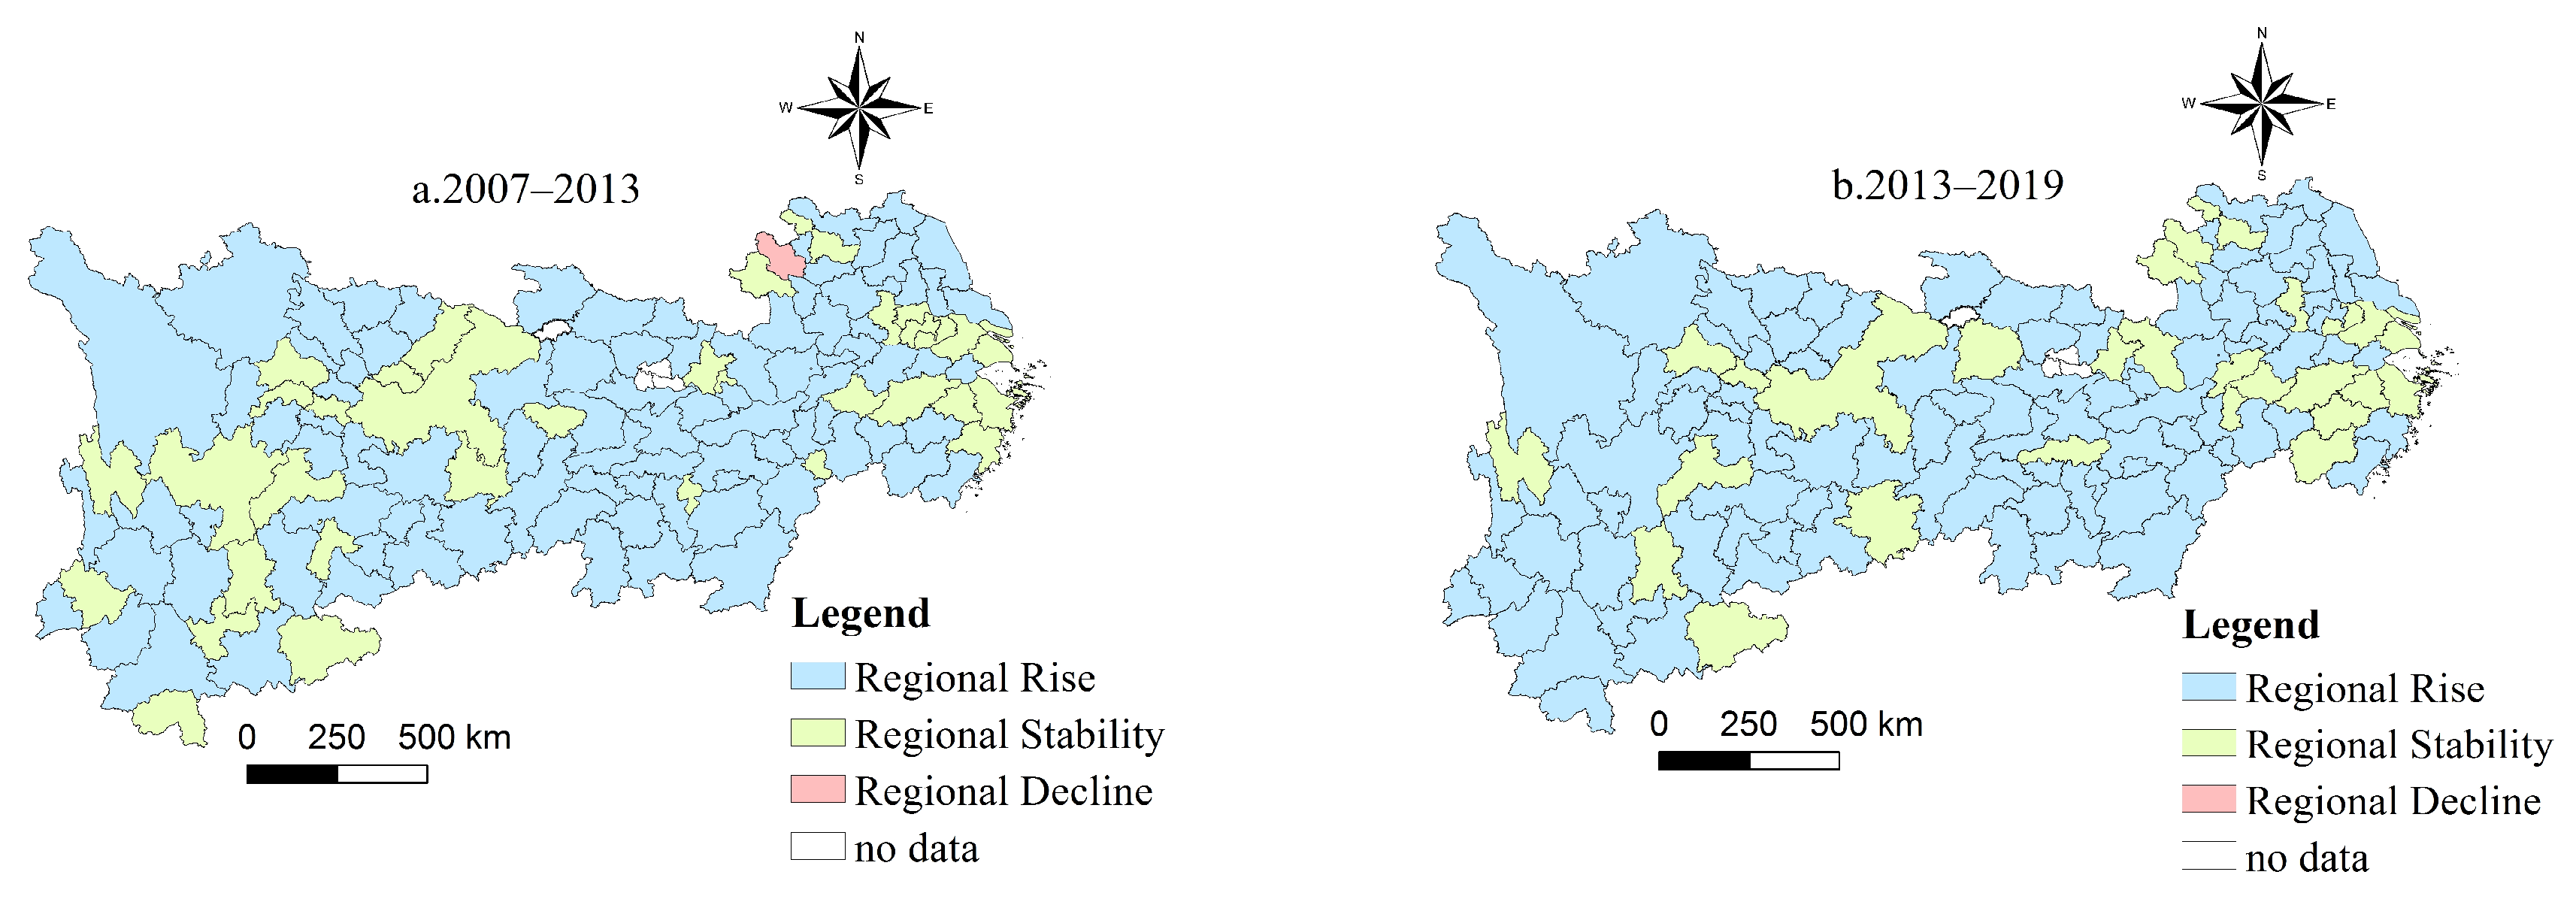
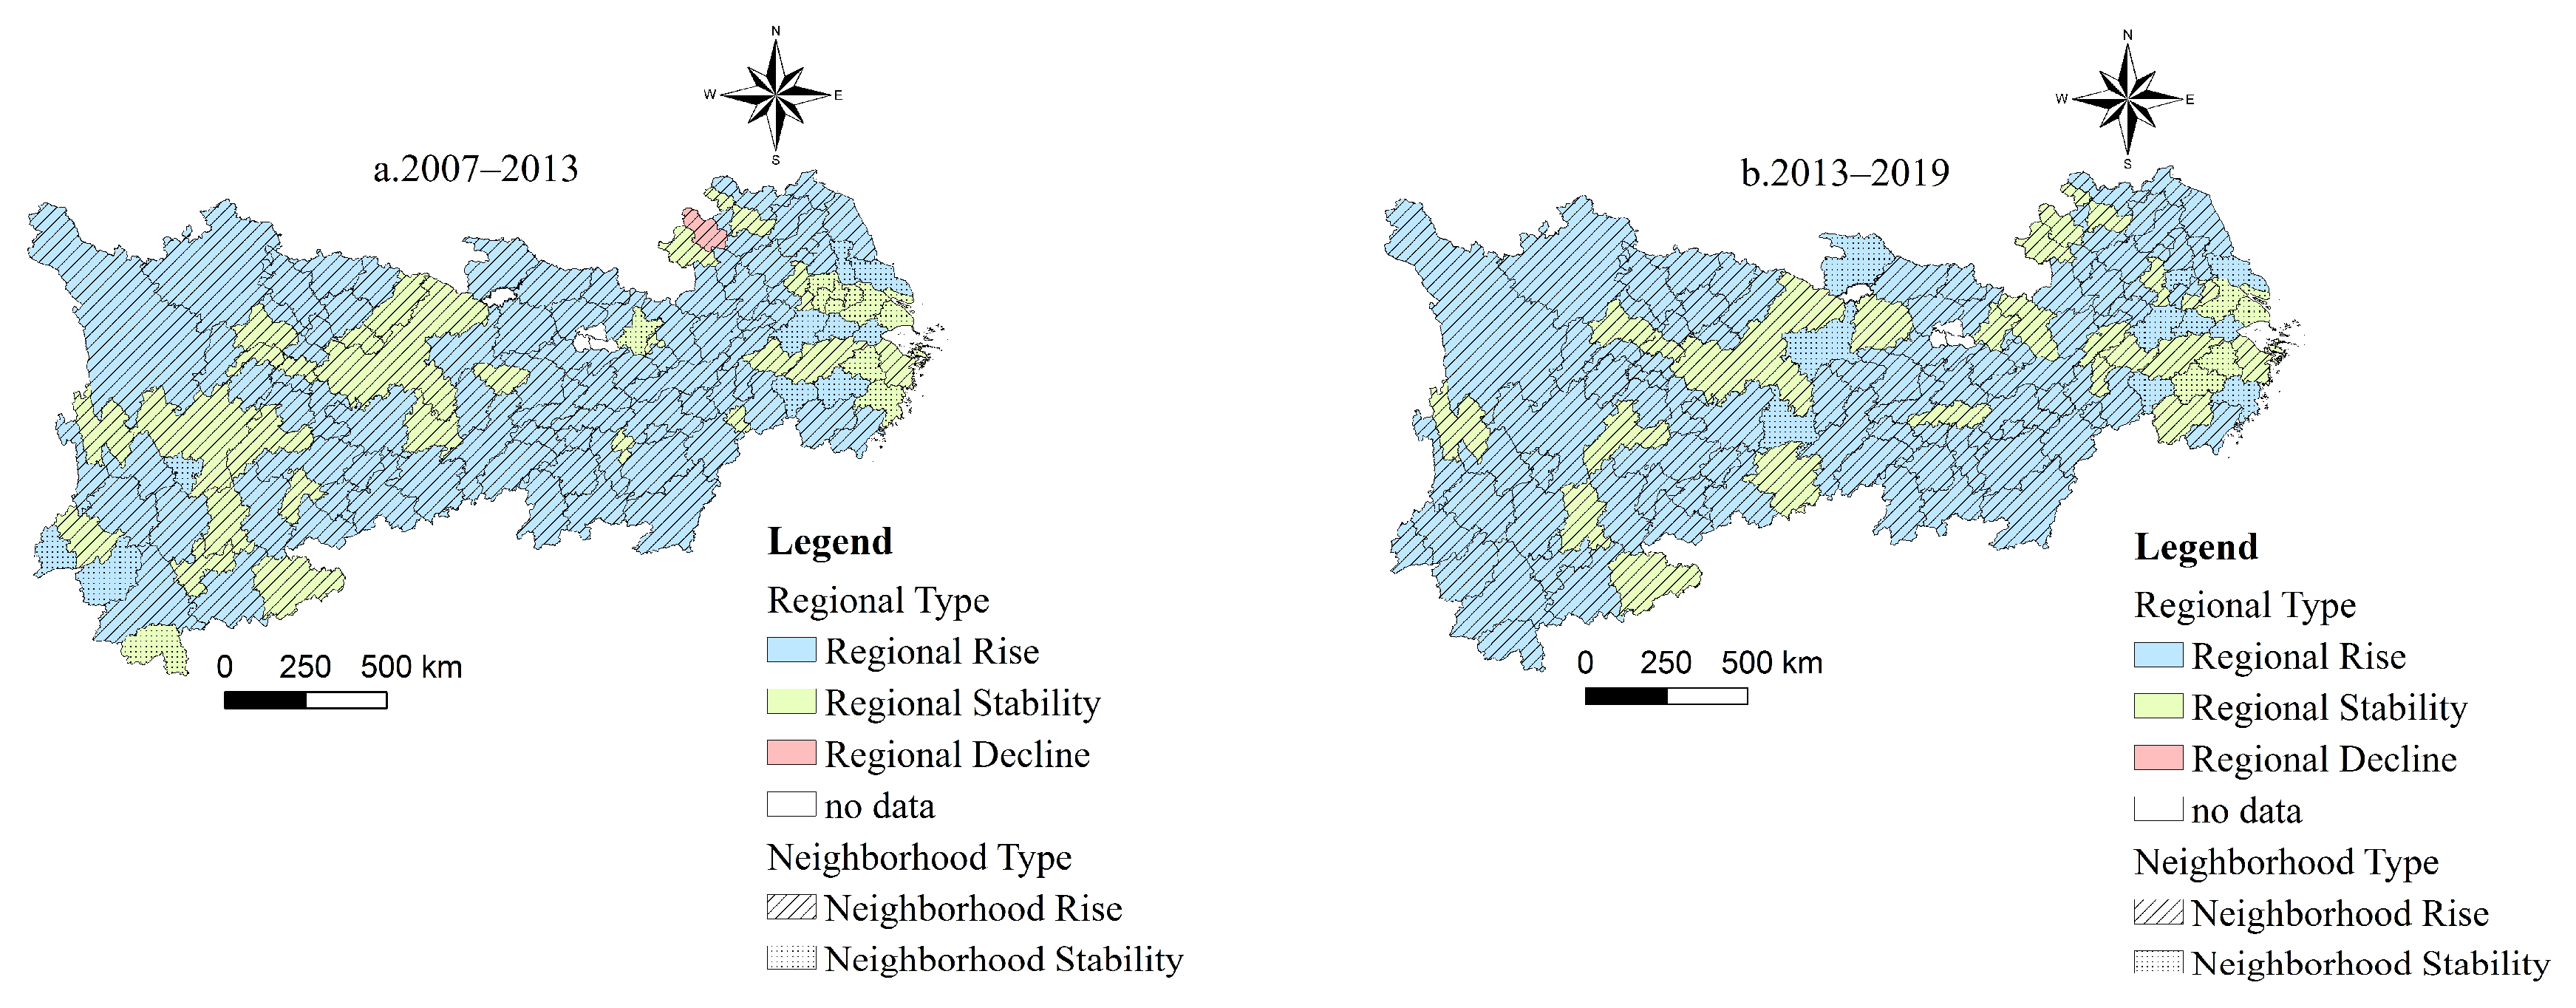
3.3.3. Spatial Patterns of Markov Transition

The spatial distribution of the TESR level transition, when considering and disregarding neighboring cities, as analyzed using ARCGIS 10.2 software is shown in Figure 4 and Figure 5.
Figure 4 demonstrates a degree of convergence in TESR level transitions between adjacent cities within the YREB. From 2007 to 2013, 71.4% of cities in the YREB experienced upward transitions of TESR levels, with 90 cities showing this trend. Conversely, 35 cities maintained stable TESR levels, primarily concentrated in the upstream and downstream. Bozhou was the sole city in the YREB that experienced a decline in TESR level during this time period, with limited reduction from a relatively low level to a low level. As such, the overall trend for TESR level transitions in the YREB between 2007 and 2013 was favorable, demonstrating continuous improvement. From 2013 to 2019, the number of cities experiencing upward transitions of TESR levels in the YREB increased to 98, mainly from cities in the upstream that maintained stable TESR levels during the previous phase. Additionally, all cities exhibited a trend of either increasing or maintaining TESR levels, with no cities experiencing a decline during this period.
Upon further consideration of neighboring cities, it is evident from Figure 5 that between 2007 and 2013 a total of 90 cities experienced an upward transition of TESR levels, of which 80 cities had neighboring cities that also experienced the same trend, accounting for 88.9% of all cities. Additionally, 35 cities maintained stable TESR levels, of which 25 had neighboring cities that had an upward transition of TESR levels, accounting for 71.4%. From 2013 to 2019, the number of cities experiencing an upward transition of TESR levels increased to 98, of which 89.8% had neighboring cities exhibiting the same trend. Conversely, the number of cities with stable TESR levels decreased to 28, of which 82.1% had neighboring cities with an upward transition of TESR levels. Therefore, it can be concluded that, during the research period, there was a substantial spatial spillover effect in TESR level transitions within the YREB. Driven by cities with higher TESR levels, this positive spillover effect resulted in an overall favorable development of TESR levels in the region, demonstrating a continuous improvement trend.

4. Influence Mechanism

4.1. Influencing Factor Selection

The TESR is impacted by a multitude of factors that encompass the economic, social, industrial, and policy dimensions [41,50,52,53,61,62,63,64]. These factors have a multifaceted effect on the TESR. To measure these impacts, the GTWR model was employed, wherein the TESR value serves as the dependent variable, and the economic, social, industrial, and policy factors serve as the independent variable dimensions. Nine secondary indicators specific to each dimension were carefully selected and are listed in Table 5 as the measurement indicators.

4.2. Analysis of Results

4.2.1. Model Estimation and Multicollinearity Analysis

To identify multicollinearity among all standardized variables, a regression analysis was conducted. Variables with a variance inflation factor (VIF) greater than 10 were removed, as listed in Table 5. The VIF values of all remaining variables were below five, indicating that there were no issues with multicollinearity. Thus, economic development, resident income, road network density, level of urbanization, visitor density, industrial structure, tourism cluster, environmental regulation, and level of opening were chosen as the explanatory variables for the model.
Due to the presence of spatial autocorrelation and the constraints imposed by the results of OLS regression, a GTWR has been introduced for conducting regression analysis. The parameters of this GTWR are displayed in Table 6. In terms of model fitting, the adjusted R2 value of 0.953 demonstrates that this model is capable of accurately measuring the effects of individual driving factors on the TESR.

4.2.2. Analysis of Spatio-Temporal Heterogeneity of the Influence Factors
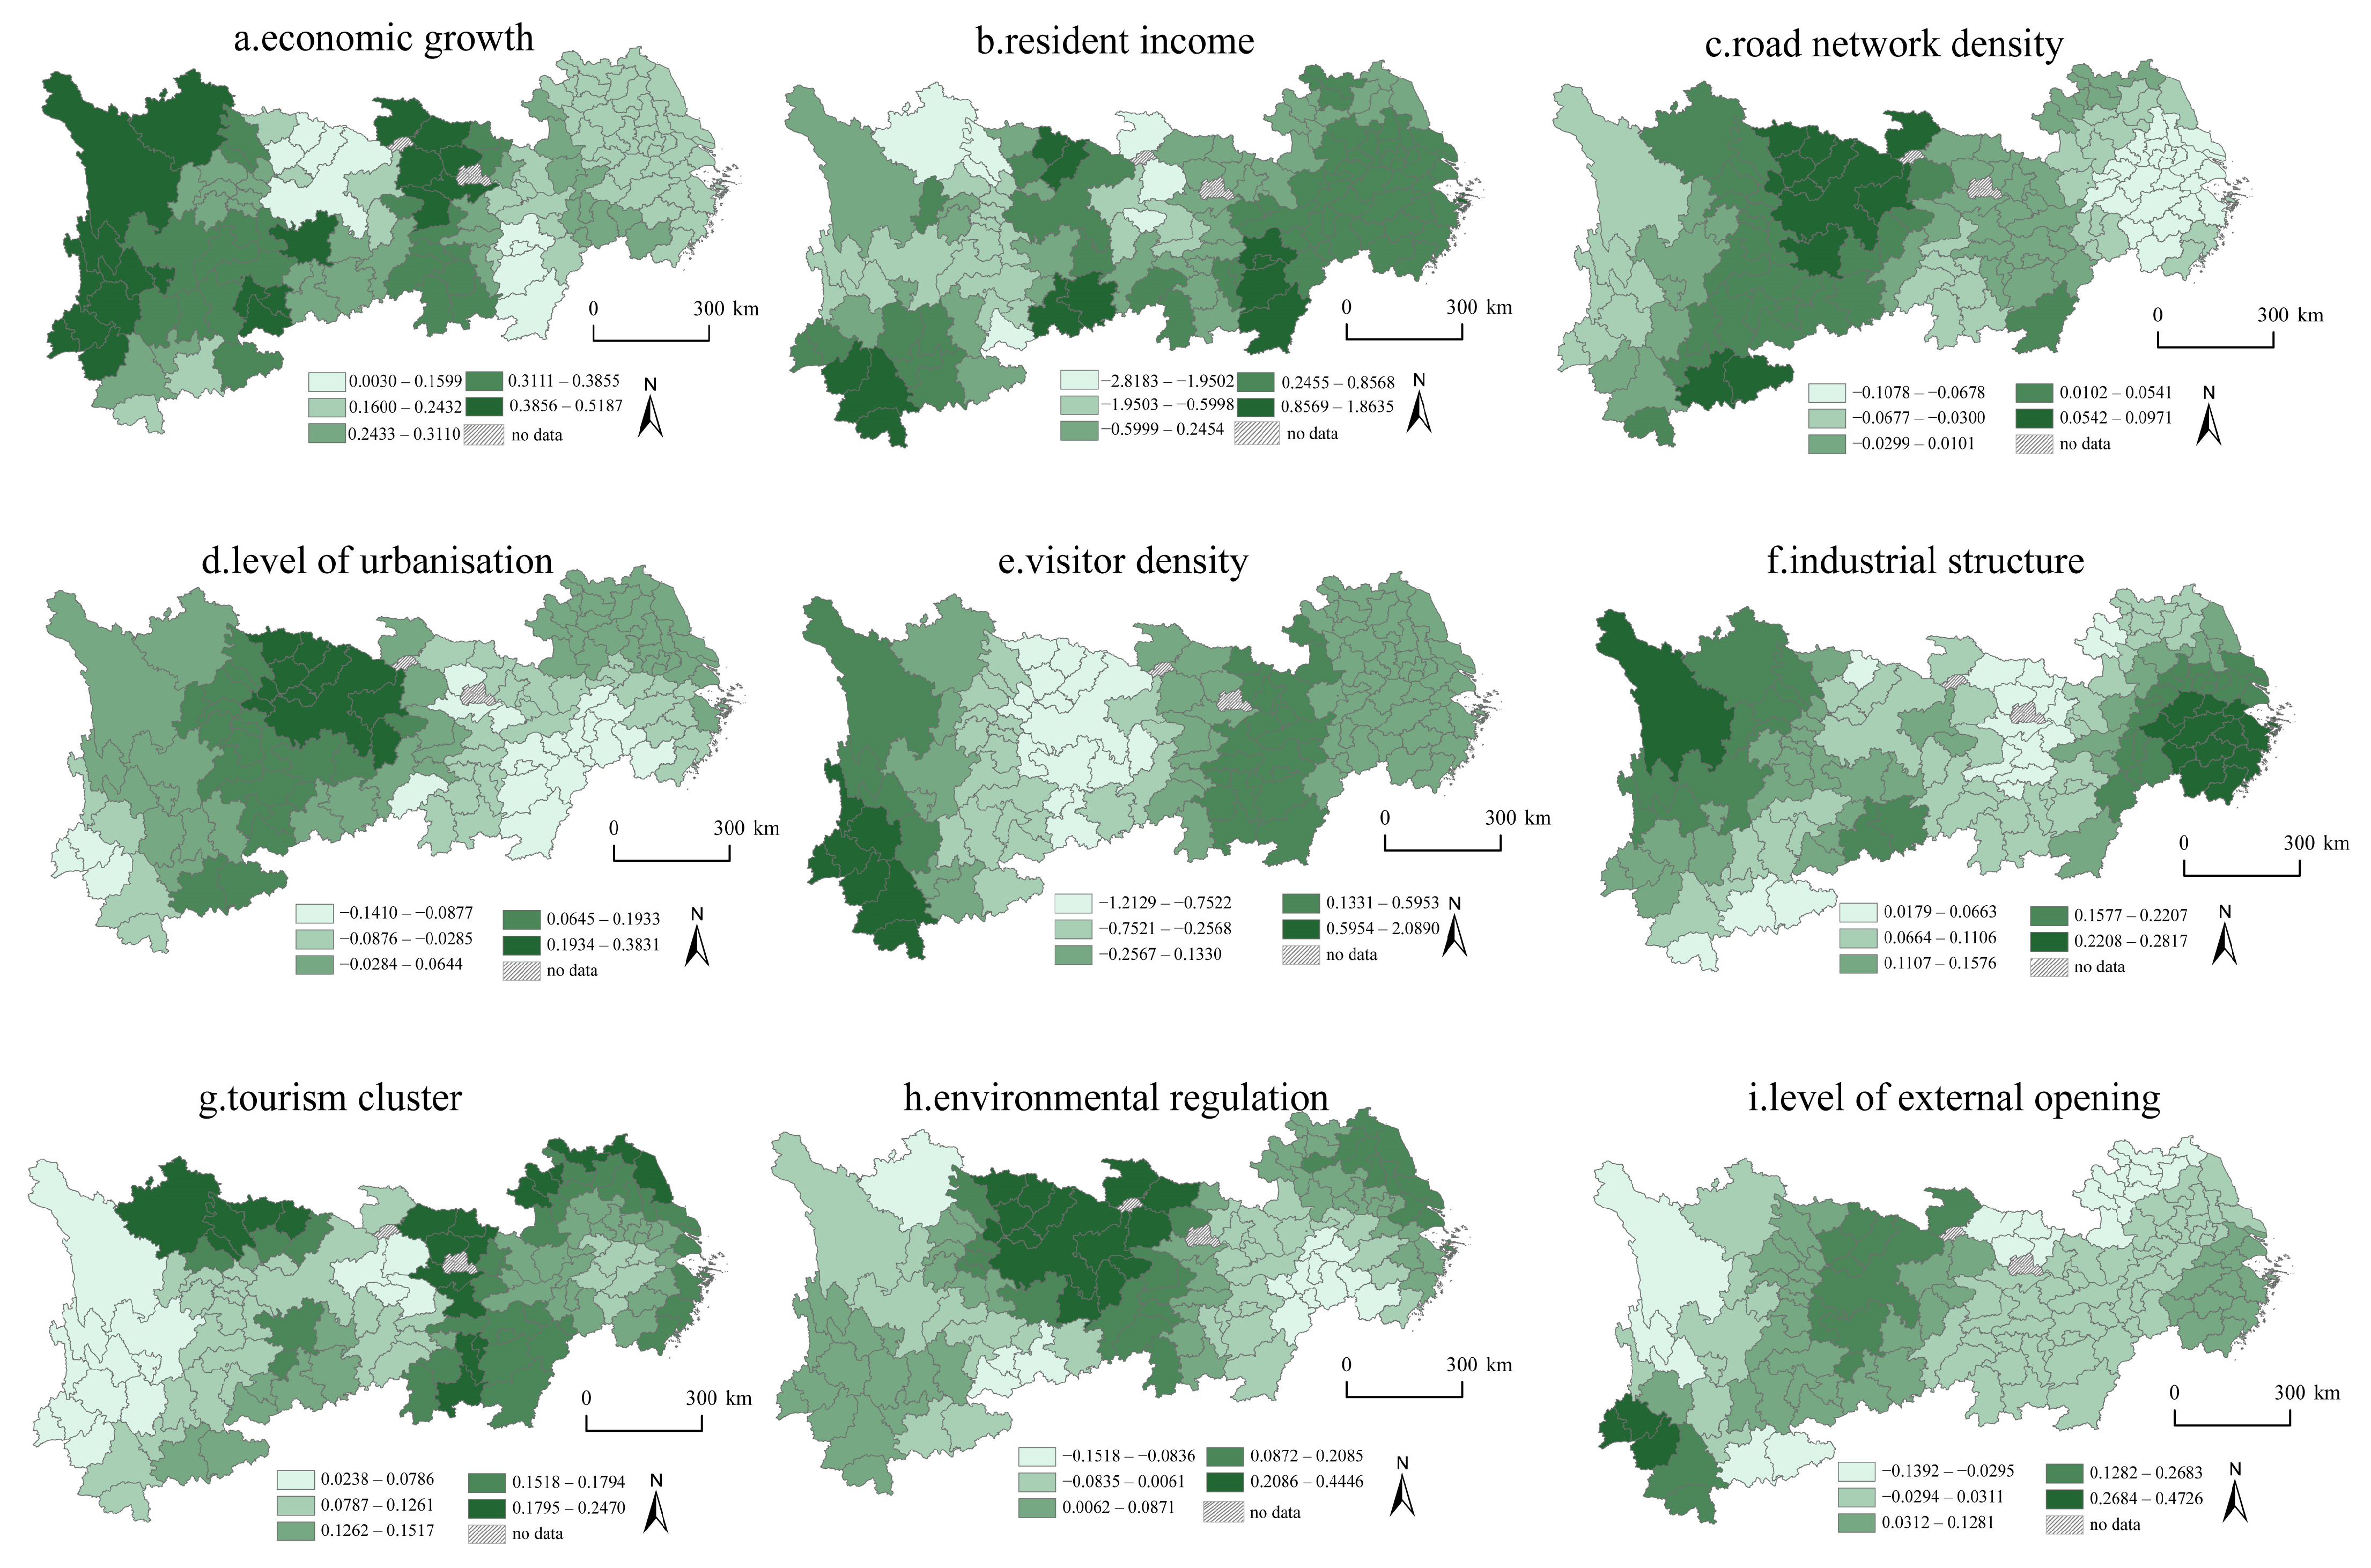
In order to illustrate the spatial heterogeneity of each influence factor, the natural breaks method in ArcGIS 10.2 was utilized to create a visual representation of the influence intensity of each driving factor during the study period (Figure 6). This visualization was presented in order to demonstrate the spatial differentiation of driving factor’s impact. The subsequent analysis was based on the information presented in the figure, as follows:
The model results indicate that various factors, including per capita GDP, disposable income of urban residents, transportation network density, level of urbanization, visitor density, industrial structure, tourism cluster, environmental regulation, and level of external opening, have all played a significant role in determining the TESR (Figure 7). When viewed from the perspective of spatial distribution, there is a discernable spatial heterogeneity in the driving factors that contribute to the TESR.
(1)
In terms of economic factors (Figure 7a,b), the coefficient of per capita GDP has a positive influence on the TESR, with the greatest effect noticeable in regions such as western Sichuan, western Yunnan, and western Hunan. The influence of urban residents’ disposable income on the TESR displays both positive and negative values, with regions where the coefficient is positive primarily concentrated in the Jiangxi and Zhejiang areas, situated in the midstream and downstream. Regions where the coefficient is negative are relatively scattered have a continuous area, spanning most parts of Guizhou and western Hunan.
(2)
Regarding concerning social factors (Figure 7c–e), the driving factors of traffic network density are clearly hierarchical. Regions such as Sichuan and Guizhou situated in the midstream and upstream mainly exert positive effects, while regions such as Jiangsu and Zhejiang mostly have negative effects. The impact of urbanization level and traffic network density on the TESR is similar, and even more distinctly hierarchical. Positive values are primarily concentrated in midstream and upstream, including cities such as Chongqing, Guangan, Dazhou, Nanchong, and Bazhong. Conversely, negative value areas are mainly evident in most cities in Jiangsu and Zhejiang. The effect of tourist density on the TESR is the most influential, with positive values spanning both the upstream and downstream. Among them, Xishuangbanna, Pu’er, and Lincang in western Yunnan exhibit the highest values, and the overall pattern depicts an apex at both ends, with lower values in the middle.
(3)
Regarding industrial factors (Figure 7f,g), the effect of industrial structure on the TESR is positively inclined, with the highest coefficient being evident in regions such as western Sichuan and Zhejiang. In these regions, Ganzi, Huangshan, Xuancheng, Quzhou, Hangzhou, Huzhou, Jiaxing, Jinhua, Ningbo, Wenzhou, and Taizhou exhibit a relatively prominent positive impact, while other cities depict a weaker yet positive impact. Similarly, the impact of tourism agglomeration also demonstrates a positive promotional effect, with a relatively dispersed spatial distribution in areas that have a stronger promoting effect.
(4)
Regarding policy factors (Figure 7h,i), the spatial distribution of the influence of environmental regulations on the TESR mainly follows a “higher in the middle and lower at both ends” pattern. Regions displaying positive coefficients are primarily found in provinces like Sichuan, western Hunan, and Hubei, whereas regions displaying negative coefficients are mainly located in areas such as Jiangxi, Zhejiang, and western Sichuan. On the other hand, the impact of the level of openness to the outside world on the TESR has a predominantly positive promoting effect on more than 80% of cities, with the influence coefficient being larger in the midstream and upstream.
Based on the spatial heterogeneity characteristics of each of the above influencing factors on the TESR, this paper attempts to explore their formation mechanism.
(1)
The influence of the economic factors on the TESR. The TESR is significantly and positively impacted by per capita GDP. A higher per capita GDP signifies a more progressive economy that can, in turn, lead to an improved tourism resource development and environmental management capability, thus making the tourism-related environmental system more resilient. A rise in disposable income can augment resident consumption and encourage consumption upgrading, which in turn would stimulate the regional tourism industry’s development, thus positively enhancing the TESR. However, in regions with a lower level of economic progress, an augmented per capita income may come at the expense of excessive tourism resource development and environmental destruction, leading to a weakened TESR.
(2)
The influence of the social factors on the TESR. In the rugged terrain of the Yun-Gui-Chuan region, increased traffic network density can enhance accessibility, thus rendering a smooth entry and exit experience to tourists. However, in the developed regions of Jiangsu and Zhejiang provinces, excessive traffic network density can create traffic congestion and increased pressure on the urban environment, thus negatively impacting the TESR. In locations with low levels of urbanization, the progression of urbanization can steadily refine tourism hospitality facilities and public service facilities, optimize the environment for tourism development, and consequently advance the level of TESR. However, in areas with relatively high levels of urbanization, large city sizes, high urban construction density, and scarce land resources, this can lead to natural ecological damage and increased environmental pressure during the construction process, thus negatively affecting the TESR. The impact of tourist density on the TESR follows the pattern of “higher on both ends, lower in the middle”, since tourism resources in the upstream and downstream are abundant, and the government protects them with less human development intervention, effectively preventing excessive tourism development from damaging the environment, thereby safeguarding the TESR.
(3)
The influence of the industrial factors on the TESR. A diversified industrial structure furnishes an abundance of tourism products and service resources, spurring the development of the tourism industry. The complementarity of diversification diminishes the risk of single dependence, thereby augmenting the comprehensive competitiveness of the city. This results in stabilizing economic growth, increasing fiscal revenue, generation of employment opportunities, and improvements to the capacity of public services, all of which have a positive impact on the TESR. Tourism agglomeration elevates tourism service quality, diversifies tourism products, stimulates the development of the tourism industry, establishes industrial clusters and chains, enhances the economic resilience and stability of the city, generates economic benefits, and promotes the upgrading of tourism-related public facilities and service facilities, all of which support the development of urban tourism industry.
(4)
The influence of the policy factors on the TESR. In areas where environmental problems are more prevalent, such as those affected by air and water pollution, the government tends to place a higher priority on environmental management, implementing stringent environmental regulations that promote ecological protection and ultimately improve the TESR. Conversely, regions boasting ample natural resources and a lower propensity for environmental contamination receive relatively less governmental attention to environmental governance. The higher the degree of openness, the fewer restrictions exist on the development of the tourism industry and tourism resources. This feature attracts more foreign investment and visitors, thereby enhancing the ability to adapt to external risks and markets while driving the integration of the industrial chain, all of which positively affect the TESR.

5. Discussion

5.1. Discussion of the Spatio-Temporal Evolution of the TESR

Against the backdrop of a shift in the regional resilience research paradigm, the TESR has become a pivotal component of urban sustainable development. Notions such as tourism-related economic resilience [4,13], tourism-related ecological resilience [60], and tourism-related community resilience [65] have been proposed to explore this subject. These theoretical debates have contributed to the comprehension and measurement of tourism industry resilience. However, they often rely solely on a single metric. This study, based on the essence of resilience, puts forward a diverse evaluation system from the economic, social, and ecological dimensions of similar studies to the reference. According to the measurement results, TESR in the YREB presents an apparent rising trend, yet the rate of increase remains relatively sluggish while demonstrating a small annual growth rate. This confirms the previous research conclusion that the tourism industry is highly sensitive and fragile, making it vulnerable to external shocks and disturbances [66,67]. Therefore, while actively fostering tourism industry development, it is imperative to consider its vulnerability. Suitable policies from economic, ecological, and social standpoints should be devised to alleviate the influence of external factors.
Viewed through the lens of spatial distribution, the TESR in the YREB displays a polarized pattern, marked by spatial disparities that impede progress toward overall TESR improvement. This finding corroborates existing research, which highlights the presence of spatial imbalance in the area and underscores the need for integrated development [68,69]. Consequently, customized strategies must be devised to match local conditions, which should consider the varying degrees of the TESR development and diverse environmental factors, including economic, ecological, and social considerations across regions. This approach will allow for the effective enhancement of the overall TESR level. Furthermore, there are considerable spatial spillover effects and geographic proximity effects in the TESR, which bolsters the argument for tourism development possessing spatially dependent attributes [70]. Changes in the resilience of urban tourism-related environmental systems correlate with the TESR levels of neighboring cities. Specifically, if located adjacent to cities with high TESR, the likelihood of increased TESR levels rises, thereby underscoring the role of demonstration and driving forces among tourism hub cities [71].

5.2. Discussion of Factors Affecting the TESR

This study utilizes indicators from four key areas, economic, social, industrial, and policy, to comprehensively examine the underlying mechanisms behind the evolution of the TESR in the YREB. The findings demonstrate that economic factors, such as per capita GDP and disposable income of urban residents, have a positive impact on the TESR. This implies that a robust urban economy provides a solid foundation for the expansion of the tourism sector [52,72], which can bolster the adaptive and recovery capabilities of the tourism complex system in the face of external disruptions. Social factors, like road network density and urbanization, show both positive and negative effects on the TESR [62,73]. Developed regions tend to demonstrate that rapid urban societal growth exerts significant pressure on the tourism complex system, whereas underdeveloped regions improve the TESR through optimization of tourism public service supply, coupled with expansion of the local tourism market scale as a result of urban societal growth. Industrial factors, like industrial structure and tourism agglomeration, have a positive effect on the TESR, which aligns with the conclusion that refining the industrial structure and promoting tourism agglomeration are imperative for enhancing the quality of the tourism industry [50,74].
Research has proven that policy factors, such as environmental regulation, have a nonlinear relationship with industrial growth [75]. The results of this study reveal that interior spatial disparity affects the TESR, along with policy factors primarily related to policy implementation efforts made by the government. Therefore, corresponding TESR enhancement strategies can be devised based on the different factors that impact the TESR, as evidenced by the above research results [1,65,75]. For instance, initiatives such as reasonable planning and management that deliberate on reconciling economic growth and environmental preservation must be implemented in regions such as Guizhou and the western part of Hunan, where excessive exploitation of tourism resources and environmental degradation are prevalent. Cities such as Southern Jiangsu and Zhejiang, where the TESR has declined due to urban development, need the government to allocate prudent interventions that seek a balance between urbanization and the protection of natural and cultural heritage tourism resources.

5.3. Policy Implications

Firstly, in formulating regional development plans, it is essential to capitalize on the positive spillover effect of the central city to facilitate the development of surrounding cities, foster coordinated urban development in the region, and improve the overall urban TESR.
Secondly, to increase the accessibility of tourist destinations, enhance the tourist service standards, satisfy the needs of visitors, augment the social resilience of the regional tourism environment system, promote local economic growth, and boost the income of inhabitants, it is important to enhance infrastructure construction, particularly transportation, in the midstream and upstream sectors.
Finally, it is necessary to promote diversified development of regional industries by introducing a wide range of tourist goods and services that cater to the diverse needs of different visitors. To leverage the abundant tourism resources in the YREB, it is crucial to foster deeper integration between tourism and industries such as agriculture, handicrafts, and commerce, contemplate feasible matches between tourist resources, minimize the dependence on a single sector such as tourism alone, thus promoting adaptability, resistance to risks, and enhancing the TESR.

5.4. Limitations

This study has certain limitations. Firstly, the collection of indicators for the TESR was limited by the data acquisition process, and some crucial indicators such as tourism employment and ecological tourism indicators were notably absent. In future research, we will concentrate on micro-regions to address the issue of the missing statistical indicators. Secondly, due to data and length limitations, this study only selected three time points, namely, 2007, 2013, and 2019, which may not fully reflect the temporal trajectory of the TESR. Hence, in the future, we will select a typical tourist city as a case study to explore the temporal evolution process of the TESR. Thirdly, since this study is mainly focused on the YREB, the selected case site has regional backgrounds and local characteristics that may somewhat impede the broad applicability of the conclusions drawn in this manuscript. Lastly, the influencing factors that trigger changes in the TESR may have interactive relationships, but the selected GTWR method cannot measure the interaction between variables. Thus, when analyzing the determining factors in future studies, we can use methods such as geographic detectors, structural equation models, and other techniques to explore the interaction effects between variables on the TESR. This approach aims to uncover the impact mechanism of the TESR more effectively.

6. Conclusions

This study employed quantitative methods like SMC and GTWR to examine the spatio-temporal transition and influencing mechanism of the TESR in the YREB via the construction of the TESR evaluation index system. Although the TESR in the YREB is on an upward trend, the increment is relatively slight, and the overall level is low. Additionally, external disturbances can adversely influence it. There is a strong positive spatial correlation and spatial agglomeration effect in the TESR, and the rate of the spatial correlation’s improvement increased during the study period. The spatio-temporal evolution of the TESR is relatively dynamic, and it exhibits a clear spatial spillover effect. Many TESR level transitions occur between adjacent levels, but there are also “jump” shifts across levels. High-level cities may positively affect their neighboring cities’ TESR through a spillover effect, driving an increase or plateau in their TESR ranking. The TESR pattern evolution is collectively influenced by economic, social, industrial, and policy factors, each of which has significant spatial heterogeneity.

Author Contributions

Conceptualization, K.W. and X.Z.; data curation, X.C. and S.Z.; funding acquisition, K.W.; methodology, Z.L., X.C. and S.Z.; visualization, X.C. and Z.L.; writing—original draft, K.W. and S.Z.; writing—review & editing, K.W. and S.Z. All authors have read and agreed to the published version of the manuscript.

Funding

This research was funded by the National Natural Science Foundation of China (No. 41961025).

Institutional Review Board Statement

Not applicable.

Informed Consent Statement

Not applicable.

Data Availability Statement

The data that support the findings of this study are available from the corresponding author (K.W.) upon justifiable request.

Conflicts of Interest

The authors declare no conflict of interest.

References

  1. Yang, X.; Zhang, D.; Liu, L.; Niu, J.; Zhang, X.; Wang, X. Development trajectory for the temporal and spatial evolution of the resilience of regional tourism environmental systems in 14 cities of Gansu Province, China. Environ. Sci. Pollut. Res. Int. 2021, 28, 65094–65115. [Google Scholar] [CrossRef] [PubMed]
  2. Aliperti, G.; Sandholz, S.; Hagenlocher, M.; Rizzi, F.; Frey, M.; Garschagen, M. Tourism, Crisis, Disaster: An Interdisciplinary Approach. Ann. Tour. Res. 2019, 79, 102808. [Google Scholar] [CrossRef]
  3. Bellini, N.; Grillo, F.; Lazzeri, G.; Pasquinelli, C. Tourism and regional economic resilience from a policy perspective: Lessons from smart specialization strategies in Europe. Eur. Plan. Stud. 2017, 25, 140–153. [Google Scholar] [CrossRef]
  4. Lee, Y.-J.A.; Kim, J.; Jang, S.; Ash, K.; Yang, E. Tourism and economic resilience. Ann. Tour. Res. 2021, 87, 103024. [Google Scholar] [CrossRef]
  5. Watson, P.; Deller, S. Tourism and economic resilience. Tour. Econ. 2021, 28, 1193–1215. [Google Scholar] [CrossRef]
  6. Reddy, M.V.; Boyd, S.W.; Nica, M. Towards a post-conflict tourism recovery framework. Ann. Tour. Res. 2020, 84, 102940. [Google Scholar] [CrossRef]
  7. Holling, C.S. Resilience and stability of ecological systems. Annu. Rev. Ecol. Syst. 1973, 4, 1–23. [Google Scholar] [CrossRef] [Green Version]
  8. Adger, W.N. Social and ecological resilience: Are they related? Prog. Hum. Geogr. 2000, 24, 347–364. [Google Scholar] [CrossRef]
  9. Reggiani, A.; De Graaff, T.; Nijkamp, P. Resilience: An Evolutionary Approach to Spatial Economic Systems. Netw. Spat. Econ. 2002, 2, 211–229. [Google Scholar] [CrossRef]
  10. Folke, C. Resilience: The emergence of a perspective for social–ecological systems analyses. Glob. Environ. Chang. 2006, 16, 253–267. [Google Scholar] [CrossRef]
  11. Kitsos, A.; Bishop, P. Economic resilience in Great Britain: The crisis impact and its determining factors for local authority districts. Ann. Reg. Sci. 2018, 60, 329–347. [Google Scholar] [CrossRef] [Green Version]
  12. Davoudi, S.; Shaw, K.; Haider, L.J.; Quinlan, A.E.; Peterson, G.D.; Wilkinson, C.; Fünfgeld, H.; McEvoy, D.; Porter, L.; Davoudi, S. Resilience: A Bridging Concept or a Dead End? Plann. Theory Pract. 2012, 13, 299–333. [Google Scholar] [CrossRef] [Green Version]
  13. Zhang, P.; Huang, Y.; Pan, S.; Chen, W.; Zhong, H.; Xu, N.; Zhong, M. Does Resilience Exist in China’s Tourism Economy? From the Perspectives of Resistance and Recoverability. Sustainability 2022, 14, 10641. [Google Scholar] [CrossRef]
  14. Miller, F.; Osbahr, H.; Boyd, E.; Thomalla, F.; Bharwani, S.; Ziervogel, G.; Walker, B.; Birkmann, J.; van der Leeuw, S.; Rockström, J.; et al. Resilience and Vulnerability Complementary or Conflicting Concepts? Ecol. Soc. 2010, 15, 11. [Google Scholar] [CrossRef]
  15. Hall, C.M.; Prayag, G.; Amore, A. Tourism and Resilience: Individual, Organisational and Destination Perspectives; Channel View Publications: Bristol, UK, 2017. [Google Scholar]
  16. Traskevich, A.; Fontanari, M. Mental Wellness in Resilient Destinations. Int. J. Spa Wellness 2018, 1, 193–217. [Google Scholar] [CrossRef]
  17. Wut, T.M.; Xu, J.; Wong, S.-m. Crisis management research (1985–2020) in the hospitality and tourism industry: A review and research agenda. Tour. Manag. 2021, 85, 104307. [Google Scholar] [CrossRef]
  18. Ford, J.D.; Sherman, M.; Berrang-Ford, L.; Llanos, A.; Carcamo, C.; Harper, S.; Lwasa, S.; Namanya, D.; Marcello, T.; Maillet, M. Preparing for the health impacts of climate change in Indigenous communities: The role of community-based adaptation. Glob. Environ. Chang. 2018, 49, 129–139. [Google Scholar] [CrossRef]
  19. Calgaro, E.; Lloyd, K. Sun, sea, sand and tsunami: Examining disaster vulnerability in the tourism community of Khao Lak, Thailand. Singap. J. Trop. Geogr. 2008, 29, 288–306. [Google Scholar] [CrossRef]
  20. Forster, J.; Schuhmann, P.W.; Lake, I.R.; Watkinson, A.R.; Gill, J.A. The influence of hurricane risk on tourist destination choice in the Caribbean. Clim. Chang. 2012, 114, 745–768. [Google Scholar] [CrossRef] [Green Version]
  21. Marshall, N.A.; Tobin, R.C.; Marshall, P.A.; Gooch, M.; Hobday, A.J. Social vulnerability of marine resource users to extreme weather events. Ecosystems 2013, 16, 797–809. [Google Scholar] [CrossRef]
  22. Rindrasih, E. Under the Volcano: Responses of a community-based tourism Village to the 2010 Eruption of Mount Merapi, Indonesia. Sustainability 2018, 10, 1620. [Google Scholar] [CrossRef] [Green Version]
  23. Tervo-Kankare, K. Entrepreneurship in nature-based tourism under a changing climate. Curr. Issues Tour. 2019, 22, 1380–1392. [Google Scholar] [CrossRef] [Green Version]
  24. Wu, M.; Gao, X.; Cao, M.; Papa, E.; Zhu, X. The changes of intergovernmental collaboration dynamic in post-disaster destination management: Network analysis. Hosp. Tour. Manag. 2021, 48, 32–45. [Google Scholar] [CrossRef]
  25. Duro, J.A.; Perez-Laborda, A.; Turrion-Prats, J.; Fernández-Fernández, M. COVID-19 and tourism vulnerability. Tour. Manag. Perspect. 2021, 38, 100819. [Google Scholar] [CrossRef] [PubMed]
  26. Ntounis, N.; Parker, C.; Skinner, H.; Steadman, C.; Warnaby, G. Tourism and Hospitality industry resilience during the COVID-19 pandemic: Evidence from England. Curr. Issues Tour. 2022, 25, 46–59. [Google Scholar] [CrossRef]
  27. Karim, W.; Haque, A.; Anis, Z.; Ulfy, M.A. The movement control order (MCO) for COVID-19 crisis and its impact on tourism and hospitality sector in Malaysia. Int. J. Hosp. Manag. 2020, 3, 1–7. [Google Scholar]
  28. Lopes, A.S.; Sargento, A.; Carreira, P. Vulnerability to COVID-19 unemployment in the Portuguese tourism and hospitality industry. Int. J. Contemp. Hosp. Manag. 2021, 33, 1850–1869. [Google Scholar] [CrossRef]
  29. Liu, X.; Fu, X.; Hua, C.; Li, Z. Crisis information, communication strategies and customer complaint behaviours: The case of COVID-19. Tour. Rev. 2021, 76, 962–983. [Google Scholar] [CrossRef]
  30. Kaushal, V.; Srivastava, S. Hospitality and tourism industry amid COVID-19 pandemic: Perspectives on challenges and learnings from India. Int. J. Hosp. Manag. 2021, 92, 102707. [Google Scholar] [CrossRef]
  31. Podhorodecka, K. Tourism economies and islands′ resilience to the global financial crisis. Island Stud. J. 2018, 13, 163–184. [Google Scholar] [CrossRef]
  32. Khalid, U.; Okafor, L.E.; Shafiullah, M. The effects of economic and financial crises on international tourist flows: A cross-country analysis. J. Travel Res. 2020, 59, 315–334. [Google Scholar] [CrossRef]
  33. Veréb, V.; Nobre, H.; Farhangmehr, M. Cosmopolitan tourists: The resilient segment in the face of terrorism. Tour. Manag. Perspect. 2020, 33, 100620. [Google Scholar] [CrossRef]
  34. Liu, A.; Pratt, S. Tourism′s vulnerability and resilience to terrorism. Tour. Manag. 2017, 60, 404–417. [Google Scholar] [CrossRef]
  35. McKercher, B.; Hui, E.L. Terrorism, economic uncertainty and outbound travel from Hong Kong. J. Travel Tour. Mark. 2004, 15, 99–115. [Google Scholar] [CrossRef]
  36. Calgaro, E.; Lloyd, K.; Dominey-Howes, D. From vulnerability to transformation: A framework for assessing the vulnerability and resilience of tourism destinations. J. Sustain. Tour. 2014, 22, 341–360. [Google Scholar] [CrossRef]
  37. Cochrane, J. The Sphere of Tourism Resilience. Tour. Recreat. Res 2010, 35, 173–185. [Google Scholar] [CrossRef]
  38. Duro, J.A.; Perez-Laborda, A.; Fernandez, M. Territorial tourism resilience in the COVID-19 summer. Ann. Tour. Res. Emp. Insig. 2022, 3, 100039. [Google Scholar] [CrossRef]
  39. Fang, Y.; Zhu, L.; Jiang, Y.; Wu, B. The immediate and subsequent effects of public health interventions for COVID-19 on the leisure and recreation industry. Tour. Manag. 2021, 87, 104393. [Google Scholar] [CrossRef]
  40. Adams, K.M.; Choe, J.; Mostafanezhad, M.; Phi, G. (Post-) Pandemic Tourism Resiliency: Southeast Asian Lives and Livelihoods in Limbo. Tour. Geogr. 2021, 23, 915–936. [Google Scholar] [CrossRef]
  41. Xu, X.; Wang, M.; Wang, M.; Yang, Y.; Wang, Y. The Coupling Coordination Degree of Economic, Social and Ecological Resilience of Urban Agglomerations in China. Int. J. Environ. Res. Public Health 2022, 20, 413. [Google Scholar] [CrossRef]
  42. Dogru, T.; Marchio, E.A.; Bulut, U.; Suess, C. Climate Change: Vulnerability and Resilience of Tourism and the Entire Economy. Tour. Manag. 2019, 72, 292–305. [Google Scholar] [CrossRef]
  43. Canh, N.P.; Thanh, S.D. Domestic tourism spending and economic vulnerability. Ann. Tour. Res. 2020, 85, 103063. [Google Scholar] [CrossRef] [PubMed]
  44. Martin, R.; Sunley, P.; Gardiner, B.; Tyler, P. How Regions React to Recessions: Resilience and the Role of Economic Structure. Reg. Stud. 2016, 50, 561–585. [Google Scholar] [CrossRef] [Green Version]
  45. Alberti, M.; Marzluff, J.M. Ecological resilience in urban ecosystems: Linking urban patterns to human and ecological functions. Urban Ecosyst. 2004, 7, 241–265. [Google Scholar] [CrossRef]
  46. Bangwayo-Skeete, P.F.; Skeete, R.W. Modelling tourism resilience in small island states: A tale of two countries. Tour. Geogr. 2021, 23, 436–457. [Google Scholar] [CrossRef]
  47. Bui, P.L.; Tzu-Ling, C.; Wickens, E. Tourism industry resilience issues in urban areas during COVID-19. Int. J. Tour. Policy 2021, 7, 861–879. [Google Scholar]
  48. Jha, A.K.; Miner, T.W.; Stanton-Geddes, Z. Building Urban Resilience: Principles, Tools, and Practice; World Bank Publications: Washington, DC, USA, 2013. [Google Scholar]
  49. Meerow, S.; Newell, J.P.; Stults, M. Defining urban resilience: A review. Landsc. Urban Plan. 2016, 147, 38–49. [Google Scholar] [CrossRef]
  50. Hu, H.; Qiao, X.; Yang, Y.; Zhang, L. Developing a resilience evaluation index for cultural heritage site: Case study of Jiangwan Town in China. Asia Pac. J. Tour. Res. 2020, 26, 15–29. [Google Scholar] [CrossRef]
  51. Ahmad, I.; Tang, D.S. Multi-objective Linear Programming for Optimal Water Allocation Based on Satisfaction and Economic Criterion. Arab. J. Sci. Eng. 2016, 41, 1421–1433. [Google Scholar]
  52. Chen, M.; Zheng, L.; Zhang, D.; Li, J. Spatio-Temporal Evolution and Obstacle Factors Analysis of Tourism Ecological Security in Huanggang Dabieshan UNESCO Global Geopark. Int. J. Environ. Res. Public Health 2022, 19, 8670. [Google Scholar] [CrossRef]
  53. Zhuo, L.; Guan, X.; Ye, S. Quantitative Evaluation and Prediction Analysis of the Healthy and Sustainable Development of China’s Sports Industry. Sustainability 2020, 12, 2184. [Google Scholar] [CrossRef] [Green Version]
  54. Zhu, W.; Wang, M.; Zhang, B. The effects of urbanization on PM2. 5 concentrations in China′s Yangtze River Economic Belt: New evidence from spatial econometric analysis. J. Clean. Prod. 2019, 239, 118065. [Google Scholar] [CrossRef]
  55. Chen, Q.; Chen, W.; Wu, D.; Zheng, L.; Li, J. Spatiotemporal evolution and influencing factors of tourism development efficiency in the Yangtze River Economic Belt, China. J. Clean. Prod. 2022, 379, 134722. [Google Scholar] [CrossRef]
  56. Li, Y.; Wei, Y.D. The spatial-temporal hierarchy of regional inequality of China. Appl. Geogr. 2010, 30, 303–316. [Google Scholar] [CrossRef]
  57. Zhang, Z.; Hu, Z.; Zhong, F.; Cheng, Q.; Wu, M. Spatio-Temporal Evolution and Influencing Factors of High Quality Development in Yunnan-Guizhou, Region Based on the Perspective of Beautiful China and SDGs. Land 2022, 11, 821. [Google Scholar] [CrossRef]
  58. Huang, J.; Sun, Z.; Du, M. Differences and Drivers of Urban Resilience in Eight Major Urban Agglomerations: Evidence from China. Land 2022, 11, 1470. [Google Scholar] [CrossRef]
  59. Mu, X.; Fang, C.; Yang, Z. Spatio-temporal evolution and dynamic simulation of the urban resilience of Beijing-Tianjin-Hebei urban agglomeration. J. Geogr. Sci. 2022, 32, 1766–1790. [Google Scholar] [CrossRef]
  60. Jamaliah, M.M.; Powell, R.B. Ecotourism resilience to climate change in Dana Biosphere Reserve, Jordan. J. Sustain. Tour. 2017, 26, 519–536. [Google Scholar] [CrossRef]
  61. Nathwani, J.; Lu, X.; Wu, C.; Fu, G.; Qin, X. Quantifying security and resilience of Chinese coastal urban ecosystems. Sci. Total Environ. 2019, 672, 51–60. [Google Scholar] [CrossRef]
  62. Ruan, W.; Li, Y.; Zhang, S.; Liu, C.-H. Evaluation and drive mechanism of tourism ecological security based on the DPSIR-DEA model. Tour. Manag. 2019, 75, 609–625. [Google Scholar] [CrossRef]
  63. Weaver, D.B.; Lawton, L.J. Visitor attitudes toward tourism development and product integration in an Australian urban-rural fringe. J. Travel Res. 2004, 42, 286–296. [Google Scholar] [CrossRef]
  64. You, X.; Sun, Y.; Liu, J. Evolution and analysis of urban resilience and its influencing factors: A case study of Jiangsu Province, China. Nat. Hazards 2022, 113, 1751–1782. [Google Scholar] [CrossRef] [PubMed]
  65. Lloyd, M.G.; Peel, D.; Duck, R.W. Towards a social–ecological resilience framework for coastal planning. Land Use Policy 2013, 30, 925–933. [Google Scholar] [CrossRef]
  66. Alvarez, S.; Bahja, F.; Fyall, A. A framework to identify destination vulnerability to hazards. Tour. Manag. 2022, 90, 104469. [Google Scholar] [CrossRef]
  67. Rosselló, J.; Becken, S.; Santana-Gallego, M. The effects of natural disasters on international tourism: A global analysis. Tour. Manag. 2020, 79, 104080. [Google Scholar] [CrossRef]
  68. Du, D.; Lew, A.A.; Ng, P.T. Tourism and Economic Growth. J. Travel Res. 2014, 55, 454–464. [Google Scholar] [CrossRef]
  69. Rozmiarek, M.; Malchrowicz-Mośko, E.; Kazimierczak, M. Overtourism and the impact of tourist traffic on the daily life of city residents: A case study of Poznan. J. Tour. Cult. Chang. 2022, 20, 718–734. [Google Scholar] [CrossRef]
  70. Yang, Y. Agglomeration density and tourism development in China: An empirical research based on dynamic panel data model. Tour. Manag. 2012, 33, 1347–1359. [Google Scholar] [CrossRef]
  71. Logar, I. Sustainable tourism management in Crikvenica, Croatia: An assessment of policy instruments. Tour. Manag. 2010, 31, 125–135. [Google Scholar] [CrossRef]
  72. Yang, Y.; Fik, T. Spatial effects in regional tourism growth. Ann. Tour. Res. 2014, 46, 144–162. [Google Scholar] [CrossRef] [Green Version]
  73. Xiaobin, M.; Biao, S.; Guolin, H.; Xing, Z.; Li, L. Evaluation and spatial effects of tourism ecological security in the Yangtze River Delta. Ecol. Indic. 2021, 131, 108190. [Google Scholar] [CrossRef]
  74. Lin, V.S.; Yang, Y.; Li, G. Where can tourism-led growth and economy-driven tourism growth occur? J. Travel Res. 2019, 58, 760–773. [Google Scholar] [CrossRef]
  75. Nicholls, S.; Kim, J.W. Spatial is special: The need to consider spatial effects in leisure research. Leis. Sci. 2019, 44, 476–496. [Google Scholar] [CrossRef]
Figure 1. Research area overview.
Sustainability 15 10527 g001
Figure 2. Changes in the level of the TESR in 2007, 2013, and 2019. The numbers in the figure indicate the mean value of TESR.
Sustainability 15 10527 g002
Figure 3. Spatial distribution pattern of the TESR in the YREB in 2007, 2013, and 2019.
Sustainability 15 10527 g003
Figure 4. LISA cluster map of the TESR in the YREB in 2007, 2013, and 2019.
Sustainability 15 10527 g004
Figure 5. Spatial distribution pattern of the TESR transition in 2007, 2013, and 2019.
Sustainability 15 10527 g005
Figure 6. Spatial distribution of the TESR and neighborhood transition pattern in 2007, 2013, and 2019.
Sustainability 15 10527 g006
Figure 7. Spatial heterogeneity of influencing factors for the TESR in the YREB.
Sustainability 15 10527 g007
Table 1. Evaluation index system for the TESR.
Target Guideline Indicator Indicator MeasurementUnitAttributeReferences
Economic ResilienceResistanceX1City Visitor ScaleTotal Number of VisitorsMillion People-[1]
X2Tourism Industry DependenceTotal Tourism Revenue/GDP--[1]
X3The Scale of Inbound TourismInbound Tourism Receipts/Total Tourism Receipts--[1]
AdaptabilityX4Visitor Consumption LevelTotal Tourism Revenue/Total Tourist ArrivalsYuan+[1]
X5City Economic LevelGDP per CapitaYuan+[1]
X6Urban Tourism Investment EfficiencyTotal Tourism Revenue/Fixed Asset Investment in Three Industries-+[50]
X7Contribution of Income from Tourism WorkersTotal Tourism Revenue/Total Number of Employees in the Three IndustriesYuan
/person
+[1]
RecoveryX8Tourism Revenue to Economic ElasticityTourism Revenue Growth Rate/GDP Growth Rate-+[51]
X9Income Elasticity of Tourism for Urban ResidentsThe Growth Rate of Urban Residents’ Income/Growth Rate of Tourism Income-+[1]
X10Income Elasticity of Tourism for Rural ResidentsGrowth Rate of Rural Residents’ Income/Growth Rate of Tourism Income-+[1]
X11Industrial Structure OptimizationThe Proportion of Value Added by the Three Industries%+[51]
Social ResilienceResistanceX12Population DensityCity Population/Land AreaPeople/km2-[51]
X13Tourist Disturbance to the CityVisitor Size/Number of City Residents--[50]
X14Urban Traffic PressureTraffic/Number of City Residents--[52]
X15Balanced Development of Urban and Rural AreasThe Income Gap Between Urban and Rural ResidentsYuan-[53]
AdaptabilityX16Urbanization LevelPopulation Urbanization Rate%+[1]
X17Road Traffic
Density
Highway Mileage/Total Areakm/km2+[1]
X18Urban Healthcare CoveragePublic Health Care Expenditure/Fiscal Expenditure-+[1]
X19Tourism Employment Contribution RateNumber of People Employed in the Three Industries/Total Employment%+[1]
RecoveryX20Scale of Tourist AttractionsNumber of Scenic Spots Above 3A Levelpcs+[54]
X21The Scale of Non-Foreign HeritageNumber of National-level Intangible Cultural Heritagepcs+[54]
X22Museum SizeNumber of Museums for 10,000 Peoplepcs
/million
+[1]
X23The Scale of Cultural Tourism IntegrationNumber of Theaters and Cinemas for 10,000 Peoplepcs
/million
+[1]
Ecological ResilienceResistanceX24Wastewater Discharge from the Tourism Industry(Total Tourism Tevenue/GDP) × Waste Water DischargeMillion t-[1]
X25Emissions from the Tourism Industry(Total Tourism Revenue/GDP) × SO2 EmissionsMillion t-[1]
AdaptabilityX26Domestic Waste Treatment CapacityHarmless Disposal Rate of Domestic Waste%+[1]
X27The Scale of Domestic Waste TreatmentDomestic Waste Removal Volume/Total Populationt/person+[1]
X28Domestic Sewage Treatment CapacityDomestic Sewage Treatment Rate%+[1]
RecoveryX29High-Grade Tourism TesourcesThe Sum of the Number of National Forest Parks, Geoparks, Scenic Spots and World Heritage Sitespcs+[54]
X30Air QualityNumber of Days with Secondary Air QualityDay+[1]
X31Forest SizeForest Cover%+[1]
X32Recreational Green Space ScaleGreen Space per Capitam2/person+[1]
Table 2. Global Moran’s I value of the TESR in 2007, 2013, and 2019.
YearMoran’s IZ-Valuesp-Values
20070.3406.1400.000
20130.3416.1910.000
20190.3616.5030.000
Table 3. Markov transition probability matrix.
2007–20192007–20132013–2019
LWRLRHHInLWRLRHHInLWRLRHHIn
LW0.2320.5790.1890950.1920.4420.3650520.1050.5260.3330.03557
RL0.0130.0910.7010.195770.0270.0810.5410.3513700.0310.750.21932
RH00.0210.1280.85147000.2630.73719000.1110.88918
HI000.0300.97033000118000119
Table 4. Spatial Markov transition probability matrix.
Lag2007–20192007–20132013–2019
LWRLRHHInLWRLRHHInLWRLRHHIn
LWLW0.3230.5970.0810620.2650.4410.2940340.1320.5790.2630.02638
RL0.0420.1670.6250.167240.0770.0770.3850.46213000.7690.23113
RH000180001400011
HI000110001500016
RLLW0.0740.5560.370270.0710.5710.3570140.0590.4710.4120.05917
RL00.0940.6560.253200.0620.8120.1251600.0770.7690.15413
RH00.0770.1540.76913000.6250.3758000.1670.8336
HI0001100000000012
RHLW00.50.5060010200101
RL000.8820.1181700.1670.1670.6676000.3330.6673
RH000.2350.7651700014000.20.85
HI000.1110.88990001700016
HILW000000010200101
RL000.750.254000.50.5200103
RH000190001300016
HI0001130001600015
Table 5. Selected indicators for influencing factors.
DimensionVariable LayerIndicatorUnitVIFReference
Economic FactorsEconomic
Development
GDP per CapitaYuan/person4.568[52]
Resident IncomePer Capita Disposable Income of
Urban Residents
Yuan/person1.469[52]
Social
Factors
Road Network
Density
Traffic Road Network Densitykm/km21.715[61,62]
Level of
Urbanization
Urbanization Rate of the Population%3.685[41]
Visitor DensityTourist Scale/Urban AreaPopulation/km22.552[50]
Industrial FactorsIndustrial StructureTertiary Industry
Value Added
of GDP
%1.765[63]
Tourism ClusterLocational Entropy of Tourism
Income
-1.451[64]
Policy
Factors
Environmental
Regulation
Environmental
Pollution Control
Investment as of
GDP
%1.150/
Level of External
Opening
Foreign Direct Investment as a
Share of GDP
%1.198[53]
Table 6. Results of OLS and GTWR.
VariablesOLSGTWR
AICc−537.925−2389.557
R20.8190.955
R2Adj0.8150.953
Parameter-2.775
Residual Squares-0.040
Sigma-0.010
Spatio-Temporal Distance Ratio-3.034
Disclaimer/Publisher’s Note: The statements, opinions and data contained in all publications are solely those of the individual author(s) and contributor(s) and not of MDPI and/or the editor(s). MDPI and/or the editor(s) disclaim responsibility for any injury to people or property resulting from any ideas, methods, instructions or products referred to in the content.

