1. Introduction
Highway network management planning involves the allocation of the available budget to specific road sections based on their condition and prescribed maintenance and rehabilitation requirements. Realizing the effective and rational maintenance of highway assets requires an integrated maintenance management system that carries out data collection and maintenance activity reports at levels where the information can actually improve or change the way planning and implementation is carried out.
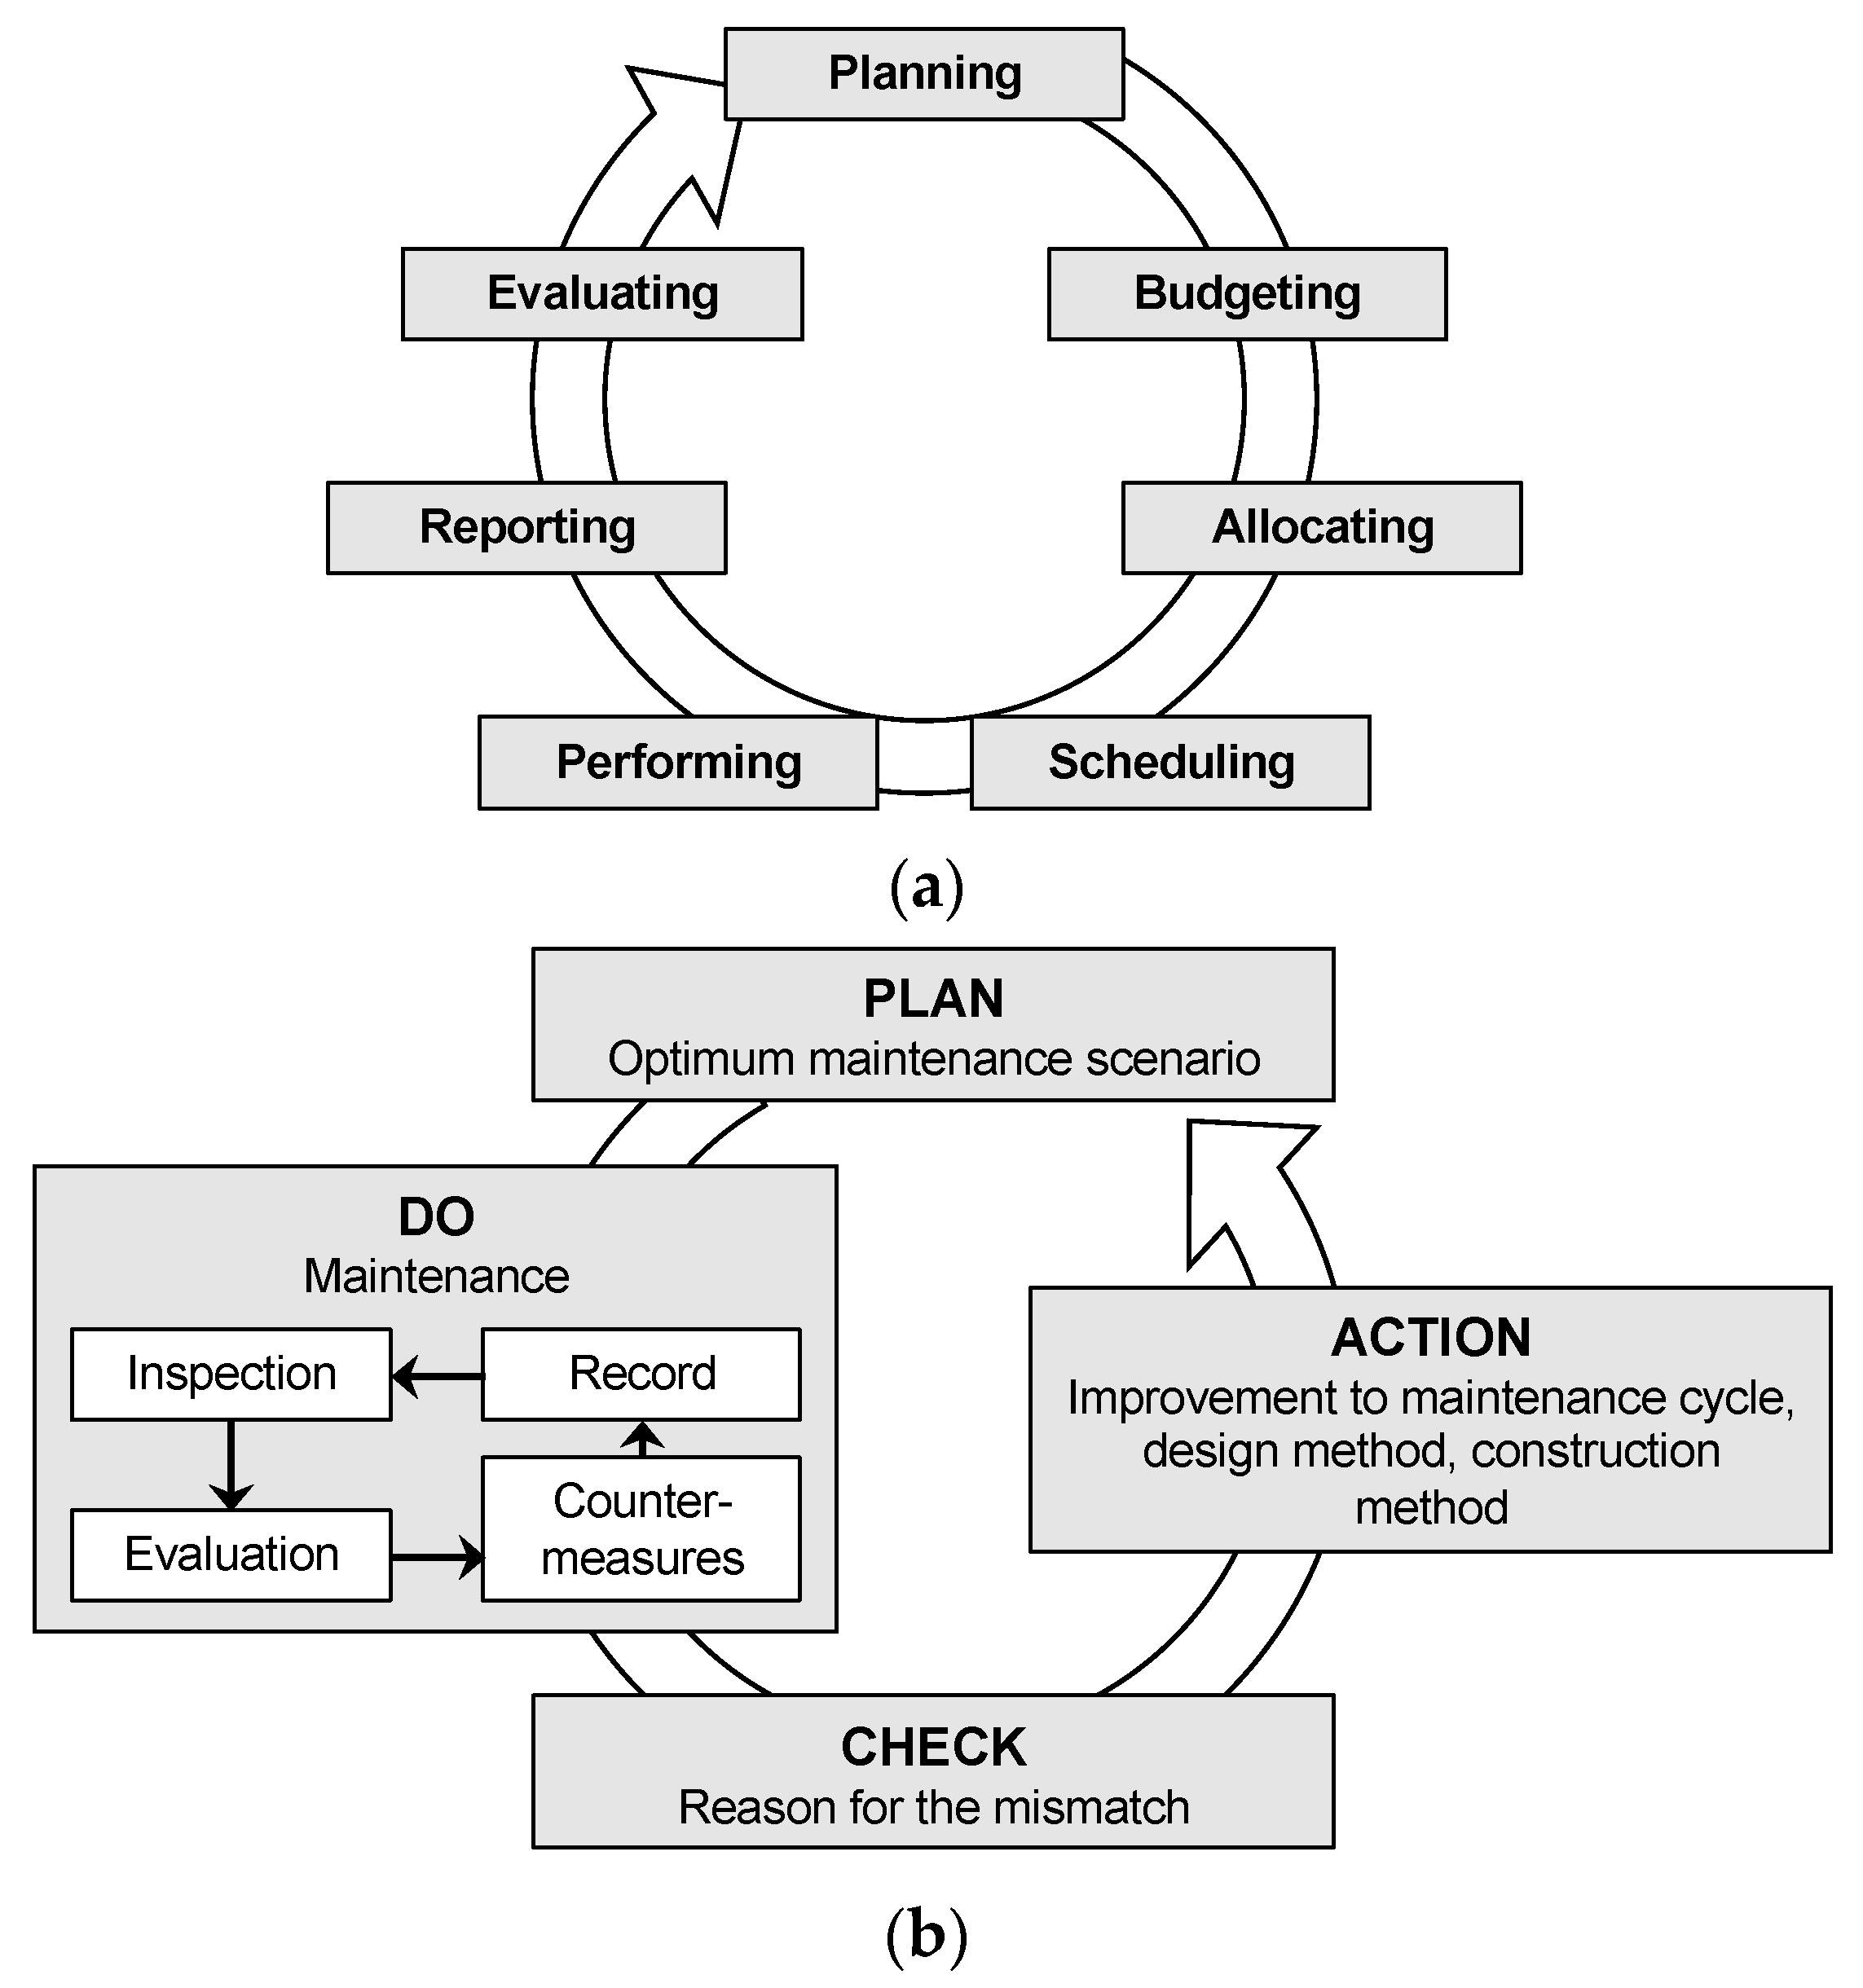
Figure 1a shows a conceptual integrated management system scheme to guide road agencies. It was established in the scheme that, regardless of whatever level of integration the road agency chooses to pursue, the maintenance management system (MMS) should be integrated across maintenance and other functional area databases within a department and among the various maintenance activities [
1].
The same concept can also be explained using a PDCA (plan–do–check–action) cycle. The maintenance management plan as defined by the PDCA cycle is a management system used to control and constantly improve processes. As shown in
Figure 1b, it consists of four stages. The first stage of the PDCA cycle is PLAN, which is the current established plan for carrying out road maintenance. Thus, it is necessary to fully understand an agency’s current practice for selecting road sections for a maintenance plan before improvements can be considered. The second stage is DO, which is to perform the maintenance activities: inspecting the road infrastructure, determining the condition based on the inspection results, choosing the appropriate countermeasures, and carrying them out, and recording all data involved in these processes. The CHECK part of the PDCA involves finding mismatches between the assumptions or expectations under the original maintenance plan and the newly obtained results. Based on the knowledge obtained from the check stage, the last step, ACTION, explores improvements for future maintenance planning by analyzing the various potential courses of action based on observations from the previous maintenance and then planning a more optimized maintenance plan to be carried out in the next PDCA cycle. Hence, it has been established that effective road asset maintenance is not restricted only to the planning or implementation stage but also includes the development of improvement strategies for future maintenance planning based on the data gathered during maintenance.
The improvement of the future maintenance plan by evidence-based decision making is challenging as it involves diversified data, such as road inventory and its conditions, climate conditions, traffic volume, and loading, allocated maintenance costs, and others. The complexity in these domains is matched by increasingly subjective objectives to be achieved in road maintenance planning, including the consideration of sustainability, levels of services, and resilience [
2]. As suggested by the PDCA cycle, this problem can be tackled by analyzing past road-related data to find sub-optimal decisions or actions in the existing planning and to explore how to improve the future maintenance planning. Furthermore, advancements in machine learning algorithms offer the potential to automate this process, which will help realize more data-driven and rational highway management by reducing human subjectivity in the decision-making process.
In this research, the applicability of the PDCA approach combined with a machine learning algorithm for improving maintenance planning is explored for the provincial highway network in Khyber Pakhtunkhwa, Pakistan. Khyber Pakhtunkhwa province is in the north-western region of Pakistan and contains over 3000 km of provincial highways. These roads are spread across four regions with varied climatic and geographic conditions, and serve a variety of purposes, including facilitating the transport of mining and agricultural products and access to important tourist and cultural locations. Due to the heavy usage of these roads, together with harsh environmental loading, road maintenance planning is necessary to monitor and maintain the service level of the road network, but there is a limited budget available for maintenance activities, so the rational allocation of economic resources is important. According to the PDCA cycle concept, the planning of future road maintenance activities should be carried out based on the actual road condition. However, it is not clear what factors are considered in the budget allocation process, so it is difficult to determine whether current maintenance planning is being carried out optimally. Therefore, in this research, the decision making behind the road maintenance budget allocation was reverse engineered by performing decision tree analysis, a machine learning technique, on provincial road network data in Khyber Pakhtunkhwa to reveal the factors affecting the maintenance budget allocation.
2. Literature Review
2.1. Decision Making for Road Network Management
Effective decision making plays an important role in highway network management, especially for the rational allocation of maintenance budgets [
3]. However, these decision-making processes are not always simple, as they must juggle many different challenges, such as large networks, limited resources, and conflicting goals, as well as the uncertainties inherent in both data and decision making [
4,
5]. Traditionally, decision making for highway management was based primarily on the subjective perspectives of decision makers and, consequently, it was not possible to evaluate the rationality of the maintenance planning. With the evolution of data analytics, however, a shift has occurred in decision making in the transportation engineering field towards extracting knowledge from complex datasets utilizing tools and techniques from the data science field. Researchers have adopted various algorithms for determining how to prioritize road sections for maintenance planning through the analysis of highway network data. Fwa et al. proposed a model based on a genetic algorithm, which served as an analytical tool for pavement maintenance [
6]. The study also highlighted the importance of effective budget planning strategies for ensuring cost-efficient maintenance practice by analyzing the impacts of poor budget planning during the initial years of pavement maintenance. Mbwana et al. developed an optimization model using Markov transition probabilities to identify specific road links for optimization in a network-level pavement management system [
7]. The fuzzy logic technique was similarly utilized for pavement condition ratings and decision making related to pavement maintenance for road networks [
8]. Mahpour et al. tested seven machine learning algorithms, which included boosting regression, lasso, ridge, random forest regression, elastic net, neural network, and multiple linear regression, for determining the most cost-effective and efficient maintenance policies for a road network in Iran, and it was concluded that the gradient boosting regression was the most accurate algorithm for predicting the cost of maintenance policies [
9]. Finally, Han et al. proposed a decision-making method for improving the accuracy and efficiency of maintenance decisions for asphalt pavement maintenance management by utilizing an improved weight random forest algorithm (IWRF) based on correlation analysis and analytic hierarchy process (AHP) [
10].
However, the evaluation of the decision-making process itself in highway network management has received limited attention from researchers. Therefore, this research aimed to fill that gap by proposing the application of the decision tree analysis algorithm as an analytical approach that not only helps in evaluating the existing decision making but also recommends improvements in maintenance budget allocation for highway network management.
2.2. Decision Tree Analysis
Decision tree analysis is a type of supervised machine learning, wherein the objective is to predict the class or value of a target variable using a set of decision rules inferred from training data, which are then presented graphically as a tree-shaped structure that is easy to understand via a decision maker [
11,
12]. The decision tree consists of a root node, branches, and leaf nodes. The topmost node is the root node, the testing of an attribute occurs at each internal node, and the outcome of the test appears in a branch and the class label appears in a leaf node [
13]. Hence, in a decision tree, each node represents a feature (attribute), each link represents a decision (rule), and each leaf represents an outcome (the predicted categorical or continuous value). A typical decision tree model is shown in
Figure 2.
The decision tree can be used for classification or regression depending on the type of the outcome variable, and there are different decision tree algorithms, such as C5.0 (Quinlan, 1993), iterative dichotomiser 3 (ID3) (Quinlan, 1986), chi-squared automatic interaction detection (CHAID) (Kass, 1980), and classification and regression tree (CART). The characteristics of these different decision tree algorithms are shown in
Table 1. C5.0 is the most recent Quinlan iteration and uses information gain (entropy) as its splitting criteria to produce a multi-branched tree. ID3 was the first developed algorithm and can only be used for classification problems with nominal variables. CHAID uses the chi-square test to predict the most dominant feature and can only be applied to classification problems. With CART, the tree model is visualized as a binary tree, and the decision rules are generated by splitting the predictor variables repeatedly until some predetermined stopping criteria are met [
14]. Each node relates to a predictor variable and a split cutoff on that variable, and the leaf nodes represent the predicted outcomes of a target variable.
2.3. Applications of Decision Tree Analysis
The process of analyzing data by using the decision tree method has been successfully applied in many fields, such as medicine [
15,
16,
17,
18], business management [
19,
20], crime prediction [
21,
22], urban transport [
12], and construction engineering [
23,
24], but there are few examples of its application to solving road asset management problems. Behrouz et al. used the cloud decision tree for selecting the most optimal maintenance and repair strategies for Iran’s national road network [
25]. They developed various decision tree models for every province of Iran and concluded that fatigue cracking and international roughness index (IRI) were the most important parameters for determining the most appropriate maintenance and repair scenario. Chen et al. (2015) analyzed road maintenance data and statistical data (distress, IRI, crack, pavement contract, etc.) of Taipei city and performed decision tree analysis (C5.0 and ID3) and support vector machine to develop maintenance recommendations [
26].
Unlike the previous applications of decision tree analysis in the road asset management field, this paper applies this method to reveal what factors play a major role in the allocation of road maintenance budget. The analysis of road maintenance budget data using decision tree analysis in this way may thus be likened to opening the “black box” of the decision-making process behind the budget allocation and thus is of particular significance when there are no clearly established rules governing road asset maintenance planning.
3. Methodology
The research adopted the PDCA approach to gain insight into the existing maintenance plan and for proposing a method for improvement in the future. For these purposes, classification and regression tree techniques were applied to the data of the provincial highway network of Khyber Pakhtunkhwa province to reveal the factors that served as the basis for the distribution of maintenance funds. The details of the analysis methodology are provided in the following section.
3.1. Data Details and Variable Selection
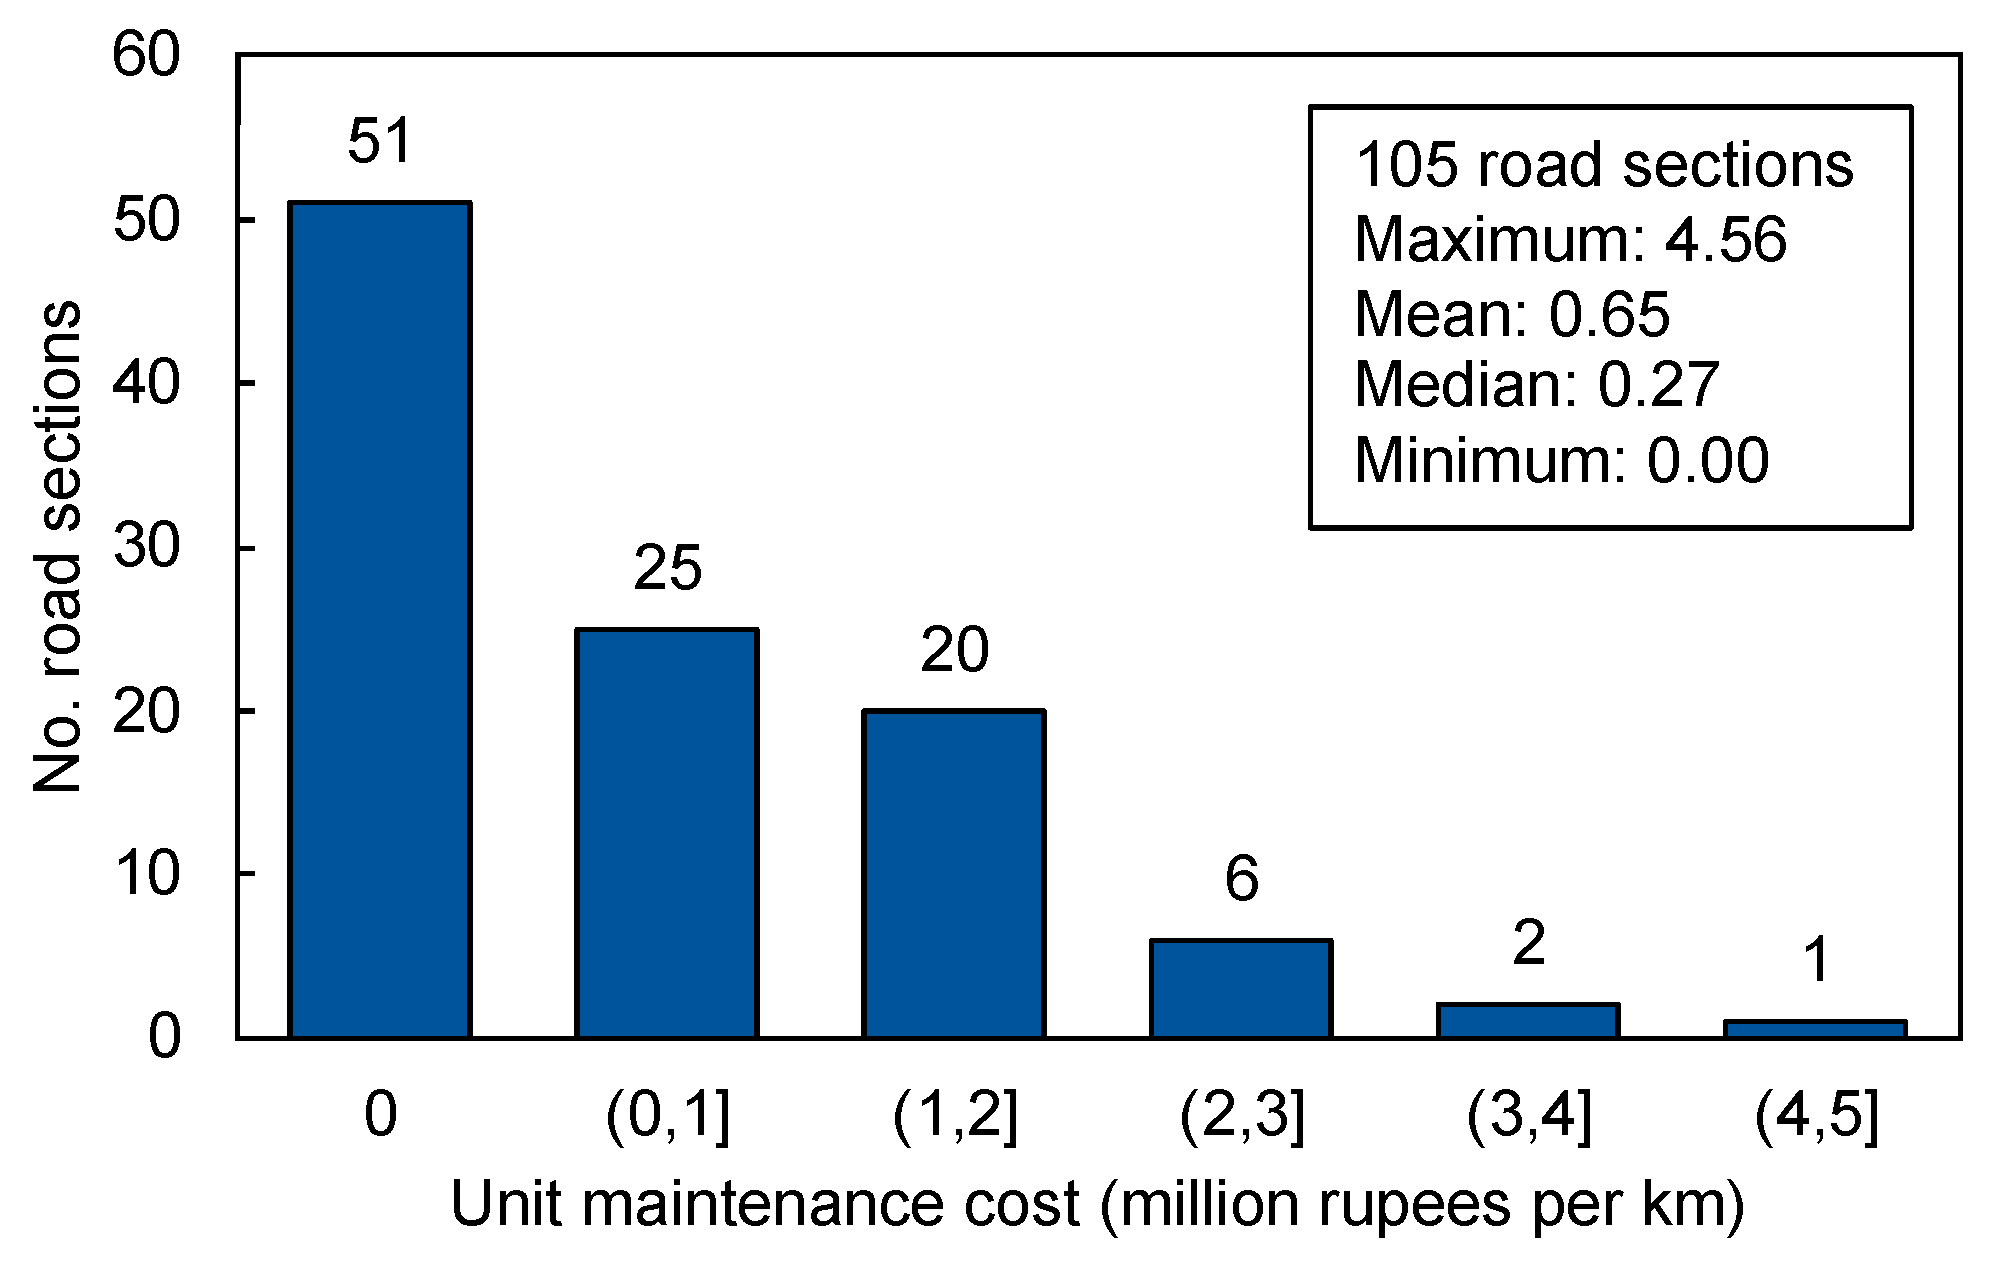
The data used in this research were the provincial highway network data of Khyber Pakhtunkhwa province of Pakistan and were obtained from the Communication and Works (C&W) Department, Peshawar. The provincial highway network consists of approximately 3000 km of road network, which is divided into 105 road sections. At the time of the study, for management purposes, the road network was also divided into four divisions—center, north, east, and south—according to the regional topography. The original data consisted of 23 road attributes, which were then restructured, refined, and validated to obtain the readable data set for the machine learning algorithm. The target variable, unit maintenance cost, was calculated by dividing the total maintenance budget allocated to a road section in 2020–2021 by the length of that section in kilometers. The distribution of this variable is shown in
Figure 3. Of the 105 road sections, 51 (48.6%) received no maintenance budget, whereas 54 (51.4%) were included in the maintenance plan for 2020–2021 and received a non-zero budget amount. Among the 54 road sections included in the maintenance plan, 25 (46.2%) were allocated PKR 1 million per kilometer or less. The mean and median unit maintenance costs in 2020–2021 were PKR 0.65 million and 0.27 million per kilometer, respectively, with a larger mean value reflecting the right-skewed distribution.
Out of the remaining 22 variables, 19 related to maintenance cost were extracted. The selected variables used for analysis consisted of various road-related data such as traffic loading, drainage condition, pavement terrain, road importance, the function of roads, and others. The road condition data were from the year prior to the year in which the maintenance budget was allocated (2019–2020) to find the factors that may have contributed to the selection of the road sections for the maintenance plan or to an increase in the unit cost allocated to a road section.
Table 2 summarizes the variables used for analysis.
The first step after the data collection was to transform the original data into a usable format for statistical analysis. Most of the variables were converted into nominal (categorical) variables, as shown in
Table 2. The original database also contained the years in which maintenance activities were performed or when the road sections were last rehabilitated. These data were converted into time since the last maintenance and time since the last rehabilitation. The database furthermore included the rehabilitation cost for each section, which represent the cost for the entire rehabilitation of the road. As the research was focused on maintenance planning, another variable was introduced to identify roads that may not receive a maintenance budget in 2020–2021 because they were designated to receive a rehabilitation budget in the same year. Once the variables were finalized, the observations with missing data were checked before running the analysis as the machine learning algorithm may fail if the dataset contains missing values.
The problem of missing data can be resolved via different methods such as removing observations with missing values or by imputing the missing value [
27]. In this research, less than 5% of the 105 road sections had data with incomplete information, so these observations were removed from the database before proceeding with the analysis.
3.2. Multicollinearity Test
Before applying the machine learning algorithm, pre-analysis tests were performed on the dataset to check the collinearity among the variables. This is necessary because it is difficult for a model to estimate the relationship between dependent and independent variables when the independent variables change in unison. The collinearity can be checked using correlation and covariance [
28], and it can be said that multicollinearity occurs when the independent variables in the model are correlated.
3.2.1. Correlation Coefficient
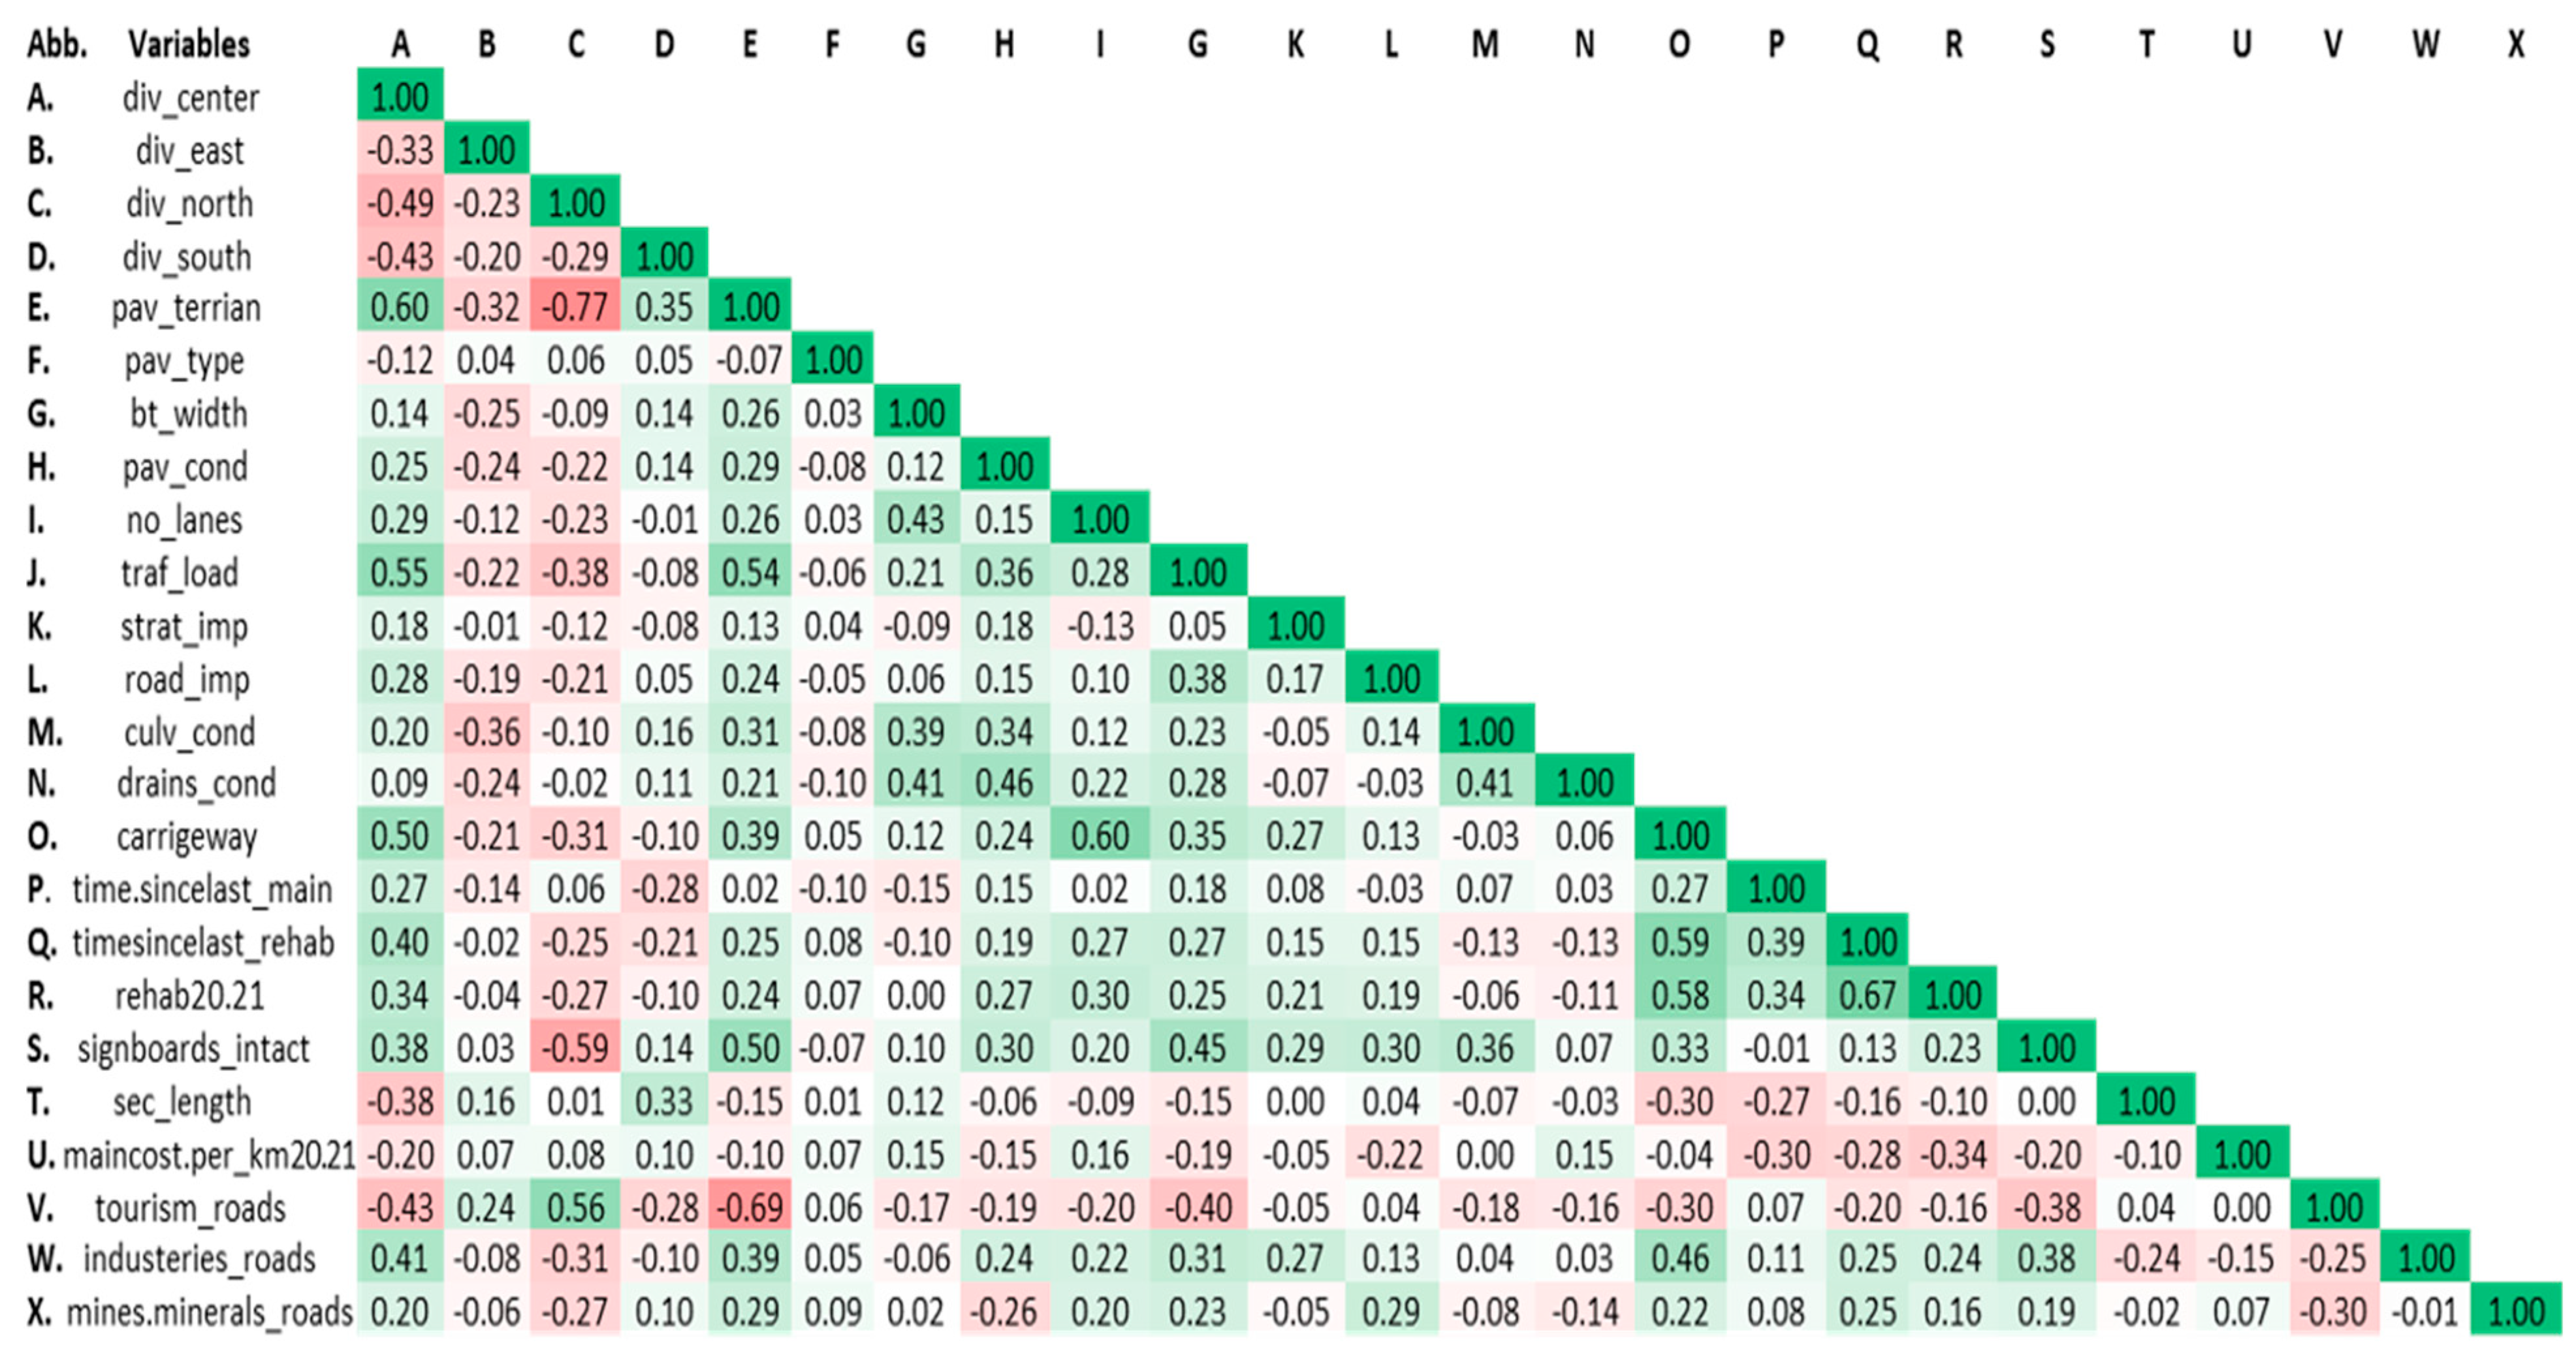
One way to check multicollinearity is to examine the correlation between the independent variables. The range of the correlation coefficient is between −1.0 to 1.0. Variables with a correlation coefficient value close to −1.0 or 1.0 are highly correlated, whereas variables having correlation values close to 0 are regarded as non-correlated [
29]. The correlation matrix using Pearson’s correlation coefficient is shown in
Figure 4. It was observed that the correlation coefficients between all the independent variables are less than 0.7 except between div_north and pav_terrian, which suggests that these two variables may not be independent.
3.2.2. Variance Inflation Factor
To further check the multicollinearity between the independent variables (especially between div_north and pav_terrian), variation inflation factor (VIF) values were calculated to determine whether there is a need to treat the correlated variable data or whether it is within an acceptable limit. Variation inflation factor (VIF) values measure the extent to which one variable is influenced by another variable. It can be calculated by the formula:
where R
2 is the squared multiple correlations from the regression of the predictor variable on the remaining variables. VIF values range from 1 to infinity, and a value greater than 10 is an indicator of high multicollinearity between variables [
30]. The VIF values calculated for the independent variables are shown in
Table 3. The VIF values for all independent variables were found to be less than 10, which confirmed that there was no significant collinearity between the variables. Furthermore, the dummy variable trap was encountered during the VIF analysis for variables related to division, and this issue was addressed by removing the variable div_east. Finally, the variables were fixed, and the next step was to apply the decision tree algorithm.
3.3. Decision Tree Analysis
Finally, decision tree analysis was performed on the data to reverse-engineer the budget allocation strategies. In this research, the classification and regression tree (CART) algorithm was adopted because it was the most suitable for solving problems with the different types of data in this study. The analysis was carried out with R (R Core Team, 2022), and the package used for CART was Recursive PARTitioning, abbreviated as rpart [
31]. The computational metric in the rpart algorithm is the Gini coefficient (GI). The Gini Index is used for estimating the indicators and can be defined as follows. If dataset (
D) contains
n samples and
Pj is the relative probability of the sample of category
j in
D, then:
The classification and regression problem consists of four components [
32]. The first component is an outcome or dependent variable. According to the conceptualization framework, either the nominal value or continuous value of the variable “unit maintenance cost” was taken as the dependent variable in the case of classification or regression analysis, respectively. The second component is the independent variables or predictors, which are potentially related to the outcome variable of interest. These were the 19 independent variables, previously listed in
Table 2. The third component is the learning or training dataset, which includes values from both the dependent and independent variables. The fourth and final component is the test or future dataset that consists of variables for which prediction is desired. In this study, a 70:30 ratio was used to divide the data into training and testing groups. The first set, which contained 70% of the records, was used to train the decision tree model, and the remaining 30% were used to evaluate the performance of the decision tree model. The accuracies of the models were also checked by validating the model by using the testing data.
As no information was available regarding the framework guiding the budget allocation decision making, two different conceptualizations were explored (
Table 4). In the first conceptual framework, the budget allocation was modeled as a two-step process. First, the classification analysis was performed to find the factors that led to a road section being selected to receive (or not receive) a maintenance budget in the year 2020–2021. For this purpose, the classification tree model DTM 1a was developed, in which the target variable “unit maintenance cost” was treated as a nominal variable with 0 representing “Not Received Budget” and 1 representing “Received Budget”. Next, the factors that affected the amount of maintenance cost received were examined only for road sections that were found to have a “Received budget”. For this purpose, the regression tree model DTM 1b was developed, in which “unit maintenance cost” was taken as the target variable consisting of continuous positive values.
The second conceptual framework, DTM2, consisted of just a one-step allocation process, wherein regression analysis was performed on the entire dataset with the target variable “unit maintenance cost” treated as a continuous, non-negative value. This framework aimed to reveal the factors that affected the budget allocation when the decision to allocate or not allocate and the amount to allocate were decided in a single process.
4. Results and Discussion
The results of the decision tree analyses with the CART algorithm are shown in
Figure 5a,b for framework 1 (DTM 1a and DTM 1b) and in
Figure 6 for framework 2 (DTM 2). The accuracy of the classification tree DTM 1a was checked with a confusion matrix produced using the test data, and the model prediction accuracy rate was found to be 71%. In the case of the two regression trees, the mean square error (MSE) was calculated to determine how well the decision tree performed on the test data. A model with a low MSE is considered to have better predictive power [
33]. For the regression tree model DTM 1b, the MSE values for the original tree and pruned tree were found to be 1.6 and 2.0, respectively, so the original tree with a lower MSE value was used for further analysis. For model DTM 2, the MSE value for the original tree was found to be 0.3, which was less than the MSE value of 0.6 for the pruned tree, so the original tree was used. The assessment and interpretation of each model are discussed in detail in the following sections.
4.1. Framework 1 (Two-Step Budget Allocation Process)
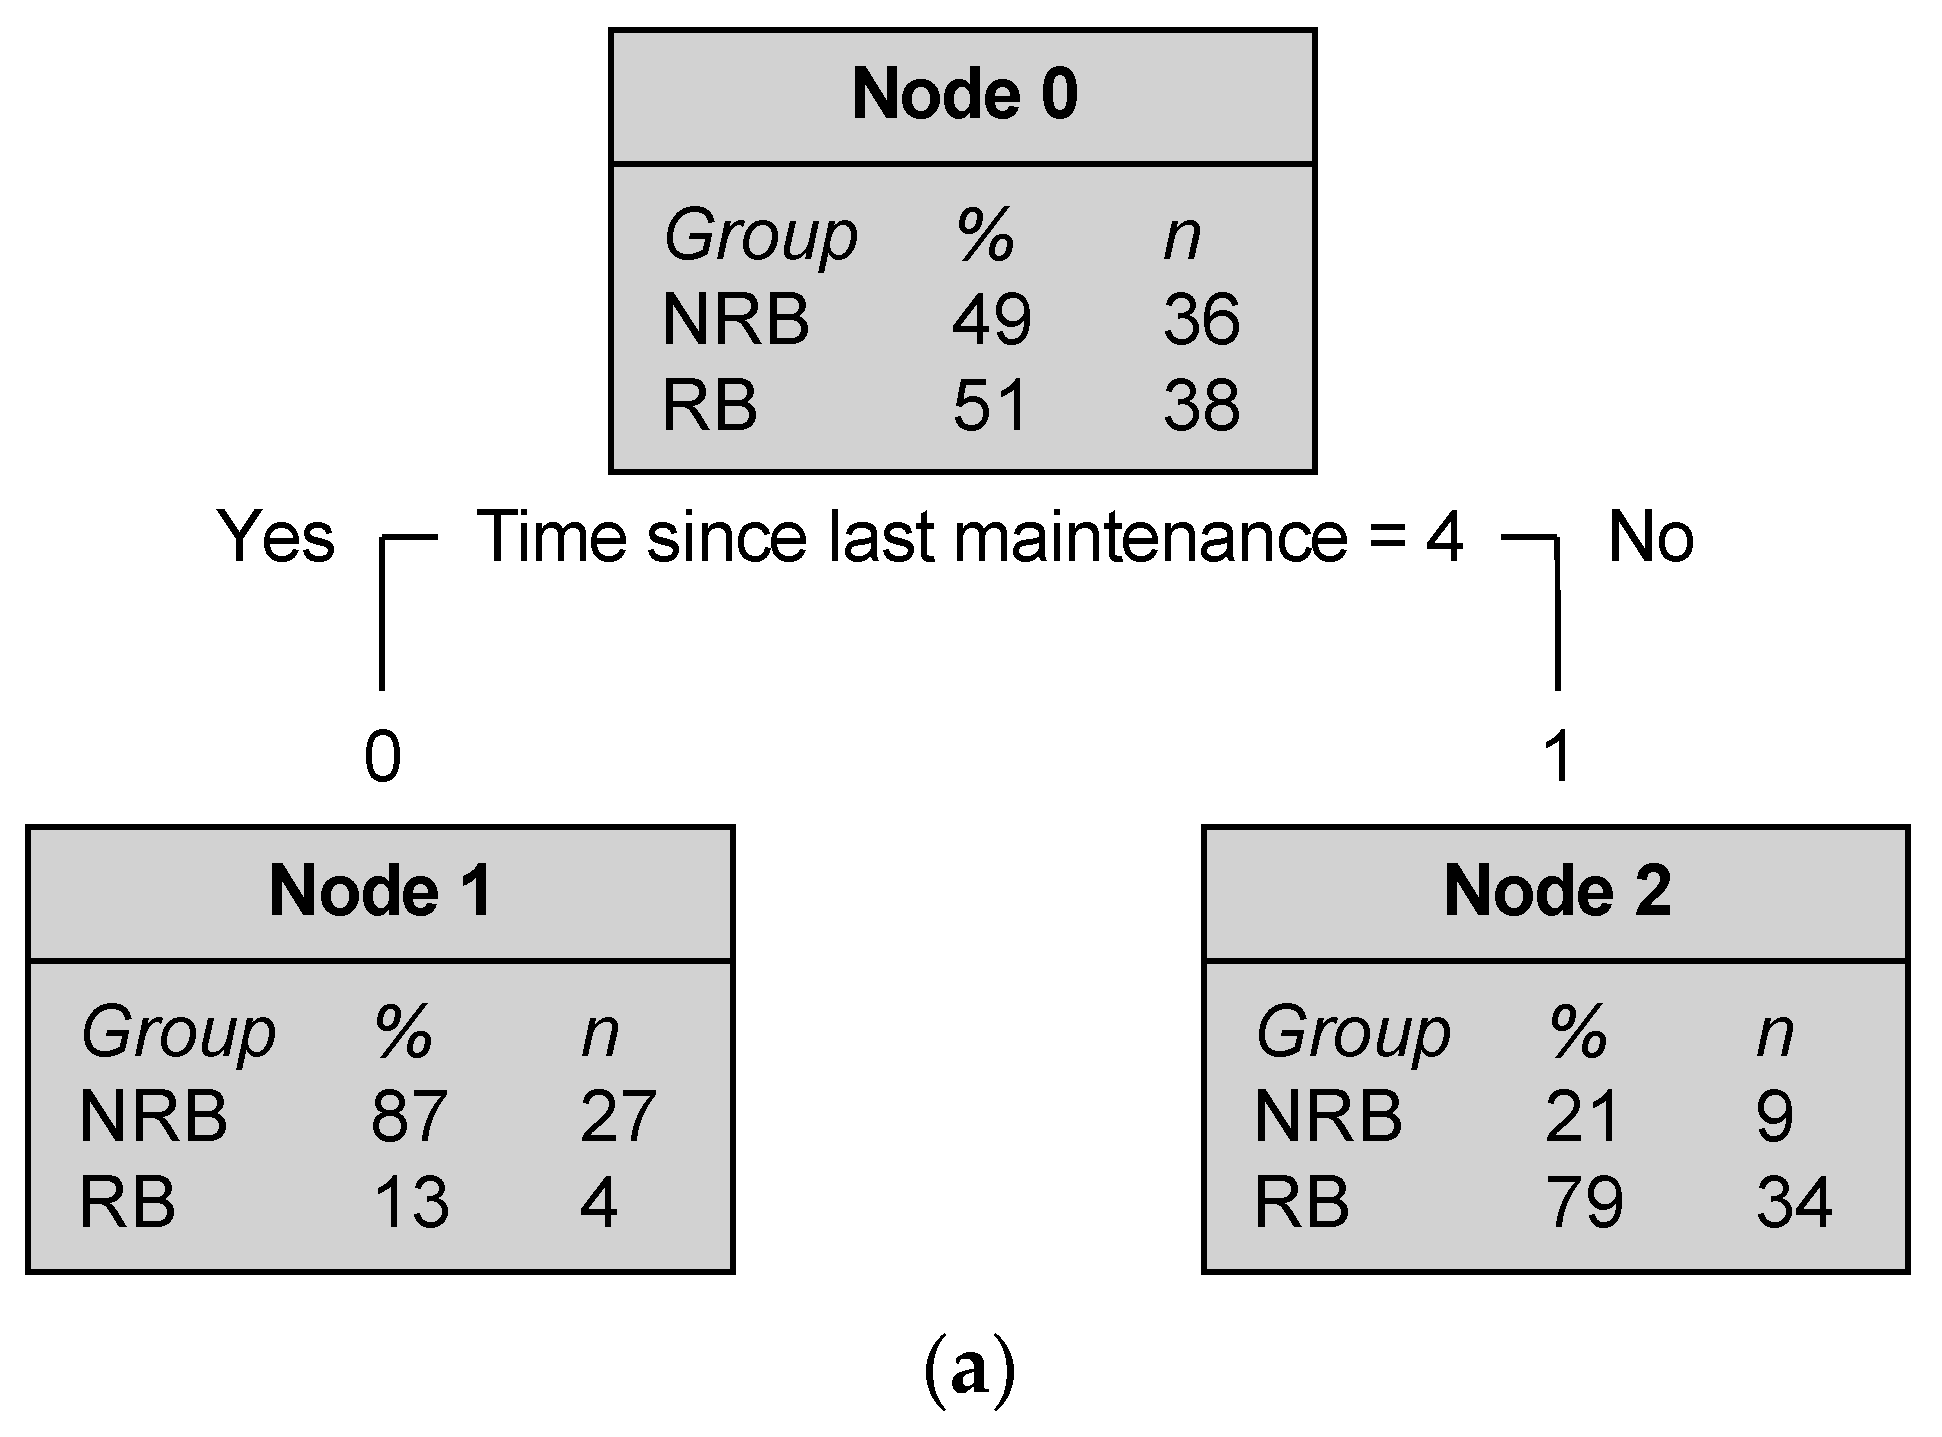
The classification tree DTM 1a (
Figure 5a) modeled the decision in which the “unit maintenance cost” was taken as a nominal variable, with 0 representing road sections for which no budget was allocated and 1 representing the road section for which the budget was allocated. The results of DTM 1a show that the first and only rule in the decision tree was the time since the road was last maintained. The model predicted that road sections that received the maintenance budget in the last three years were selected for the maintenance plan in the year 2020–2021, and road sections that last received maintenance more than three years ago or an unknown number of years ago were not selected to receive maintenance budget in 2020–2021. Node 0 of model DTM 1a shows the breakdown of road sections that received (51%) or did not receive (49%) funds from the maintenance budget among the 70% of road sections that comprised the training dataset. Node 1 shows that, of the 31 road sections that last received maintenance more than three years ago or an unknown number of years ago, 87% were not considered in the maintenance planning in 2020–2021. Conversely, Node 2 shows that 79% of the 43 roads that received maintenance budget within the last three years also received maintenance budget in 2020–2021.
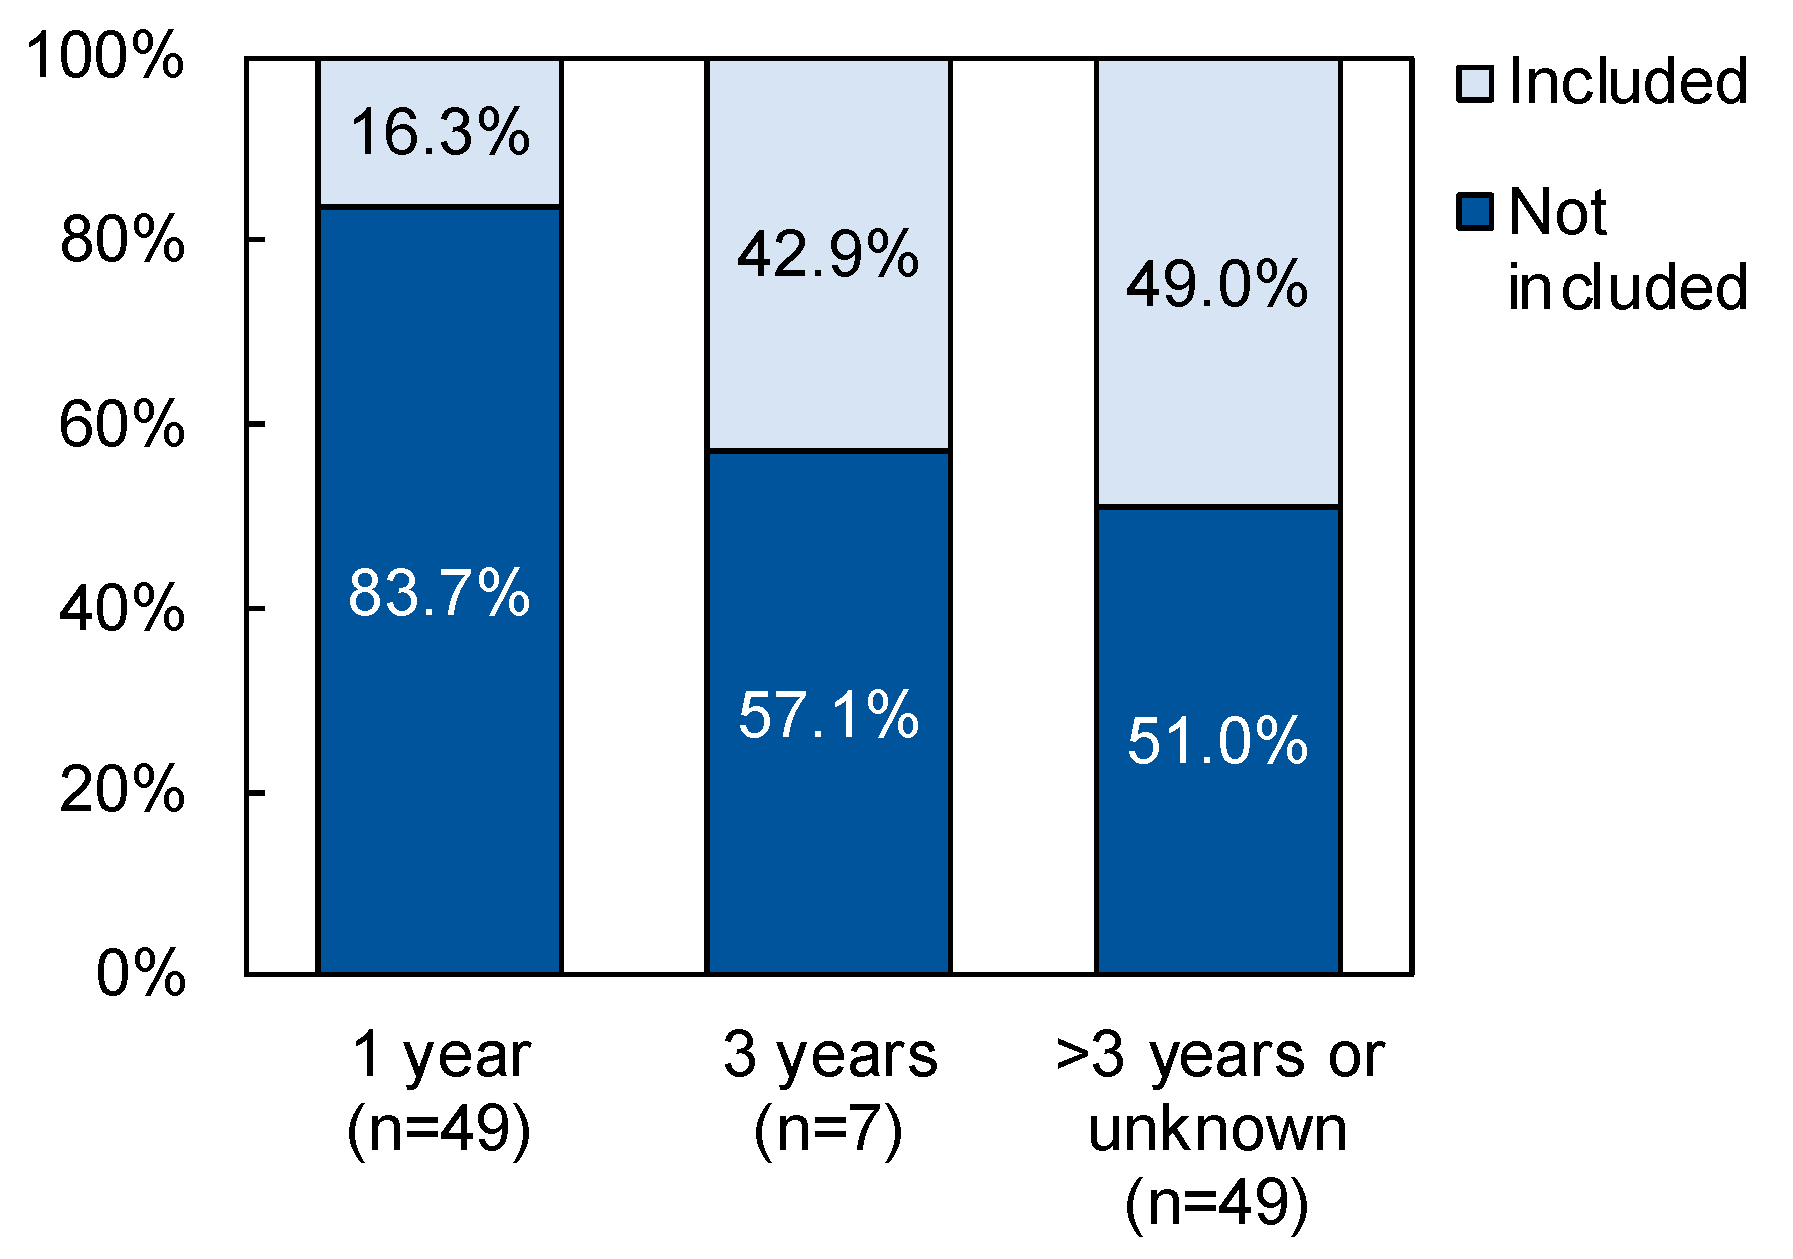
The result of DTM 1a was unexpected, as it was anticipated that road sections that were not maintained recently would be more likely candidates to receive a maintenance budget. It was theorized that one reason why such roads were not included in the maintenance planning was because they were designated to receive a rehabilitation budget instead, which would lead to the full restoration of the road section, rather than just routine maintenance activities. To explore this hypothesis further, the relationship between time since the last maintenance and inclusion in the rehabilitation plan of 2020–2021 was examined (
Figure 7). It was found that the likelihood of a road section being included in the rehabilitation plan increased with an increase in the time since the last maintenance (
p < 0.01), with nearly 50% of roads that last received maintenance more than three years ago or an unknown number of years ago designated to receive a rehabilitation budget in 2020–2021.
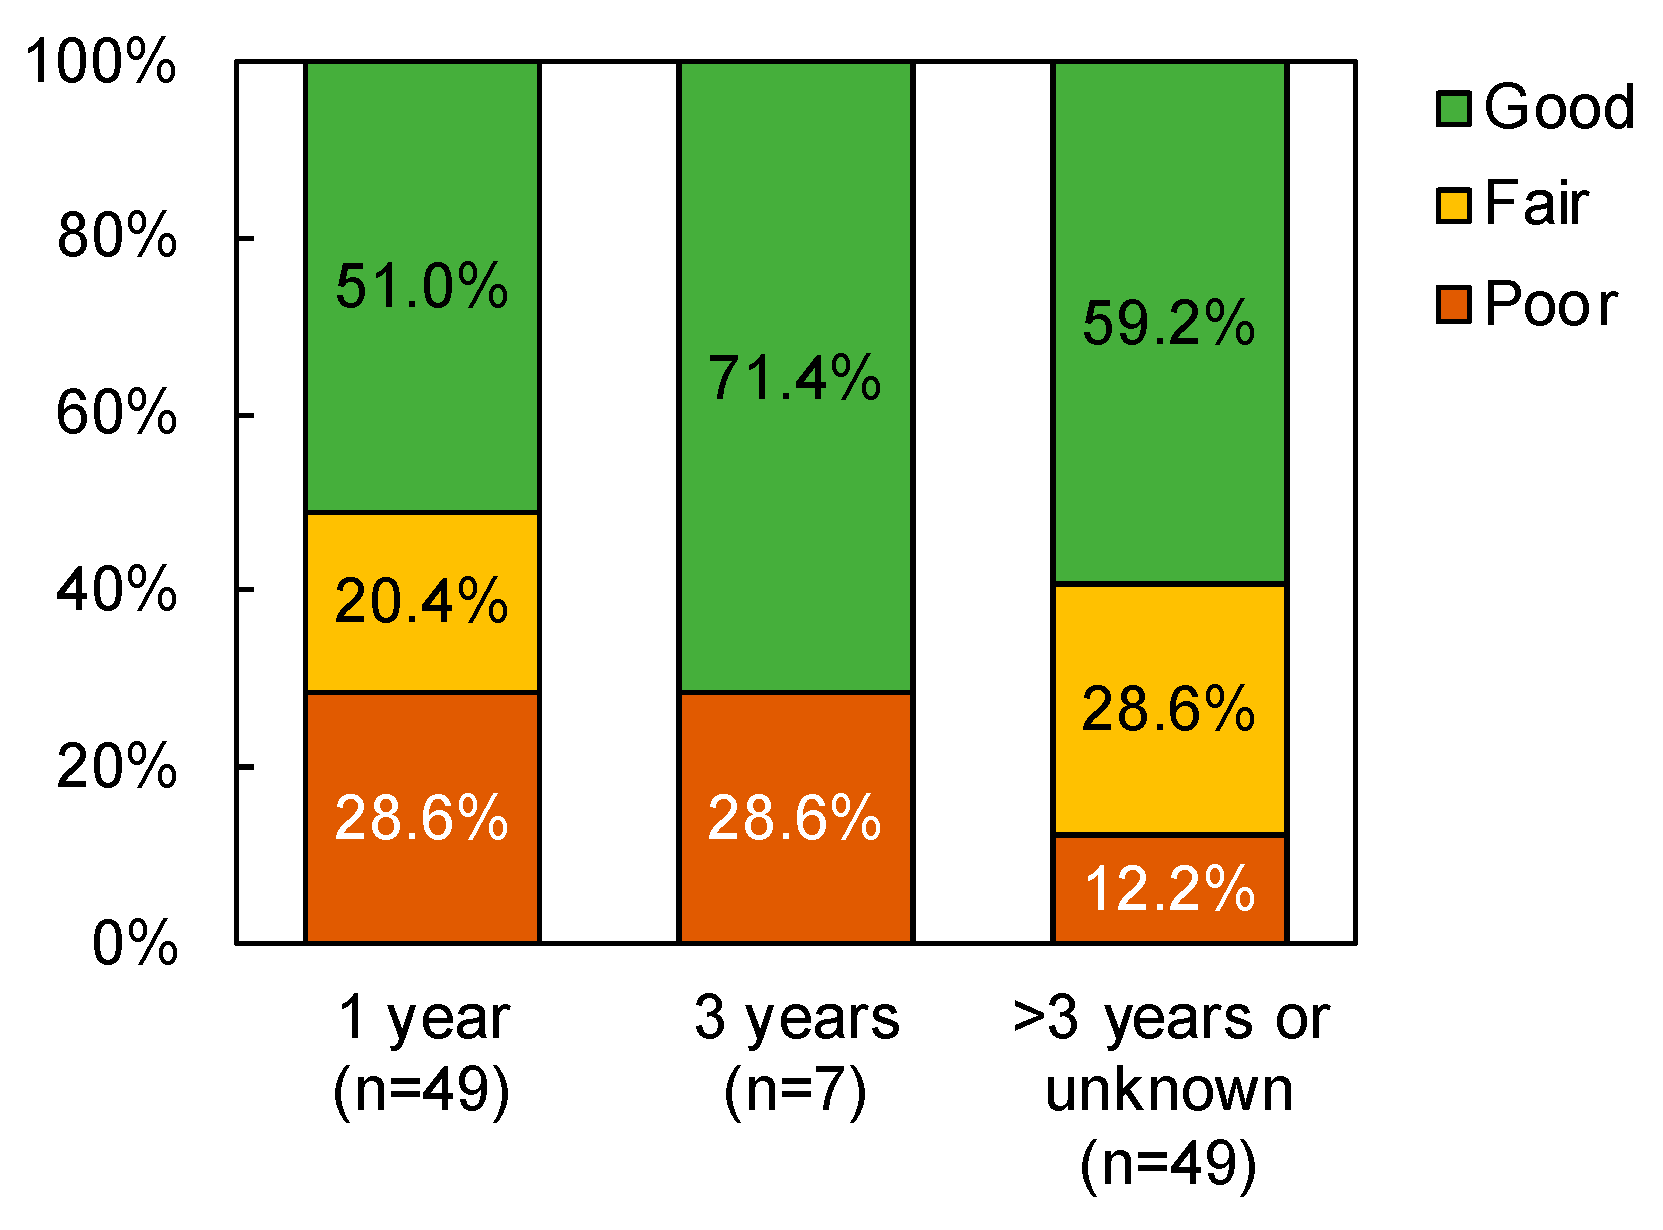
Model DTM 1a was developed to clarify what factors led to road sections being selected to receive or not receive a maintenance budget in 2020–2021. It was found that selection could be attributed to the time since the last maintenance activity was performed, but this variable is not necessarily an indicator of the pavement condition. As rational maintenance planning should be based on the actual condition of the road sections, an additional cross-tabulation analysis with a chi-square test was conducted to determine whether the time since the last maintenance was associated with pavement condition. The results, shown in
Figure 8, confirm that there is no significant association (
p > 0.05) between these two variables; furthermore, the percentage of road sections in fair or poor condition that had undergone maintenance just one year ago (49.0%) were not notably different from the percentage of road sections in fair or poor condition that underwent maintenance more than three years ago or an unknown time ago (40.8%). Consequently, it can be concluded that the selection of road sections for inclusion in maintenance planning may not be optimal, as the time since the last maintenance is not reflective of the actual pavement condition.
- b.
Model DTM 1b (amount of budget allocated)
Once it was determined how road sections were selected for the maintenance plan for 2020–2021, the regression tree DTM 1b (
Figure 5b) was developed to identify the factors that affected how much budget was allocated to those roads included in the maintenance plan. The target variable for this analysis was “unit maintenance cost” as a continuous positive value. The resulting decision tree comprised rules determined by two variables: road importance and mines and minerals roads. In Node 0, among the 37 road sections sampled for training the regression tree, the average unit maintenance budget was PKR 1.1 million per kilometer. Road importance split this group into two: Node 1, which contained 29 road sections of high importance and an average unit maintenance cost of PKR 0.96 million per kilometer, and Node 2, which contained just eight road sections of lower importance and an average of PKR 1.4 million per kilometer. It can be further noted that Node 2 is a terminal node, and that lower road importance is the sole predictor of the largest amount of maintenance budget allocation.
Node 1 is further split into Nodes 3 and 4 based on whether the road sections lead to mines and minerals areas or not. It was observed that the average unit maintenance cost of road sections leading to mines and mineral areas (PKR 1.1 million per kilometer) is more than the average budget allocated to road sections that do not lead to mines and minerals areas (PKR 0.78 million per kilometer). This factor may be related to the heavily loaded traffic traveling from mines and minerals areas, as Khyber Pakhtunkhwa is famous for its marble industry and quarries of water-bound macadam, crushed stone, and other minerals. Hence, the overloading and subsequent deterioration of pavement resulting from the transport of these materials may lead decision makers to allocate more budget to road sections that serve these areas.
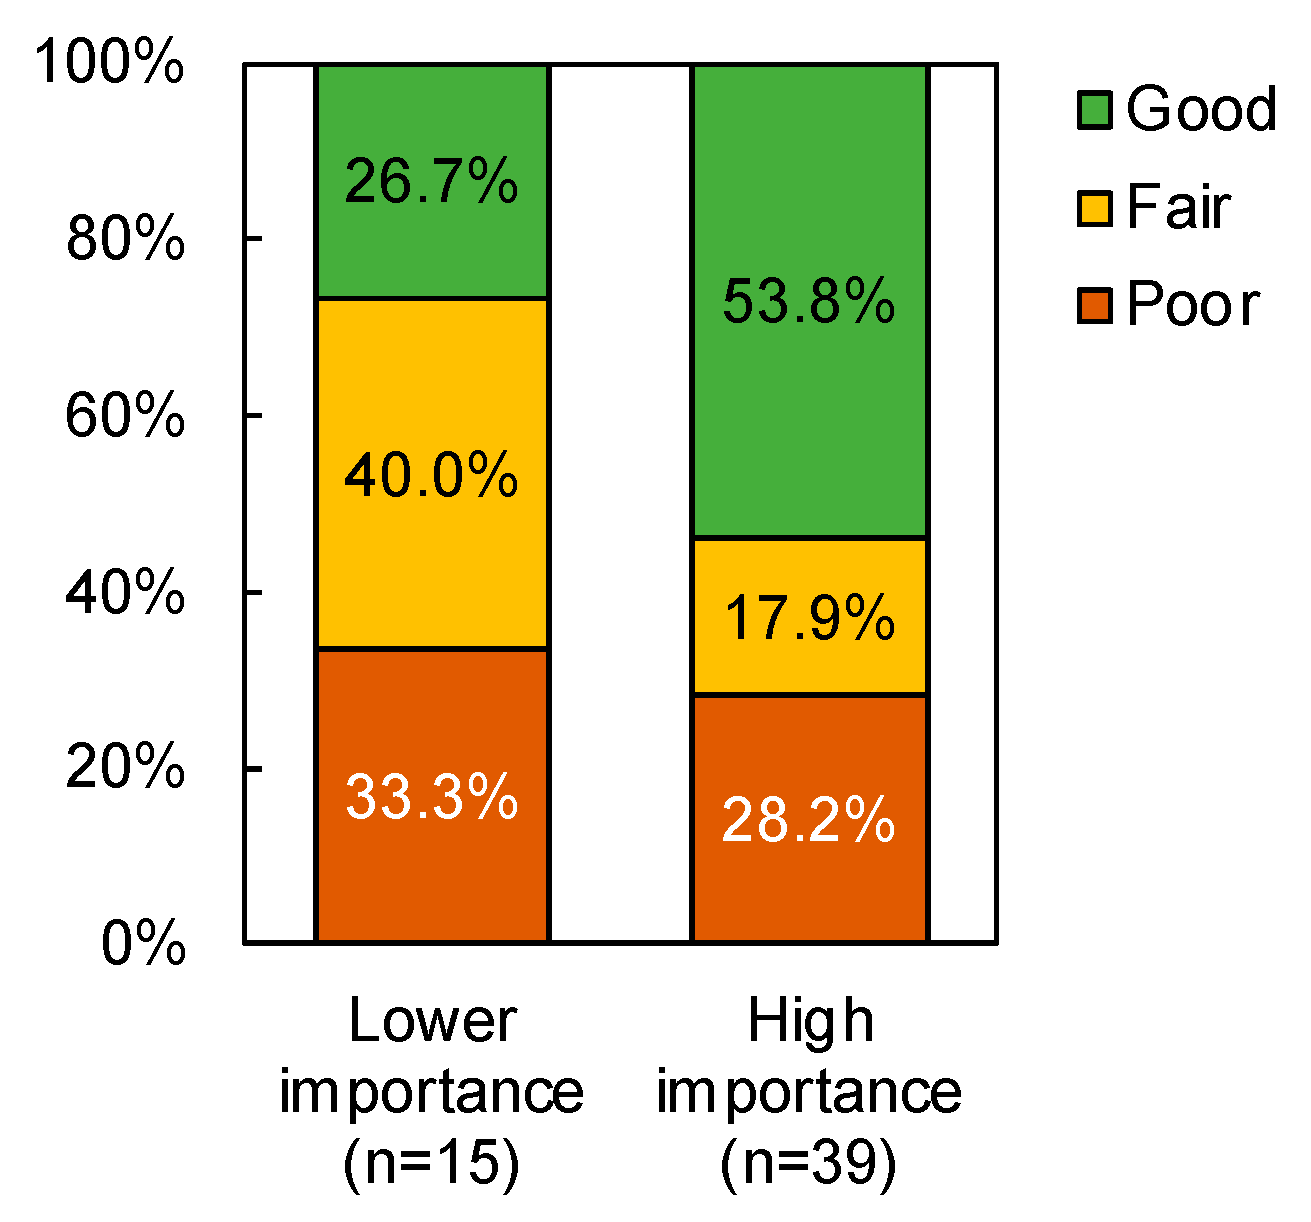
Model DTM 1b was developed to determine the factors that contributed to how much budget road sections included in the maintenance plan would receive. It was found that lower road importance led to a larger unit maintenance budget; furthermore, among roads with high importance, it was found that roads leading to mines and minerals areas received a larger unit maintenance budget. However, it can be seen that road condition was not a determining factor in the amount of budget allocated, so cross-tabulation was again carried out to examine whether the two aforementioned factors are associated with pavement condition. As shown in
Figure 9, no significant relationship (
p > 0.05) was found between road importance and pavement condition for roads included in the maintenance plan.
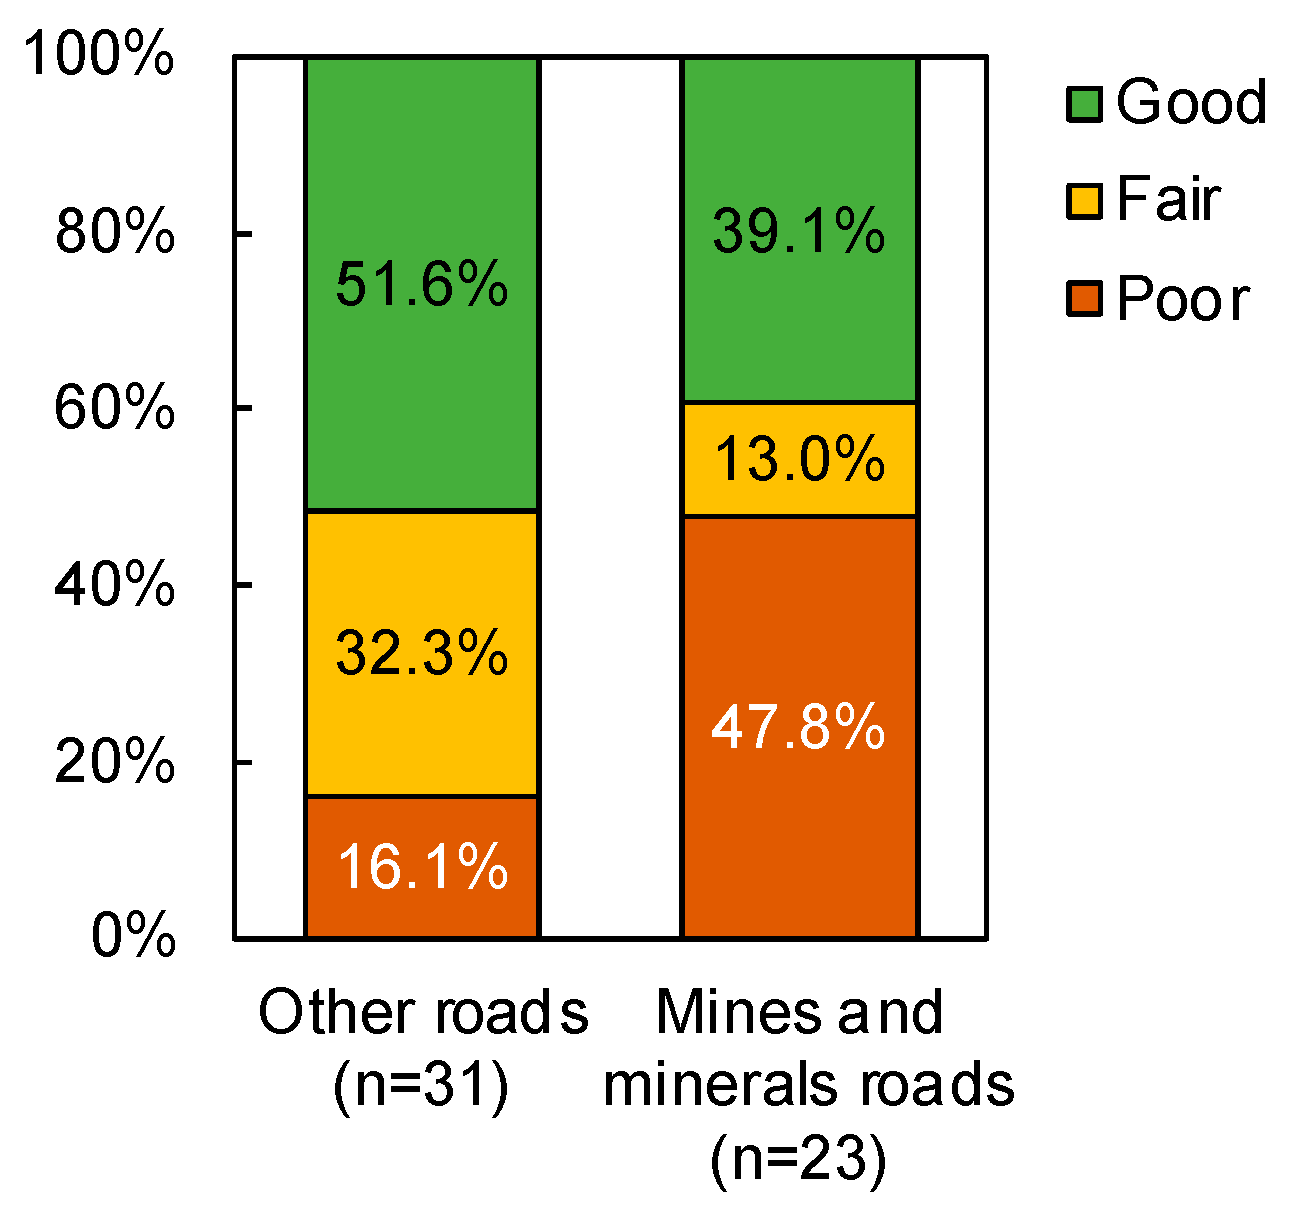
On the other hand, a significant association (
p < 0.05) was found between mines and minerals roads and pavement condition, with 47.8% of mines and minerals roads in poor condition, compared to just 16.1% for other road types (
Figure 10). Therefore, although mines and minerals roads are not a direct indicator of pavement condition, they may be assumed as a possible proxy for road condition due to the heavy usage these roads receive.
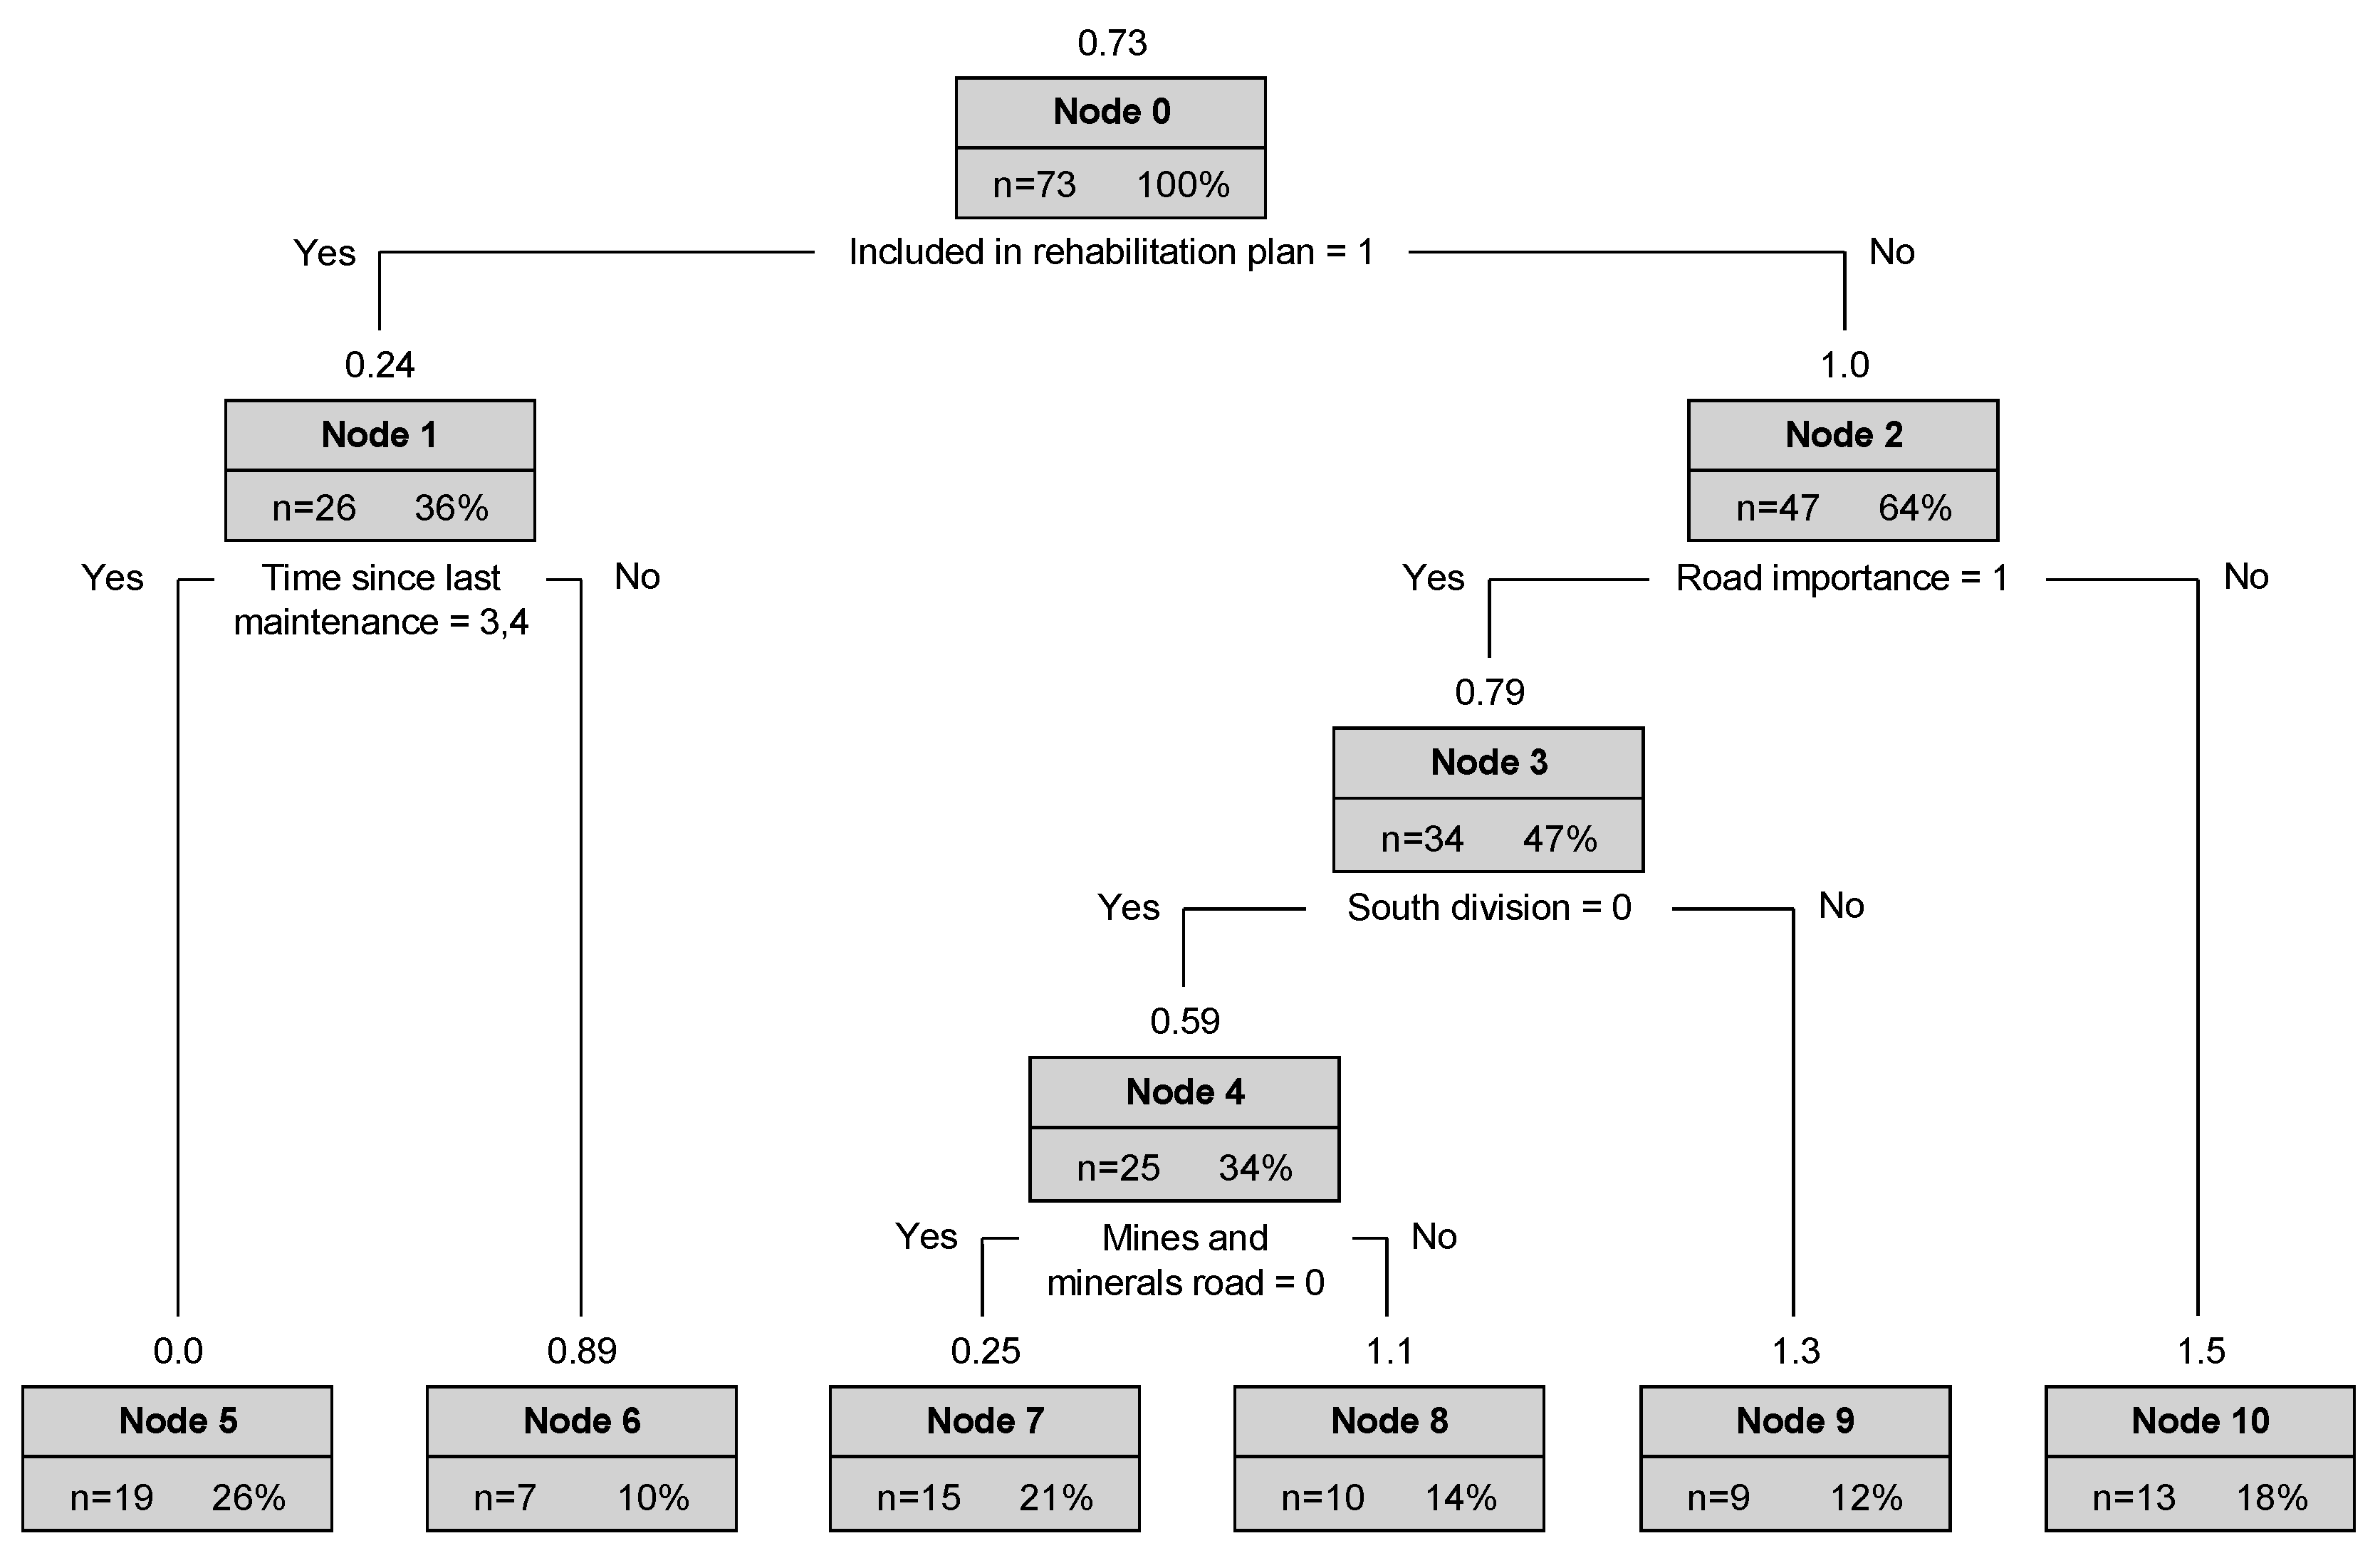
4.2. Framework 2 (DTM 2, One-Step Budget Allocation Process)
Model DTM 2 was developed based on the conceptualization of the budget allocation as a one-step process. Following this conceptualization, regression tree analysis was carried out treating the target variable “unit maintenance cost” as a non-negative value. This conceptualization thus differs from model DTM 1b in that zero values for the road sections that were not included in the maintenance plan in the year 2020–2021 were treated as inputs together with the non-zero values for road sections that were included in the maintenance plan.
The result of model DTM 2 (
Figure 6) shows that the first-level rule was an inclusion in the rehabilitation plan, with the 26 road sections designated to receive a rehabilitation budget in 2020–2021 receiving less maintenance budget on average (PKR 0.24 million per kilometer) than the 47 road sections that were not included in the rehabilitation plan (PKR 1.0 million per kilometer). The second-level rules were time since last maintenance (Node 1) and road importance (Node 2), with larger maintenance budgets allocated, on average, to roads that were maintained within the last one year and roads with lower importance, respectively. It can be seen that these results are similar to those found in the other models (DTM 1a and DTM 1b) following the two-step budget allocation process—especially Node 5, which predicts a unit maintenance cost of zero (all observations in this node received zero budget) based only on inclusion in the rehabilitation plan and time since last maintenance, which were previously shown to be significantly associated. It can furthermore be seen that Nodes 5 and 6 are leaf nodes, and thus just the two aforementioned features are sufficient for predicting the allocated unit maintenance cost for roads that fall within these nodes. On the opposite side of the decision tree, Node 10 predicts the highest average unit maintenance cost (PKR 1.5 million per kilometer) from just two features: non-inclusion in the 2020–2021 rehabilitation plan and low road importance. This result also echoes model DTM 1b, wherein road importance was the major distinguishing factor for determining how much maintenance budget would be allocated.
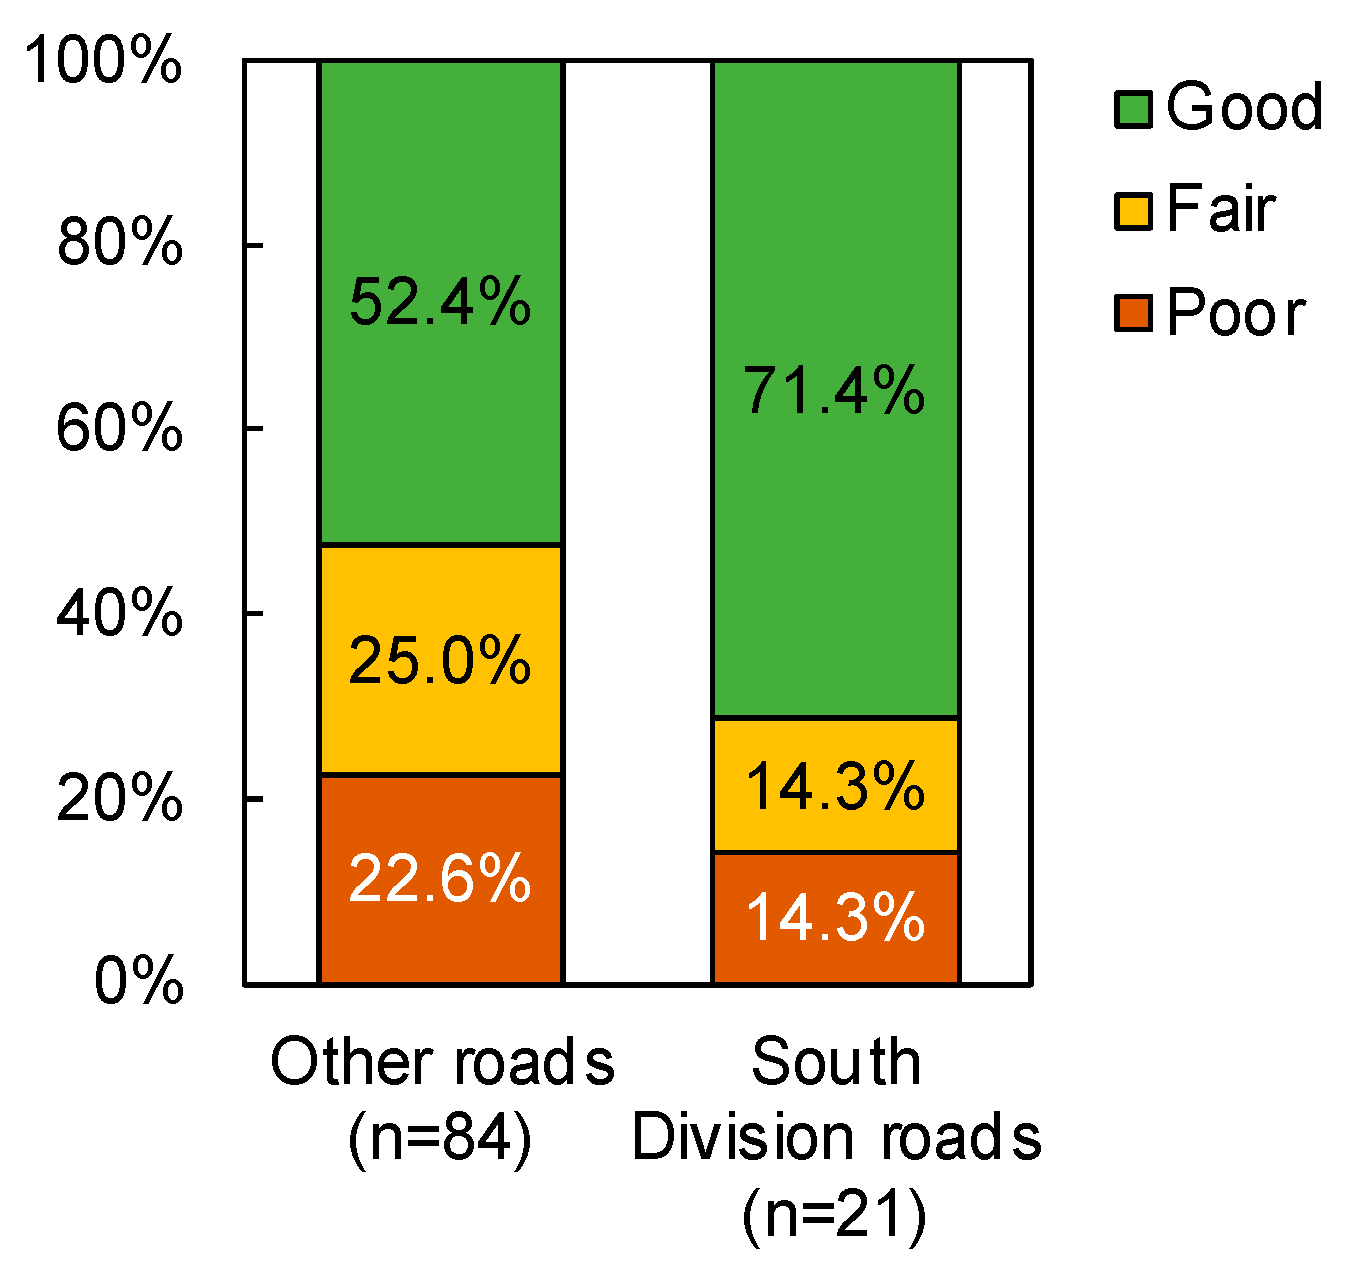
The third level rule below Node 2 was the feature “South division”, with road sections in this division having a larger unit maintenance cost on average (PKR 1.3 million per kilometer) than those in other divisions (PKR 0.59 million per kilometer). This is the only regional factor that appears in any of the decision tree models and suggests that there is also a topographical aspect to the maintenance budget allocation. The south division is comparatively more temperate than the other divisions in Khyber Pakhtunkhwa province, and the environmental exposure of pavements is less severe than in the hilly or mountainous regions of the north and eastern divisions. On the other hand, roads in the south division are more subject to damage from flash floods than roads in the other divisions, and there are many important industrial highways. However, in general, there is no significant relationship (
p > 0.05) between pavement condition and roads belonging to the south division (
Figure 11).
Finally, road sections not in the south division (Node 04) were further split according to whether they lead to mines and mineral areas (Nodes 7 and 8). As was also seen in model DTM 1b, road sections that do not lead to mines and mineral areas received less maintenance budget on average (PKR 0.25 million per kilometer) than those that lead to mines and minerals areas (PKR 1.1 million per kilometer). It was previously determined that there is a significant relationship between mines and minerals roads and pavement condition just for roads included in the 2020–2021 maintenance plan; a follow-up analysis confirmed that this relationship remains significant for all road sections as well (p < 0.05). Therefore, mines and minerals roads may be considered a proxy for pavement condition at the network level.
The regression tree model DTM 2 was developed based on the conceptualization of maintenance budget allocation as a one-step process. This model predicted that the distribution of the 2020–2021 maintenance budget to the road sections was performed based on just five factors: inclusion in or exclusion from the rehabilitation plan of the same year, time since the last maintenance was performed, road importance, belonging to the south division (or not), and being a mines and minerals road (or not). Although two different approaches were taken for conceptualizing and analyzing the maintenance budget allocation process, a high degree of similarity could be found in the results obtained by the two different approaches. Time since last maintenance, road importance, and mines and minerals roads were common rules observed in both frameworks. Furthermore, inclusion in the rehabilitation plan, which only appeared in the one-step allocation process model DTM 2, was found to be significantly associated with the time since maintenance, and thus its explicit appearance was not unexpected after analysis of the results obtained from the two-step allocation process model DTM 1a. Only the south division stands alone as a unique discriminating rule in model DTM 2.
5. Implications and Significance
The objective of this research was to explore the applicability of the PDCA maintenance approach combined with machine learning for evaluating decision making in highway maintenance, with the ultimate goal of demonstrating this approach as a technique for realizing data-driven highway network management. Towards this goal, the road maintenance budget allocation of the provincial highway network of Khyber Pakhtunkhwa province, Pakistan, was reverse-engineered, utilizing a decision tree algorithm, a supervised machine learning technique, to find the hidden factors associated with the budget allocation process in the target year of analysis. Two different conceptual frameworks were adopted; however, the results of both analyses revealed that characteristics other than the pavement condition were the main factors associated with budget allocation. This may be due to the absence of a data-driven maintenance planning strategy. Currently, the maintenance plan of the provincial highway network is primarily based on subjective considerations, such as decision makers’ perspectives on priority factors, rather than the actual condition of the roads, and thus there is little practical utilization of data for improving maintenance strategies. However, as proposed by the PDCA concept, it is essential to incorporate evidence-based and data-driven decision making based on the actual road conditions to continually improve the maintenance planning for provincial highways.
Both frameworks utilized in this study have their advantages. The two-step process first identifies the road sections that should receive a budget and then, based on their condition and other associated characteristics, budget allocation is carried out. This approach may be helpful for decision makers to make certain that the most critical road sections are given priority during budget allocation. However, in the one-step process, decision makers can allocate the budget more evenly among all the road sections of the network. Although some road sections may receive zero budget, this approach ensures that every road section was considered for inclusion in maintenance planning and that the budget was not just allocated to the most critical sections. Both approaches have their merits, and road authorities may utilize either of them based on their preferred maintenance approach. However, regardless of the approach chosen, it is important to make the decision making transparent so that it can be confirmed that the budget allocation was carried out according to rational maintenance planning.
It was also shown that decision tree analysis is an effective approach for evaluating an existing maintenance plan, as well as exploring improvements for future maintenance following the PDCA concept. The framework can assist road authorities in regularly evaluating their current maintenance strategy by extracting the factors that drive the decision making when the budget allocation process is not explicitly defined, the results of which may point towards more effective maintenance planning in the future. Furthermore, while this research demonstrated how to evaluate the decision-making process when data-driven strategies were not adopted, future studies may confirm the validity of the approach proposed here by analyzing datasets where data-driven models, such as pavement life cycle assessment (LCA) and life cycle cost analysis (LCCA), were actually used for decision making. By applying the same reverse-engineering approach, the factors defining budget allocation can be extracted and evaluated to confirm that the actual pavement condition and associated data were reflected in the decision-making process.
6. Limitations
Certain limitations were observed that should be considered when interpreting the research findings. One major limitation was the non-uniformity of the lengths of the road segments in the available database. As the conditions and characteristics of longer road segments may be more heterogeneous than shorter segments, it is more likely that the actual road characteristics are not accurately represented by the generalized conditions and characteristics recorded in the database. As a result, there may exist other, hidden factors related to the budget allocation that cannot be fully extracted at this level of data resolution. Unfortunately, the analysis presented here was limited by the data availability, but, for more effective analysis, it is recommended to analyze road segments of shorter length, which should be better represented by their conditions and characteristics. This may improve the accuracy of the model by identifying more detailed factors, thus leading to more valuable findings for improving maintenance planning.
7. Conclusions
This research demonstrated a new data-driven approach for improving highway management by reverse-engineering the factors relevant to budget allocation during the maintenance planning of a highway network. The PDCA approach to maintenance and the decision tree algorithm were adopted to identify and evaluate the factors affecting the maintenance budget allocation of the provincial highway network of Khyber Pakhtunkhwa province, Pakistan, considering two different conceptual decision-making frameworks: a two-step process that first determined which road sections would receive a budget, followed by the allocation of a budget to the selected roads and a one-step process, wherein the budget was distributed to all road sections simultaneously. Both frameworks resulted in the identification of similar factors relating to the budget allocation for the provincial highway network. However, the fact that the pavement condition was not obtained as a factor indicates that the maintenance planning should be improved to reflect a data-driven approach. The utilization of decision tree analysis for exploring the budget allocation factors was aligned with the check phase of the PDCA concept for the objective assessment and monitoring of maintenance factors for improvement in future planning. This research demonstrated that decision tree analysis is an effective tool for critical examination of decision making in road infrastructure management, and the results presented here may serve as an example for road authorities looking to improve their practices and move towards more data-driven maintenance planning.
Author Contributions
Conceptualization, A.A. and M.H.; Methodology, A.A. and M.H.; Validation, A.A.; Formal analysis, A.A.; Data curation, A.A.; Writing—original draft, A.A.; Writing—review & editing, A.A. and M.H.; Supervision, M.H. All authors have read and agreed to the published version of the manuscript.
Funding
This research was supported by a scholarship for road asset management from the Japan International Cooperation Agency (JICA).
Acknowledgments
The authors would like to express their gratitude to JICA for making this study possible, and to Pakhtunkhwa Highway Authority, Communication and Works Department, Peshawar, Pakistan, for sharing the budget data and other requisite information.
Conflicts of Interest
The authors declare no conflict of interest.
References
- Brewer, K.A. AASHTO Maintenance Manual for Roadways and Bridges; Aashto: Washington, DC, USA, 2007. [Google Scholar]
- Piryonesi, S.M.; El-Diraby, T.E. Data analytics in asset management: Cost-effective prediction of the pavement condition index. J. Infrastruct. Syst. 2020, 26, 04019036. [Google Scholar] [CrossRef]
- Chen, L.; Bai, Q. Optimization in decision making in infrastructure asset management: A review. Appl. Sci. 2019, 9, 1380. [Google Scholar] [CrossRef]
- Bai, Q.; Labi, S.; Sinha, K.C. Trade-off analysis for multiobjective optimization in transportation asset management by generating Pareto frontiers using extreme points nondominated sorting genetic algorithm II. J. Transp. Eng. 2012, 138, 798–808. [Google Scholar] [CrossRef]
- Chen, L. Development of a Multi-Objective Optimisation Technique for Long-Term and Network-Level Decision Making in Infrastructure Asset Management. Ph.D. Thesis, The University of Auckland, Auckland, New Zealand, 2016. [Google Scholar]
- Fwa, T.F.; Tan, C.Y.; Chan, W.T. Road-maintenance planning using genetic algorithms. II: Analysis. J. Transp. Eng. 1994, 120, 710–722. [Google Scholar]
- Mbwana, J.R.; Turnquist, M.A. Optimization modeling for enhanced network-level pavement management system. Transp. Res. Rec. 1996, 1524, 76–85. [Google Scholar] [CrossRef]
- Fwa, T.F.; Shanmugam, R. Fuzzy logic technique for pavement condition rating and maintenance-needs assessment. In Fourth International Conference on Managing Pavements; National University of Singapore: Singapore, 1998; Volume 1. [Google Scholar]
- Mahpour, A.; El-Diraby, T. Application of Machine-Learning in Network-Level Road Maintenance Policy-Making: The Case of Iran. Expert Syst. Appl. 2022, 191, 116283. [Google Scholar] [CrossRef]
- Han, C.; Ma, T.; Xu, G.; Chen, S.; Huang, R. Intelligent decision model of road maintenance based on improved weight random forest algorithm. Int. J. Pavement Eng. 2022, 23, 985–997. [Google Scholar] [CrossRef]
- Patel, H.H.; Prajapati, P. Study and analysis of decision tree-based classification algorithms. Int. J. Comput. Sci. Eng. 2018, 6, 74–78. [Google Scholar] [CrossRef]
- Tsami, M.; Adamos, G.; Nathanail, E.; Budiloviča, E.B.; Jackiva, I.Y.; Magginas, V. A decision tree approach for achieving high customer satisfaction at urban interchanges. Transp. Telecommun. 2018, 19, 194. [Google Scholar] [CrossRef]
- Gershman, A.; Meisels, A.; Lüke, K.H.; Rokach, L.; Schclar, A.; Sturm, A. A decision tree-based recommender system. In Proceedings of the 10th International Conference on Innovative Internet Community Systems (I2CS)—Jubilee Edition 2010, Bangkok, Thailand, 3–5 June 2010. [Google Scholar]
- Breiman, L.; Friedman, J.H.; Olshen, R.A.; Stone, C.J. Classification and Regression Trees; Routledge: Abingdon, UK, 2017. [Google Scholar]
- Rahman, R.M.; Hasan, F.R.M. Using and comparing different decision tree classification techniques for mining ICDDR, B Hospital Surveillance data. Expert Syst. Appl. 2011, 38, 11421–11436. [Google Scholar] [CrossRef]
- Bae, J.M. The clinical decision analysis using a decision tree. Epidemiol. Health 2014, 36, e2014025. [Google Scholar] [CrossRef] [PubMed]
- Si, T.; Sun, L.; Zhang, Y.; Zhang, L. Dose Adjustment Model of Paliperidone in Patients with Acute Schizophrenia: A post hoc Analysis of an Open-Label, Single-Arm Multicenter Study. Front. Psychiatry 2021, 12, 723245. [Google Scholar] [CrossRef] [PubMed]
- Heldner, M.R.; Chalfine, C.; Houot, M.; Umarova, R.M.; Rosner, J.; Lippert, J.; Gallucci, L.; Leger, A.; Baronnet, F.; Samson, Y.; et al. Cognitive Status Predicts Return to Functional Independence After Minor Stroke: A Decision Tree Analysis. Front. Neurol. 2022, 13, 833020. [Google Scholar] [CrossRef] [PubMed]
- Chen, C.Y.; Shih, B.Y.; Chen, Z.S.; Chen, T.H. The exploration of internet marketing strategy by search engine optimization: A critical review and comparison. Afr. J. Bus. Manag. 2011, 5, 4644–4649. [Google Scholar]
- Aviad, B.; Roy, G. Classification by clustering decision tree-like classifier based on adjusted clusters. Expert Syst. Appl. 2011, 38, 8220–8228. [Google Scholar] [CrossRef]
- Ahishakiye, E.; Taremwa, D.; Omulo, E.O.; Niyonzima, I. Crime prediction using decision tree (J48) classification algorithm. Int. J. Comput. Inf. Technol. 2017, 6, 188–195. [Google Scholar]
- Saltos, G.; Cocea, M. An exploration of crime prediction using data mining on open data. Int. J. Inf. Technol. Decis. Mak. 2017, 16, 1155–1181. [Google Scholar] [CrossRef]
- Sikder, I.U.; Munakata, T. Application of rough set and decision tree for characterization of premonitory factors of low seismic activity. Expert Syst. Appl. 2009, 36, 102–110. [Google Scholar] [CrossRef]
- Shin, Y.; Kim, T.; Cho, H.; Kang, K.I. A formwork method selection model based on boosted decision trees in tall building construction. Autom. Constr. 2012, 23, 47–54. [Google Scholar] [CrossRef]
- Mataei, B.; Nejad, F.M.; Zakeri, H. Pavement maintenance and rehabilitation optimization based on cloud decision tree. Int. J. Pavement Res. Technol. 2021, 14, 740–750. [Google Scholar] [CrossRef]
- Chen, C.T.; Hung, C.T.; Lin, J.D.; Sung, P.H. Application of a decision tree method with a spatiotemporal object database for pavement maintenance and management. J. Mar. Sci. Technol. 2015, 23, 5. [Google Scholar]
- Hox, J.J. A review of current software for handling missing data. Kwant. Methoden 1999, 20, 123–138. [Google Scholar]
- Coffman, D.L.; Maydeu-Olivares, A.; Arnau, J. Asymptotic distribution free interval estimation: For an intraclass correlation coefficient with applications to longitudinal data. Methodol. Eur. J. Res. Methods Behav. Soc. Sci. 2008, 4, 4. [Google Scholar]
- Akoglu, H. User’s guide to correlation coefficients. Turk. J. Emerg. Med. 2018, 18, 91–93. [Google Scholar] [CrossRef]
- Brown, S.D.; Tauler, R.; Walczak, B. (Eds.) Comprehensive Chemometrics: Chemical and Biochemical Data Analysis; Elsevier: Amsterdam, The Netherlands, 2020. [Google Scholar]
- Therneau, T.; Atkinson, B.; Ripley, B. Recursive Partitioning and Regression Trees, R package version 4.1–15.3. 2019. Available online: https://cran.r-project.org/web/packages/rpart/index.html (accessed on 20 April 2023).
- Lewis, R.J. An introduction to classification and regression tree (CART) analysis. In Annual Meeting of the Society for Academic Emergency Medicine in San Francisco; Department of Emergency Medicine Harbor-UCLA Medical Center Torrance: Torrance, CA, USA, 2000; Volume 14. [Google Scholar]
- Lohr, S.; Hsu, V.; Montaquila, J. Using classification and regression trees to model survey nonresponse. In Joint Statistical Meetings, Proceedings of the Survey Research Methods Section: American Statistical Association; American Statistical Association: Alexandria, VA, USA, 2015; pp. 2071–2085. [Google Scholar]
Figure 1.
Approaches to the effective management of road infrastructure. (a) Maintenance management activity flow. (b) PDCA cycle for maintenance management.
Figure 1.
Approaches to the effective management of road infrastructure. (a) Maintenance management activity flow. (b) PDCA cycle for maintenance management.
Figure 2.
Structure of decision model.
Figure 2.
Structure of decision model.
Figure 3.
Distribution of road sections by unit maintenance cost in 2020–2021.
Figure 3.
Distribution of road sections by unit maintenance cost in 2020–2021.
Figure 4.
Correlation matrix for independent variables. Darker green indicates more positive correlation; darker red indicates more negative correlation.
Figure 4.
Correlation matrix for independent variables. Darker green indicates more positive correlation; darker red indicates more negative correlation.
Figure 5.
Results of decision tree analysis for framework 1 (two-step budget allocation process). (a) Model DTM 1a (receiving or not receiving a budget). (b) Model DTM 1b (amount of budget allocated).
Figure 5.
Results of decision tree analysis for framework 1 (two-step budget allocation process). (a) Model DTM 1a (receiving or not receiving a budget). (b) Model DTM 1b (amount of budget allocated).
Figure 6.
Results of decision tree analysis for framework 2 (DTM 2, one-step budget allocation process).
Figure 6.
Results of decision tree analysis for framework 2 (DTM 2, one-step budget allocation process).
Figure 7.
Relationship between time since last maintenance and inclusion in the 2020–2021 rehabilitation plan (chi-square = 12.061, df = 2, p = 0.002).
Figure 7.
Relationship between time since last maintenance and inclusion in the 2020–2021 rehabilitation plan (chi-square = 12.061, df = 2, p = 0.002).
Figure 8.
Relationship between time since last maintenance and IRI-based (Good = 0–4, Fair = 4–6, Bad = 7–10) pavement condition (chi-square = 6.353, df = 4, p = 0.174).
Figure 8.
Relationship between time since last maintenance and IRI-based (Good = 0–4, Fair = 4–6, Bad = 7–10) pavement condition (chi-square = 6.353, df = 4, p = 0.174).
Figure 9.
Relationship between road importance and IRI-based (Good = 0–4, Fair = 4–6, Bad = 7–10) pavement condition for roads included in the 2020–2021 maintenance plan (chi-square = 4.013, df = 2, p = 0.134).
Figure 9.
Relationship between road importance and IRI-based (Good = 0–4, Fair = 4–6, Bad = 7–10) pavement condition for roads included in the 2020–2021 maintenance plan (chi-square = 4.013, df = 2, p = 0.134).
Figure 10.
Relationship between mines and minerals roads and IRI-based (Good = 0–4, Fair = 4–6, Bad = 7–10) pavement condition for roads included in the 2020–2021 maintenance plan (chi-square = 6.947, df = 2, p = 0.031).
Figure 10.
Relationship between mines and minerals roads and IRI-based (Good = 0–4, Fair = 4–6, Bad = 7–10) pavement condition for roads included in the 2020–2021 maintenance plan (chi-square = 6.947, df = 2, p = 0.031).
Figure 11.
Relationship between south division roads and IRI-based (Good = 0–4, Fair = 4–6, Bad = 7–10) pavement condition (chi-square = 2.485, df = 2, p = 0.289).
Figure 11.
Relationship between south division roads and IRI-based (Good = 0–4, Fair = 4–6, Bad = 7–10) pavement condition (chi-square = 2.485, df = 2, p = 0.289).
Table 1.
Decision tree algorithms.
Table 1.
Decision tree algorithms.
| Decision Tree Algorithm | Data Types | Splitting Method |
|---|
| C 5.0 | Categorical, Numerical | No Restriction |
| ID3 | Categorical | No Restriction |
| CHAID | Categorical | n/a |
| CART | Categorical, Numerical | Binary Splits |
Table 2.
Road attributes and description.
Table 2.
Road attributes and description.
| Variable Type | Nos. | Attributes | Types | Code | Description |
|---|
| Nominal | 1–4 | Division | Center | 0 = No
1 = Yes | The road falls under the respective division depending on the locality |
| North |
| South |
| East |
| 5 | Pavement terrain | Hilly | 0 | The terrain on which the road section is constructed |
| Plain area | 1 |
| 6 | Strategic importance | Less important | 0 | The road section does not lead to strategic sites, nor does it lead to the border area |
| High important | 1 | The road leads to strategic sites, movement of army convoys, or to the border area |
| 7 | Rehabilitation plan 2020–2021 | - | 0 = No
1 = Yes | The road section is included in the rehabilitation plan in the year 2020–2021 |
| 8 | Tourism roads | - | 0 = No
1 = Yes | The road section leads to tourism sites |
| 9 | Industrial roads | - | 0 = No
1 = Yes | The road section leads to industrial sites |
| 10 | Mines or mineral roads | - | 0 = No
1 = Yes | The road section leads to mines or minerals sites |
| 11 | Signboards intact | - | 0 = No
1 = Yes | The signboards along the roadside are intact |
| Ordinal | 12 | Importance | Lower importance | 0 | Ordinary traffic with AADT up to 20,000 |
| High importance | 1 | Ordinary traffic, tourism, or industrial traffic with AADT of more than 20,000 |
| 13 | Pavement condition | Bad | 1 | IRI = 7–10, area damaged = 10–25% |
| Average | 2 | IRI = 4–6, area damaged = 5–10% |
| Good | 3 | IRI = 0–4, area damaged = 0% |
| 14 | Condition of culverts | Bad | 1 | Requires rehabilitation |
| Average | 2 | Requires maintenance |
| Good | 3 | No maintenance required |
| 15 | Condition of drain | Bad | 1 | Requires rehabilitation |
| Average | 2 | Requires maintenance |
| Good | 3 | No maintenance required |
| 16 | Time since last maintenance | 1 year | 1 | Time in years since the road was last maintained (reference year 2021) |
| 2 years | 2 |
| 3 years | 3 |
| More than 3 years or unknown | 4 |
| 17 | Time since last rehabilitation | 0–3 years | 1 | Time in years since the road was last rehabilitated (reference year 2021) |
| 4–6 years | 2 |
| 7–12 years | 3 |
| >12 years | 4 |
| Unknown | 5 |
| 18 | Traffic load | Low | 1 | Ordinary traffic with farm to market |
| Medium | 2 | Interprovincial traffic where interprovincial movement depends upon the provincial highway |
| High | 3 | Interprovincial traffic with industrial and tourism traffic |
| Continuous | 19 | No. of lanes | Number | - | Number of lanes |
| Target variable | 20 | Unit maintenance cost | Nominal | 0 = NRB
1 = RB | The maintenance cost for the year 2020–2021 was taken as a nominal variable for DTM 1a
NRB = Not Received Budget
RB = Received Budget |
| Continuous | - | The maintenance budget cost per kilometer of road section was taken for DTM 1b and DTM 2 |
Table 3.
VIF values for independent variables.
Table 3.
VIF values for independent variables.
| Variables | VIF | Variables | VIF |
|---|
| div_center | 8.28 | road_imp | 1.88 |
| div_north | 3.79 | culv_cond | 2.08 |
| div_south | 6.57 | drains_cond | 1.89 |
| pav_terrain | 9.12 | Carriageway | 3.85 |
| pav_type | 1.12 | timesincelast_rehab | 5.93 |
| bt_width | 1.96 | signboards_intact | 2.69 |
| pav_cond | 2.29 | sec_length | 1.56 |
| no_lanes | 2.49 | tourism_roads | 2.69 |
| traf_load | 2.37 | industeries_roads | 1.69 |
| strat_imp | 1.59 | mines.minerals_roads | 1.86 |
| time.sincelast_main | 1.62 | rehab.20_21 | 5.14 |
Table 4.
Description of the conceptualized decision-making frameworks.
Table 4.
Description of the conceptualized decision-making frameworks.
| Framework | 1 | 2 |
|---|
| Label | DTM 1a | DTM 1b | DTM 2 |
|---|
| Objective | To identify the factors that affected whether a road section was selected to receive or not receive budget | To identify the factors that affected the amount of budget allocated | To identify the factors that affected whether or not a road section received budget and how much budget it was allocated |
| Analysis | Classification | Regression | Regression |
| Target variable | Unit maintenance cost as nominal data | Unit maintenance cost as continuous positive data | Unit maintenance cost as continuous non-negative data |
| Number of observations | 105 | 54 | 105 |
| Numbers of predictors | 18 | 18 | 18 |
| Disclaimer/Publisher’s Note: The statements, opinions and data contained in all publications are solely those of the individual author(s) and contributor(s) and not of MDPI and/or the editor(s). MDPI and/or the editor(s) disclaim responsibility for any injury to people or property resulting from any ideas, methods, instructions or products referred to in the content. |
© 2023 by the authors. Licensee MDPI, Basel, Switzerland. This article is an open access article distributed under the terms and conditions of the Creative Commons Attribution (CC BY) license (https://creativecommons.org/licenses/by/4.0/).


