Abstract
Agriculture contributes substantially to global greenhouse gas emissions and other environmental impacts. Current agricultural policies tolerate these impacts and sometimes even aggravate them through subsidies for unsustainable production systems and products. Against this background, we explore the resulting transfers to agriculture and food associated with different dietary styles. Using data from Switzerland, we consider both direct transfers through government subsidies and indirect transfers through toleration of environmental impacts and costs. Gross transfers were quantified based on existing studies that (i) define eight dietary styles in terms of the quantity of the different product groups, (ii) allocate subsidies for agriculture to product groups, (iii) allocate environmental impacts to product groups using life cycle assessment (LCA) methods, and (iv) estimate external costs of agriculture using politically endorsed expenditures for damage avoidance. To quantify net transfers associated with the dietary styles, we subtracted individual tax contributions from the subsidies received and average external costs individually suffered from external costs caused. We found that the gross transfers from government to agriculture range from about CHF 500 to about CHF 2000 annually per taxpayer/consumer depending on dietary styles. Net transfers per taxpayer/consumer range from about CHF −1000 to about CHF 1000 depending on dietary style and income. The estimates highlight that current policies strongly privilege and thereby also endorse environmentally problematic dietary styles over more environmentally friendly ones, contradicting official strategies and targets in the domains of environment and public health.
1. Introduction
Food systems contribute about one-third to anthropogenic greenhouse gas emissions [1] and are also a major driver of biodiversity decline and other environmental impacts [2]. Studies on the environmental impacts of food production have established that animal products are responsible for a disproportional amount of the impacts [3]. Diets—the food consumed at the individual level and dietary styles—are therefore seen as an important determinant of the environmental impacts of agriculture [4,5].
Dietary styles are influenced by food prices. Food prices may be affected by agricultural subsidies and by the regulation of environmental impacts or ‘externalities’ of agriculture. From the perspective of the polluter-pays principle, agricultural subsidies for food production and unregulated externalities decrease the costs of food and especially of food products with high environmental impacts. Agricultural and food policy may therefore influence environmental impacts not only directly through environmental production standards but also through effects on the costs of food and dietary styles. Accordingly, food prices and dietary styles as affected by agriculture and food policy may be an important determinant of environmental outcomes.
Whether these observations are relevant depends on how current regulations distribute the costs among producers, taxpayers and those impacted by [6]. Today’s regulatory approaches in agriculture suggest that the effects may be important. Agricultural policies today often pursue agri-environmental objectives through subsidy schemes rather than following a polluter-pays principle [7]. As a consequence, food prices do not reflect the full costs of production. Substantial costs of preventing environmental damage are burdened on taxpayers, while remaining environmental damage is borne by the public at large [8]. A closer look at subsidies for food and dietary styles—both direct subsidies and implicit transfers through unregulated externalities—seems warranted.
Existing economic studies have quantified the externalities of agriculture at the national level [9,10,11] and of individual food products [12,13,14,15]. Furthermore, agricultural subsidies have been identified and classified into categories such as ‘support based on commodity output’, ‘payments based on input use’, etc., by the Organization of Economic Cooperation and Development [16]. To our knowledge, however, neither external costs nor subsidies have been examined at the level of different dietary styles. Such information may be relevant for two main reasons. The results would shed new light on how public policy may adversely affect environmental and health outcomes through economic incentives at the level of the individual consumer. Second, since discrimination of dietary lifestyles would be difficult to justify, the results could be relevant for agricultural policy even independent of implications for the environment and healthy diets.
The objective of this paper is to explore the transfers associated with different dietary styles induced by current agricultural policies in Switzerland. Transfers are defined in a wide sense, including the subsidies to food categories and the uncompensated monetized environmental impacts of food production (external costs). The analysis draws on earlier studies that (i) provide definitions of dietary styles, (ii) allocate subsidies to agricultural to product groups, (iii) allocate environmental impacts of food to product groups, and (iv) estimate external costs of agriculture.
Our specific questions are:
- (1)
- How large are the government’s budgetary expenditures for food production associated with different dietary styles (a) in a gross calculation and (b) in a net calculation subtracting individual tax contributions to those subsidies?
- (2)
- How large is the indirect support for food production through toleration of uncompensated externalities associated with different dietary styles (a) in a gross calculation and (b) in a net calculation that subtracts the external costs individually suffered?
The analysis is based on data for Switzerland. The level of subsidies in Switzerland is among the highest world-wide [17]. The Swiss authorities acknowledge that the current regulation misses a broad range of legal requirements [18] and that the food system will have to be substantially changed to reach national climate and broader sustainability targets [19]. Official targets for Swiss agriculture and food consumption include notably a reduction in greenhouse gas emissions from national food consumption by two-thirds and of Swiss agriculture by 40 percent of the values of 1990 by 2050 ([19], p. 53 ff.).
2. Conceptual Background
2.1. Overview
Our overall objective is to quantify the direct and indirect transfers from government to agriculture and food production associated with different dietary styles. The transfers we examine include both financial and non-financial transfers. The former includes agricultural subsidies to agriculture and individual tax payments associated with food products consumed by individuals with different dietary styles. The latter includes uncompensated external costs caused and suffered, again by consumers with different dietary styles.
The analysis uses a static perspective. We do not examine how consumption patterns would change if subsidies were abolished and externalities internalized in market prices but examine the transfers associated with dietary styles under the present-day regulation. To do this, we integrate information from a variety of sources and strands of research: official agricultural statistics; a set of dietary styles defined in terms of the quantity of different product groups; estimates of the allocation of agricultural subsidies to public goods vs. food production and to individual food categories; estimates of external costs of agriculture; environmental impacts of food categories based on life cycle assessment (LCA); and calculations furthermore involve assumptions on parameters of the federal tax system. In the following we briefly describe this conceptual background.
Figure 1 provides an overview of the different sources of information used and where they enter the analysis.
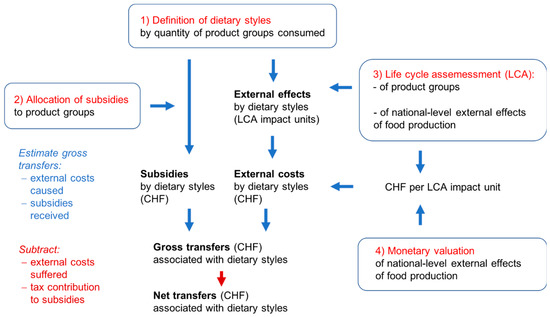
Figure 1.
Overview of the analysis.
2.2. Official Statistics of Agricultural Subsidies
The official statistics of Swiss agriculture provide detailed tables for the federal expenditures for agriculture and nutrition [20]. Unfortunately, however, the expenditure categories do not distinguish measures supporting public goods such as biodiversity conservation and food security and measures that support the production of commodities. The official labels of the measures do not reliably indicate the function of the expenditures. For instance, there are expenditures for animal health (‘Tiergesundheit’), but most of these expenditures, about CHF 50 million annually, are subsidies for the disposal of slaughterhouse waste. They are essentially subsidies for the production of commodities.
Similar difficulties arise with the direct payments to farmers which are labelled as payments for food security, for sustainable production systems, for biodiversity areas (‘Biodiversitätförderflächen’), etc. The payments are not based on any publicly available cost calculations. Some of them support forms of production that are not compatible with environmental legislation [21]. In many cases, the subsidies for environmental measures essentially cover production costs of commodities, and some of them are only very loosely tied to any efforts or outcomes (Schläpfer 2020a [8]; see also Section 2.3).
The OECD ([16], Chapter 3), provides a classification of subsidies to categories such as ‘support based on commodity output’, ‘payments for input use’, etc. However, with respect to the distinction of subsidies for public goods and subsidies for commodities, the OECD classification is also rather limited. Payments for public goods are not defined and distinguished from payments for commodities. The OECD authors explain that ‘at present there is no consistent and non-contested set of demand valuations by society for non-market public goods (or of the value of negative externalities) across and within OECD countries’ (OECD [16], p. 27). Hence, the official statistics provide total amounts of subsidies but not amounts of subsidies for food production and for environmental services as required in this study.
2.3. Subsidies for Food Production
Baur and Schläpfer [7] and Schläpfer [8,22,23] define payments for public goods (or ‘payments for services’) as payments that support public goods or positive externalities of agriculture at levels that go beyond statutory requirements and would not be provided without the financial support. These payments are distinguished from production subsidies which are further classified into ‘payments for damage avoidance’ and ‘other subsidies’. A classification of the categories of direct payments is available in Schläpfer (ref. [8], Supplementary Material), and the classification of the other (than direct) payments is available in Schläpfer [23]. The classification is based on the results of official evaluations of the schemes (e.g., [23,24]) and expert judgement (cf. [7]). For example, the payments for organic agriculture, the light ‘quality I’ eco-schemes, the payments for ‘pollinator strips’, and some other measures were identified as merely avoiding damage (see [8], Supplementary material). The payments for higher quality eco-schemes are considered as payments for public goods.
The production subsidies for Swiss agriculture are allocated to product groups in Schläpfer [22], following methods described in Schläpfer [23]. The subsidies are first allocated to production systems and then to product groups. Total subsidies for each product group were then divided by the quantity of output in that product group from official statistics.
2.4. Life Cycle Assessment of Food
Environmental impacts of food are often quantified using life cycle assessment (LCA) methods and inventories. LCA usually considers impacts during the entire life cycle of products, from resource extraction to the disposal of the product, including any waste generated during production. The general framework used in this study is the ‘ecological scarcity method’ as described in Frischknecht et al. [25]. In this method, which is often used in Switzerland, the inventory results are weighted using a distance-to-target principle based on the goals of Swiss environmental policy. The implementation of the framework is described in Jungbluth et al. [26]. The background data is based on the databases by ESU-services [27,28].
The LCA dataset does not account for the origin of food products. This is a potential weakness of the data for food categories that are partly produced in Switzerland and partly imported (see [26], p. 14). The (limited) available studies, however, suggest that environmental impacts of production in Switzerland and elsewhere are similar [29,30]. This is an implicit assumption we make in relying on these data.
2.5. External Costs of Food
The external costs of food production used in this study are based on actual, politically endorsed avoidance expenditures. This approach was first used to value selected agricultural externalities by Pretty et al. [9]. It was then systematically applied to a broad range of agricultural externalities in Schläpfer [8]. In this approach, the quantity of harmful emissions is multiplied by the amount of money government is actually paying farmers for measures to avoid one unit of emissions—such as one ton of ammonia emissions, one ton of nitrate leached into groundwater or sprayed with a certain type of pesticide on one hectare. The present study uses the valuations of [8] to compute monetary equivalents of the impacts obtained in the LCA analysis. In other words, the information on (a) LCA impacts and (b) costs of externalities of agricultural production in Switzerland are combined to obtain the monetary costs per unit of LCA impact. This valuation per unit of LCA impact is then also applied to the (relatively minor) non-agricultural impacts.
2.6. Dietary Styles
The dietary styles were adopted from an earlier study of the consulting firm ESU-services which also conducted the LCA analyses for the present study [31]. In that study, the selection of styles such as ‘vegan’, ‘vegetarian’, etc., and the amounts of meat and milk products in each style were defined by the non-governmental organization that mandated the study. The quantities consumed of the other product groups were defined by ESU-services based on the existing literature.
3. Methods and Data
3.1. Definition of Dietary Styles
We examined eight dietary styles (Table 1). The styles follow [31] but they were updated to reflect consumption in 2020. The diets are characterized by the intake from 34 product groups as described in Appendix A, Table A1. Food loss is not included in the data. Calorie intakes differ among the dietary styles (Table 1, last column).

Table 1.
Description of dietary styles.
Per unit of product, beef steaks are more valuable than ordinary ground beef and therefore more important for agricultural production decisions. For an economic allocation of subsidies and environmental impacts we defined three meat consumption styles: ‘modest’, ‘average’, and ‘expensive’. The analysis therefore distinguishes eight basic dietary styles and—for the four styles that include meet—three meat consumption styles (Table 2). This yields a total of sixteen different consumption styles (in the following referred to as dietary styles).
Table 2.
Meat consumption styles.
3.2. Calculation of Subsidies to Dietary Styles
Subsidies to dietary styles were calculated by multiplying subsidies s per kilogram of product group i with the product quantity of Swiss origin, q, consumed by individuals with the dietary style jk, where j denotes the dietary style regarding product quantity and k denotes the meat style (see Table 2).
Sjk: subsidy associated with consumption style jk
sik: subsidies per kilogram of product ik
qik: quantity of product ik of Swiss origin consumed by consumption style jk
Data on subsidies for product groups were taken from Schläpfer ([22], updated figures for 2020; cf. 2.2 and Supplementary Material, Table S1 for the data). The quantity of products consumed by the dietary styles was provided by ESU-services Ltd. (See Section 2.6). The subsidies apply only to food of national (Swiss) origin and not to imported food. The quantity of national origin was obtained from the percentage self-sufficiency in the official agricultural statistics that are published by the Swiss Farmers Union [32].
Net transfers associated with subsidies were calculated by subtracting annual tax contributions:
NSjkl: net subsidy associated with consumption style jk and income l
Tjkl: individual annual tax contribution to food subsidies
Annual tax contributions were approximated by dividing total food subsidy cost by the gross domestic product (GDP) and multiplying by individual income. This implies an assumption that contributions to food subsidies are proportional to the individuals’ contribution to GDP.
S = total annual food subsidy cost
Il = income level l
3.3. Calculation of External Costs of Dietary Styles
The extraction of the LCA inventory data and the calculation of eco-points for Swiss agriculture and for each dietary style was conducted by ESU-services Ltd. (See Section 2.6). ESU-services thus provided the aggregate impacts (in eco-points) for Swiss agriculture and the individual impacts (in eco-points) for each dietary style.
The aggregate external costs of Swiss agriculture were taken from (Schläpfer 2020a [8]). To allocate the total external costs to dietary styles, we divided the total external cost figure (for all considered environmental impacts) of CHF 3.190 billion (Schläpfer 2020a [8], only environmental externalities) by the total number of eco-points of Swiss agriculture (all environmental impacts) of 2.813 × 10¹³ billion eco-points (see Supplementary Material, Table S2). This yielded the monetary cost of impacts per eco-point of CHF 1.1 × 10⁻⁴ (or CHF 0.11 for 1000 eco-points).
c: external costs per eco-point
EC: aggregate external costs
EI: aggregate environmental impact in eco-points
The external costs for a consumer with dietary style j and meat demand k was then calculated by multiplying the number of eco-points for the dietary style with the external cost per eco-point, c.
ECjk: individual external costs of dietary style jk
EIjk: environmental impact of dietary style jk
The net transfer associated with dietary style jk was obtained by subtracting the average external cost:
NECjk: individual net benefit from current regulation of external costs
P: national population
3.4. Summation of Subsidies and External Costs
Individual total subsidy and external costs associated with dietary styles are simply the sum of the two:
Tjk: Gross transfer associated with dietary style jk
Finally, the total net transfer associated with the dietary styles was obtained by summing net transfers due to subsidies and external costs:
NTjkl: Total net transfer associated with dietary style jk and income l (food subsidies and external costs)
3.5. Data
Table 3 provides the sources and reference year of the data used in the calculations.
Table 3.
Data and sources.
4. Results
4.1. Gross and Net Subsidies Associated with Dietary Styles
Figure 2 shows the subsidies that are associated with each dietary style (eight dietary styles in combination with modest, medium, or expensive meat). The gross transfers are the agricultural subsidies for food production associated with the dietary styles before any deduction of individual tax contributions to the subsidies (Figure 2, first panel). The highest transfer (associated with the meat-focused diet) is more than 18 times higher than the lowest transfer (associated with the vegan diet).
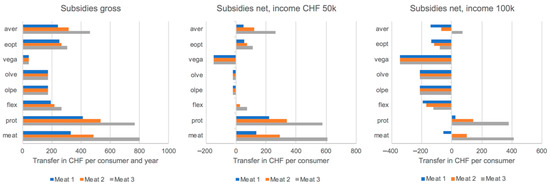
Figure 2.
Subsidies associated with dietary styles. First panel: gross subsidies. Second and third panel: net subsidies after subtracting individual tax contributions to subsidies for individuals with annual income of CHF 50,000 and CHF 100,000, respectively. (Definition of dietary styles and meat consumption styles see Table 1 and Table 2).
Individual tax contributions to federal subsidies for agriculture depend on individual income. The estimated contributions by individuals of three selected income levels are shown in Table 4.
Table 4.
Individual contribution to food subsidies.
Subtracting these individual contributions from the gross receipts yields the net transfers associated with dietary styles (Figure 2, second and third panel). Positive net transfers are found for the lower-income consumers with average and meat- or protein-rich diets and the medium-income individuals with protein-rich diets and consuming expensive meat. For high-income individuals, the contributions to subsidies are higher than the gross subsidies. They are net contributors.
4.2. Gross and Net External Costs Associated with Dietary Styles
The gross transfers due to external costs associated with the different dietary styles vary substantially, although less than the subsidies (Figure 3). The dietary style with the highest external costs (meat-focused, expensive meat) has about four times higher external costs than the environmentally optimized diet combined with modest meat consumption and about three times higher costs than the vegan diet (Figure 3, first panel).
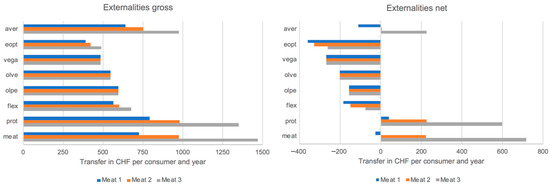
Subtracting the average burden of external costs from the gross costs yields the net external costs of the dietary styles (Figure 3, second panel). The highest net costs are caused by protein-focused and meat-focused diets with average and expensive meat and the average diet with expensive meat. The environmentally friendly dietary styles carry substantial net burdens of about CHF 200 to CHF 300.
4.3. Adding up Subsidies and External Costs
Adding up the gross costs of the dietary styles yields total transfers between about CHF 500 for the vegan diet to more than CHF 2000 for the meat- and protein-focused diets with expensive meat.
Finally, we computed the sum of net transfers associated with dietary styles from both subsidies and external costs (Figure 4). The largest contributors (or losers) of the transfers are generally the environmentally friendly vegan, vegetarian or environmentally optimized diets. Their net contribution is particularly pronounced with up to CHF 1000 annually for individuals with high incomes. The main recipients (or winners) of the transfers are the meat- and protein-focused diets with a preference for expensive meat cuts. The net transfers associated with those diets are particularly large, ranging up to more than CHF 1000 annually in the case of individuals with low incomes. Low income, however, may be rather exceptional among this dietary style; cf. Discussion.
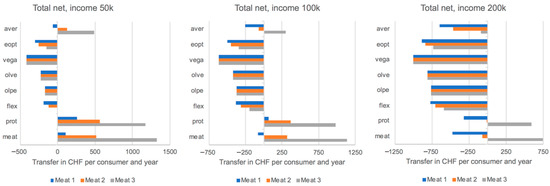
Figure 4.
Sum of net subsidies and net external costs associated with dietary styles. Estimates for individuals with annual income of CHF 50,000 (first panel), CHF 100,000, (second panel), and CHF 200,000 (third panel). (Definition of dietary styles and meat consumption styles see Table 1 and Table 2).
5. Discussion
The overall finding of this study is that the current regulation in Switzerland supports dietary styles very unequally. Meat- and protein-rich dietary styles are associated with net transfers of up to CHF 1000 annually and more per person, whereas consumers with environmentally friendly dietary styles are net contributors to transfers of food production. Several aspects of the results deserve further discussion.
The general finding that animal-focused diets are favored by current policies is not novel or surprising, but the analysis highlights additional aspects of the issue. First, we provide quantitative estimates of the magnitude of the transfers associated with dietary styles at the individual level. Second, the analysis highlights the relevance of accounting for different grades of meat which is not usually performed in LCA but clearly warranted. Meat production is driven by prices paid; different cuts of meat therefore contribute differently to the demand for this production. Third, we examined how income moderates the net transfers among dietary styles through tax payments. Individuals with high income and environmentally friendly consumption contribute more than those with low incomes. Individuals with low incomes and environmentally unfriendly consumption receive more than those with high incomes.
From a governance perspective, the findings are disturbing. It is becoming increasingly clear today that agricultural policies in Switzerland provide incentives that contradict official policy objectives and targets in the domains of environment [18,34] and health (e.g., [35]). The current regulation may be interpreted as an industrial policy for the agriculture and food industry [36]. These industries are well represented in Swiss politics. Together with the meat and dairy farmers, they have the political power to pass legislation that places a large portion of the production costs on taxpayers and those affected by environmental damage. The policies thereby undermine the required transition to sustainable food systems and healthy diets [37,38].
The privileges for animal-based production may also affect demand beyond the price effect. Consumers may interpret government action as morally relevant [39]. Government support may signal an official endorsement and recommendation. The Swiss government not only allocates more than 80 percent of the budgetary support for agriculture to animal production [22] but also covers 50 percent of the costs of advertisements to stoke demand for agricultural produce. The Swiss executive has argued that the support does not aim at increasing meat consumption but only at a preference for domestic products [40]. However, most of the advertised produce is privileged through import restrictions [17,41]. Furthermore, much of the advertising focuses on (government financed) animal welfare and ‘consumer conscience’. The combination may be well suited to increase meat consumption [42,43] and therefore increase the gap in Switzerland between official dietary recommendations and actual food intake [44]. According to estimates, closing that gap could reduce the environmental footprint of the Swiss population by 36%, food expenditure by 33%, and adverse health outcomes by 2.7% compared with the current diet [45].
The results of the study do not allow any conclusions regarding the amount of redistribution at the individual and aggregate level. The reason is that the transfers associated with dietary styles are estimated at the level of government expenditure. The transfers do not fully ‘arrive’ at the level of the consumers. They do not decrease food prices by the full amount of the public expenditures. We therefore refer to ‘transfers associated with different dietary styles’ rather than ‘transfers to consumers with different dietary styles’. Furthermore, regarding aggregate distribution, it is important to note that the examined dietary styles and income groups—and the combinations of these—are not equally frequent in the population. For instance, individuals with high incomes may more often have protein-rich diets with expensive meat. Estimates at the aggregate level would have to account for the frequency of dietary styles and income levels in the population. Such information was not available for the examined dietary styles.
Finally, a number of caveats should be mentioned. First, environmental impacts of food are highly complex. This is exacerbated by imports from many origins [2]. Furthermore, differences due to conventional vs. organic agriculture [46,47] and intensive vs. extensive production [48] are not represented in the LCA data. Hence, the LCA data can only partly account for the complexity of agricultural systems. Second, the estimates of external cost rely on a total cost estimate derived for Swiss agriculture and on the weighting of individual impact categories in LCA. These figures and weights rely on assumptions that drive the results.
Third, the allocation of subsidies to production systems and food categories involves a number of assumptions. Different definitions of subsidies for food vs. public goods such as landscape management would result in different figures for the subsidies. However, we argue that the studies on which we build used principled approaches and had considerable attention to detail. The main conclusions should be fairly robust.
Fourth, food itself is taxed through the value-added tax (VAT) and thus contributes to food subsidies. Hence, individual tax contributions to food depend on consumption. Accordingly, in principle, the calculation of tax contributions should account for dietary style. However, VAT on food in Switzerland has reduced tax rates of only 2.5% rather than the usual 7.7% (in 2020). Furthermore, expenditures on food are only about 7% of household expenditures [49]. The contribution of the VAT on food therefore contributes little to the federal tax revenue and to food subsidies.
6. Conclusions
Agricultural policy in Switzerland, through subsidies and external costs, allocates a substantial portion of the costs of food on taxpayers and society at large. This paper explored the magnitude of the transfers to producers and consumers associated with eight different dietary styles. We found that current policies support the examined dietary styles very unequally. Gross transfers from government to producers and consumers range from about CHF 500 to about CHF 2000 per person per year depending on dietary styles. The net transfer after subtracting individual tax contributions and the external cost burden is in the range CHF −1000 to CHF +1000 per person per year, depending on dietary styles and income.
A particularly troubling finding is that agricultural policy systematically and strongly favors environmentally problematic dietary styles, whereas environmentally benign dietary styles are the losers of the current policy. Our main conclusion is that current agricultural and food policy is contradicting official strategies and targets. The policies not only contradict environmental objectives [18] but also encourage and endorse dietary styles that are incompatible with official recommendations for healthy nutrition [37,50]. They thereby undermine the transition to a more sustainable agriculture and food consumption.
Supplementary Materials
The following supporting information can be downloaded at: https://www.mdpi.com/article/10.3390/su151310428/s1, Table S1. Breakdown of impact by impact categories for Swiss agriculture following the method of ecological scarcity. Table S2. Breakdown of impact (in eco-points) by impact categories for the dietary styles following the method of ecological scarcity. Table S3. Federal subsidies for food production by product groups (in 1000 CHF).
Author Contributions
Conceptualization, F.S. and M.L.; Methodology, M.L. and F.S.; Formal Analysis, M.L. and F.S.; Writing—Original Draft Preparation, F.S.; Writing—Review and Editing, F.S. and M.L.; Funding Acquisition, F.S. All authors have read and agreed to the published version of the manuscript.
Funding
Vision Landwirtschaft provided funding for a study that is a basis of this paper.
Data Availability Statement
An Excel spreadsheet model that allocates the publicly available subsidies to product categories (as described in Schläpfer 2020c) is available on request from the corresponding author. Restrictions apply to more disaggregated LCA inventory data than those provided in the Supplementary Materials (owned by ESU-services Ltd.).
Acknowledgments
The authors thank Martin Ulrich of ESU-services for comments on the subsections describing the LCA data. Comments by three anonymous reviewers are gratefully acknowledged.
Conflicts of Interest
The authors declare no conflict of interest.
Appendix A
Table A1.
Definition of dietary styles by quantity of product groups for the year 2020 a.
Table A1.
Definition of dietary styles by quantity of product groups for the year 2020 a.
| Product Group | Quantity (Kilogram Per Person and Year) | |||||||
|---|---|---|---|---|---|---|---|---|
| Average | Environmentally Optimized | Vegan | Ovo-lacto-Vegetarian | Ovo-lacto-Pescetarian | Flexitarian | Protein-Focused | Meat-Focused | |
| Milk | 61.0 | 73.0 | 0.0 | 61.0 | 61.0 | 61.0 | 108.5 | 61.0 |
| Butter | 5.6 | 1.0 | 0.0 | 5.6 | 5.6 | 5.6 | 5.6 | 5.6 |
| Cream | 9.3 | 1.0 | 0.0 | 9.3 | 9.3 | 9.3 | 16.6 | 9.3 |
| Cheese | 18.5 | 15.5 | 0.0 | 18.5 | 18.5 | 18.5 | 32.9 | 18.5 |
| Other dairy products b | 17.9 | 65.4 | 0.0 | 17.9 | 17.9 | 17.9 | 44.6 | 17.9 |
| Beef | 11.1 | 4.0 | 0.0 | 0.0 | 0.0 | 3.7 | 18.3 | 24.4 |
| Pork | 21.6 | 4.0 | 0.0 | 0.0 | 0.0 | 7.1 | 35.6 | 47.5 |
| Poultry | 10.6 | 5.3 | 0.0 | 0.0 | 0.0 | 3.5 | 17.5 | 23.3 |
| Other meat | 4.1 | 0.0 | 0.0 | 0.0 | 0.0 | 1.4 | 6.8 | 9.0 |
| Eggs | 12.9 | 7.8 | 0.0 | 16.1 | 15.6 | 10.5 | 29.9 | 17.9 |
| Cereals (incl. starch) | 97.5 | 75.2 | 97.5 | 97.5 | 97.5 | 97.5 | 97.5 | 97.5 |
| Potatoes | 50.7 | 42.0 | 50.7 | 50.7 | 50.7 | 50.7 | 50.7 | 50.7 |
| Vegetable fat, oil | 17.7 | 9.1 | 20.9 | 17.7 | 17.7 | 17.7 | 17.7 | 17.7 |
| Sugar | 35.0 | 2.6 | 35.0 | 35.0 | 35.0 | 35.0 | 35.0 | 35.0 |
| Vegetables | 117.6 | 131.4 | 220.6 | 147.0 | 147.0 | 132.3 | 58.8 | 58.8 |
| Fruit | 45.6 | 34.4 | 57.0 | 57.0 | 57.0 | 51.3 | 22.8 | 22.8 |
| Other plant-based | 16.1 | 25.2 | 145.1 | 34.3 | 35.4 | 25.2 | 12.5 | 5.1 |
| Apple juice, cider | 7.2 | 20.9 | 7.2 | 7.2 | 7.2 | 7.2 | 7.2 | 7.2 |
| Wine | 30.6 | 7.8 | 30.6 | 30.6 | 30.6 | 30.6 | 30.6 | 30.6 |
| Rest c | 941.1 | 825.4 | 946.9 | 948.4 | 961.9 | 944.7 | 911.0 | 911.2 |
| Total | 1532 | 1351 | 1612 | 1554 | 1568 | 1531 | 1560 | 1471 |
Notes: a Quantities from Swiss agriculture according to availability (incl. imports, subtracting exports). b This includes yogurt in particular. c Product groups with foodstuffs that are (almost) exclusively imported, as well as beer, spirits, soft drinks and mineral and tap water, are combined in the ‘Rest’ group. Source: ESU-Services.
References
- Crippa, M.; Solazzo, E.; Guizzardi, D.; Monforti-Ferrario, F.; Tubiello, F.N.; Leip, A. Food systems are responsible for a third of global anthropogenic GHG emissions. Nat. Food 2021, 2, 198–209. [Google Scholar] [CrossRef] [PubMed]
- Poore, J.; Nemecek, T. Reducing food’s environmental impacts through producers and consumers. Science 2018, 360, 987–992. [Google Scholar] [CrossRef]
- Xu, X.; Sharma, P.; Shu, S.; Tzu-Shun, L.; Ciais, P.; Tubiello, F.N.; Smith, P.; Campbell, N.; Jain, A. K Global greenhouse gas emissions from animal-based foods are twice those of plant-based foods. Nat. Food 2021, 2, 724–732. [Google Scholar] [CrossRef] [PubMed]
- Meier, T.; Christen, O. Environmental impacts of dietary recommendations and dietary styles: Germany as an example. Environ. Sci. Technol. 2013, 47, 877–888. [Google Scholar] [CrossRef] [PubMed]
- Zimmermann, A.; Nemecek, T.; Waldvogel, T. Umwelt- und ressourcenschonende Ernährung: Detaillierte Analyse für die Schweiz. Agroscope Sci. 2017, 55, 1–170. [Google Scholar]
- Schläpfer, F.; Vatn, A. Regulation of externalities: Rights, options, and procedure. Front. Environ. Econ. 2023, 2, 1188700. [Google Scholar] [CrossRef]
- Baur, I.; Schläpfer, F. Expert estimates of the share of agricultural support that compensates European farmers for providing public goods and services. Ecol. Econ. 2018, 147, 264–275. [Google Scholar] [CrossRef]
- Schläpfer, F. External costs of agriculture derived from payments for agri-environment measures: Framework and application to Switzerland. Sustainability 2020, 12, 6126. [Google Scholar] [CrossRef]
- Pretty, J.N.; Brett, C.; Gee, D.; Hine, R.E.; Mason, C.F.; Morison, J.I.L.; Raven, H.; Rayment, M.D.; Van der Bijl, G. An assessment of the total external costs of UK agriculture. Agric. Syst. 2000, 65, 113–136. [Google Scholar] [CrossRef]
- Tegtmeier, E.M.; Duffy, M.D. External costs of agricultural production in the United States. Int. J. Agric. Sustain. 2004, 2, 1–20. [Google Scholar] [CrossRef]
- FAO. Natural Capital Impacts in Agriculture. In Supporting Better Business Decision-Making; Food and Agriculture Organization of the United Nations: Rome, Italy, 2015. [Google Scholar]
- Pretty, J.N.; Ball, A.S.; Lang, T.; Morison, J.I.L. Farm costs and food miles: An assessment of the full cost of the UK weekly food basket. Food Policy 2005, 30, 1–19. [Google Scholar] [CrossRef]
- Fitzpatrick, I.; Young, R.; Perry, M.; Rose, E. The Hidden Cost of UK Food; Sustainable Food Trust: Bristol, UK, 2017. [Google Scholar]
- Pieper, M.; Michalke, A.; Gaugler, T. Calculation of external climate costs for food highlights inadequate pricing of animal products. Nat. Commun. 2020, 11, 6117. [Google Scholar] [CrossRef] [PubMed]
- Arrigoni, A.; Marveggio, D.; Allievi, F.; Giovanni Dotelli, G.; Scaccabarozzi, G. Environmental and health-related external costs of meat consumption in Italy: Estimations and recommendations through life cycle assessment. Sci. Total Environ. 2023, 869, 161773. [Google Scholar] [CrossRef] [PubMed]
- OECD. OECD’s Producer Support Estimate and Related Indicators of Agricultural Support. Concepts, Calculations, Interpretation and Use (The PSE Manual); OECD: Paris, France, 2016. [Google Scholar]
- OECD. Agricultural Policy Monitoring and Evaluation 2022. In Reforming Agricultural Policies for Climate Change Mitigation; OECD: Paris, France, 2022. [Google Scholar]
- Federal Council. Natürliche Lebensgrundlagen und Ressourceneffiziente Produktion. Aktualisierung der Ziele. Bericht in Erfüllung des Postulats 13.4284 Bertschy vom 13. Dezember 2013 (Natural Resources and Resource-Efficient Production. Updating the Goals); Report; Federal Council: Bern, Switzerland, 2016.
- Federal Council. Zukünftige Ausrichtung der Agrarpolitik. Bericht des Bundesrates in Erfüllung der Postulate 20.3931 der WAK-S Vom 20 August 2020 und 21.3015 der WAK-N Vom 2. Februar 2021 (Future Direction of Agricultural Policy. Report in Fulfillment of the Postulates 20.3931 and 21.3015); Federal Council: Bern, Switzerland, 2022.
- FOA. Agrarbericht (Agricultural Report); Federal Office for Agriculture: Bern, Switzerland, 2022. Available online: https://www.agrarbericht.ch (accessed on 18 April 2023).
- Mack, G.; Heitkämper, K.; Käufeler, B.; Möbius, S. Evaluation der Beiträge für Graslandbasierte Milch- und Fleischproduktion (GMF). Agroscope Sci. 2017, 54, 1–106. [Google Scholar]
- Schläpfer. Kosten und Finanzierung der Landwirtschaft 2018, Vision Landwirtschaft, Oberwil-Lieli. 2020. Updated Figures 2020. Available online: https://zenodo.org/record/7769510 (accessed on 5 June 2023).
- Schläpfer. Kosten und Finanzierung der Landwirtschaft 2020, Methodenbericht, Version 1.0; Vision Landwirtschaft: Zürich, Switzerland, 2020. [Google Scholar] [CrossRef]
- Möhring, A.; Mack, G.; Zimmermann, A.; Mann, S.; Ferjani, A. Evaluation Versorgungssicherheitsbeiträge. Schlussbericht. Agroscope Sci. 2018, 66, 1–124. [Google Scholar]
- Frischknecht, R.; Dinkel, F.; Kägi, T.; Stettler, C.; Zschokke, M.; Braunschweig, A.; Ahmadi, M.; Itten, R.; Stucki, M. Swiss Eco-Factors 2021 According to the Ecological Scarcity Method; Federal Office of the Environment: Bern, Switzerland, 2021. [Google Scholar]
- Jungbluth, N.; Ulrich, M.; Muir, K.; Meili, C.; Bussa, M.; Solin, S. Analysis of Food and Environmental Impacts as a Scientific Basis for Swiss Dietary Recommendations; ESU-Services GmbH: Schaffhausen, Switzerland, 2022. [Google Scholar]
- ESU-Services. The ESU Background Database Based on UVEK-LCI DQRv2:2018; ESU-Services Ltd.: Schaffhausen, Switzerland, 2022; Available online: www.esu-services.ch/data/database/ (accessed on 18 April 2023).
- ESU-Services. ESU World Food LCA Database—LCI for Food Production and Consumption; Jungbluth, N., Meili, C., Bussa, M., Ulrich, M., Solin, S., Muir, K., Malinverno, N., Eberhart, M., Annaheim, J., Keller, R., et al., Eds.; ESU-Services Ltd.: Schaffhausen, Switzerland, 2022; Available online: www.esu-services.ch/data/fooddata/ (accessed on 18 April 2023).
- Bystricky, M.; Alig, M.; Nemecek, T.; Gaillard, G. Ökobilanz von Schweizer Landwirtschaftsprodukten im Vergleich zum Import. Agrar. Schweiz 2015, 6, 264–269. [Google Scholar]
- Alig, M.; Nathani, C.; Flury, C. Umweltauswirkungen einer Marktöffnung im Landwirtschaftsbereich—Analyse dreier theoretischer Handelsszenarien. Schlussbericht im Auftrag des Bundesamtes für Umwelt; Report; Treeze, Rütter Soceco and Flury Giuliani. Rüschlikon, Switzerland; Uster, Switzerland; Zürich, Switzerland. 2019. Available online: https://www.bafu.admin.ch/dam/bafu/de/dokumente/wirtschaft-konsum/externe-studien-berichte/Schlussbericht_Marktoeffnung_LW_v1.pdf.download.pdf/Schlussbericht_Marktoeffnung_LW_v1.pdf (accessed on 5 June 2023).
- Jungbluth, N.; Eggenberger, S.; Keller, R. Ökoprofil von Ernährungsstilen. Studie im Auftrag des WWF Schweiz; ESU-Services GmbH: Zürich, Switzerland, 2015; Available online: https://www.wwf.ch/sites/default/files/doc-2021-05/jungbluth-2015-Ernaehrungsstile-WWF.pdf (accessed on 5 June 2023).
- SFU. Statistische Erhebungen und Schätzungen über Landwirtschaft und Ernährung; Kapitel 4 Versorgungsbilanzen; Swiss Farmers Union: Brugg, Switzerland, 2021. [Google Scholar]
- Lobsiger, M.; Huddleston, C.; Schläpfer, F. Indirekte Kosten Unterschiedlicher Ernährungsstile in der Schweiz; Report; BSS und Kalaidos Fachhochschule Schweiz: Basel, Switzerland; Zürich, Switzerland, 2022. [Google Scholar] [CrossRef]
- ECA. Common Agricultural Policy and Climate: Half of EU Climate Spending But Farm Emissions Are Not Decreasing; Special Report 16/2021; European Court of Auditors: Luxembourg, 2021. [Google Scholar]
- Brunner, T.; Casetti, L. Kosten gesunder Ernährung. Studie der Hochschule für Agrar-, Forst- und Lebensmittelwissenschaften Abteilung Food Science, Management, im Auftrag des Bundesamtes für Lebensmittelsicherheit und Veterinärwesen (BLV); Hochschule für Agrar-, Forst- und Lebensmittelwissenschaften HAFL: Zollikofen, Switzerland, 2014. [Google Scholar]
- Gentile, E.; Loi, A.; Esposti, R.; Saguatti, A.; Gentile, M.; Aragrande, M.; Bruni, M.; Berisio, S.; Roda, F. Impact of Agricultural Subsidies on Farmers’ Willingness to Pay for Input Goods and Services; Areté, Bologna, Mandated by the Swiss State Secretariat for Economic Affairs (SECO); Swiss State Secretariat for Economic Affairs (SECO): Bern, Switzerland, 2019.
- Willett, W.; Rockström, J.; Loken, B.; Springmann, M.; Lang, T.; Vermeulen, S.; Garnett, T.; Tilman, D.; DeClerck, F.; Wood, A.; et al. Food in the Anthropocene: The EAT–Lancet Commission on Healthy Diets from Sustainable Food Systems. Lancet 2020, 393, 447–492. [Google Scholar] [CrossRef]
- Fesenfeld, L.; Mann, S.; Meier, M.; Nemecek, T.; Scharrer, B.; Bornemann, B.; Brombach, C.; Beretta, C.; Bürgi, E.; Grabs, J.; et al. Wege in die Ernährungszukunft der Schweiz-Leitfaden zu den grössten Hebeln und politischen Pfaden für ein nachhaltiges Ernährungssystem; Report; SDSN: Zürich, Switzerland, 2023; Available online: https://zenodo.org/record/7543576 (accessed on 5 June 2023).
- Sandel, M. Justice. What’s the Right Thing to Do? Penguin Books: Harlow, UK, 2010. [Google Scholar]
- Federal Council. Response 20.4176 of the Federal Council to Inquiry 20.1085. Database of Parliamentary Proceedings. 2021. Available online: https://www.parlament.ch/de/ratsbetrieb/suche-curia-vista/geschaeft?AffairId=20201085 (accessed on 8 March 2023).
- Musselli, I.; Solar, J.; Tribaldos, T.; Bürgi Bonanomi, E. Livestock Farming Act and WTO Compliance. Preferential Tariff Treatment Based on PPMs: A Case Study; Working Paper; Centre for Development and Environment (CDE), University of Bern: Bern, Switzerland, 2022. [Google Scholar]
- McDaniel, S.W.; Rylander, D.H. Strategic green marketing. J. Consum. Mark. 1993, 10, 4–10. [Google Scholar] [CrossRef]
- Bjørkdahl, K.; Syse, K.V.L. Welfare washing: Disseminating disinformation in meat marketing. Soc. Anim. 2021, 1, 1–19. [Google Scholar] [CrossRef]
- Chatelan, A.; Beer-Borst, S.; Randriamiharisoa, A.; Pasquier, J.; Blanco, J.M.; Siegenthaler, S.; Paccaud, F.; Slimani, N.; Nicolas, G.; Camenzind-Frey, E.; et al. Major differences in diet across three linguistic regions of Switzerland: Results from the first national nutrition survey menuCH. Nutrients 2017, 9, 1163. [Google Scholar] [CrossRef]
- Chen, C.; Chaudhary, A.; Mathys, A. Dietary change scenarios and implications for environmental, nutrition, human health and Economic Dimensions of Food Sustainability. Nutrients 2019, 11, 856. [Google Scholar] [CrossRef] [PubMed]
- Nemecek, T.; Dubois, D.; Huguenin-Elie, O.; Gaillard, G. Life cycle assessment of Swiss farming systems: I. Integrated and organic farming. Agric. Syst. 2011, 104, 217–232. [Google Scholar] [CrossRef]
- Meier, M.S.; Stoessel, F.; Jungbluth, N.; Juraske, R.; Schader, C.; Stolze, M. Environmental impacts of organic and conventional agricultural products—Are the differences captured by life cycle assessment? J. Environ. Manag. 2015, 149, 193–208. [Google Scholar] [CrossRef]
- Nemecek, T.; Dubois, D.; Huguenin-Elie, O.; Gaillard, G. Life cycle assessment of Swiss farming systems: II. Extensive and intensive Production. Agric. Syst. 2011, 104, 233–245. [Google Scholar] [CrossRef]
- FOS. Haushaltsbudgeterhebung 2015–2017. Kommentierte Ergebnisse und Tabellen; Federal Office of Statistics: Neuchâtel, Switzerland, 2022. [Google Scholar]
- FDHA. Eating Well and Staying Healthy. Swiss Nutrition Policy 2017–2024; Federal Department of Home Affairs: Bern, Switzerland, 2017.
Disclaimer/Publisher’s Note: The statements, opinions and data contained in all publications are solely those of the individual author(s) and contributor(s) and not of MDPI and/or the editor(s). MDPI and/or the editor(s) disclaim responsibility for any injury to people or property resulting from any ideas, methods, instructions or products referred to in the content. |
© 2023 by the authors. Licensee MDPI, Basel, Switzerland. This article is an open access article distributed under the terms and conditions of the Creative Commons Attribution (CC BY) license (https://creativecommons.org/licenses/by/4.0/).